Final Report - Vestas
87
Life Cycle Assessment Of Electricity Production from a Vestas V112 Turbine Wind Plant Final Report
Transcript of Final Report - Vestas
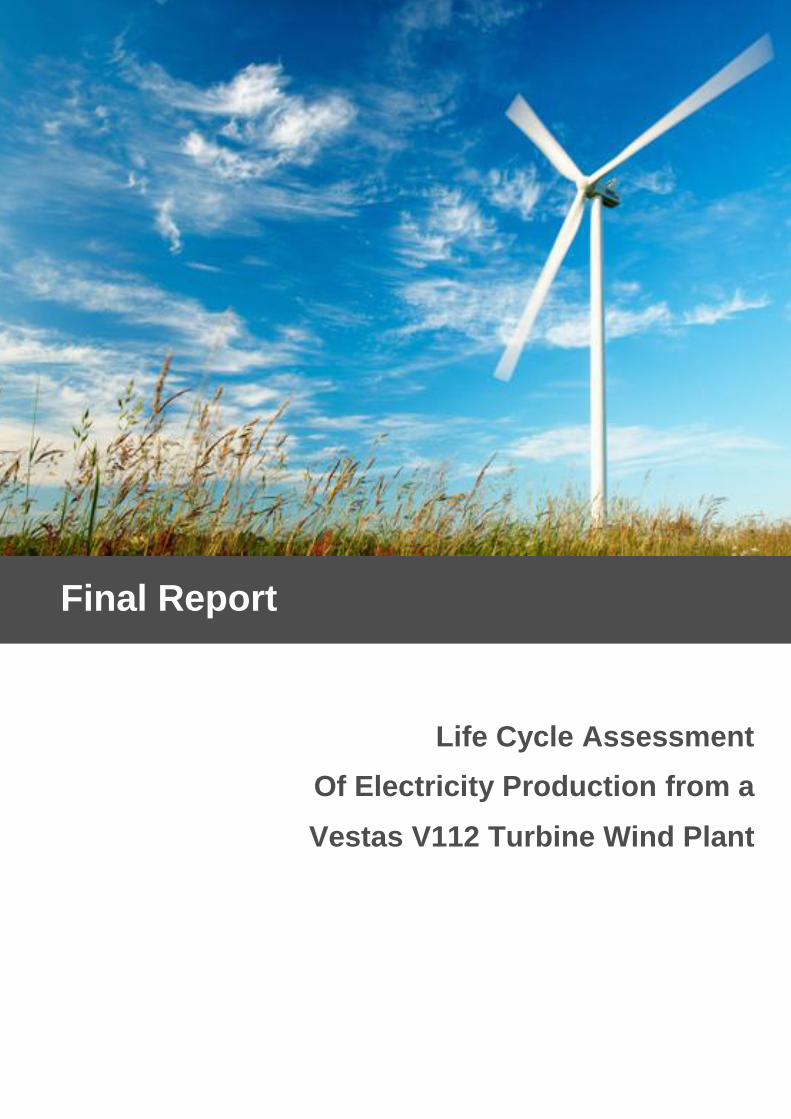
Life Cycle Assessment
Of Electricity Production from a
Vestas V112 Turbine Wind Plant
Final Report
Title of the Study: Life Cycle Assessment of Electricity Production from a
V112 Turbine Wind Plant
Client: Vestas Wind Systems A/S
Randers, Denmark
February 2011
Authors:
Neil D‘Souza
Erhi Gbegbaje-Das
Dr. Peter Shonfield
PE North West Europe ApS
Raadhusplasden 16
1550 Copenhagen V
Denmark
Phone +45 7020 3171
Fax +45 7020 3172
E-Mail [email protected]
Internet www.pe-international.com
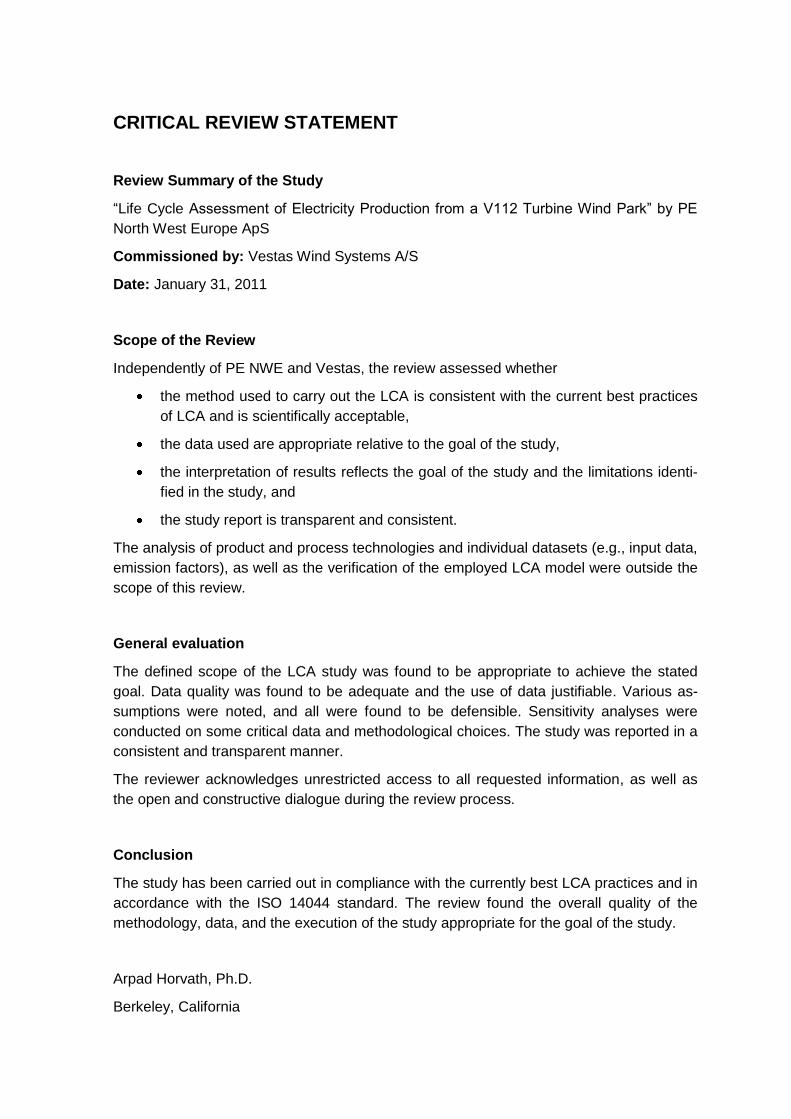
CRITICAL REVIEW STATEMENT
Review Summary of the Study
―Life Cycle Assessment of Electricity Production from a V112 Turbine Wind Park‖ by PE
North West Europe ApS
Commissioned by: Vestas Wind Systems A/S
Date: January 31, 2011
Scope of the Review
Independently of PE NWE and Vestas, the review assessed whether
the method used to carry out the LCA is consistent with the current best practices
of LCA and is scientifically acceptable,
the data used are appropriate relative to the goal of the study,
the interpretation of results reflects the goal of the study and the limitations identi-
fied in the study, and
the study report is transparent and consistent.
The analysis of product and process technologies and individual datasets (e.g., input data,
emission factors), as well as the verification of the employed LCA model were outside the
scope of this review.
General evaluation
The defined scope of the LCA study was found to be appropriate to achieve the stated
goal. Data quality was found to be adequate and the use of data justifiable. Various as-
sumptions were noted, and all were found to be defensible. Sensitivity analyses were
conducted on some critical data and methodological choices. The study was reported in a
consistent and transparent manner.
The reviewer acknowledges unrestricted access to all requested information, as well as
the open and constructive dialogue during the review process.
Conclusion
The study has been carried out in compliance with the currently best LCA practices and in
accordance with the ISO 14044 standard. The review found the overall quality of the
methodology, data, and the execution of the study appropriate for the goal of the study.
Arpad Horvath, Ph.D.
Berkeley, California
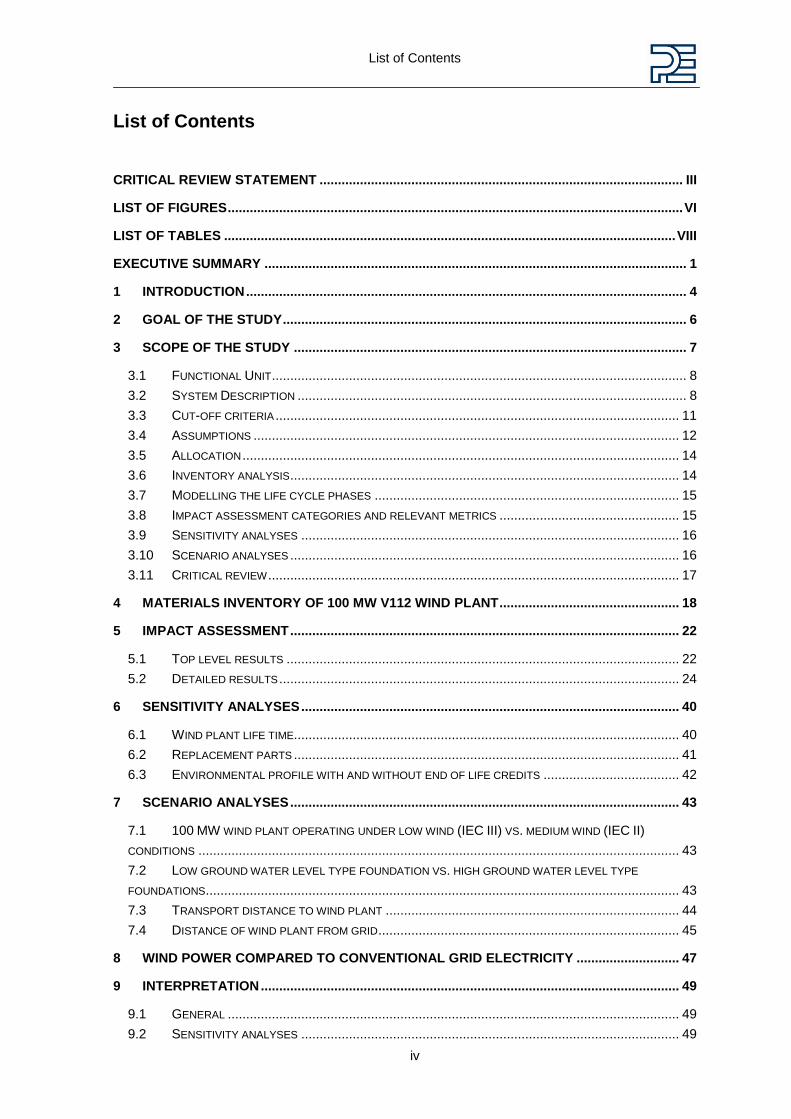
List of Contents
iv
List of Contents
CRITICAL REVIEW STATEMENT ................................................................................................... III
LIST OF FIGURES ............................................................................................................................ VI
LIST OF TABLES ........................................................................................................................... VIII
EXECUTIVE SUMMARY ................................................................................................................... 1
1 INTRODUCTION ........................................................................................................................ 4
2 GOAL OF THE STUDY .............................................................................................................. 6
3 SCOPE OF THE STUDY ........................................................................................................... 7
3.1 FUNCTIONAL UNIT ................................................................................................................. 8
3.2 SYSTEM DESCRIPTION .......................................................................................................... 8
3.3 CUT-OFF CRITERIA .............................................................................................................. 11
3.4 ASSUMPTIONS .................................................................................................................... 12
3.5 ALLOCATION ....................................................................................................................... 14
3.6 INVENTORY ANALYSIS .......................................................................................................... 14
3.7 MODELLING THE LIFE CYCLE PHASES ................................................................................... 15
3.8 IMPACT ASSESSMENT CATEGORIES AND RELEVANT METRICS ................................................. 15
3.9 SENSITIVITY ANALYSES ....................................................................................................... 16
3.10 SCENARIO ANALYSES .......................................................................................................... 16
3.11 CRITICAL REVIEW ................................................................................................................ 17
4 MATERIALS INVENTORY OF 100 MW V112 WIND PLANT ................................................. 18
5 IMPACT ASSESSMENT .......................................................................................................... 22
5.1 TOP LEVEL RESULTS ........................................................................................................... 22
5.2 DETAILED RESULTS ............................................................................................................. 24
6 SENSITIVITY ANALYSES ....................................................................................................... 40
6.1 WIND PLANT LIFE TIME......................................................................................................... 40
6.2 REPLACEMENT PARTS ......................................................................................................... 41
6.3 ENVIRONMENTAL PROFILE WITH AND WITHOUT END OF LIFE CREDITS ..................................... 42
7 SCENARIO ANALYSES .......................................................................................................... 43
7.1 100 MW WIND PLANT OPERATING UNDER LOW WIND (IEC III) VS. MEDIUM WIND (IEC II)
CONDITIONS ................................................................................................................................... 43
7.2 LOW GROUND WATER LEVEL TYPE FOUNDATION VS. HIGH GROUND WATER LEVEL TYPE
FOUNDATIONS ................................................................................................................................. 43
7.3 TRANSPORT DISTANCE TO WIND PLANT ................................................................................ 44
7.4 DISTANCE OF WIND PLANT FROM GRID .................................................................................. 45
8 WIND POWER COMPARED TO CONVENTIONAL GRID ELECTRICITY ............................ 47
9 INTERPRETATION .................................................................................................................. 49
9.1 GENERAL ........................................................................................................................... 49
9.2 SENSITIVITY ANALYSES ....................................................................................................... 49
List of Contents
v
9.3 SCENARIO ANALYSES .......................................................................................................... 49
9.4 ROBUSTNESS OF RESULTS .................................................................................................. 50
10 LITERATURE ........................................................................................................................... 52
Supplement A Description of result parameters ................................................................ 53
Supplement B General description of wind plant components .......................................... 62
Supplement C Manufacturing Processes .......................................................................... 67
Supplement D Data quality evaluation .............................................................................. 69
Supplement E Wind Turbine Classes and Wind Conditions ............................................. 70
Supplement F Uncertainties in Life Cycle Assessments ................................................... 71
Supplement G Life cycle inventory .................................................................................... 72

List of Contents
vi
List of Figures
Figure 1: Life cycle of a wind turbine .................................................................................................. 4
Figure 2: Scope of V112 100 MW wind plant LCA ............................................................................. 7
Figure 3: Scope of the use phase ...................................................................................................... 8
Figure 4: Life cycle stages of a typical onshore wind plant including typical activities in each
stage .................................................................................................................... 9
Figure 5: Contribution of wind plant components to impact categories ........................................... 23
Figure 6: Contribution from each life cycle stage towards ADP elements ....................................... 24
Figure 7: Contribution from each life cycle stage towards ADP fossils ............................................ 25
Figure 8: Contribution from each life cycle stage towards AP ......................................................... 26
Figure 9: Contribution from each life cycle stage towards EP ......................................................... 27
Figure 10: Contribution from each life cycle stage towards FAETP ................................................. 28
Figure 11: Contribution from each life cycle stage towards GWP .................................................... 29
Figure 12: Contribution from each life cycle stage towards HTP ..................................................... 30
Figure 13: Contribution from each life cycle stage towards MAETP ................................................ 31
Figure 14: Contribution from each life cycle stage towards POCP .................................................. 32
Figure 15: Contribution from each life cycle stage towards primary energy (renewables) .............. 33
Figure 16: Contribution from each life cycle stage towards primary energy (non renewable) ......... 34
Figure 17: Contribution from each life cycle stage towards TETP ................................................... 35
Figure 18: Contribution from each life cycle stage towards USEtox ................................................ 36
Figure 19: Contribution from each life cycle stage towards waste to landfill ................................... 37
Figure 20: Contribution from each life cycle stage towards water consumption .............................. 38
Figure 21: A comparison of the effects of doubling replacement parts used over the life of the
wind plant ........................................................................................................... 41
Figure 22: A comparison of the effects of discounting the effects of recycling wind plant
components at end of life .................................................................................. 42
Figure 23: A comparison of the effects of using low ground water level type foundations of
high ground water level type foundations .......................................................... 43
Figure 24: A comparison of the effects of doubling all transport distances considered in the
scope of the LCA study ..................................................................................... 44
Figure 25: A comparison of the effects of doubling the distance of the wind plant to an
existing power grid ............................................................................................. 45
Figure 26: Greenhouse effect (KREISSIG & KÜMMEL 1999) ............................................................... 54
Figure 27: AcidifiFigure 27: Acidification Potential (KREISSIG & KÜMMEL 1999) ................................ 55
Figure 28: Eutrophication Potential (KREISSIG & KÜMMEL 1999) ....................................................... 55
List of Contents
vii
Figure 29: Photochemical Ozone Creation Potential (KREISSIG & KÜMMEL 1999) ............................ 56
Figure 30: Ozone Depletion Potential (KREISSIG & KÜMMEL 1999) ................................................... 57
Figure 31: Human Toxicity Potential (IKP 2003) .............................................................................. 59
Figure 32: Terrestrial Eco-Toxicity Potential (IKP 2003) .................................................................. 59
Figure 33: Marine Aquatic Eco-Toxicity Potential (IKP 2003) .......................................................... 59
Figure 34: USEtox framework for comparative ecotoxicity assessment [UNEP-SETAC 2008]....... 60
Figure 35: V112 3.0 MW Nacelle ..................................................................................................... 62
Figure 36: V112 wind turbine blade.................................................................................................. 64
Figure 37: Bottom section of tower for V112 3.0 MW Turbine ......................................................... 65
List of Contents
viii
List of Tables
Table 1: End of life treatment of turbine components not already mentioned in the text ................. 12
Table 2: Transport of wind plant components to the site ................................................................. 14
Table 3: VDA material classification data for thirty-three 3.0 MW V112 wind turbines .................... 18
Table 4: VDA material classification data for foundations of the 100 MW V112 wind plant ............ 19
Table 5: VDA material classification data for internal wind plant cables of the 100 MW V112
wind plant ........................................................................................................... 20
Table 6: VDA material classification data for the 100 MW V112 wind plant power
transmission cables (connection to grid) ........................................................... 20
Table 7: VDA material classification data for the 100 MW V112 wind plant transformer................. 21
Table 8: Top level results for the life cycle impact assessment ....................................................... 22
Table 9: Recyclability of the major assemblies of the V112 wind turbine ........................................ 39
Table 10: Breakeven point for primary energy and GWP assessed against grid production in
different regions (wind plant operating in medium wind conditions).................. 47
Table 11: Breakeven point for primary energy and GWP assessed against grid production in
different regions (wind plant operating in low wind conditions) ......................... 47
Table 12: Vestas manufacturing location and other sites ................................................................ 67
Table 13: Data quality evaluation matrix .......................................................................................... 69
Table 14: Data quality evaluation results ......................................................................................... 69
Table 15: Wind turbine classes ........................................................................................................ 70
Table 16: LCI data for 1 kWh of wind power production (including recycling credit) ....................... 72
Nomenclature
ix
Nomenclature
Abbreviation Explanation
AP Acidification Potential
ADPelements Abiotic Resource Depletion (ADP elements)
ADPfossil Abiotic Resource Depletion (ADP fossils)
BOM Bill Of Materials
CNC Computer Numerical Control
EP Eutrophication Potential
EPD Environmental Product Declaration
FAETP Freshwater Aquatic Ecotoxicity Potential
GWP Global Warming Potential
HTP Human Toxicity Potential
IEC International Electrotechnical Commission
ISO International Organization for Standardization
KPI Key Performance Indicator
LCA Life Cycle Assessment
LCI Life Cycle Inventory
LCIA Life Cycle Impact Assessment
MAETP Marine Aquatic Ecotoxicity Potential
MVA Mega Volt Ampere
PEX Polyethylene, Cross-linked
POCP Photochemical Ozone Creation Potential
ODP Ozone Depletion Potential
TDS Technical Data Sheet
TETP Terrestrial Ecotoxicity Potential
TPS Technical Product Specification

1
Executive Summary
Goal
The goal of this study was to evaluate the potential environmental impacts associated with
production of electricity from a 100 MW onshore wind plant comprised of thirty-three V112
3.0 MW wind turbines from a life cycle perspective. The LCA study and this report have
been prepared by PE International on behalf of Vestas Wind Systems A/S. Vestas has
carried out several previous LCA studies on their wind turbines but this current study
marks a step-change in detail and complexity – modelling products down to the level of
individual components. It is intended that the models developed for this study will be used
to create a definitive framework for future LCA studies.
Functional Unit
The Vestas V112 3.0 MW wind turbine has been designed to operate under low to me-
dium wind conditions (IEC II and III) and for this study, medium wind conditions have been
selected as the baseline scenario, as Vestas predicts medium wind sites to be the main
world market.
The functional unit for this LCA study is defined as:
1 kWh of electricity delivered to the grid by a wind power plant operating under medium
wind conditions (IEC II).
Results
Overall, the results show that for every impact category assessed the largest impacts are
associated with the raw material production and manufacturing phase of the life cycle. In
most cases these are much greater than those occurring elsewhere in the life cycle of the
wind plant.
Within the manufacturing stage, the production of the tower itself typically accounts for the
largest impacts; this reflects the large quantity of steel required to produce this part of the
wind turbine. The production of the gear and mainshaft and the nacelle also results in sig-
nificant impacts. Manufacture of the blades for the turbine also has quite significant im-
pacts, while production of other parts of the wind turbine is generally less important in
comparison.
End of life processes are also significant for many impact categories and normally credit
the product system – showing the benefits of the high overall recycling rate achieved for
wind plant infrastructure.
Wind plant construction and site operations generally do not make a significant contribu-
tion to the overall life cycle impacts of the wind plant.
Transport of wind plant components to site make a very insignificant contribution to the
overall life cycle impacts of the wind plant
The top level results of the assessment are given in the table below.

2
Top level results for the life cycle impact assessment
Impact Category Unit Impact/kWh of
electricity
Abiotic resource depletion (ADP elements) mg Sb eq. 0.45
Abiotic resource depletion (ADP fossils) MJ 0.08
Acidification potential (AP) mg SO2 eq. 28
Eutrophication potential (EP) mg PO4- eq. 2.7
Freshwater aquatic ecotoxicity potential (FAETP) mg DCB eq 33.5
Global warming potential (GWP) g CO2 eq. 7
Human toxicity potential (HTP) mg DCB eq. 833
Marine aquatic ecotoxicity potential (MAETP) g DCB eq. 2546
Photochemical ozone creation potential (POCP) mg C2H4 eq. 6.3
Primary energy (renewable) (net calorific value) MJ 0.03
Primary energy (non-renewable) (net calorific value) MJ 0.09
Terrestrial ecotoxicity potential (TETP) mg DCB-Equiv 29
USEtox2008 ecotoxicity PAF cm3.day 16
Waste to landfill g 4.9
Water consumption g 27.7
Recyclability (average over components of V112 wind turbine), % 80.9
Sensitivity analyses
The sensitivity analyses show that assumptions on the lifetime of the wind plant can have
a large influence on the results. Increasing the lifetime from 20 to 24 years, results in a
27% drop in all environmental impact categories. This does not account for any increased
maintenance that may be required, but a second sensitivity analysis shows that the results
are not particularly sensitive to this issue.
The recycling methodology used also plays an important role in the results. Recycling
rates for wind turbines are quite high and, as noted above, in the baseline scenario (where
credits are given for recycling) the end of life has a significant contribution to the total re-
sults. If no benefit is given for recycling, the end of life stage will have a much smaller con-
tribution and overall impacts will increase substantially as the production impacts are no
longer offset by recycling credits.
3
Scenario analyses
Wind conditions for the wind plant determine how much energy is generated over its life-
time. If the wind plant operates in low wind conditions (IEC III) then the impacts per kWh
electricity produced increases by 23% compared to medium wind conditions (IEC II). This
finding emphasises the importance of location in wind plant planning to maximise the effi-
ciency of electricity generation. The findings also reinforce the fact that any comparison
between wind power plants should only be made within a specific wind class.
Another location-dependent issue is the level of the water table, which determines the size
of the foundations required to support the wind turbines. Regions with a high water table
require more robust foundations. However, with the exception of waste to landfill, the re-
sults are not sensitive to this difference. Likewise, the transport distance of the compo-
nents from the factory to the wind plant site is shown to have very little impact on the
overall results.
The location of the wind plant with respect to the local grid infrastructure plays a more
important role as it affects distribution losses and adds additional requirement for cabling.
Doubling the distance to the grid from 50 km to 100 km typically increases impacts per
kWh by 3-5%.
4
1 Introduction
Public awareness of, and concern for, the effects of climate change and other environ-
mental impacts has dramatically increased in recent years.
As a leading international provider of wind energy technology, Vestas Wind Systems is
well-placed to contribute towards the global drive to mitigate the effects of climate change
and environmental impacts associated with the use of fossil fuels. As part of their own
internal sustainability agenda, Vestas has previously conducted a number of life cycle
assessment (LCA) studies of their wind turbines. Seeking to build on the experience
gained from these studies and further develop their internal capacity on sustainability is-
sues, Vestas has contracted PE to carry out a LCA of a 100 MW wind plant composed of
the new Vestas 3.0 MW V112 wind turbines.
LCA addresses the environmental aspects and potential environmental impacts (e.g. use
of resources and environmental consequences of releases) throughout a product‘s life
cycle from raw material acquisition through production, use, end-of-life treatment recycling
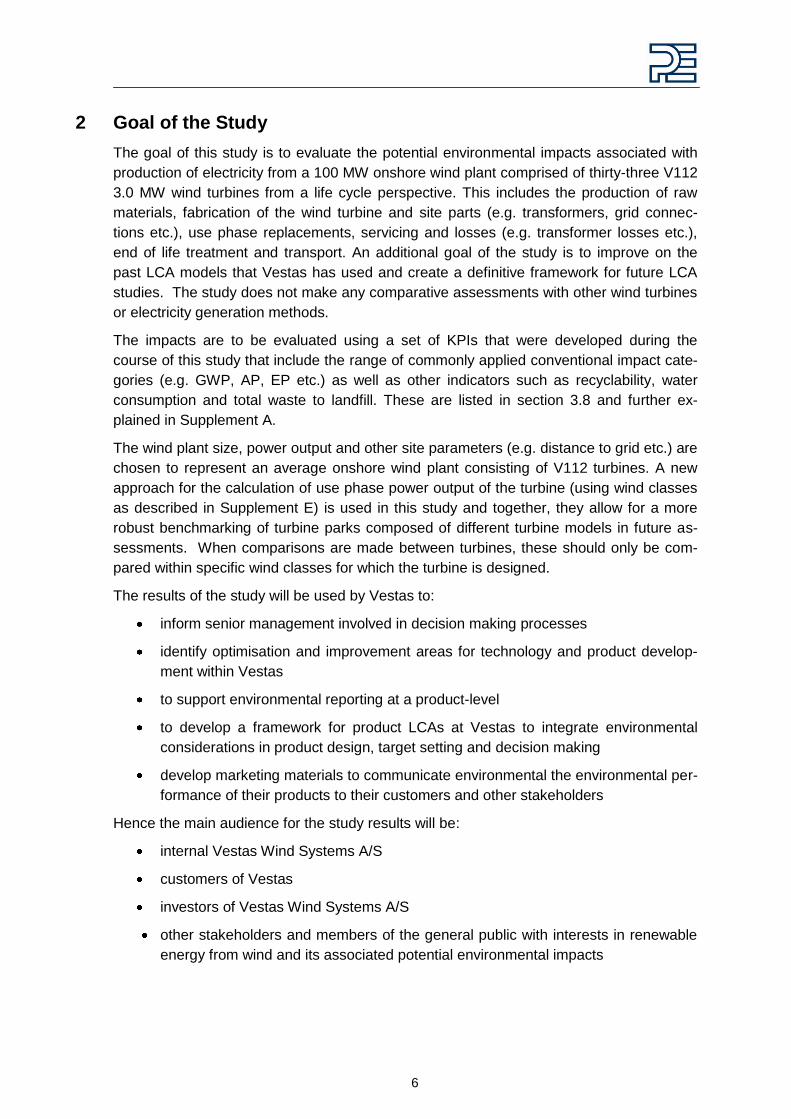
and final disposal (i.e. cradle-to grave) as shown in Figure 1.
Figure 1: Life cycle of a wind turbine
Although LCA often is a comprehensive exercise – as is also the case for the present LCA
– in general it cannot stand alone in the assessment of technologies. Other environmental
management techniques including risk assessment, environmental performance evalua-
tion and environmental impact assessment are valuable supplementary tools in address-
ing other types of environmental aspects (e.g. noise and impacts on fauna). Likewise,
other tools may be used to address social and economic aspects that are not included in
environmental LCA.
According to the International Organization for Standardization (ISO) 14040/44 standards,
an LCA study consists of four phases: (1) goal and scope (framework and objective of the
study); (2) life cycle inventory (input/output analysis of mass and energy flows from opera-
tions along the product‘s value chain); (3) life cycle impact assessment (evaluation of en-
5
vironmental relevance, e.g. global warming potential); and (4) interpretation (e.g. optimisa-
tion potential) (ISO 14040: 2006, ISO 14044: 2006).
The goal and scope stage outlines the rationale of the study, the anticipated use of the
results of the study, the boundary conditions, the data requirements and the assumptions
made to analyse the product system under consideration, and other similar technical
specifications for the study. The goal of the study is to answer the specific questions that
have been raised by the target audience and the stakeholders involved, while considering
potential uses of the study‘s results. The scope of the study defines the system‘s bound-
ary in terms of technological, geographical, and temporal coverage of the study, attributes
of the product system, and the level of detail and the complexity addressed by the study.
The life cycle inventory (LCI) stage qualitatively and quantitatively analyses the materials
and energy used (inputs) as well as the products and by-products generated and the envi-
ronmental releases in terms of non-retained emissions to specified environmental com-
partments and the wastes to be treated (outputs) for the product system being studied.
The LCI data can be used on its own to: understand total emissions, wastes and re-
source-use associated with the material or the product being studied; improve production
or product performance; or be further analysed and interpreted to provide insights into the
potential environmental impacts from the system (life cycle impact assessment and inter-
pretation, LCIA).
Vestas has previously carried out a life cycle assessment of another 3.0 MW wind turbine,
the Vestas V90 model. However, the V90 turbine is designed to operate on sites with high
wind conditions; whereas the V112 turbine is designed to operate on sites with medium
and low wind conditions (Vestas estimates that 75% of the world‘s wind resources are at
medium and low wind sites). Thus, the V112 turbine should not be benchmarked against
the V90 turbine on a high wind site, but rather a turbine in a similar wind class. The clas-
sification for wind is specified by the DS/EN 61400-1:2005 for wind turbines, which speci-
fies low, medium and high wind class designations (refer to Supplement E for more details
on wind classes).
With PE‘s support, Vestas intends to use this current study as the baseline for future LCA
studies as well as for defining key performance indicators (KPIs) for the measurement and
monitoring of wind turbine performance from a life cycle perspective and to enable and
help integrate the environmental dimension in product design, target setting and decision
making.
This report describes the outcomes of the V112 LCA study including a description of the
goal and scope, data, assumptions, methodologies, results and interpretation.
This study complies with the requirements of the ISO standards for LCA [ISO 14040:
2006, ISO 14044: 2006] and has undergone an external peer review to assure the robust-
ness and credibility of the results.
6
2 Goal of the Study
The goal of this study is to evaluate the potential environmental impacts associated with
production of electricity from a 100 MW onshore wind plant comprised of thirty-three V112
3.0 MW wind turbines from a life cycle perspective. This includes the production of raw
materials, fabrication of the wind turbine and site parts (e.g. transformers, grid connec-
tions etc.), use phase replacements, servicing and losses (e.g. transformer losses etc.),
end of life treatment and transport. An additional goal of the study is to improve on the
past LCA models that Vestas has used and create a definitive framework for future LCA
studies. The study does not make any comparative assessments with other wind turbines
or electricity generation methods.
The impacts are to be evaluated using a set of KPIs that were developed during the
course of this study that include the range of commonly applied conventional impact cate-
gories (e.g. GWP, AP, EP etc.) as well as other indicators such as recyclability, water
consumption and total waste to landfill. These are listed in section 3.8 and further ex-
plained in Supplement A.
The wind plant size, power output and other site parameters (e.g. distance to grid etc.) are
chosen to represent an average onshore wind plant consisting of V112 turbines. A new
approach for the calculation of use phase power output of the turbine (using wind classes
as described in Supplement E) is used in this study and together, they allow for a more
robust benchmarking of turbine parks composed of different turbine models in future as-
sessments. When comparisons are made between turbines, these should only be com-
pared within specific wind classes for which the turbine is designed.
The results of the study will be used by Vestas to:
inform senior management involved in decision making processes
identify optimisation and improvement areas for technology and product develop-
ment within Vestas
to support environmental reporting at a product-level
to develop a framework for product LCAs at Vestas to integrate environmental
considerations in product design, target setting and decision making
develop marketing materials to communicate environmental the environmental per-
formance of their products to their customers and other stakeholders
Hence the main audience for the study results will be:
internal Vestas Wind Systems A/S
customers of Vestas
investors of Vestas Wind Systems A/S
other stakeholders and members of the general public with interests in renewable
energy from wind and its associated potential environmental impacts
7
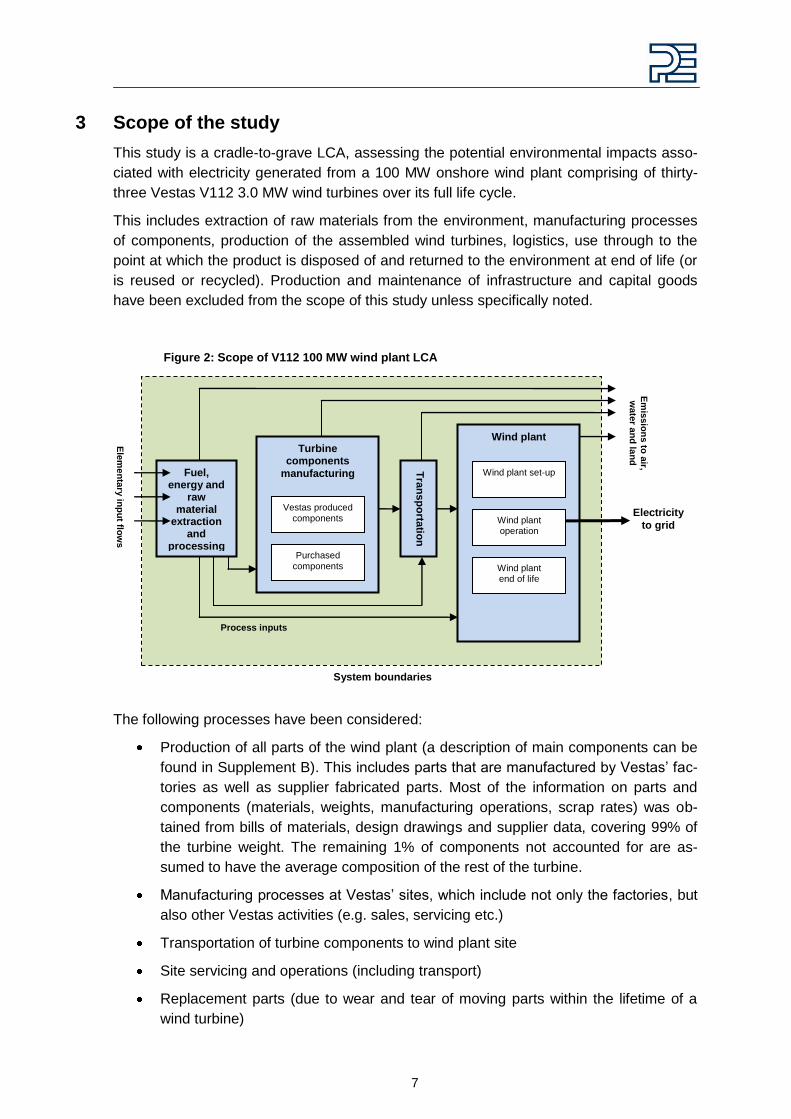
3 Scope of the study
This study is a cradle-to-grave LCA, assessing the potential environmental impacts asso-
ciated with electricity generated from a 100 MW onshore wind plant comprising of thirty-
three Vestas V112 3.0 MW wind turbines over its full life cycle.
This includes extraction of raw materials from the environment, manufacturing processes
of components, production of the assembled wind turbines, logistics, use through to the
point at which the product is disposed of and returned to the environment at end of life (or
is reused or recycled). Production and maintenance of infrastructure and capital goods
have been excluded from the scope of this study unless specifically noted.
Figure 2: Scope of V112 100 MW wind plant LCA
The following processes have been considered:
Production of all parts of the wind plant (a description of main components can be
found in Supplement B). This includes parts that are manufactured by Vestas‘ fac-
tories as well as supplier fabricated parts. Most of the information on parts and
components (materials, weights, manufacturing operations, scrap rates) was ob-
tained from bills of materials, design drawings and supplier data, covering 99% of
the turbine weight. The remaining 1% of components not accounted for are as-
sumed to have the average composition of the rest of the turbine.
Manufacturing processes at Vestas‘ sites, which include not only the factories, but
also other Vestas activities (e.g. sales, servicing etc.)
Transportation of turbine components to wind plant site
Site servicing and operations (including transport)
Replacement parts (due to wear and tear of moving parts within the lifetime of a
wind turbine)
Fuel, energy and
raw material
extraction and
processing
Tra
ns
po
rtatio
n
Turbine components
manufacturing
Vestas produced
components
Purchased components
Em
issio
ns to
air,
wate
r an
d la
nd
Process inputs
Ele
me
nta
ry in
pu
t flow
s
Wind plant
Wind plant set-up
Wind plant end of life
Wind plant operation
Electricity
to grid
System boundaries
8
Use phase power production including wind turbine availability (the capability of
the turbine to operate when wind is blowing), wake losses (arising from the de-
creased wind power generation capacity of wind a certain distance downwind of a
turbine in its wake) and transmission losses.
End of life treatment of turbines
3.1 Functional Unit
It is important to be able to compare the potential environmental impacts associated with
electricity from a wind plant using specific turbines with other forms of electricity genera-
tion. However with wind power, the wind conditions on site are additional considerations
that contribute significantly to the power generation.
The Vestas V112 3.0 MW wind turbine has been designed to operate under low to me-
dium wind conditions (IEC II and III) and for this study, medium wind conditions have been
selected as the baseline scenario, as Vestas predicts medium wind sites to be the main
world market. The effects of low wind conditions are addressed in the scenario analysis in
section 7 of this report.
The functional unit for this LCA study is defined as:
1 kWh of electricity delivered to the grid by a wind turbine plant operating under medium
wind conditions (IEC II).
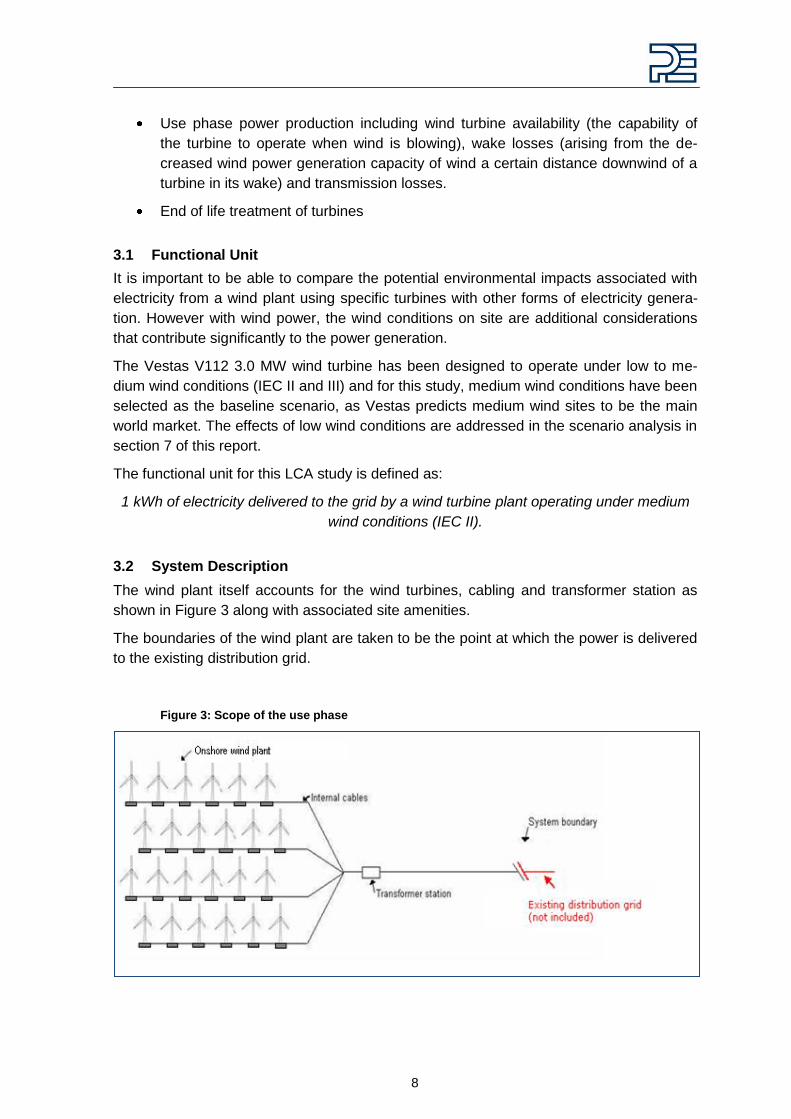
3.2 System Description
The wind plant itself accounts for the wind turbines, cabling and transformer station as
shown in Figure 3 along with associated site amenities.
The boundaries of the wind plant are taken to be the point at which the power is delivered
to the existing distribution grid.
Figure 3: Scope of the use phase
9
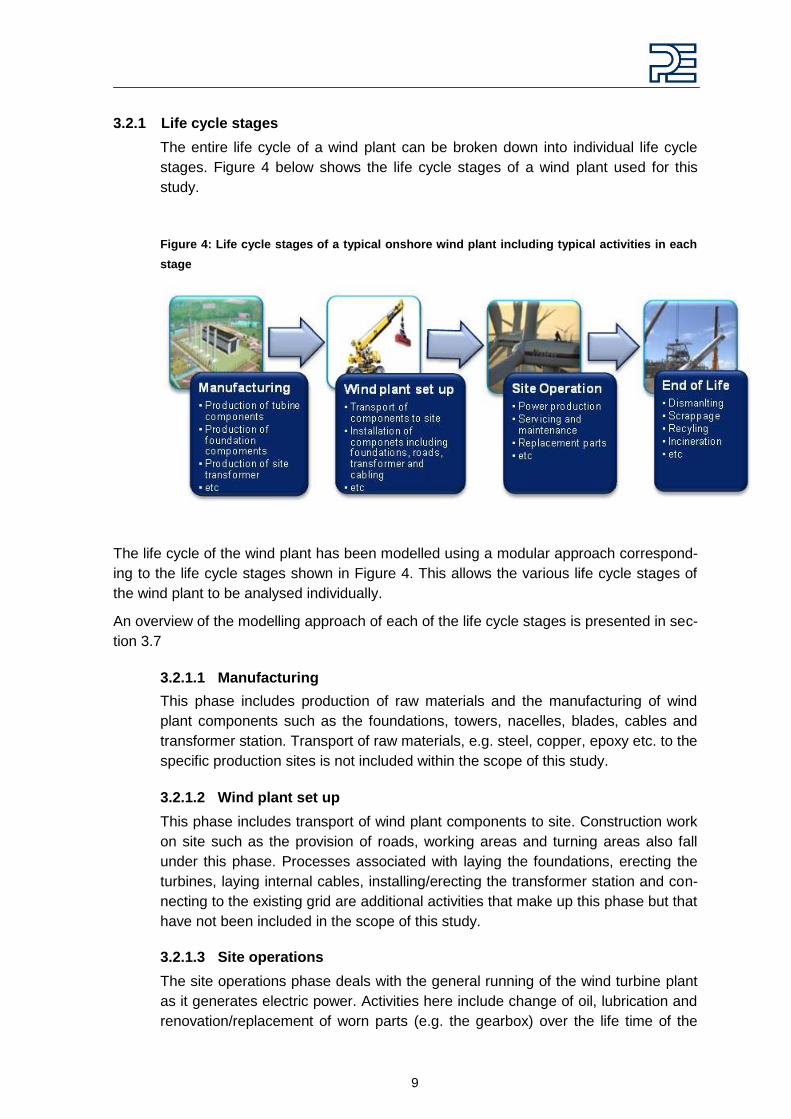
3.2.1 Life cycle stages
The entire life cycle of a wind plant can be broken down into individual life cycle
stages. Figure 4 below shows the life cycle stages of a wind plant used for this
study.
Figure 4: Life cycle stages of a typical onshore wind plant including typical activities in each
stage
The life cycle of the wind plant has been modelled using a modular approach correspond-
ing to the life cycle stages shown in Figure 4. This allows the various life cycle stages of
the wind plant to be analysed individually.
An overview of the modelling approach of each of the life cycle stages is presented in sec-
tion 3.7
3.2.1.1 Manufacturing
This phase includes production of raw materials and the manufacturing of wind
plant components such as the foundations, towers, nacelles, blades, cables and
transformer station. Transport of raw materials, e.g. steel, copper, epoxy etc. to the
specific production sites is not included within the scope of this study.
3.2.1.2 Wind plant set up
This phase includes transport of wind plant components to site. Construction work
on site such as the provision of roads, working areas and turning areas also fall
under this phase. Processes associated with laying the foundations, erecting the
turbines, laying internal cables, installing/erecting the transformer station and con-
necting to the existing grid are additional activities that make up this phase but that
have not been included in the scope of this study.
3.2.1.3 Site operations
The site operations phase deals with the general running of the wind turbine plant
as it generates electric power. Activities here include change of oil, lubrication and
renovation/replacement of worn parts (e.g. the gearbox) over the life time of the
10
wind plant. Transport to and from the turbines for operation and maintenance pur-
poses is included in this phase.
3.2.1.4 End of Life
At the end of its useful life the wind plant components are dismantled and the site
is remediated to the agreed state (which is usually specified as a condition of ob-
taining planning permission and may vary from site to site). Final waste manage-
ment of materials is also considered in this phase. Waste management options in-
clude recycling, incineration with energy recovery or by deposition in landfill sites.
3.2.2 Technology coverage
This study assesses the production of the Vestas V112 3.0 MW wind turbine, transporta-
tion of components to site, erection of wind turbines/wind plant set up, site opera-
tions/maintenance as well as dismantling and scrapping of the wind plant components at
end of life. These processes have been modelled based on state-of-the-art technologies
used by Vestas.
3.2.3 Temporal coverage
The reference year for this study is 2009. Although the V112 did not go into full scale pro-
duction in 2009, this was chosen as it was the most representative year for annual
throughput of turbines.
3.2.4 Geographical coverage
For the purpose of this study an average ―virtual‖ wind plant site was chosen. The aim is
to give an overall picture of wind power production rather than model any particular loca-
tion. The actual power output is based on wind classes (described in Supplement E) while
scenario analyses have been carried out to assess the importance of transport distances
to the site and to the grid on the overall impacts. Production of the V112 turbine repre-
sents the weighted average of all Vestas production facilities globally.
3.2.5 Data collection / completeness
Primary data have been collected from Vestas and from their suppliers. These primary
data have been sourced through close co-operation with relevant functions at Vestas
within their production processes, taken from items lists, via technical drawings and from
supplier declarations in the form of TPS/TDS documents. Instances where primary data
have been used in this study are:
Materials composition of Vestas produced wind plant components
Manufacturing process for Vestas produced wind plant components e.g. casting
and machining
Utilities and materials consumption for Vestas production sites
Materials composition of larger purchased components of the wind plant e.g. the
generator, transformer, etc. (directly from suppliers)
Utilities and materials consumption for wind plant site preparation, operation and
maintenance
11
Where primary data have not been readily available from Vestas or their suppliers, secon-
dary data have been used to fill these gaps. Secondary data have also been used to ac-
count for background processes that are upstream in the supply chain. Instances where
secondary data have been used in this study are:
Power grid mix information
Production of primary materials e.g. steel, aluminium, fibre glass, plastic granu-
lates
Transport processes
Materials composition of smaller standard purchased items e.g. seals, washers,
hex-nuts, screws and bolts
Manufacturing processes for smaller standard purchased items e.g. plastics injec-
tion moulding, thread turning, stamping
End of life processes such as landfill, incineration and recycling of steel
Most secondary datasets are supplied by PE and are available on a commercial basis [PE
INTERNATIONAL 2006]. Other sources of secondary datasets include industry associations
such as the World Steel Association, Plastics Europe, Eurofer and the European Alumin-
ium Association. Details of data sources and a discussion on data quality can be found in
Supplement D.
3.3 Cut-off criteria
The following cut-off criteria were used to ensure that all relevant environmental impacts
were represented in the study:
Mass – if a flow is less than 1% of the cumulative mass of all the inputs and out-puts (depending on the type of flow) of the LCI model, it may be excluded, pro-vided its environmental relevance is not a concern.
Energy – if a flow is less than 1% of the cumulative energy of all the inputs and outputs (depending on the type of flow) of the LCI model, it may be excluded, pro-vided its environmental relevance is not a concern.
Environmental relevance – if a flow meets the above criteria for exclusion, yet is thought to potentially have a significant environmental impact, it will be included. All material flows which leave the system (emissions) and whose environmental impact is higher than 1% of the whole impact of an impact category that has been considered in the assessment, shall be included.
The sum of the neglected material flows shall not exceed 5% of total mass, energy or environmental relevance.
In actuality, approximately 99% of the total mass of materials in the V112 3.0 MW turbine
has been accounted for. These results have been scaled up 100% of the full mass of the
turbine (i.e. the 1% of components not accounted for are assumed to have the average
composition of the rest of the turbine).
12
3.4 Assumptions
3.4.1 Lifetime of Turbine
The life time of the wind plant is assumed to be 20 years. This corresponds to the design
life time of the V112 3.0 MW turbine and applies to all components of the wind plant, ex-
cept for certain replacement parts. However, as the wind turbine industry is still relatively
young (starting up in 1979, 32 years ago) the actual life time of a particular wind plant is
uncertain and some variance around this assumed 20 year figure is expected. For in-
stance, Vestas has direct knowledge of a number of its turbines exceeding the design life
time of 20 years. The effects of varying the life time of a wind plant on potential environ-
mental impacts are discussed in Section 6.
3.4.2 Materials Input
At the time that this study was carried out, it was not possible to obtain reliable data on the
degree of recycled content of materials used in the product system. As such, it has been
assumed that all materials entering the production system are sourced from virgin mate-
rial. This is a very conservative assumption as it is certain that, for example, a substantial
proportion of metal components will actually be derived from secondary sources.
3.4.3 End of Life treatment
End of life treatment of the turbine is extensive and detailed. It is assumed that the entire
turbine is ―collected‖ at the end of life. However, the entire turbine is not recycled homo-
geneously; this is further explained below.
All large metal components that are primarily mono-material (e.g. gears, transformers,
tower sections, etc.) are assumed to be 98% recycled. Cables are 95% recycled and other
parts of the turbine are treated as shown in Table 1.
Table 1: End of life treatment of turbine components not already mentioned in the text
Material Treatment
Aluminium 90% recycled + 10% landfilled
Copper 90% recycled + 10% landfilled
Steel 90% recycled + 10% landfilled
Polymers 50% incinerated + 50% landfilled
Lubricants 100% incinerated
Other waste (including concrete) 100% landfilled
This information comes from expert judgement and from data obtained from previous LCA
studies performed by Vestas. Material losses from the recycling process itself are calcu-
lated on top of these recycling rates. Full credits are given for the material recovered. This
approach is consistent with ISO 14044 and for purposes of environmental modelling, de-
cision-making, and policy discussions involving recycling of metals. The metals industry
strongly supports the closed-loop approach compared to the recycled-content approach

13
[ATHERTON, 2007]. For a more detailed description and the implications of these two ap-
proaches, please refer to the Life Cycle Assessment of Aluminum Beverage Cans for the
Aluminum Association Inc., Washington DC [PE AMERICA, 2010].
Vestas has calculated the average recyclability across the components of a V112 wind
turbine to be approximately 81%. Details of recyclability can be found in section 5.2.16
3.4.4 Sulphur hexafluoride (SF6)
The production of sulphur hexafluoride gas in the switchgear of the turbine has not been
accounted for in the study. This is justified based on expert judgement and past experi-
ence with the production of similar gases that indicates that the potential environmental
impacts associated with their production are negligible in the context of this study.
Nonetheless, sulphur hexafluoride is a very potent greenhouse gas. For the switchgear
application this usually only becomes an issue when the gas is released into the environ-
ment during a blow-out. Occurrences of blowouts are extremely rare and have not been
modelled in this study. The treatment of the gas at recycling stations is not known and
therefore it is assumed that all of the sulphur hexafluoride gas in the switchgear is re-
leased to the environment at the end of life as a worst case scenario.
3.4.5 Onboard turbine cabling
At the time of data collection for this study, it was not possible to ascertain the material
composition for all the on-board cabling within the wind turbine system. However, detailed
materials information on the high voltage cable connecting the turbine generator to the
turbine transformer was available from suppliers. These data were used as proxy data for
all the onboard cable and wiring in the wind turbine system. As a significant proportion of
the onboard cabling and wiring is expected to consist of simpler wire forms (e.g. single
plastic sheath and copper), the use of the more complicated materials composition of the
high voltage cable as a proxy is considered a worst case scenario.
3.4.6 Foundations
There are two basic kinds of foundations for onshore wind turbine towers depending on
the ground water level, as follows:
High groundwater level - indicates a (maximum) groundwater level equal to the
level of the terrain (requires more concrete and steel)
Low groundwater level – low ground water scenario
The low groundwater level case has been chosen as the base case as it is representative
of the majority of wind park sites.
3.4.7 Electrical/electronic components in turbine
Due to the complexities of the electrical/electronics sub-systems in the wind turbine sys-
tem it was not possible to obtain specific data on these components within the data collec-
tion period. PE datasets for generic signal and signal & power electronic systems were
used here as a proxy, which estimates a worst-case scenario. The use of these datasets
is extremely conservative and is most likely ―over counting‖ potential impacts but this ap-
14
proach is aligned with taking a conservative approach throughout study where assump-
tions may be required.
3.4.8 Transport
As mentioned in earlier sections of this report, transport of raw materials to production
sites have been excluded from this study. Transport steps that have been included in this
study are discussed below:
Transport associated with moving wind plant components to the site are given in
Table 2.
Table 2: Transport of wind plant components to the site
Component Transport
Nacelle 1000 km by truck
Hub 1000 km by truck
Blades 1000 km by truck
Tower 700 km by truck
Foundation 200 km by truck
Transportation of maintenance crew to and from the site during site operations is
assumed to be 900 km per turbine per year.
A scenario analysis on the transport of components to the wind plant has been carried out
to determine the significance of these activities in the context of the full life cycle.
3.5 Allocation
Wind turbines have electricity as the single appreciable output. However, since Vestas
produces several models of turbines and production data were collected at a factory level,
allocation was required to assign the correct production burdens (from the different manu-
facturing locations) to the V112 turbine. This is discussed in detail in Supplement C.
3.6 Inventory analysis
This LCA study follows an attributional approach. The life cycle inventories generated for
each product are compiled from the inputs and outputs of the component processes. All
environmentally relevant flows of energy and materials crossing the system boundaries
have been accounted for (e.g. energy, material resources, wastes and emissions). These
flows are recorded for each unit process and summarised across the entire wind plant
system.
GaBi 4 Professional LCA software and databases together with GaBi DfX have been used
to model the scenarios and generate the life cycle inventories and impact assessments on
which the study conclusions are based. This software is a state-of-the-art tool for carrying
out LCAs [GABI 2010].
15
3.7 Modelling the life cycle phases
Modelling of the lifecycle begins with a bill of materials (BOM) detailing a ―part tree‖ of the
entire turbine. Each part is associated with a material, manufacturing process and country
of origin. This can be extremely extensive – the BOM for the V112 turbine accounts for
over 50,000 parts. Modelling this many components ―conventionally‖ in GaBi is not practi-
cable. However using GaBi DfX allows this BOM to be automatically imported into the tool
where materials and manufacturing processes are mapped to life cycle inventories pro-
vided by GaBi 4.
Vestas‘ manufacturing process models are created with energy and consumables linked
to life cycle inventories (as turbine parts are already included in the BOM). Site operations
are modelled similarly.
The LCA software generates a ―product model‖ that includes all the material and energy
resources involved in the production of the turbine (including material losses from the pro-
duction processes and possible internal recycling loops).
GaBi DfX provides the opportunity to automatically disassemble the entire turbine (or
parts of it) into its source components. This allows for an extremely detailed end of life
model that can be part-specific. This feature is used for the end of life treatment of the
turbine where certain parts that can be easily dismantled are recycled with higher efficien-
cies than the rest of the turbine.
3.8 Impact assessment categories and relevant metrics
The selection of the impact categories assessed in this study is based on priority areas as
indentified in the Vestas Sustainability Strategy. The KPIs from the sustainability strategy
that have been evaluated within the context of this LCA are:
Abiotic resource depletion (ADP elements)
Abiotic resource depletion (ADP fossils)
Acidification potential (AP)
Eutrophication potential (EP)
Freshwater aquatic ecotoxicity potential (FAETP)
Global warming potential (GWP)
Human toxicity potential (HTP)
Marine aquatic ecotoxicity potential (MAETP)
Photochemical ozone creation potential (POCP)
Primary energy from renewable raw materials (net calorific value)
Primary energy from resources (net cal. value)
Terrestrial ecotoxicity potential (TETP)
USEtox2008 ecotoxicity
16
Waste to landfill
Water consumption
Recyclability
CML (2009 update) and USETox (2008) characterisation factors have been applied in this
study [GUINÈE ET AL. 2001, ROSENBAUM ET AL. 2008]. These impact indicators focus on the
so-called ―midpoints‖ of the cause-effect chain. This means that they aggregate data on
emissions (the starting points in the cause-effect chain) to potential impacts in various
categories (e.g. global warming, acidification, etc.), but do not go as far as to assess the
endpoints, such as loss of biodiversity, damage to human health, etc. caused by these
impacts. As such, the impact assessment results generated are relative expressions and
do not predict impacts on category endpoints, the exceeding of thresholds, safety margins
or risks.
These impact categories occur on different scales ranging from global (GWP), to regional
(AP) and local (POCP, EP and HTP), and the relevance of the point of emission becomes
more important as more local impacts are considered. For example, a kilogram of carbon
dioxide emitted anywhere in Denmark will give the same contribution to global warming as
a kilogram of carbon dioxide emitted anywhere else in the world, whereas for more re-
gionally confined impact categories (such as eutrophication), only emissions that occur
nearby will have a real impact. As such, results generated using these impact categories
should be considered to be worst-case potential impacts rather than actual impacts on the
environment. Further details on the impact indicators can be found in Supplement A.
No normalisation, grouping, ranking or weighting have been applied to the results.
3.9 Sensitivity analyses
Sensitivity analyses are conducted to better understand the effect and importance of un-
certainties in the data or of applying different methodologies during the modelling. The
following sensitivity analyses have been carried out in this study:
Variation in wind plant lifetime: ± 4 years
Variation in frequency of parts replacement
End of life credits: to see the impact of recycling on the life cycle, a scenario will be
presented without credits factored into the results.
3.10 Scenario analyses
Scenario analyses allow the practitioner to assess how the results of the LCA will vary if
the model is set up in different ways e.g. representing different possible operating condi-
tions. The following scenario analyses have been carried out in this study to assess the
effects that possible changes to a wind plant system will have on its environmental per-
formance over its life cycle:
Operating the 100 MW wind plant under IEC III wind conditions (low wind)
17
Varying the transport distances for components to wind plant and site mainte-
nance/operations trips
Varying the distance of the wind plant to the existing grid taking into account cor-
responding line losses
Changing the type of foundation used from low ground water level type to high
ground water level type.
3.11 Critical review
The outcomes of this LCA study are intended to support external communication. To as-
sure the rigour of the study and robustness of the results, an independent critical review of
the study has been conducted.
The goal and scope of the critical review is defined in accordance with ISO 14044, para-
graph 6.1. Following ISO 14044, the critical review process shall ensure that (ISO,
2006b):
the methods used to carry out the LCA are consistent with this International Stan-dard
the methods used to carry out the LCA are scientifically and technically valid
the data used are appropriate and reasonable in relation to the goal of the study
the interpretations reflect the limitations identified and the goal of the study
the study report is transparent and consistent
Dr. Arpad Horvath has been selected by Vestas based on his expertise in the field of sus-
tainability and his experience of reviewing technical LCA studies.
18
4 Materials Inventory of 100 MW V112 Wind Plant
The materials inventory for the entire 100 MW V112 wind plant is given in this section.
Classification is based on Germany‘s Association of the Automotive Industry (VDA) Mate-
rials Grouping; a widely accepted and established materials classification system used
across the international automotive industry. Materials for replacement parts are not in-
cluded in this analysis.
Table 3: VDA material classification data for thirty-three 3.0 MW V112 wind turbines
VDA Material Classification Amount, tonnes
Steel and iron materials
Steel and iron materials (unspecified) 8
Unalloyed, Low alloyed 6634
Highly alloyed 1442
Cast iron 2170
Lights alloys, cast and wrought alloys
Aluminium and aluminium alloys 113
Nonferrous heavy metals, cast and wrought al-
loys
Copper 160
Copper alloys 0.3
Zinc alloys 0.01
Special metals
Special metals 3000g
Polymer materials
Thermoplastics 227
Thermoplastic elastomers 12
Elastomers / elastomeric compounds 42
Duromers 88
Polymeric compounds 324
Process polymers
Lacquers 25
Adhesives, sealants 0.24
19
VDA Material Classification Amount, tonnes
Other materials and material compounds
Modified organic natural materials 5
Ceramic/ glass 792
Other materials and material compounds 100
Electronics / electrics
Electronics 34
Electrics 29
Magnet 16
Fuels and auxiliary means
Lubricants 42
Other fuels and auxiliary means 0.24
TOTAL 12263
Table 4: VDA material classification data for foundations of the 100 MW V112 wind plant
VDA Material Classification Amount, tonnes
Steel and iron materials
Steel and iron materials (unspecified) 1491
Polymer materials
Thermoplastics 3
Other materials and material compounds
Concrete and mortar 29770
TOTAL 31264

20
Table 5: VDA material classification data for internal wind plant cables of the 100 MW V112
wind plant
VDA Material Classification Amount, tonnes
Lights alloys, cast and wrought alloys
Aluminium and aluminium alloys 20
Nonferrous heavy metals, cast and wrought
alloys
Copper 12
Polymer materials
Thermoplastics 18
TOTAL 50
Table 6: VDA material classification data for the 100 MW V112 wind plant power transmission
cables (connection to grid)
VDA Material Classification Amount, tonnes
Steel and iron materials
Steel and iron materials (unspecified) 14
Lights alloys, cast and wrought alloys
Aluminium and aluminium alloys 75
TOTAL 89
21
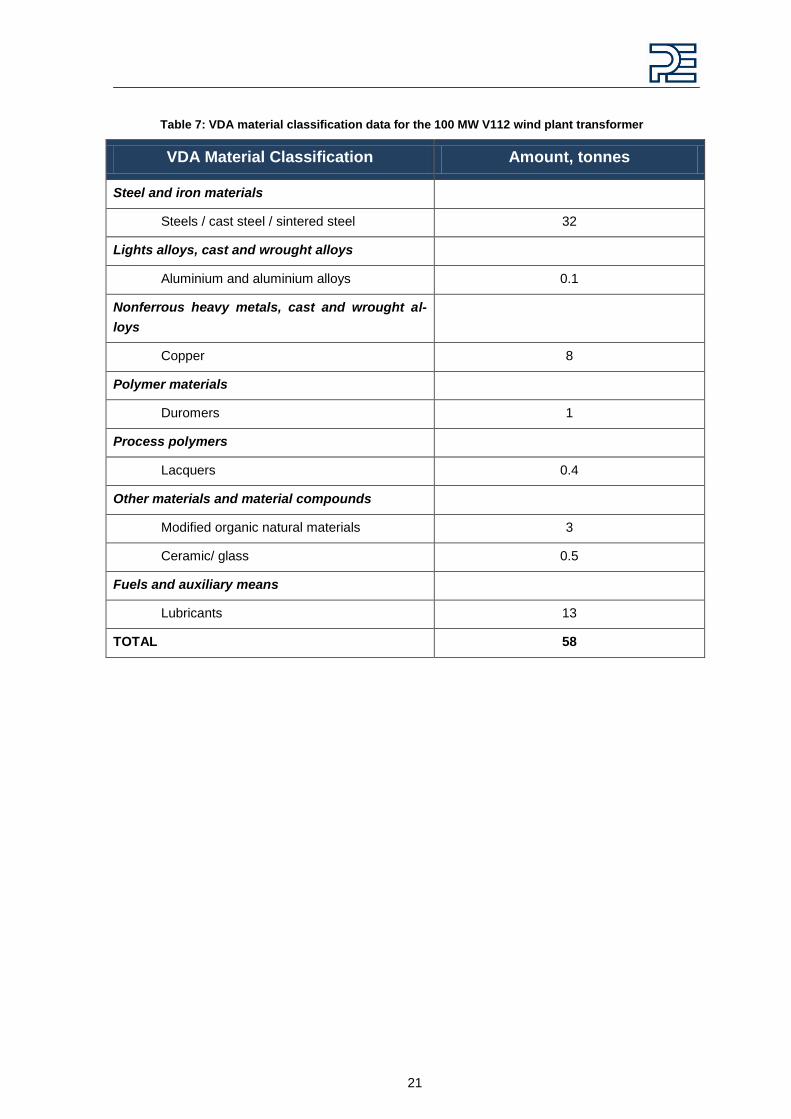
Table 7: VDA material classification data for the 100 MW V112 wind plant transformer
VDA Material Classification Amount, tonnes
Steel and iron materials
Steels / cast steel / sintered steel 32
Lights alloys, cast and wrought alloys
Aluminium and aluminium alloys 0.1
Nonferrous heavy metals, cast and wrought al-
loys
Copper 8
Polymer materials
Duromers 1
Process polymers
Lacquers 0.4
Other materials and material compounds
Modified organic natural materials 3
Ceramic/ glass 0.5
Fuels and auxiliary means
Lubricants 13
TOTAL 58
22
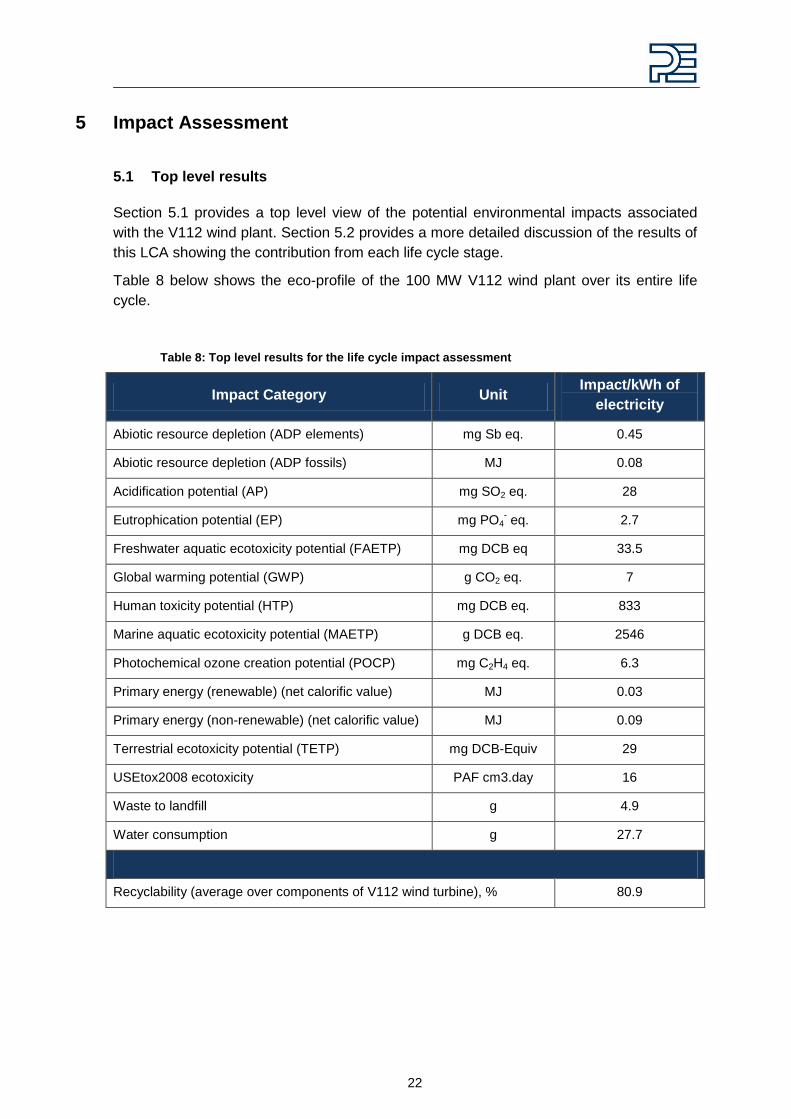
5 Impact Assessment
5.1 Top level results
Section 5.1 provides a top level view of the potential environmental impacts associated
with the V112 wind plant. Section 5.2 provides a more detailed discussion of the results of
this LCA showing the contribution from each life cycle stage.
Table 8 below shows the eco-profile of the 100 MW V112 wind plant over its entire life
cycle.
Table 8: Top level results for the life cycle impact assessment
Impact Category Unit Impact/kWh of
electricity
Abiotic resource depletion (ADP elements) mg Sb eq. 0.45
Abiotic resource depletion (ADP fossils) MJ 0.08
Acidification potential (AP) mg SO2 eq. 28
Eutrophication potential (EP) mg PO4- eq. 2.7
Freshwater aquatic ecotoxicity potential (FAETP) mg DCB eq 33.5
Global warming potential (GWP) g CO2 eq. 7
Human toxicity potential (HTP) mg DCB eq. 833
Marine aquatic ecotoxicity potential (MAETP) g DCB eq. 2546
Photochemical ozone creation potential (POCP) mg C2H4 eq. 6.3
Primary energy (renewable) (net calorific value) MJ 0.03
Primary energy (non-renewable) (net calorific value) MJ 0.09
Terrestrial ecotoxicity potential (TETP) mg DCB-Equiv 29
USEtox2008 ecotoxicity PAF cm3.day 16
Waste to landfill g 4.9
Water consumption g 27.7
Recyclability (average over components of V112 wind turbine), % 80.9
23
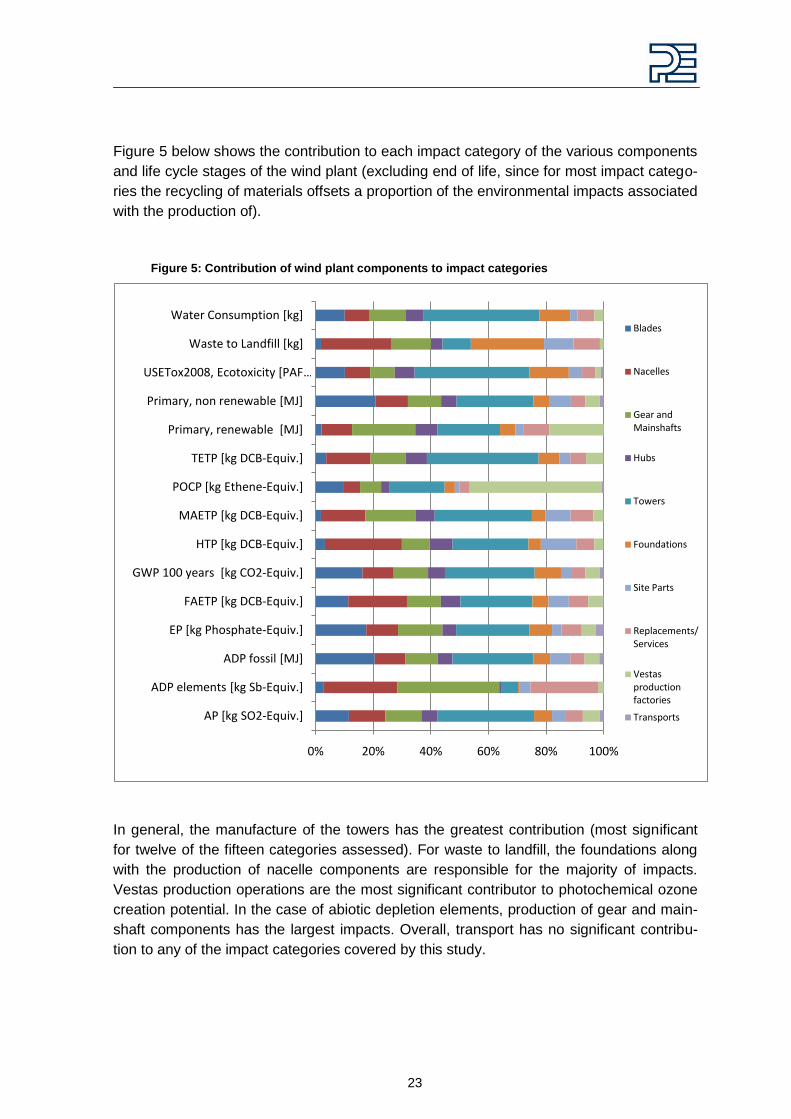
Figure 5 below shows the contribution to each impact category of the various components
and life cycle stages of the wind plant (excluding end of life, since for most impact catego-
ries the recycling of materials offsets a proportion of the environmental impacts associated
with the production of).
Figure 5: Contribution of wind plant components to impact categories
In general, the manufacture of the towers has the greatest contribution (most significant
for twelve of the fifteen categories assessed). For waste to landfill, the foundations along
with the production of nacelle components are responsible for the majority of impacts.
Vestas production operations are the most significant contributor to photochemical ozone
creation potential. In the case of abiotic depletion elements, production of gear and main-
shaft components has the largest impacts. Overall, transport has no significant contribu-
tion to any of the impact categories covered by this study.
0% 20% 40% 60% 80% 100%
AP [kg SO2-Equiv.]
ADP elements [kg Sb-Equiv.]
ADP fossil [MJ]
EP [kg Phosphate-Equiv.]
FAETP [kg DCB-Equiv.]
GWP 100 years [kg CO2-Equiv.]
HTP [kg DCB-Equiv.]
MAETP [kg DCB-Equiv.]
POCP [kg Ethene-Equiv.]
TETP [kg DCB-Equiv.]
Primary, renewable [MJ]
Primary, non renewable [MJ]
USETox2008, Ecotoxicity [PAF …
Waste to Landfill [kg]
Water Consumption [kg]Blades
Nacelles
Gear and Mainshafts
Hubs
Towers
Foundations
Site Parts
Replacements/Services
Vestas production factories
Transports
24
5.2 Detailed results
The results for each impact category assessed in this LCA study are described in detail in
the following sections. In the accompanying charts, the total impact is shown and then the
contributions from each stage in the life cycle are shown.
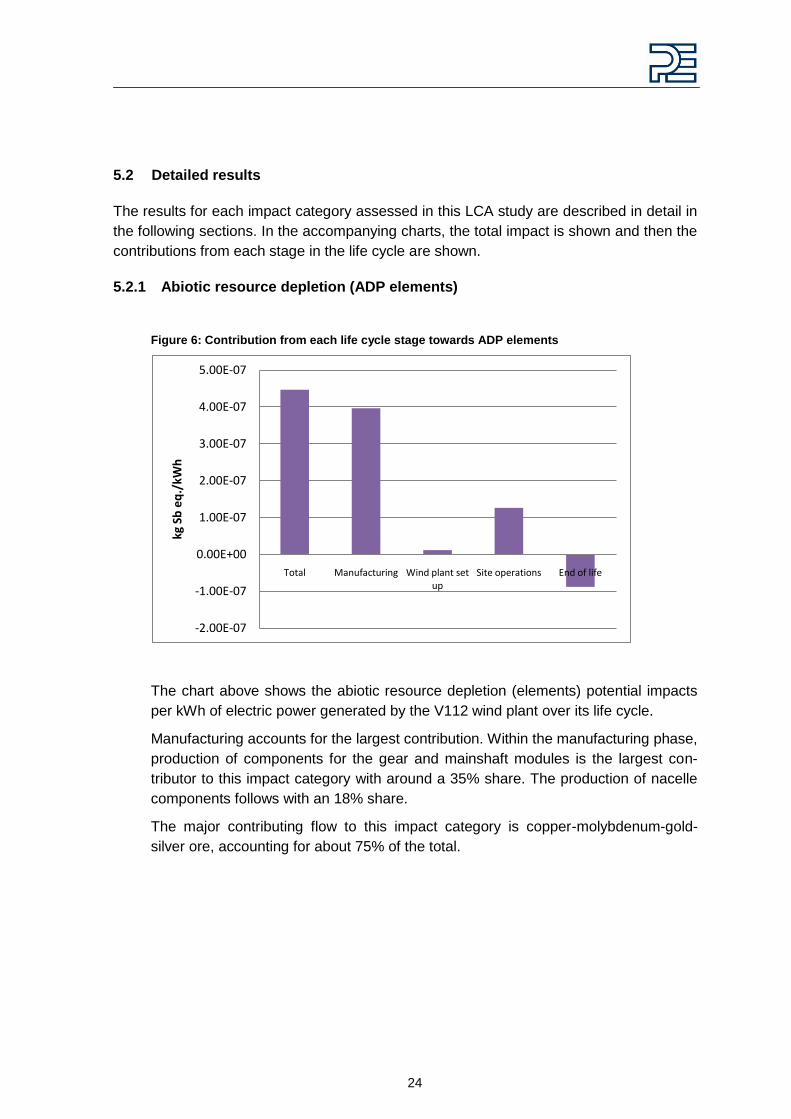
5.2.1 Abiotic resource depletion (ADP elements)
Figure 6: Contribution from each life cycle stage towards ADP elements
The chart above shows the abiotic resource depletion (elements) potential impacts
per kWh of electric power generated by the V112 wind plant over its life cycle.
Manufacturing accounts for the largest contribution. Within the manufacturing phase,
production of components for the gear and mainshaft modules is the largest con-
tributor to this impact category with around a 35% share. The production of nacelle
components follows with an 18% share.
The major contributing flow to this impact category is copper-molybdenum-gold-
silver ore, accounting for about 75% of the total.
-2.00E-07
-1.00E-07
0.00E+00
1.00E-07
2.00E-07
3.00E-07
4.00E-07
5.00E-07
Total Manufacturing Wind plant set up
Site operations End of life
kg S
b e
q./
kWh
25
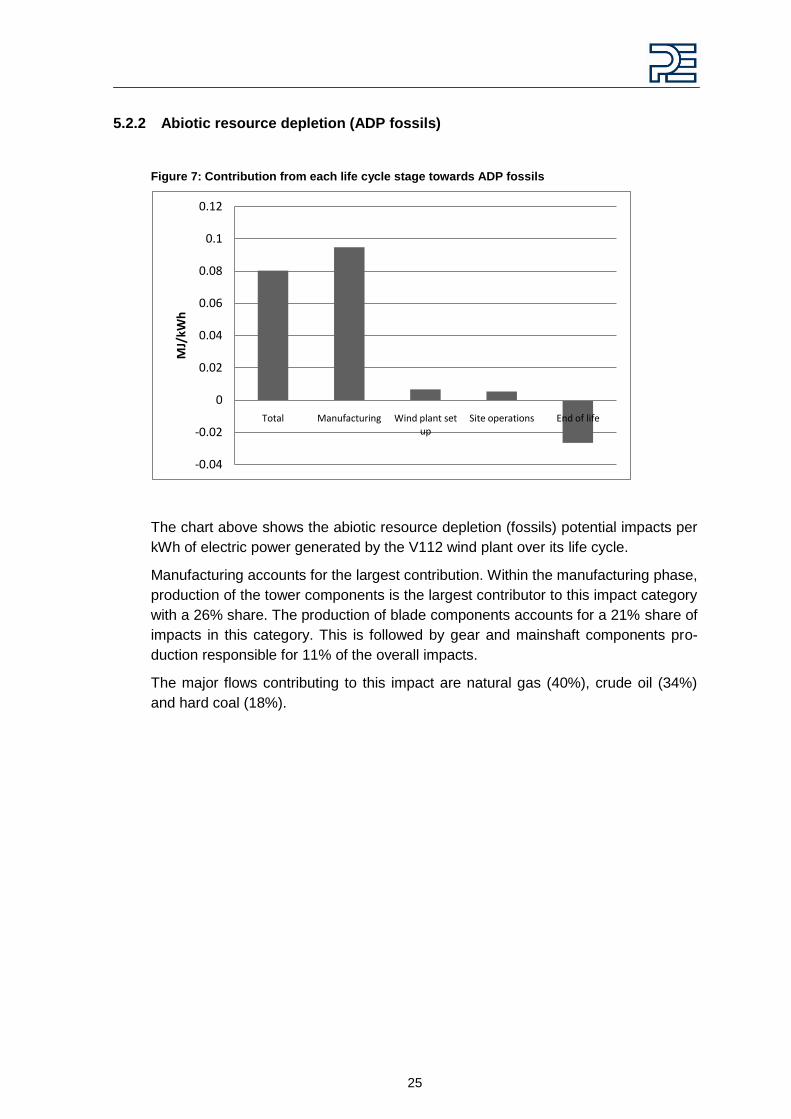
5.2.2 Abiotic resource depletion (ADP fossils)
Figure 7: Contribution from each life cycle stage towards ADP fossils
The chart above shows the abiotic resource depletion (fossils) potential impacts per
kWh of electric power generated by the V112 wind plant over its life cycle.
Manufacturing accounts for the largest contribution. Within the manufacturing phase,
production of the tower components is the largest contributor to this impact category
with a 26% share. The production of blade components accounts for a 21% share of
impacts in this category. This is followed by gear and mainshaft components pro-
duction responsible for 11% of the overall impacts.
The major flows contributing to this impact are natural gas (40%), crude oil (34%)
and hard coal (18%).
-0.04
-0.02
0
0.02
0.04
0.06
0.08
0.1
0.12
Total Manufacturing Wind plant set up
Site operations End of life
MJ/
kWh
26
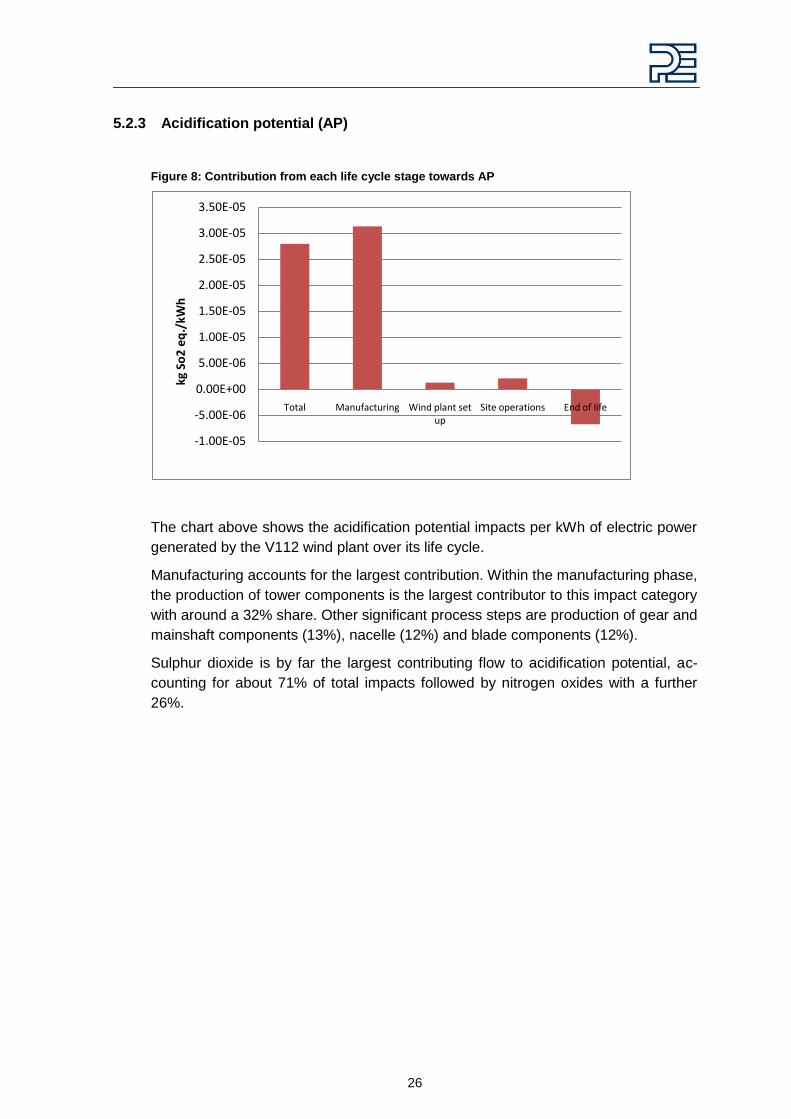
5.2.3 Acidification potential (AP)
Figure 8: Contribution from each life cycle stage towards AP
The chart above shows the acidification potential impacts per kWh of electric power
generated by the V112 wind plant over its life cycle.
Manufacturing accounts for the largest contribution. Within the manufacturing phase,
the production of tower components is the largest contributor to this impact category
with around a 32% share. Other significant process steps are production of gear and
mainshaft components (13%), nacelle (12%) and blade components (12%).
Sulphur dioxide is by far the largest contributing flow to acidification potential, ac-
counting for about 71% of total impacts followed by nitrogen oxides with a further
26%.
-1.00E-05
-5.00E-06
0.00E+00
5.00E-06
1.00E-05
1.50E-05
2.00E-05
2.50E-05
3.00E-05
3.50E-05
Total Manufacturing Wind plant set up
Site operations End of life
kg S
o2
eq
./kW
h
27
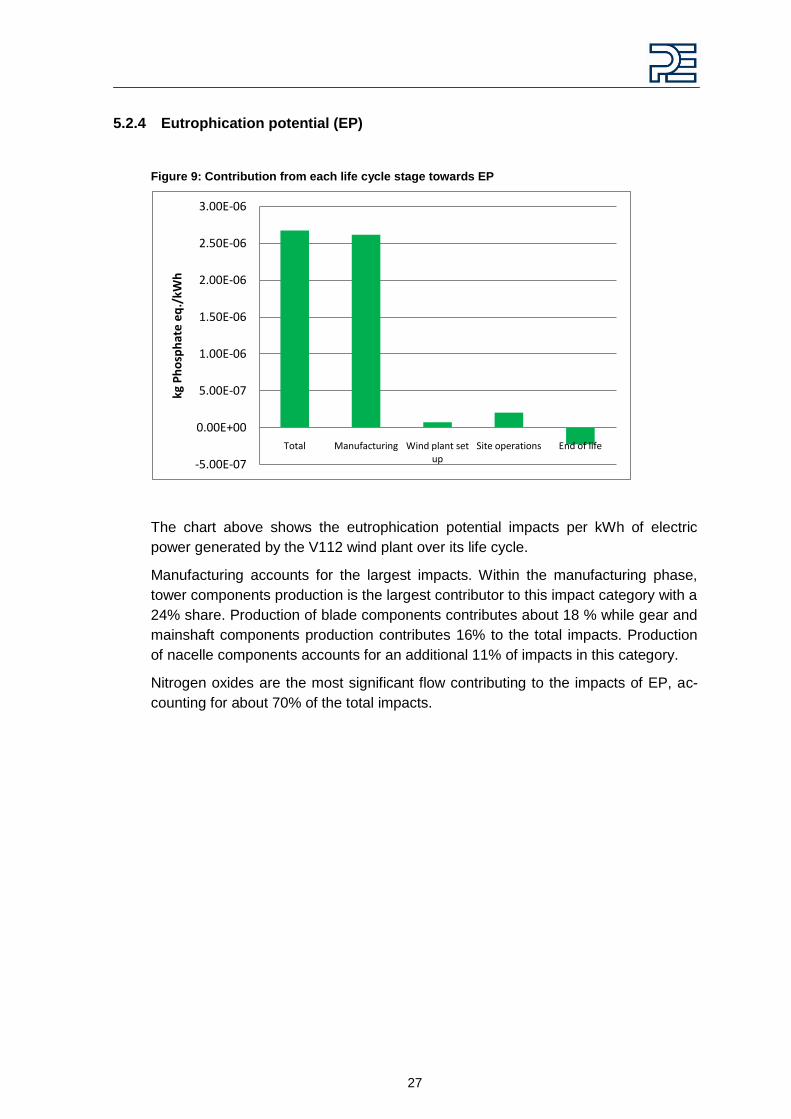
5.2.4 Eutrophication potential (EP)
Figure 9: Contribution from each life cycle stage towards EP
The chart above shows the eutrophication potential impacts per kWh of electric
power generated by the V112 wind plant over its life cycle.
Manufacturing accounts for the largest impacts. Within the manufacturing phase,
tower components production is the largest contributor to this impact category with a
24% share. Production of blade components contributes about 18 % while gear and
mainshaft components production contributes 16% to the total impacts. Production
of nacelle components accounts for an additional 11% of impacts in this category.
Nitrogen oxides are the most significant flow contributing to the impacts of EP, ac-
counting for about 70% of the total impacts.
-5.00E-07
0.00E+00
5.00E-07
1.00E-06
1.50E-06
2.00E-06
2.50E-06
3.00E-06
Total Manufacturing Wind plant set up
Site operations End of life
kg P
ho
sph
ate
eq
./kW
h
28
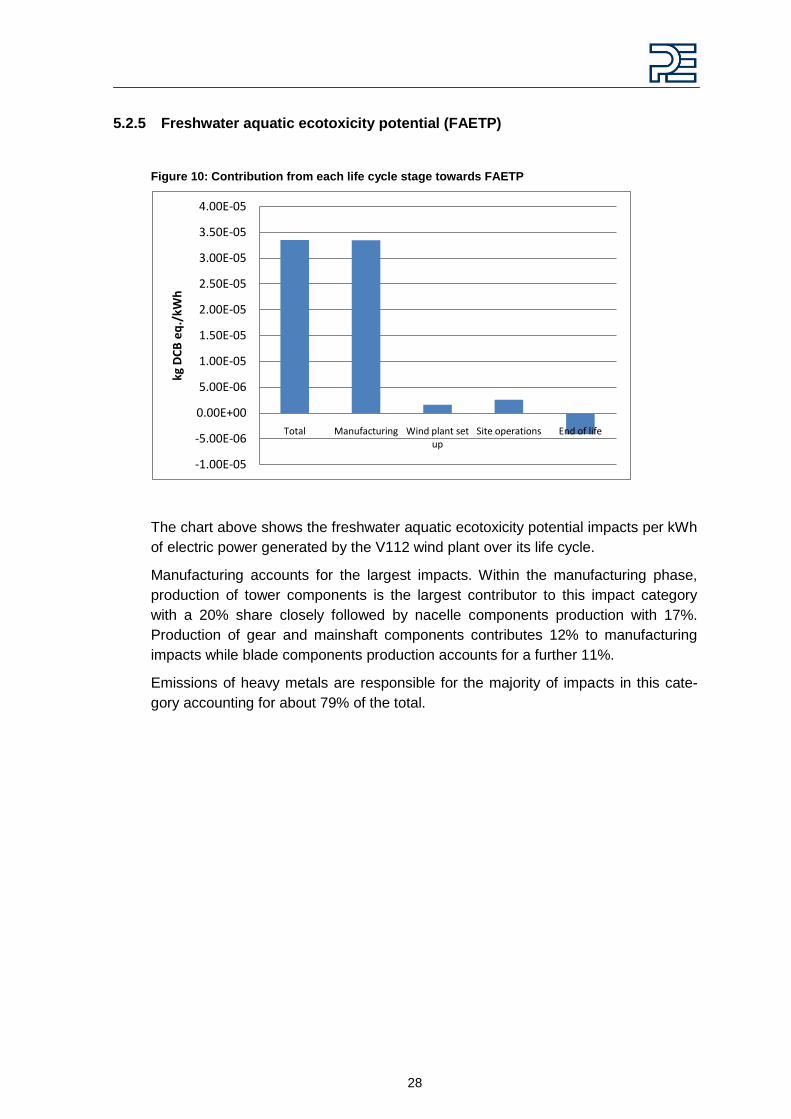
5.2.5 Freshwater aquatic ecotoxicity potential (FAETP)
Figure 10: Contribution from each life cycle stage towards FAETP
The chart above shows the freshwater aquatic ecotoxicity potential impacts per kWh
of electric power generated by the V112 wind plant over its life cycle.
Manufacturing accounts for the largest impacts. Within the manufacturing phase,
production of tower components is the largest contributor to this impact category
with a 20% share closely followed by nacelle components production with 17%.
Production of gear and mainshaft components contributes 12% to manufacturing
impacts while blade components production accounts for a further 11%.
Emissions of heavy metals are responsible for the majority of impacts in this cate-
gory accounting for about 79% of the total.
-1.00E-05
-5.00E-06
0.00E+00
5.00E-06
1.00E-05
1.50E-05
2.00E-05
2.50E-05
3.00E-05
3.50E-05
4.00E-05
Total Manufacturing Wind plant set up
Site operations End of life
kg D
CB
eq
./kW
h
29
5.2.6 Global warming potential (GWP)
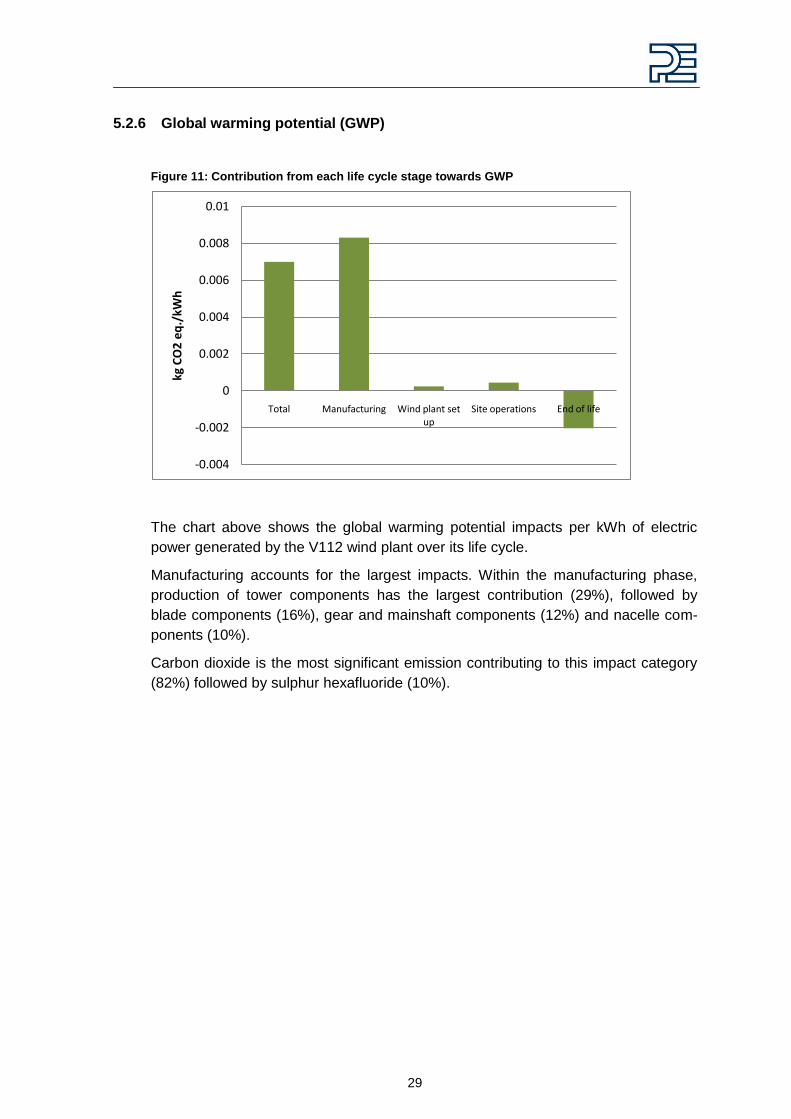
Figure 11: Contribution from each life cycle stage towards GWP
The chart above shows the global warming potential impacts per kWh of electric
power generated by the V112 wind plant over its life cycle.
Manufacturing accounts for the largest impacts. Within the manufacturing phase,
production of tower components has the largest contribution (29%), followed by
blade components (16%), gear and mainshaft components (12%) and nacelle com-
ponents (10%).
Carbon dioxide is the most significant emission contributing to this impact category
(82%) followed by sulphur hexafluoride (10%).
-0.004
-0.002
0
0.002
0.004
0.006
0.008
0.01
Total Manufacturing Wind plant set up
Site operations End of life
kg C
O2
eq
./kW
h
30
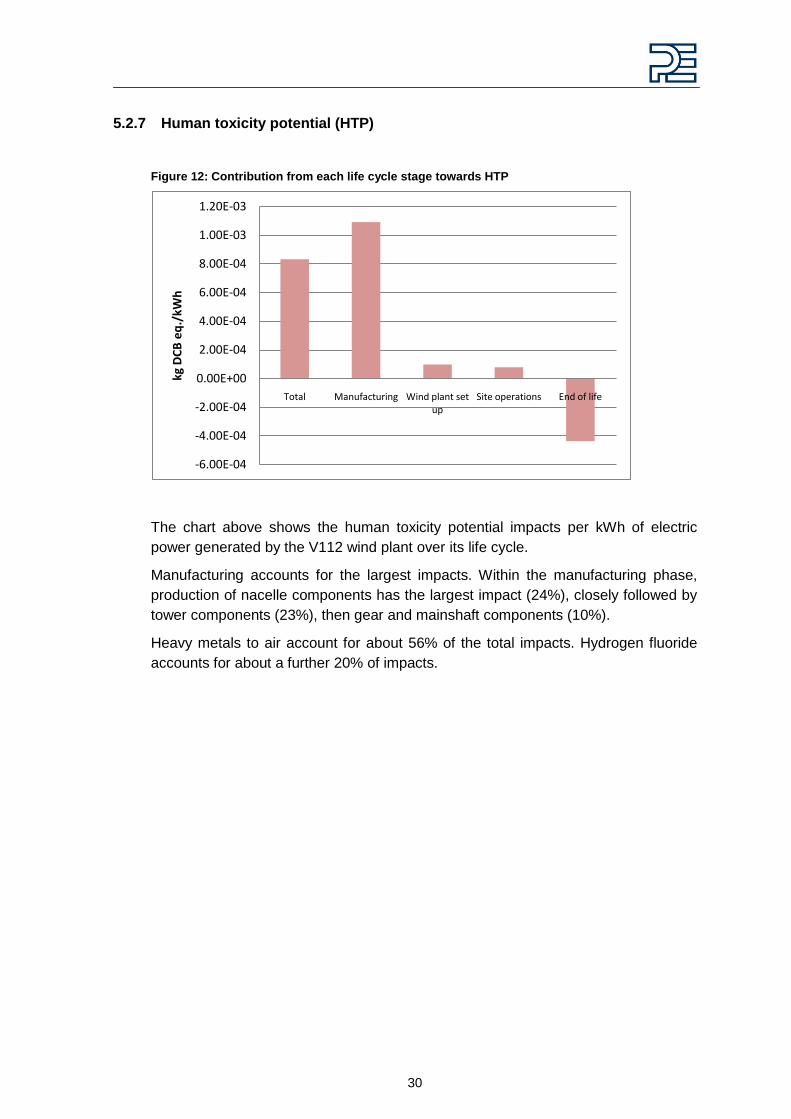
5.2.7 Human toxicity potential (HTP)
Figure 12: Contribution from each life cycle stage towards HTP
The chart above shows the human toxicity potential impacts per kWh of electric
power generated by the V112 wind plant over its life cycle.
Manufacturing accounts for the largest impacts. Within the manufacturing phase,
production of nacelle components has the largest impact (24%), closely followed by
tower components (23%), then gear and mainshaft components (10%).
Heavy metals to air account for about 56% of the total impacts. Hydrogen fluoride
accounts for about a further 20% of impacts.
-6.00E-04
-4.00E-04
-2.00E-04
0.00E+00
2.00E-04
4.00E-04
6.00E-04
8.00E-04
1.00E-03
1.20E-03
Total Manufacturing Wind plant set up
Site operations End of life
kg D
CB
eq
./kW
h
31
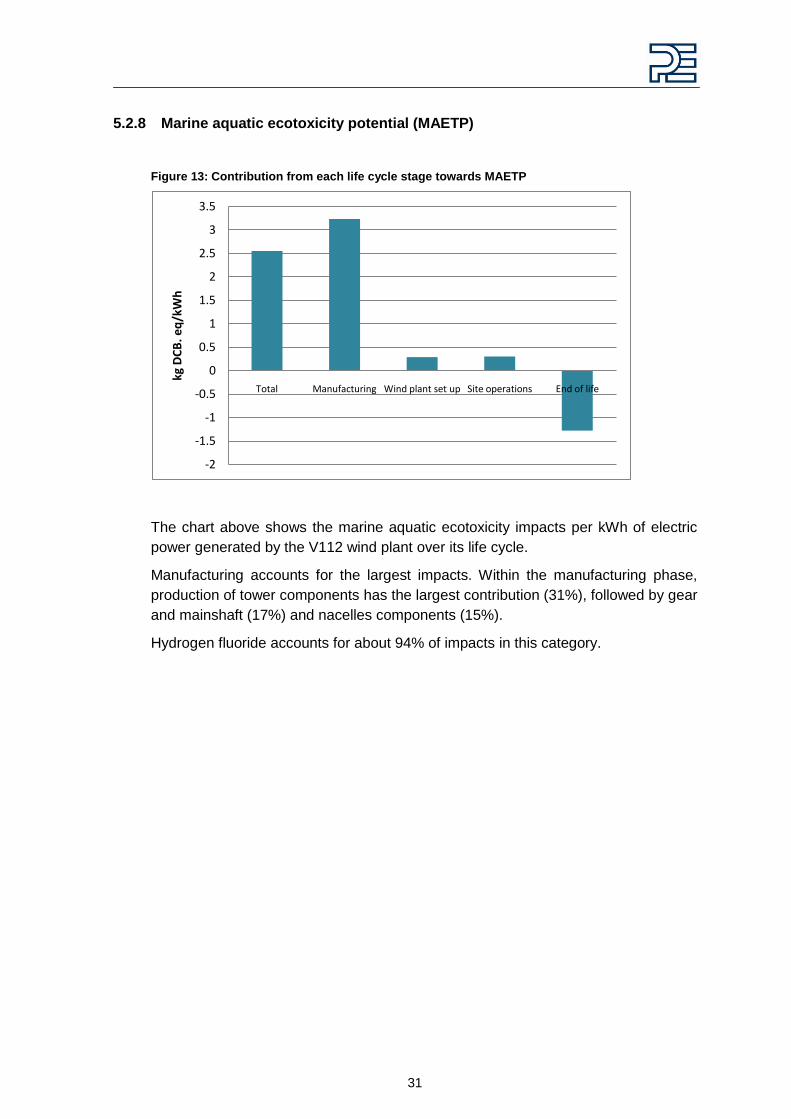
5.2.8 Marine aquatic ecotoxicity potential (MAETP)
Figure 13: Contribution from each life cycle stage towards MAETP
The chart above shows the marine aquatic ecotoxicity impacts per kWh of electric
power generated by the V112 wind plant over its life cycle.
Manufacturing accounts for the largest impacts. Within the manufacturing phase,
production of tower components has the largest contribution (31%), followed by gear
and mainshaft (17%) and nacelles components (15%).
Hydrogen fluoride accounts for about 94% of impacts in this category.
-2
-1.5
-1
-0.5
0
0.5
1
1.5
2
2.5
3
3.5
Total Manufacturing Wind plant set up Site operations End of life
kg D
CB
. e
q/k
Wh
32
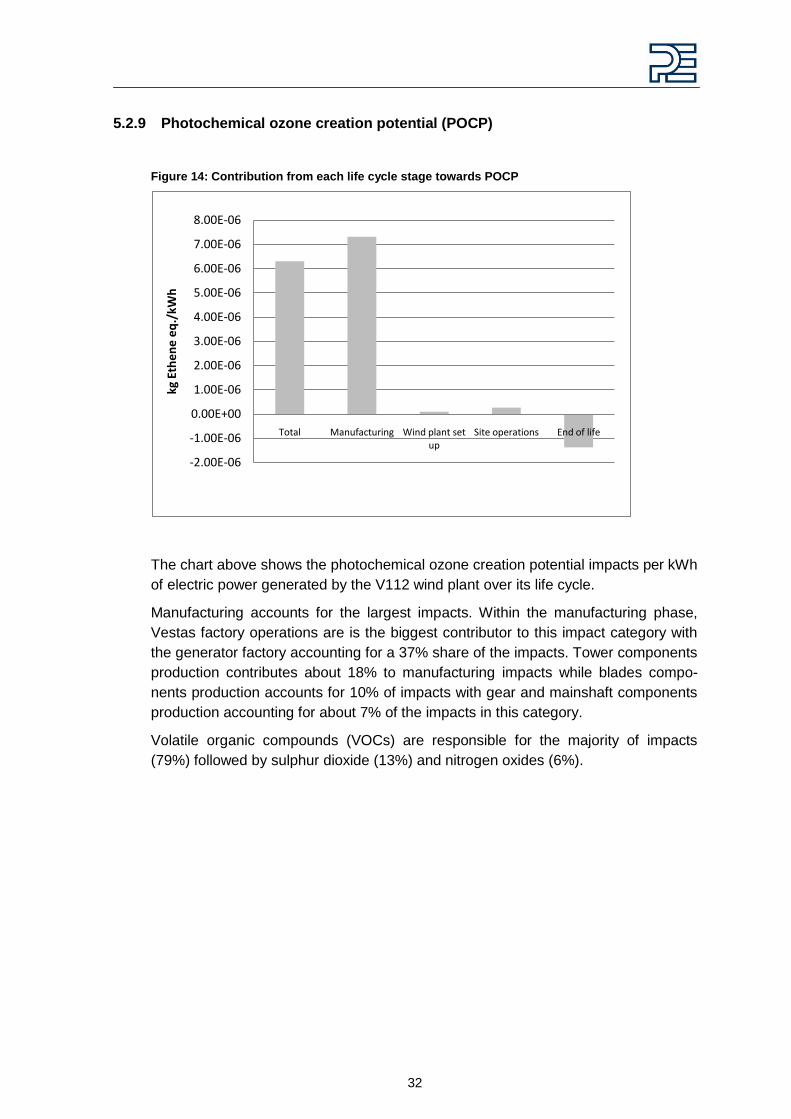
5.2.9 Photochemical ozone creation potential (POCP)
Figure 14: Contribution from each life cycle stage towards POCP
The chart above shows the photochemical ozone creation potential impacts per kWh
of electric power generated by the V112 wind plant over its life cycle.
Manufacturing accounts for the largest impacts. Within the manufacturing phase,
Vestas factory operations are is the biggest contributor to this impact category with
the generator factory accounting for a 37% share of the impacts. Tower components
production contributes about 18% to manufacturing impacts while blades compo-
nents production accounts for 10% of impacts with gear and mainshaft components
production accounting for about 7% of the impacts in this category.
Volatile organic compounds (VOCs) are responsible for the majority of impacts
(79%) followed by sulphur dioxide (13%) and nitrogen oxides (6%).
-2.00E-06
-1.00E-06
0.00E+00
1.00E-06
2.00E-06
3.00E-06
4.00E-06
5.00E-06
6.00E-06
7.00E-06
8.00E-06
Total Manufacturing Wind plant set up
Site operations End of life
kg E
the
ne
eq
./kW
h
33
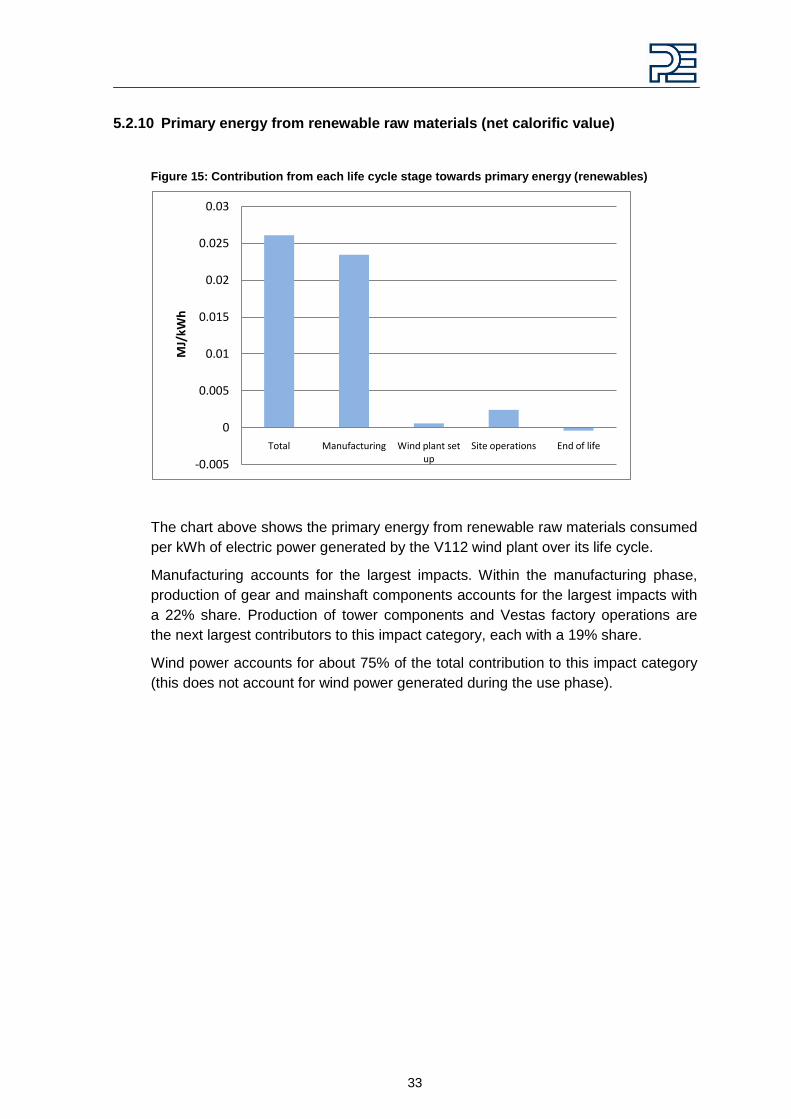
5.2.10 Primary energy from renewable raw materials (net calorific value)
Figure 15: Contribution from each life cycle stage towards primary energy (renewables)
The chart above shows the primary energy from renewable raw materials consumed
per kWh of electric power generated by the V112 wind plant over its life cycle.
Manufacturing accounts for the largest impacts. Within the manufacturing phase,
production of gear and mainshaft components accounts for the largest impacts with
a 22% share. Production of tower components and Vestas factory operations are
the next largest contributors to this impact category, each with a 19% share.
Wind power accounts for about 75% of the total contribution to this impact category
(this does not account for wind power generated during the use phase).
-0.005
0
0.005
0.01
0.015
0.02
0.025
0.03
Total Manufacturing Wind plant set up
Site operations End of life
MJ/
kWh
34
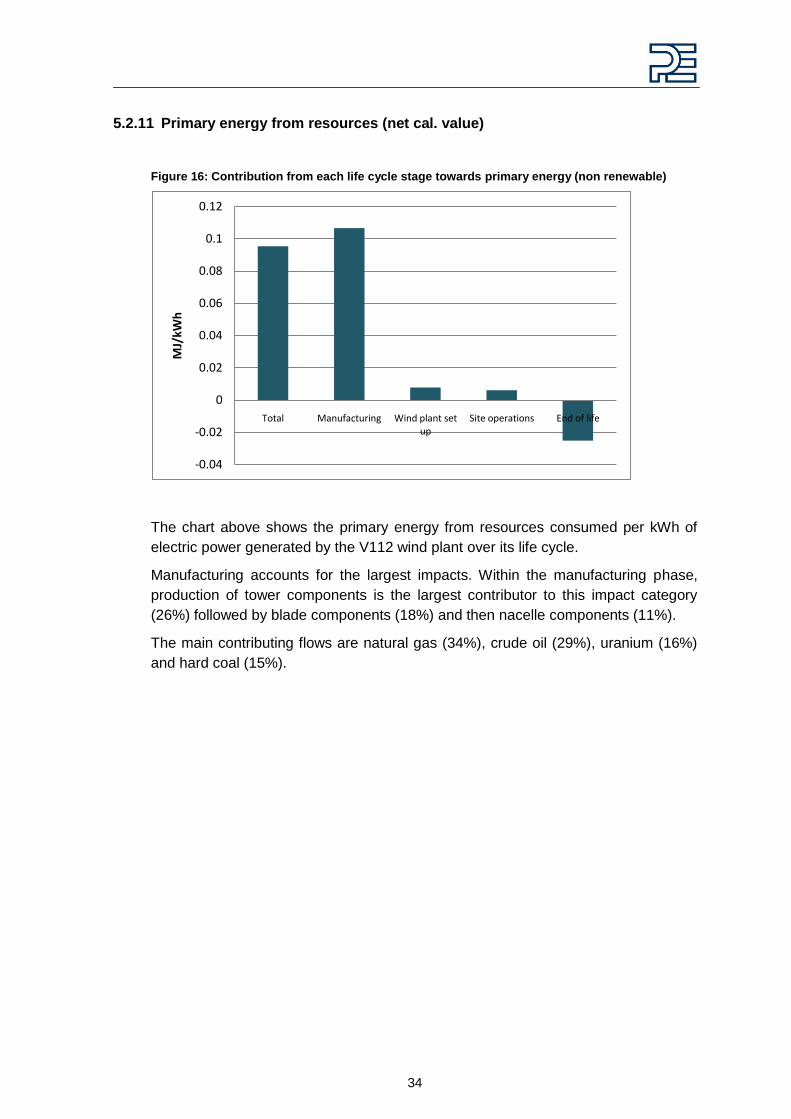
5.2.11 Primary energy from resources (net cal. value)
Figure 16: Contribution from each life cycle stage towards primary energy (non renewable)
The chart above shows the primary energy from resources consumed per kWh of
electric power generated by the V112 wind plant over its life cycle.
Manufacturing accounts for the largest impacts. Within the manufacturing phase,
production of tower components is the largest contributor to this impact category
(26%) followed by blade components (18%) and then nacelle components (11%).
The main contributing flows are natural gas (34%), crude oil (29%), uranium (16%)
and hard coal (15%).
-0.04
-0.02
0
0.02
0.04
0.06
0.08
0.1
0.12
Total Manufacturing Wind plant set up
Site operations End of life
MJ/
kWh
35
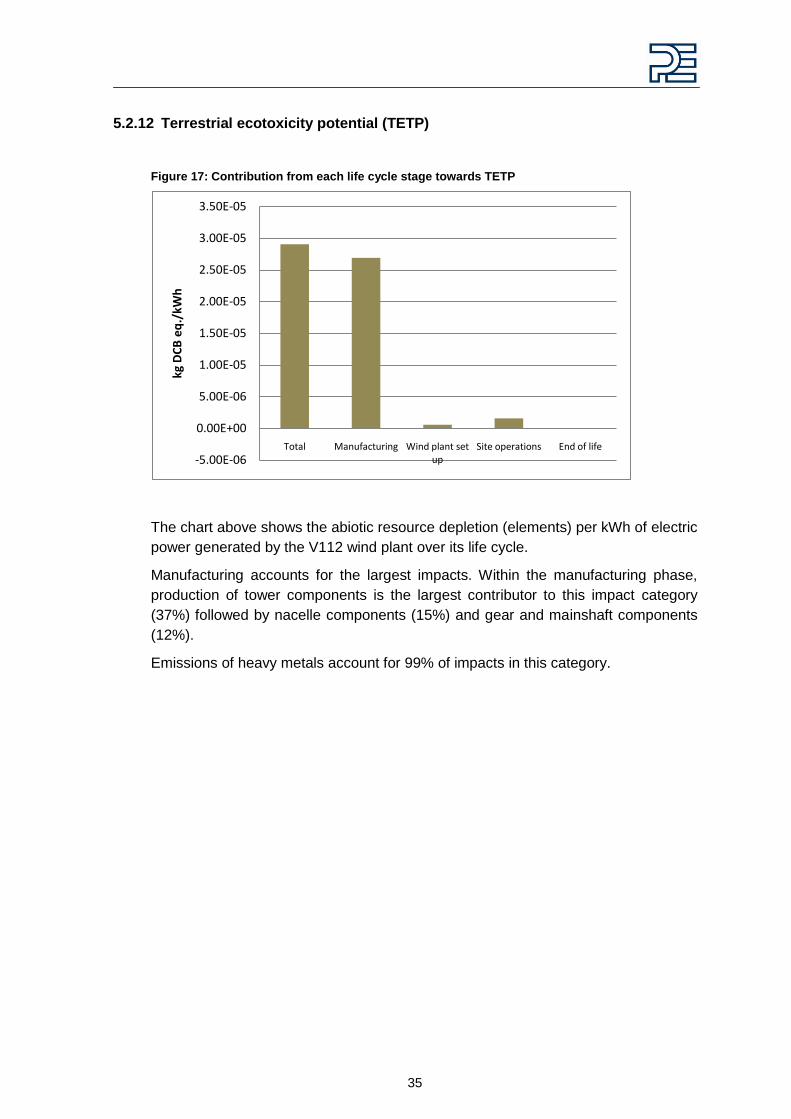
5.2.12 Terrestrial ecotoxicity potential (TETP)
Figure 17: Contribution from each life cycle stage towards TETP
The chart above shows the abiotic resource depletion (elements) per kWh of electric
power generated by the V112 wind plant over its life cycle.
Manufacturing accounts for the largest impacts. Within the manufacturing phase,
production of tower components is the largest contributor to this impact category
(37%) followed by nacelle components (15%) and gear and mainshaft components
(12%).
Emissions of heavy metals account for 99% of impacts in this category.
-5.00E-06
0.00E+00
5.00E-06
1.00E-05
1.50E-05
2.00E-05
2.50E-05
3.00E-05
3.50E-05
Total Manufacturing Wind plant set up
Site operations End of life
kg D
CB
eq
./kW
h
36
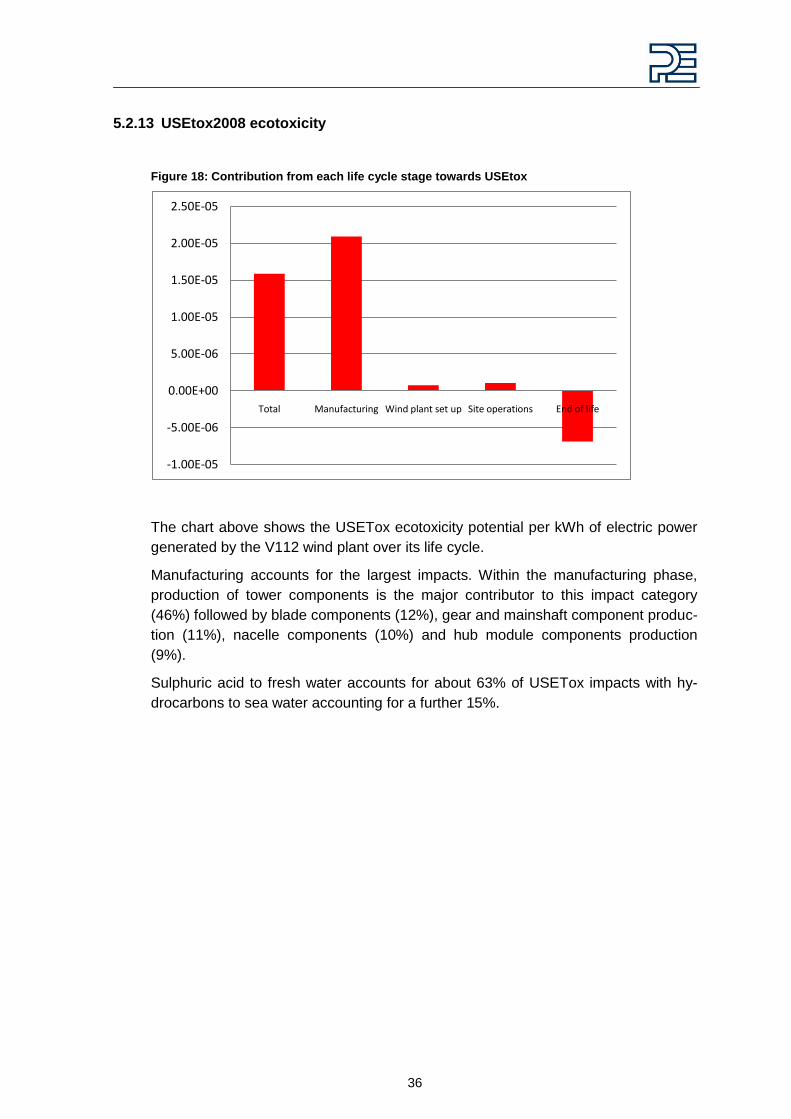
5.2.13 USEtox2008 ecotoxicity
Figure 18: Contribution from each life cycle stage towards USEtox
The chart above shows the USETox ecotoxicity potential per kWh of electric power
generated by the V112 wind plant over its life cycle.
Manufacturing accounts for the largest impacts. Within the manufacturing phase,
production of tower components is the major contributor to this impact category
(46%) followed by blade components (12%), gear and mainshaft component produc-
tion (11%), nacelle components (10%) and hub module components production
(9%).
Sulphuric acid to fresh water accounts for about 63% of USETox impacts with hy-
drocarbons to sea water accounting for a further 15%.
-1.00E-05
-5.00E-06
0.00E+00
5.00E-06
1.00E-05
1.50E-05
2.00E-05
2.50E-05
Total Manufacturing Wind plant set up Site operations End of life
37
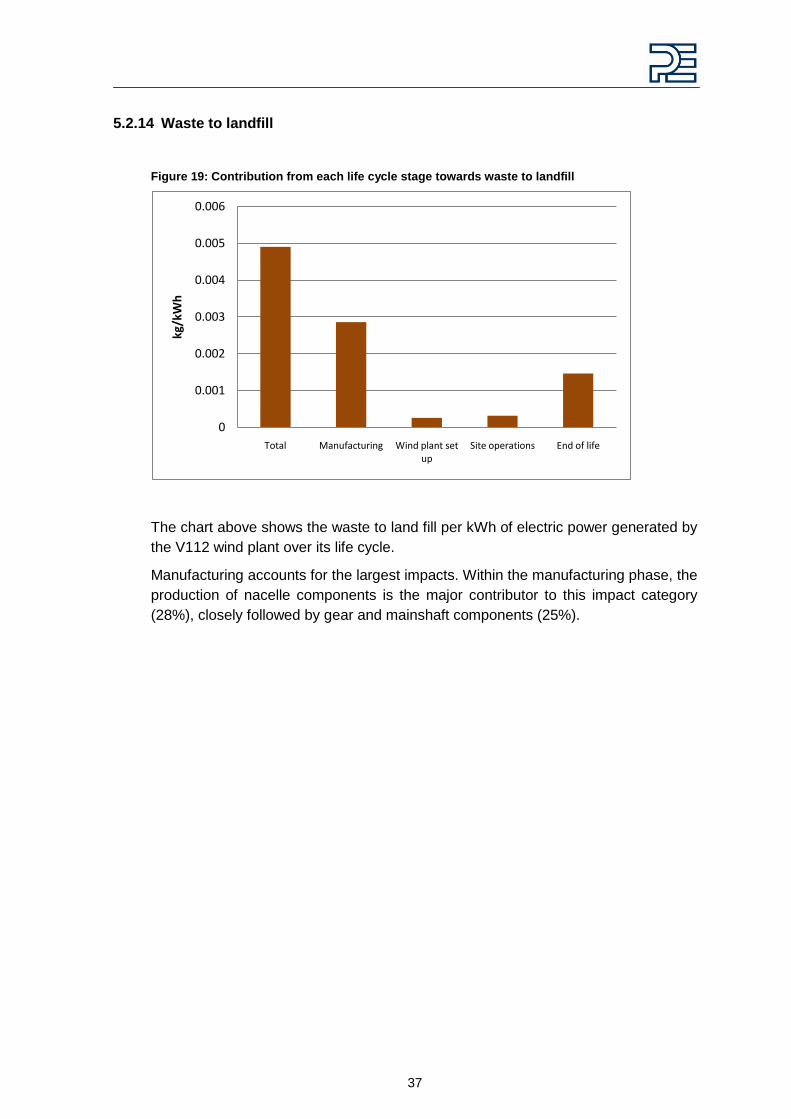
5.2.14 Waste to landfill
Figure 19: Contribution from each life cycle stage towards waste to landfill
The chart above shows the waste to land fill per kWh of electric power generated by
the V112 wind plant over its life cycle.
Manufacturing accounts for the largest impacts. Within the manufacturing phase, the
production of nacelle components is the major contributor to this impact category
(28%), closely followed by gear and mainshaft components (25%).
0
0.001
0.002
0.003
0.004
0.005
0.006
Total Manufacturing Wind plant set up
Site operations End of life
kg/k
Wh
38
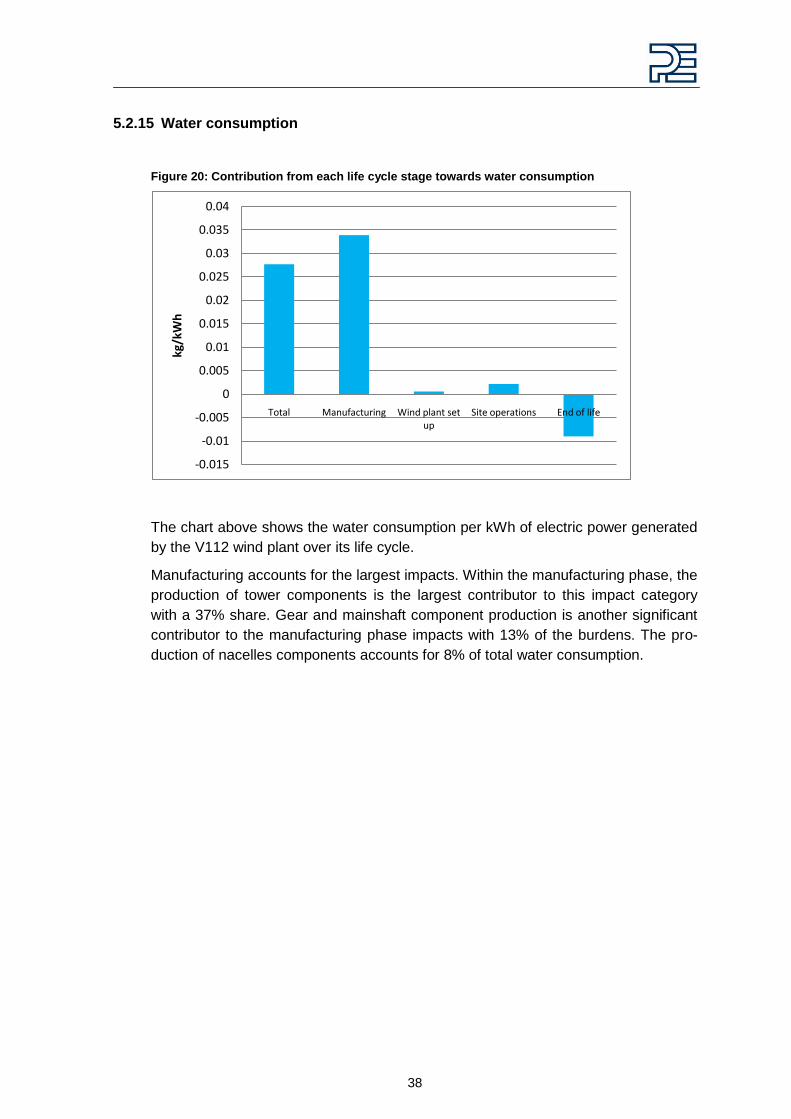
5.2.15 Water consumption
Figure 20: Contribution from each life cycle stage towards water consumption
The chart above shows the water consumption per kWh of electric power generated
by the V112 wind plant over its life cycle.
Manufacturing accounts for the largest impacts. Within the manufacturing phase, the
production of tower components is the largest contributor to this impact category
with a 37% share. Gear and mainshaft component production is another significant
contributor to the manufacturing phase impacts with 13% of the burdens. The pro-
duction of nacelles components accounts for 8% of total water consumption.
-0.015
-0.01
-0.005
0
0.005
0.01
0.015
0.02
0.025
0.03
0.035
0.04
Total Manufacturing Wind plant set up
Site operations End of life
kg/k
Wh
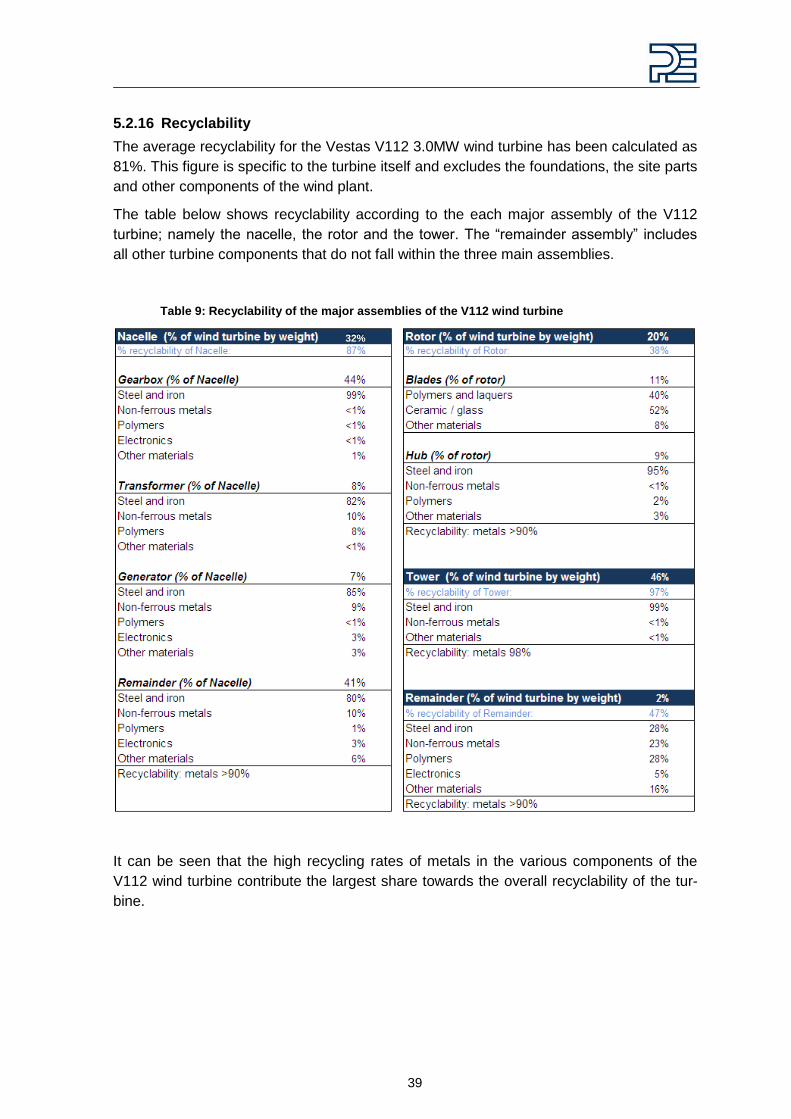
39
5.2.16 Recyclability
The average recyclability for the Vestas V112 3.0MW wind turbine has been calculated as
81%. This figure is specific to the turbine itself and excludes the foundations, the site parts
and other components of the wind plant.
The table below shows recyclability according to the each major assembly of the V112
turbine; namely the nacelle, the rotor and the tower. The ―remainder assembly‖ includes
all other turbine components that do not fall within the three main assemblies.
Table 9: Recyclability of the major assemblies of the V112 wind turbine
It can be seen that the high recycling rates of metals in the various components of the
V112 wind turbine contribute the largest share towards the overall recyclability of the tur-
bine.
32%
40
6 Sensitivity Analyses
This section details the sensitivity assessments that have been carried out in this study to
better understand the effect and importance of uncertainties in the data or of applying dif-
ferent methodologies during the modelling.
6.1 Wind plant life time
The life time of the wind plant in the baseline scenario is assumed to be 20 years. Vestas
has indicated based on professional experience that this figure might vary up to even 30
years. The analysis in this section has been carried out to account for this uncertainty in
the duration of the life time of the wind plant. A variance of ±4 years has been chosen for
this analysis.
Assuming all other variables remain fixed it is obvious that increasing the life time of the
wind plant will lead to lower emissions per kWh as the impacts associated with manufac-
turing the wind turbines are amortised over a longer period of time.
This assessment shows that all impact categories show a 25% increase in potential envi-
ronmental impacts when the life time of the wind plant is reduced by 4 years, and a 27%
reduction when the lifetime is increased by 4 years.
It may be expected that the requirement for maintenance and replacement parts will corre-
late with the life time of the wind plant (i.e. longer life time implies increased mainte-
nance). However there is considerable uncertainty and variation in the frequency and re-
quirement of maintenance and replacement parts and so this issue is considered in a
separate sensitivity analysis.
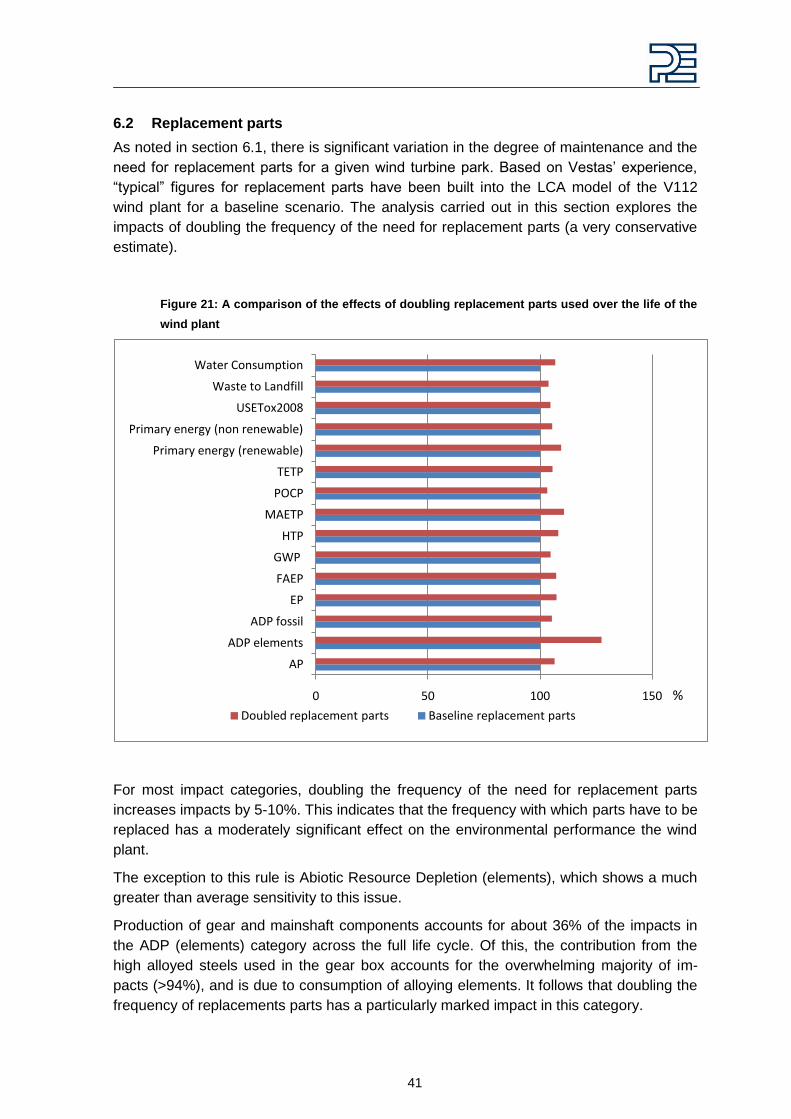
41
6.2 Replacement parts
As noted in section 6.1, there is significant variation in the degree of maintenance and the
need for replacement parts for a given wind turbine park. Based on Vestas‘ experience,
―typical‖ figures for replacement parts have been built into the LCA model of the V112
wind plant for a baseline scenario. The analysis carried out in this section explores the
impacts of doubling the frequency of the need for replacement parts (a very conservative
estimate).
Figure 21: A comparison of the effects of doubling replacement parts used over the life of the
wind plant
For most impact categories, doubling the frequency of the need for replacement parts
increases impacts by 5-10%. This indicates that the frequency with which parts have to be
replaced has a moderately significant effect on the environmental performance the wind
plant.
The exception to this rule is Abiotic Resource Depletion (elements), which shows a much
greater than average sensitivity to this issue.
Production of gear and mainshaft components accounts for about 36% of the impacts in
the ADP (elements) category across the full life cycle. Of this, the contribution from the
high alloyed steels used in the gear box accounts for the overwhelming majority of im-
pacts (>94%), and is due to consumption of alloying elements. It follows that doubling the
frequency of replacements parts has a particularly marked impact in this category.
0 50 100 150
AP
ADP elements
ADP fossil
EP
FAEP
GWP
HTP
MAETP
POCP
TETP
Primary energy (renewable)
Primary energy (non renewable)
USETox2008
Waste to Landfill
Water Consumption
Doubled replacement parts Baseline replacement parts
%
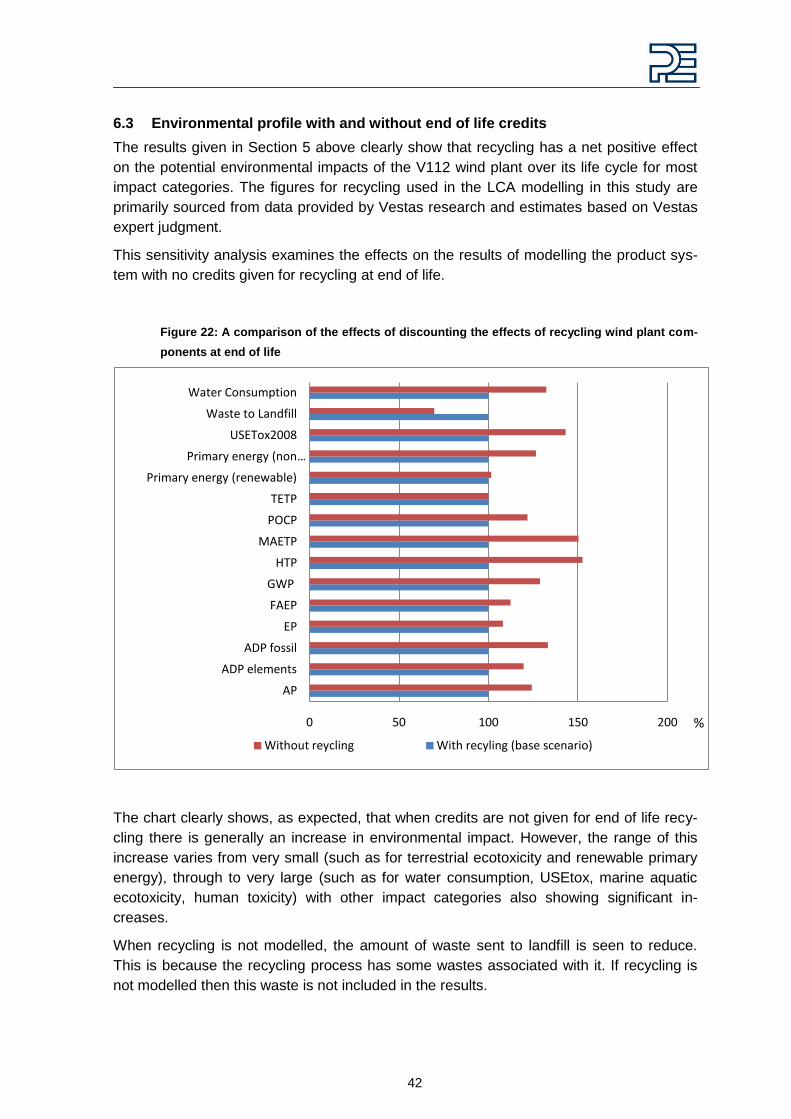
42
6.3 Environmental profile with and without end of life credits
The results given in Section 5 above clearly show that recycling has a net positive effect
on the potential environmental impacts of the V112 wind plant over its life cycle for most
impact categories. The figures for recycling used in the LCA modelling in this study are
primarily sourced from data provided by Vestas research and estimates based on Vestas
expert judgment.
This sensitivity analysis examines the effects on the results of modelling the product sys-
tem with no credits given for recycling at end of life.
Figure 22: A comparison of the effects of discounting the effects of recycling wind plant com-
ponents at end of life
The chart clearly shows, as expected, that when credits are not given for end of life recy-
cling there is generally an increase in environmental impact. However, the range of this
increase varies from very small (such as for terrestrial ecotoxicity and renewable primary
energy), through to very large (such as for water consumption, USEtox, marine aquatic
ecotoxicity, human toxicity) with other impact categories also showing significant in-
creases.
When recycling is not modelled, the amount of waste sent to landfill is seen to reduce.
This is because the recycling process has some wastes associated with it. If recycling is
not modelled then this waste is not included in the results.
0 50 100 150 200
AP
ADP elements
ADP fossil
EP
FAEP
GWP
HTP
MAETP
POCP
TETP
Primary energy (renewable)
Primary energy (non …
USETox2008
Waste to Landfill
Water Consumption
Without reycling With recyling (base scenario)
%
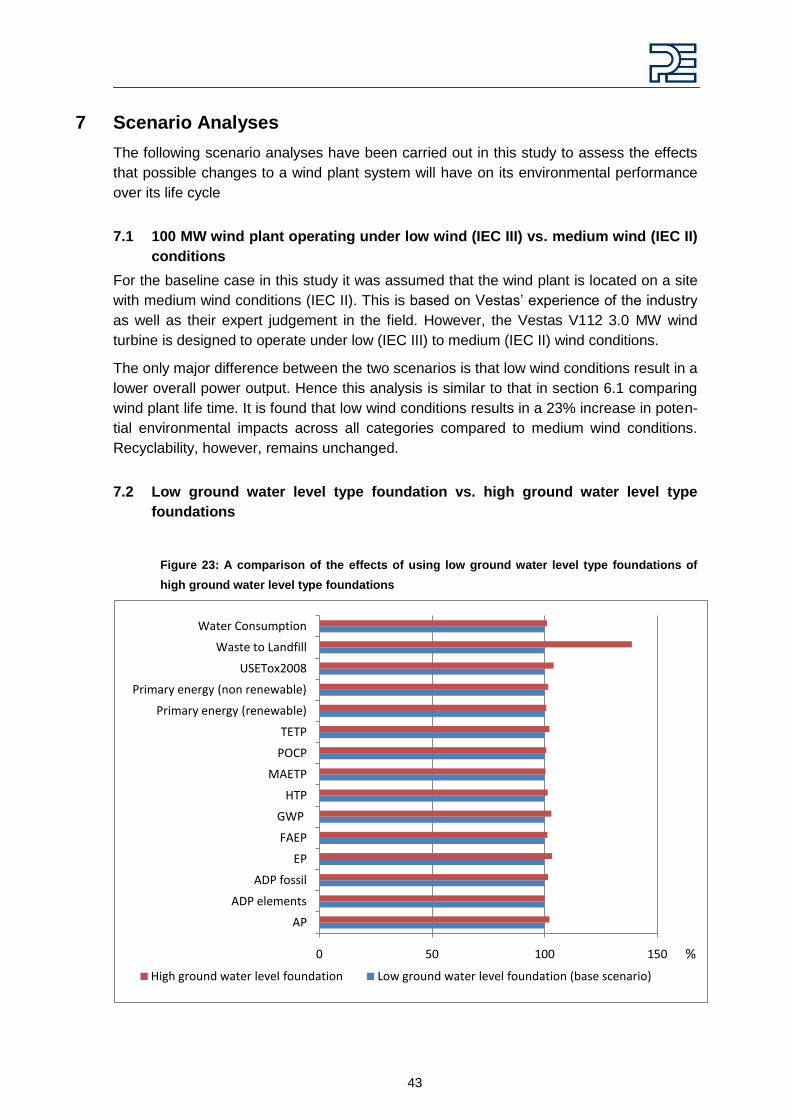
43
7 Scenario Analyses
The following scenario analyses have been carried out in this study to assess the effects
that possible changes to a wind plant system will have on its environmental performance
over its life cycle
7.1 100 MW wind plant operating under low wind (IEC III) vs. medium wind (IEC II)
conditions
For the baseline case in this study it was assumed that the wind plant is located on a site
with medium wind conditions (IEC II). This is based on Vestas‘ experience of the industry
as well as their expert judgement in the field. However, the Vestas V112 3.0 MW wind
turbine is designed to operate under low (IEC III) to medium (IEC II) wind conditions.
The only major difference between the two scenarios is that low wind conditions result in a
lower overall power output. Hence this analysis is similar to that in section 6.1 comparing
wind plant life time. It is found that low wind conditions results in a 23% increase in poten-
tial environmental impacts across all categories compared to medium wind conditions.
Recyclability, however, remains unchanged.
7.2 Low ground water level type foundation vs. high ground water level type
foundations
Figure 23: A comparison of the effects of using low ground water level type foundations of
high ground water level type foundations
0 50 100 150
AP
ADP elements
ADP fossil
EP
FAEP
GWP
HTP
MAETP
POCP
TETP
Primary energy (renewable)
Primary energy (non renewable)
USETox2008
Waste to Landfill
Water Consumption
High ground water level foundation Low ground water level foundation (base scenario)
%
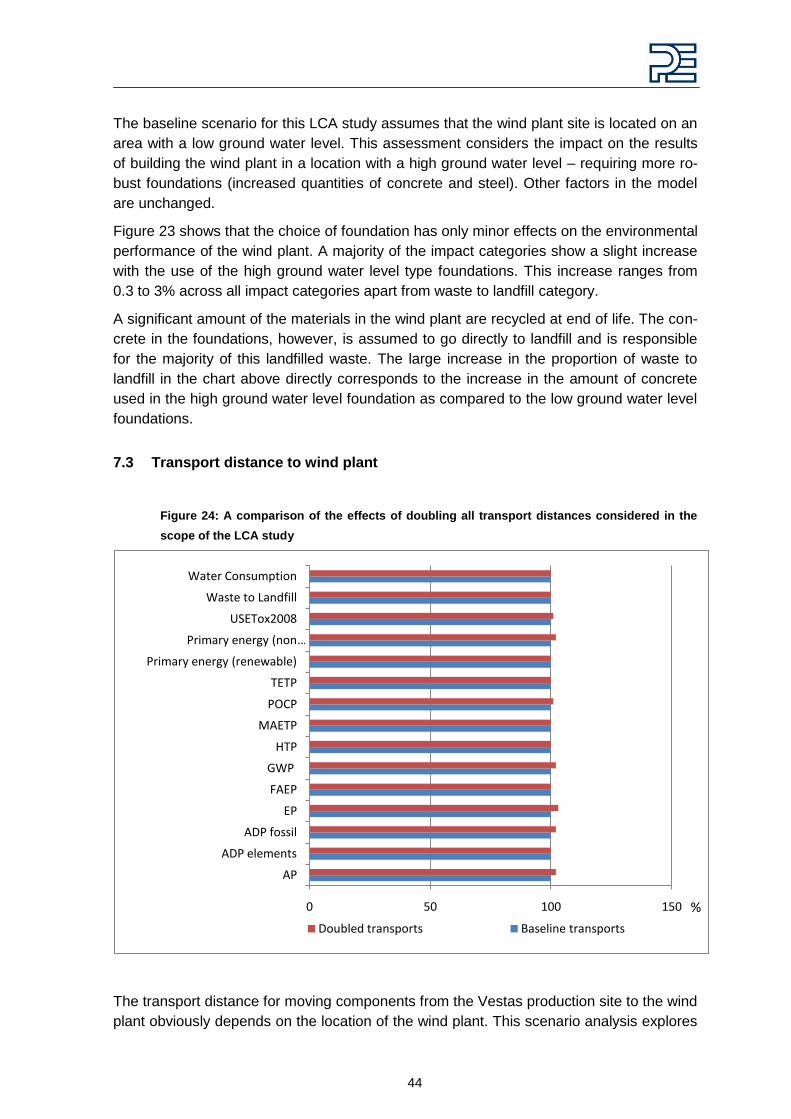
44
The baseline scenario for this LCA study assumes that the wind plant site is located on an
area with a low ground water level. This assessment considers the impact on the results
of building the wind plant in a location with a high ground water level – requiring more ro-
bust foundations (increased quantities of concrete and steel). Other factors in the model
are unchanged.
Figure 23 shows that the choice of foundation has only minor effects on the environmental
performance of the wind plant. A majority of the impact categories show a slight increase
with the use of the high ground water level type foundations. This increase ranges from
0.3 to 3% across all impact categories apart from waste to landfill category.
A significant amount of the materials in the wind plant are recycled at end of life. The con-
crete in the foundations, however, is assumed to go directly to landfill and is responsible
for the majority of this landfilled waste. The large increase in the proportion of waste to
landfill in the chart above directly corresponds to the increase in the amount of concrete
used in the high ground water level foundation as compared to the low ground water level
foundations.
7.3 Transport distance to wind plant
Figure 24: A comparison of the effects of doubling all transport distances considered in the
scope of the LCA study
The transport distance for moving components from the Vestas production site to the wind
plant obviously depends on the location of the wind plant. This scenario analysis explores
0 50 100 150
AP
ADP elements
ADP fossil
EP
FAEP
GWP
HTP
MAETP
POCP
TETP
Primary energy (renewable)
Primary energy (non …
USETox2008
Waste to Landfill
Water Consumption
Doubled transports Baseline transports
%
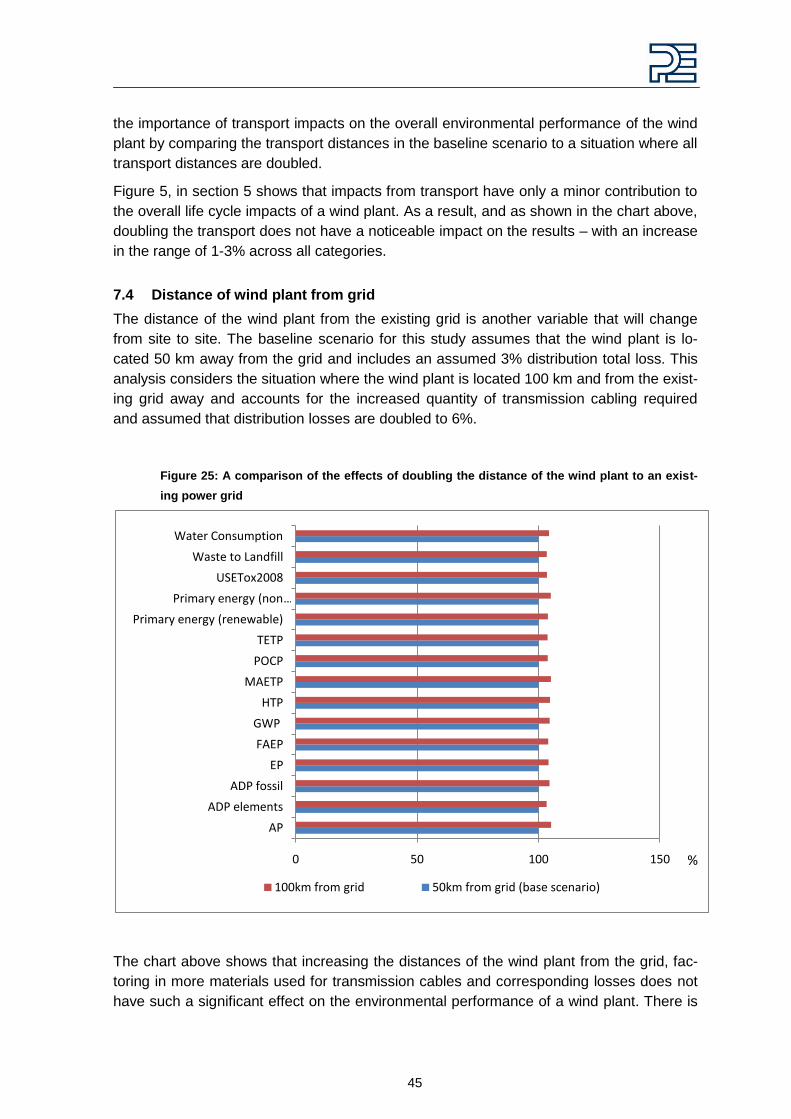
45
the importance of transport impacts on the overall environmental performance of the wind
plant by comparing the transport distances in the baseline scenario to a situation where all
transport distances are doubled.
Figure 5, in section 5 shows that impacts from transport have only a minor contribution to
the overall life cycle impacts of a wind plant. As a result, and as shown in the chart above,
doubling the transport does not have a noticeable impact on the results – with an increase
in the range of 1-3% across all categories.
7.4 Distance of wind plant from grid
The distance of the wind plant from the existing grid is another variable that will change
from site to site. The baseline scenario for this study assumes that the wind plant is lo-
cated 50 km away from the grid and includes an assumed 3% distribution total loss. This
analysis considers the situation where the wind plant is located 100 km and from the exist-
ing grid away and accounts for the increased quantity of transmission cabling required
and assumed that distribution losses are doubled to 6%.
Figure 25: A comparison of the effects of doubling the distance of the wind plant to an exist-
ing power grid
The chart above shows that increasing the distances of the wind plant from the grid, fac-
toring in more materials used for transmission cables and corresponding losses does not
have such a significant effect on the environmental performance of a wind plant. There is
0 50 100 150
AP
ADP elements
ADP fossil
EP
FAEP
GWP
HTP
MAETP
POCP
TETP
Primary energy (renewable)
Primary energy (non …
USETox2008
Waste to Landfill
Water Consumption
100km from grid 50km from grid (base scenario)
%

46
a general increase of 3-5% in the impacts across each category when the distance from
the wind plant to the existing grid is doubled.
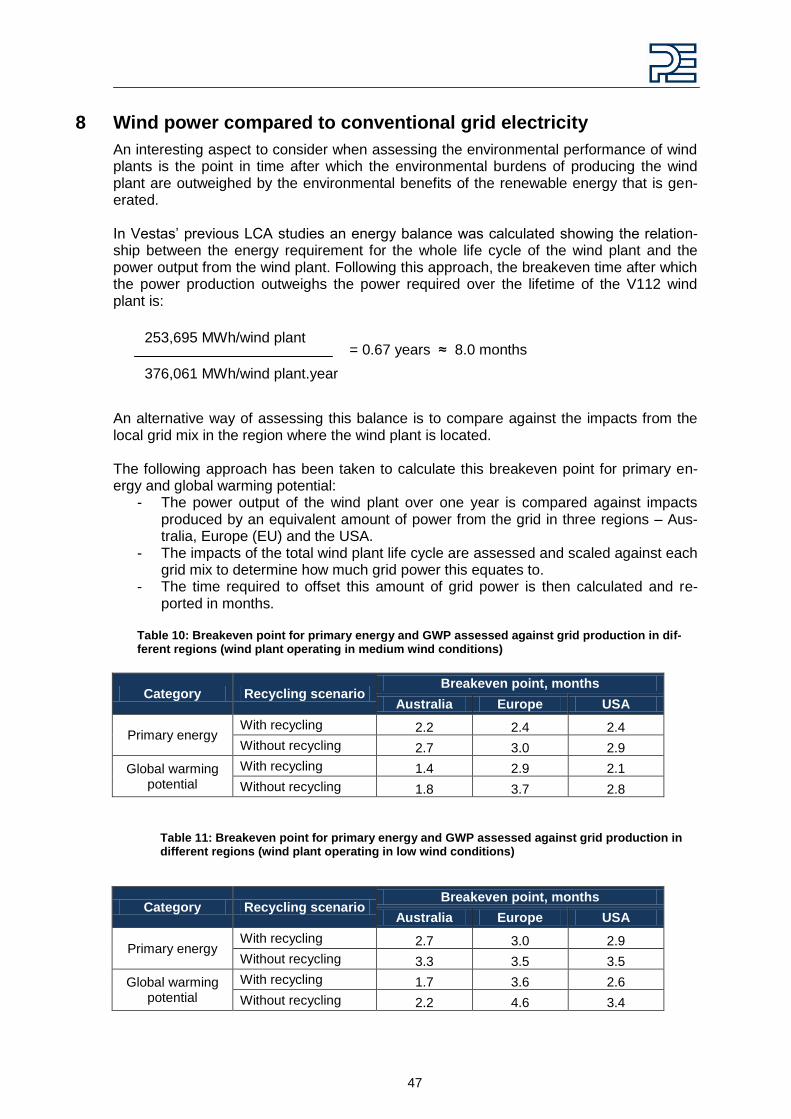
47
8 Wind power compared to conventional grid electricity
An interesting aspect to consider when assessing the environmental performance of wind plants is the point in time after which the environmental burdens of producing the wind plant are outweighed by the environmental benefits of the renewable energy that is gen-erated. In Vestas‘ previous LCA studies an energy balance was calculated showing the relation-ship between the energy requirement for the whole life cycle of the wind plant and the power output from the wind plant. Following this approach, the breakeven time after which the power production outweighs the power required over the lifetime of the V112 wind plant is:
An alternative way of assessing this balance is to compare against the impacts from the local grid mix in the region where the wind plant is located. The following approach has been taken to calculate this breakeven point for primary en-ergy and global warming potential:
- The power output of the wind plant over one year is compared against impacts produced by an equivalent amount of power from the grid in three regions – Aus-tralia, Europe (EU) and the USA.
- The impacts of the total wind plant life cycle are assessed and scaled against each grid mix to determine how much grid power this equates to.
- The time required to offset this amount of grid power is then calculated and re-ported in months.
Table 10: Breakeven point for primary energy and GWP assessed against grid production in dif-ferent regions (wind plant operating in medium wind conditions)
Category Recycling scenario Breakeven point, months
Australia Europe USA
Primary energy With recycling 2.2 2.4 2.4
Without recycling 2.7 3.0 2.9
Global warming potential
With recycling 1.4 2.9 2.1
Without recycling 1.8 3.7 2.8
Table 11: Breakeven point for primary energy and GWP assessed against grid production in different regions (wind plant operating in low wind conditions)
Category Recycling scenario Breakeven point, months
Australia Europe USA
Primary energy With recycling 2.7 3.0 2.9
Without recycling 3.3 3.5 3.5
Global warming potential
With recycling 1.7 3.6 2.6
Without recycling 2.2 4.6 3.4
376,061 MWh/wind plant.year
253,695 MWh/wind plant = 0.67 years ≈ 8.0 months

48
The different values for each region are a reflection of the differing grid mixes in each re-
gion. For example the breakeven point for global warming potential in Europe is longer
than that for Australia because European grid power production is less carbon intensive.
The results show a breakeven point of less than 3 months for the V112 wind plant at me-
dium wind conditions in all cases and under 5 months for low wind conditions.
These results also show that the breakeven point is shorter when modelling the system
with credits for recycling at end of life (as this approach reduces the overall impact of the
wind plant life cycle).
49
9 Interpretation
9.1 General
The results described in this report show the environmental profile of the production of
electricity from a wind plant comprising thirty-three V112 3.0 MW wind turbines. This LCA
is the most comprehensive and detailed ever undertaken by Vestas and will provide the
benchmark for future studies by the company.
Overall, the results show that for every impact category assessed the largest impacts are
associated with the raw material production and manufacturing phase of the life cycle. In
most cases these are much greater than those occurring elsewhere in the supply chain for
the complete wind park.
Within the manufacturing stage the production of the tower itself typically accounts for the
largest impacts; this reflects the large quantity of steel required to produce this part of the
wind turbine. The production of the nacelle and of the gear and mainshaft also result in
significant impacts. Manufacture of the blades for the turbine also has quite significant
impacts, while production of other parts of the wind turbine is generally less important in
comparison.
End of life processes are also significant for many impact categories and normally credit
the product system – showing the benefits of the high recycling rate achieved for wind
turbine infrastructure.
Wind plant construction and site operations generally do not make a significant contribu-
tion to the overall life cycle impacts of the wind plant.
Transport of wind plant components to site make a very insignificant contribution to the
overall life cycle impacts of the wind plant.
9.2 Sensitivity analyses
The sensitivity analyses show that assumptions on the lifetime of the wind plant can have
a large influence on the results. Increasing the lifetime from 20 to 24 years, results in a
27% drop in all environmental impacts. This does not account for any increased mainte-
nance that may be required, but a second sensitivity analysis shows that most impact
categories are not particularly sensitive to this issue.
The recycling methodology used also plays an important role in the results. Recycling
rates for wind turbines are quite high and, as noted above, in the baseline scenario (where
credits are given for recycling) the end of life has a significant contribution to the total re-
sults. If no benefit is given for recycling, the end of life stage will have a much small con-
tribution and overall impacts in most categories will increase substantially as the produc-
tion impacts are no longer offset by recycling credits.
9.3 Scenario analyses
Wind conditions for the wind plant determine how much energy is generated over its life-
time. If the wind plant operates in low wind conditions (IEC III) then the impacts per kWh
electricity produced increases by 23% compared to medium wind conditions (IEC II). This
finding emphasises the importance of location in wind plant planning to maximise the effi-
50
ciency of electricity generation. The findings also reinforce the fact that any comparison
between wind power plants should only be made within a specific wind class.
Another location-dependent issue is the level of the water table, which determines the size
of the foundations required to support the wind turbines. Regions with a high water table
require more robust foundations. However, with the exception of waste to landfill, the re-
sults are not sensitive to this difference. Likewise, the transport distance of the compo-
nents from the factory to the wind plant site is shown to have very little impact on the
overall results
The location of the wind plant with respect to the local grid infrastructure plays a more
important role as it affects distribution losses and adds additional requirement for cabling.
Doubling the distance to the grid from 50 km to 100 km typically increases impacts per
kWh by 3-5%.
9.4 Robustness of results
9.4.1 Data completeness
A wind plant comprising thirty-three V112 3.0 MW wind turbines has been assessed and
data have been collected and modelled according to the cut-off criteria defined in the Goal
& Scope Definition Document developed at the start of the study and summarised in Sec-
tion 3.3. Based on these criteria all relevant inputs of fuels and power and of raw materials
have been measured and included in the assessment.
9.4.2 Data consistency
All foreground data have been provided by Vestas for the same period of operation.
Background data have been obtained from various reputable sources (e.g. ELCD, trade
association and PE datasets) and are considered to be of high quality.
9.4.3 Data representativeness
The representativeness of the data used in the model is summarised in Table 14 in Ap-
pendix B and is considered to be good.
9.4.4 Reproducibility
The product system being modelled is very complex and requires specialist LCA software
(GaBi DfX) to generate results. Some of the datasets used are also specialised and are
derived from PE‘s extensive experience of LCA modelling in a wide range of industry sec-
tors.
However, it is our expectation that an independent practitioner following the same stan-
dards and using LCA tools with the same functionality and with appropriate support from
Vestas would be able to closely reproduce the results of this study.
51
9.4.5 Opportunities for improvement
Future LCA studies carried out by Vestas could be further improved by considering the
following activities:
Obtain more disaggregated information on Vestas‘ manufacturing operations (cur-
rently data are only available at factory level)
Improve reporting of manufacturing data to more comprehensively account for
mass flow inputs and outputs
Develop a better understanding of applicable recycling technologies and the recy-
clability of different components to enable more precise modelling of the end of life
process stage
Improve understanding of the fate of sulphur hexafluoride in the switch gear
Gather additional information on electrical/electronics components so these can be
modelled in greater detail
Collect information on inbound transport of purchased components so these proc-
esses steps can be included in future assessments
52
10 Literature
ABB 2005 ABB - Environmental Product Declaration, Power transformer Tra-foStar 500MVA
ATHERTON, J. 2007 Atherton, J. - Declaration by the metals industry on recycling princi-ples, International Journal of LCA, vol. 12 (1), Pg 59-60
GABI 2010 GaBi 4: Software und Datenbank zur Ganzheitlichen Bilanzierung. IKP, Universität Stuttgart und PE Europe GmbH, Leinfelden-Echterdingen, 2010.
GUINÉE ET AL. 1996 Guinée, J. et. al. - LCA impact assessment of toxic releases; Generic modelling of fate, exposure and effect for ecosystems and human beings. (no. 1996/21) Centre of Environmental Science (CML) Leiden and National Institute of Public Health and Environmental Protection (RIVM), Bilthoven, May 1996.
GUINÈE ET AL. 2001 Guinée, J. et. al. - Handbook on Life Cycle Assessment - Operational Guide to the ISO Standards. Centre of Environmental Science, Lei-den University (CML); The Netherlands, 2001.
GUINÉE ET AL. 2002 Guinée, J. et. al. - Handbook on Life Cycle Assessment: An opera-tional Guide to the ISO Standards; Dordrecht: Kluwer Academic Pub-lishers, 2002.
IKP 2003 Institut für Kunststoffprüfung und Kunststoffkunde der Universität Stuttgart, Abteilung Ganzheitliche Bilanzierung, 2003
ISO 14040 : 2006 ISO 14040 Environmental Management – Life Cycle Assessment – Principles and Framework, 2006
ISO 14044 : 2006 ISO 14044– Environmental management -- Life cycle assessment -- Requirements and guidelines
KREISSIG & KÜMMEL
1999
Kreißig, J. und J. Kümmel (1999): Baustoff-Ökobilanzen. Wirkungsabschätzung und Auswertung in der Steine-Erden-Industrie. Hrsg. Bundesverband Baustoffe Steine + Erden e.V.
NKT CABLES 2005 NKT Cables - Green account from NKT Cables, Asnaes, 2005
PE AMERICA 2010 PE America - Life Cycle Assessment of Aluminum Beverage Cans for the Aluminum Association Inc., Washington DC, 2010
PE INTERNATIONAL
2006
PE International - GaBi 4 dataset documentation for the software-system and databases, LBP, University of Stuttgart and PE INTERNATIONAL GmbH, Leinfelden-Echterdingen, 2006‖ (http://documentation.gabi-software.com/)
ROSENBAUM ET AL. 2008 Rosenbaum, R.K.et al. - USEtox – the UNEP-SETAC toxicity model: recommended characterisation factors for human toxicity and fresh-water ecotoxicity in life cycle impact assessment

53
Supplement A Description of result parameters
Supplement A 1 Primary energy consumption
Primary energy demand is often difficult to determine due to the various types of energy
source. Primary energy demand is the quantity of energy directly withdrawn from the hy-
drosphere, atmosphere or geosphere or energy source without any anthropogenic
change. For fossil fuels and uranium, this would be the amount of resource withdrawn
expressed in its energy equivalent (i.e. the energy content of the raw material). For re-
newable resources, the energy-characterised amount of biomass consumed would be
described. For hydropower, it would be based on the amount of energy that is gained from
the change in the potential energy of the water (i.e. from the height difference). As aggre-
gated values, the following primary energies are designated:
The total “Primary energy consumption non renewable”, given in MJ, essentially char-
acterises the gain from the energy sources natural gas, crude oil, lignite, coal and ura-
nium. Natural gas and crude oil will be used both for energy production and as material
constituents e.g. in plastics. Coal will primarily be used for energy production. Uranium will
only be used for electricity production in nuclear power stations.
The total “Primary energy consumption renewable”, given in MJ, is generally ac-
counted separately and comprises hydropower, wind power, solar energy and biomass.
It is important that the end energy (e.g. 1 kWh of electricity) and the primary energy used
are not miscalculated with each other; otherwise the efficiency for production or supply of
the end energy will not be accounted for.
The energy content of the manufactured products will be considered as feedstock energy
content. It will be characterised by the net calorific value of the product. It represents the
still usable energy content.
Supplement A 2 Waste categories
There are various different qualities of waste. Waste is categorised according to e.g.
German and European waste directives.
From the balancing point of view, it makes sense to divide waste into three categories.
The categories overburden/tailings, industrial waste for municipal disposal and hazardous
waste will be used.
Overburden / tailings in kg: This category is made up of the layer which has to be re-
moved in order to get access to raw material extraction, ash and other raw material ex-
traction conditional materials for disposal. Also included in this category are tailings such
as inert rock, slag, red mud etc.
Industrial waste for municipal disposal in kg: This term contains the aggregated values
of industrial waste for municipal disposal.
Hazardous waste in kg: In this category, materials that will be treated in a hazardous
waste incinerator or hazardous waste landfill, such as painting sludges, galvanic sludges,
filter dusts or other solid or liquid hazardous waste and radioactive waste from the opera-
tion of nuclear power plants and fuel rod production.
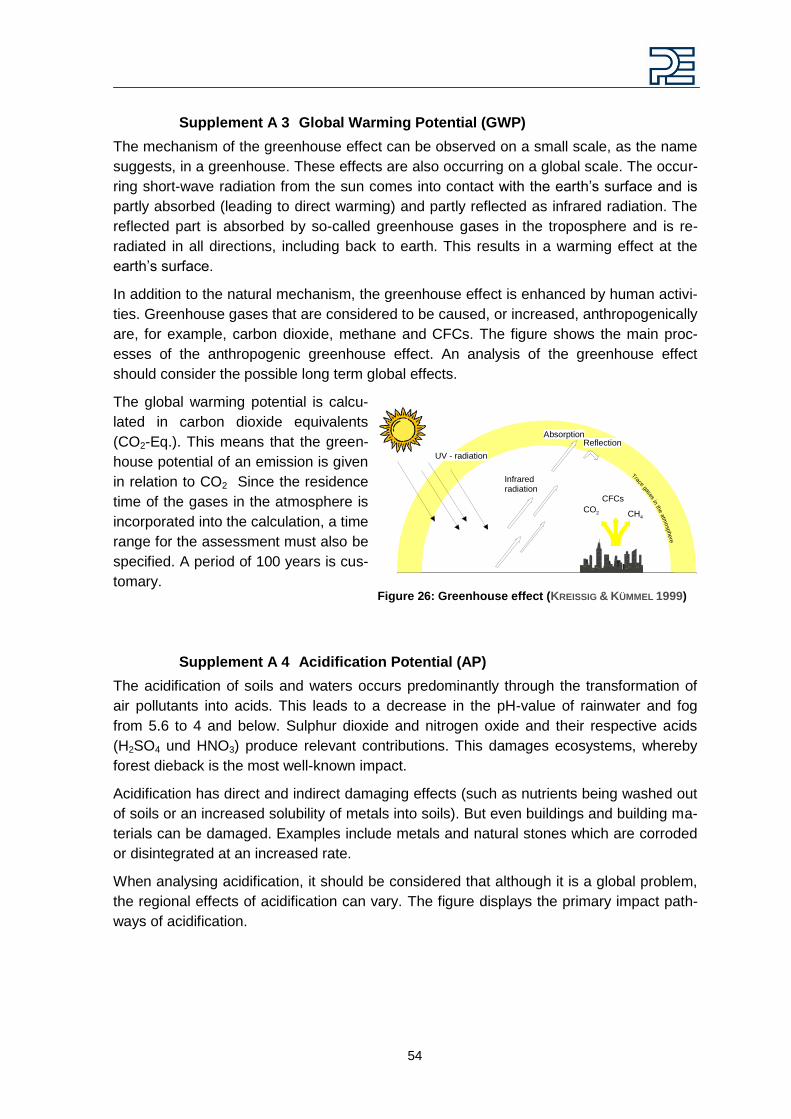
54
Supplement A 3 Global Warming Potential (GWP)
The mechanism of the greenhouse effect can be observed on a small scale, as the name
suggests, in a greenhouse. These effects are also occurring on a global scale. The occur-
ring short-wave radiation from the sun comes into contact with the earth‘s surface and is
partly absorbed (leading to direct warming) and partly reflected as infrared radiation. The
reflected part is absorbed by so-called greenhouse gases in the troposphere and is re-
radiated in all directions, including back to earth. This results in a warming effect at the
earth‘s surface.
In addition to the natural mechanism, the greenhouse effect is enhanced by human activi-
ties. Greenhouse gases that are considered to be caused, or increased, anthropogenically
are, for example, carbon dioxide, methane and CFCs. The figure shows the main proc-
esses of the anthropogenic greenhouse effect. An analysis of the greenhouse effect
should consider the possible long term global effects.
The global warming potential is calcu-
lated in carbon dioxide equivalents
(CO2-Eq.). This means that the green-
house potential of an emission is given
in relation to CO2 Since the residence
time of the gases in the atmosphere is
incorporated into the calculation, a time
range for the assessment must also be
specified. A period of 100 years is cus-
tomary.
Figure 26: Greenhouse effect (KREISSIG & KÜMMEL 1999)
Supplement A 4 Acidification Potential (AP)
The acidification of soils and waters occurs predominantly through the transformation of
air pollutants into acids. This leads to a decrease in the pH-value of rainwater and fog
from 5.6 to 4 and below. Sulphur dioxide and nitrogen oxide and their respective acids
(H2SO4 und HNO3) produce relevant contributions. This damages ecosystems, whereby
forest dieback is the most well-known impact.
Acidification has direct and indirect damaging effects (such as nutrients being washed out
of soils or an increased solubility of metals into soils). But even buildings and building ma-
terials can be damaged. Examples include metals and natural stones which are corroded
or disintegrated at an increased rate.
When analysing acidification, it should be considered that although it is a global problem,
the regional effects of acidification can vary. The figure displays the primary impact path-
ways of acidification.
CO2 CH4
CFCs
UV - radiation
AbsorptionReflection
Infraredradiation
Trace gases in the a
tmosphere
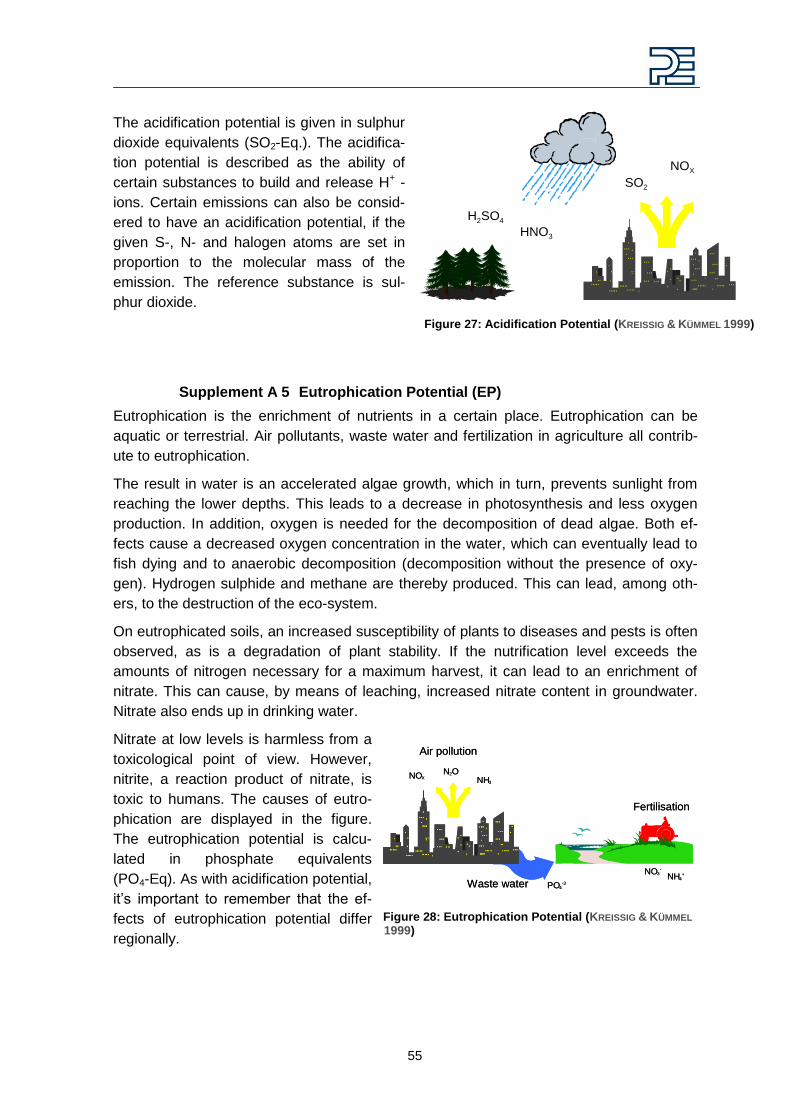
55
The acidification potential is given in sulphur
dioxide equivalents (SO2-Eq.). The acidifica-
tion potential is described as the ability of
certain substances to build and release H+ -
ions. Certain emissions can also be consid-
ered to have an acidification potential, if the
given S-, N- and halogen atoms are set in
proportion to the molecular mass of the
emission. The reference substance is sul-
phur dioxide.
Figure 27: Acidification Potential (KREISSIG & KÜMMEL 1999)
Supplement A 5 Eutrophication Potential (EP)
Eutrophication is the enrichment of nutrients in a certain place. Eutrophication can be
aquatic or terrestrial. Air pollutants, waste water and fertilization in agriculture all contrib-
ute to eutrophication.
The result in water is an accelerated algae growth, which in turn, prevents sunlight from
reaching the lower depths. This leads to a decrease in photosynthesis and less oxygen
production. In addition, oxygen is needed for the decomposition of dead algae. Both ef-
fects cause a decreased oxygen concentration in the water, which can eventually lead to
fish dying and to anaerobic decomposition (decomposition without the presence of oxy-
gen). Hydrogen sulphide and methane are thereby produced. This can lead, among oth-
ers, to the destruction of the eco-system.
On eutrophicated soils, an increased susceptibility of plants to diseases and pests is often
observed, as is a degradation of plant stability. If the nutrification level exceeds the
amounts of nitrogen necessary for a maximum harvest, it can lead to an enrichment of
nitrate. This can cause, by means of leaching, increased nitrate content in groundwater.
Nitrate also ends up in drinking water.
Nitrate at low levels is harmless from a
toxicological point of view. However,
nitrite, a reaction product of nitrate, is
toxic to humans. The causes of eutro-
phication are displayed in the figure.
The eutrophication potential is calcu-
lated in phosphate equivalents
(PO4-Eq). As with acidification potential,
it‘s important to remember that the ef-
fects of eutrophication potential differ
regionally.
Figure 28: Eutrophication Potential (KREISSIG & KÜMMEL
1999)
SO2
NOX
H2SO44
HNO3
Waste water
Air pollution
Fertilisation
PO4-3
NO3-
NH4+
NOXN2O
NH3
Waste water
Air pollution
Fertilisation
PO4-3
NO3-
NH4+
NOXN2O
NH3
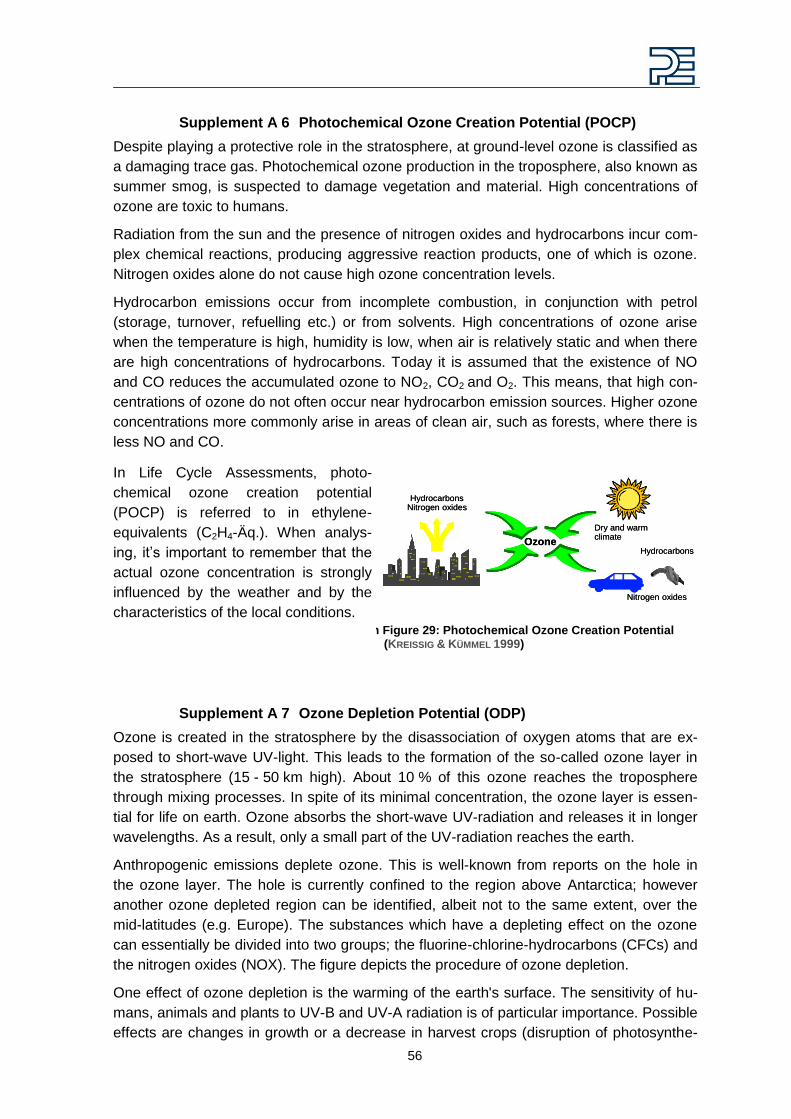
56
Supplement A 6 Photochemical Ozone Creation Potential (POCP)
Despite playing a protective role in the stratosphere, at ground-level ozone is classified as
a damaging trace gas. Photochemical ozone production in the troposphere, also known as
summer smog, is suspected to damage vegetation and material. High concentrations of
ozone are toxic to humans.
Radiation from the sun and the presence of nitrogen oxides and hydrocarbons incur com-
plex chemical reactions, producing aggressive reaction products, one of which is ozone.
Nitrogen oxides alone do not cause high ozone concentration levels.
Hydrocarbon emissions occur from incomplete combustion, in conjunction with petrol
(storage, turnover, refuelling etc.) or from solvents. High concentrations of ozone arise
when the temperature is high, humidity is low, when air is relatively static and when there
are high concentrations of hydrocarbons. Today it is assumed that the existence of NO
and CO reduces the accumulated ozone to NO2, CO2 and O2. This means, that high con-
centrations of ozone do not often occur near hydrocarbon emission sources. Higher ozone
concentrations more commonly arise in areas of clean air, such as forests, where there is
less NO and CO.
Supplement A 7 Ozone Depletion Potential (ODP)
Ozone is created in the stratosphere by the disassociation of oxygen atoms that are ex-
posed to short-wave UV-light. This leads to the formation of the so-called ozone layer in
the stratosphere (15 - 50 km high). About 10 % of this ozone reaches the troposphere
through mixing processes. In spite of its minimal concentration, the ozone layer is essen-
tial for life on earth. Ozone absorbs the short-wave UV-radiation and releases it in longer
wavelengths. As a result, only a small part of the UV-radiation reaches the earth.
Anthropogenic emissions deplete ozone. This is well-known from reports on the hole in
the ozone layer. The hole is currently confined to the region above Antarctica; however
another ozone depleted region can be identified, albeit not to the same extent, over the
mid-latitudes (e.g. Europe). The substances which have a depleting effect on the ozone
can essentially be divided into two groups; the fluorine-chlorine-hydrocarbons (CFCs) and
the nitrogen oxides (NOX). The figure depicts the procedure of ozone depletion.
One effect of ozone depletion is the warming of the earth's surface. The sensitivity of hu-
mans, animals and plants to UV-B and UV-A radiation is of particular importance. Possible
effects are changes in growth or a decrease in harvest crops (disruption of photosynthe-
In Life Cycle Assessments, photo-
chemical ozone creation potential
(POCP) is referred to in ethylene-
equivalents (C2H4-Äq.). When analys-
ing, it‘s important to remember that the
actual ozone concentration is strongly
influenced by the weather and by the
characteristics of the local conditions.
Figure 29: Photoch Figure 29: Photochemical Ozone Creation Potential (KREISSIG & KÜMMEL 1999)
HydrocarbonsNitrogen oxides
Dry and warmclimate
Hydrocarbons
Nitrogen oxides
Ozone
HydrocarbonsNitrogen oxides
Dry and warmclimate
Hydrocarbons
Nitrogen oxides
Ozone
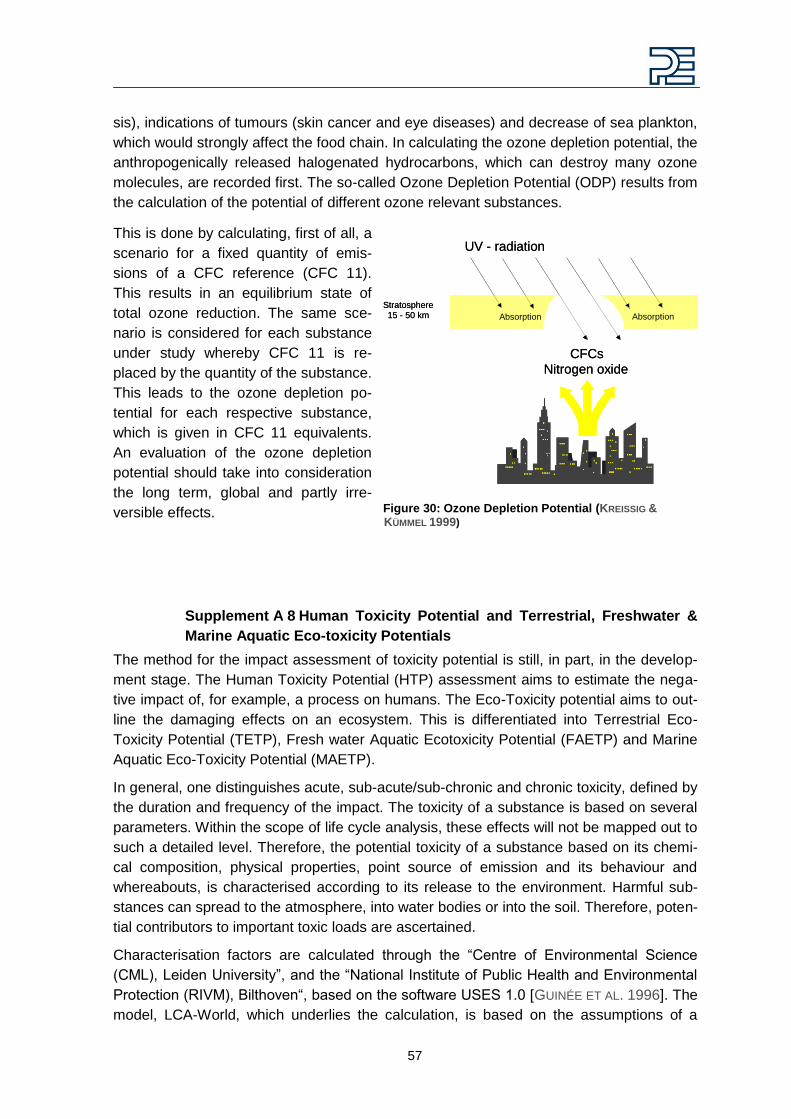
57
sis), indications of tumours (skin cancer and eye diseases) and decrease of sea plankton,
which would strongly affect the food chain. In calculating the ozone depletion potential, the
anthropogenically released halogenated hydrocarbons, which can destroy many ozone
molecules, are recorded first. The so-called Ozone Depletion Potential (ODP) results from
the calculation of the potential of different ozone relevant substances.
Supplement A 8 Human Toxicity Potential and Terrestrial, Freshwater &
Marine Aquatic Eco-toxicity Potentials
The method for the impact assessment of toxicity potential is still, in part, in the develop-
ment stage. The Human Toxicity Potential (HTP) assessment aims to estimate the nega-
tive impact of, for example, a process on humans. The Eco-Toxicity potential aims to out-
line the damaging effects on an ecosystem. This is differentiated into Terrestrial Eco-
Toxicity Potential (TETP), Fresh water Aquatic Ecotoxicity Potential (FAETP) and Marine
Aquatic Eco-Toxicity Potential (MAETP).
In general, one distinguishes acute, sub-acute/sub-chronic and chronic toxicity, defined by
the duration and frequency of the impact. The toxicity of a substance is based on several
parameters. Within the scope of life cycle analysis, these effects will not be mapped out to
such a detailed level. Therefore, the potential toxicity of a substance based on its chemi-
cal composition, physical properties, point source of emission and its behaviour and
whereabouts, is characterised according to its release to the environment. Harmful sub-
stances can spread to the atmosphere, into water bodies or into the soil. Therefore, poten-
tial contributors to important toxic loads are ascertained.
Characterisation factors are calculated through the ―Centre of Environmental Science
(CML), Leiden University‖, and the ―National Institute of Public Health and Environmental
Protection (RIVM), Bilthoven―, based on the software USES 1.0 [GUINÉE ET AL. 1996]. The
model, LCA-World, which underlies the calculation, is based on the assumptions of a
This is done by calculating, first of all, a
scenario for a fixed quantity of emis-
sions of a CFC reference (CFC 11).
This results in an equilibrium state of
total ozone reduction. The same sce-
nario is considered for each substance
under study whereby CFC 11 is re-
placed by the quantity of the substance.
This leads to the ozone depletion po-
tential for each respective substance,
which is given in CFC 11 equivalents.
An evaluation of the ozone depletion
potential should take into consideration
the long term, global and partly irre-
versible effects.
Figure 30: Ozone Depletion Potential (KREISSIG &
KÜMMEL 1999)
CFCsNitrogen oxide
Stratosphere15 - 50 km Absorption Absorption
UV - radiation
CFCsNitrogen oxide
Stratosphere15 - 50 km Absorption Absorption
UV - radiation

58
slight exchange of rainwater and air (western Europe), long residence times of sub-
stances, moderate wind and slight transposition over the system boundaries.
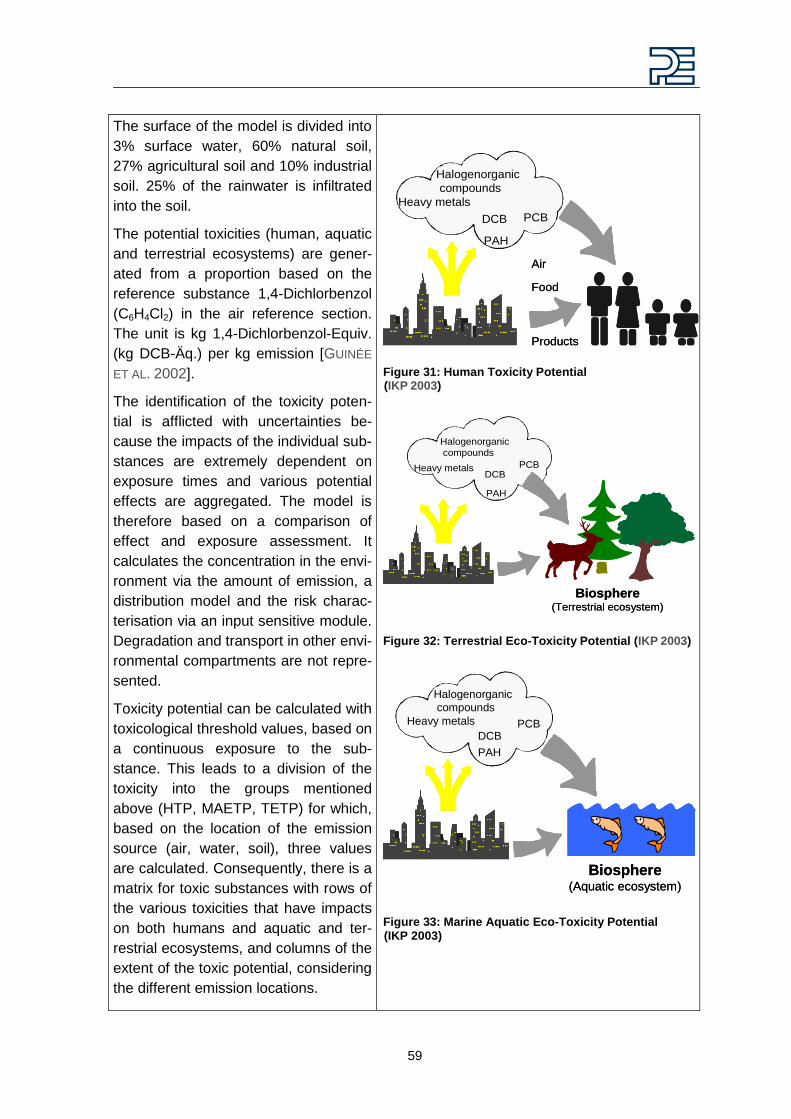
59
The surface of the model is divided into
3% surface water, 60% natural soil,
27% agricultural soil and 10% industrial
soil. 25% of the rainwater is infiltrated
into the soil.
The potential toxicities (human, aquatic
and terrestrial ecosystems) are gener-
ated from a proportion based on the
reference substance 1,4-Dichlorbenzol
(C6H4Cl2) in the air reference section.
The unit is kg 1,4-Dichlorbenzol-Equiv.
(kg DCB-Äq.) per kg emission [GUINÉE
ET AL. 2002].
The identification of the toxicity poten-
tial is afflicted with uncertainties be-
cause the impacts of the individual sub-
stances are extremely dependent on
exposure times and various potential
effects are aggregated. The model is
therefore based on a comparison of
effect and exposure assessment. It
calculates the concentration in the envi-
ronment via the amount of emission, a
distribution model and the risk charac-
terisation via an input sensitive module.
Degradation and transport in other envi-
ronmental compartments are not repre-
sented.
Toxicity potential can be calculated with
toxicological threshold values, based on
a continuous exposure to the sub-
stance. This leads to a division of the
toxicity into the groups mentioned
above (HTP, MAETP, TETP) for which,
based on the location of the emission
source (air, water, soil), three values
are calculated. Consequently, there is a
matrix for toxic substances with rows of
the various toxicities that have impacts
on both humans and aquatic and ter-
restrial ecosystems, and columns of the
extent of the toxic potential, considering
the different emission locations.
Figure 31: Human Toxicity Potential (IKP 2003)
Figure 32: Terrestrial Eco-Toxicity Potential (IKP 2003)
Figure 33: Marine Aquatic Eco-Toxicity Potential (IKP 2003)
Heavy metals
Halogenorganic
compounds
PCBDCB
PAH
Air
Food
Products
Heavy metals
Halogenorganic
compounds
PCBDCB
PAH
Air
Food
Products
Heavy metals
Halogenorganiccompounds
PCBDCB
PAH
Biosphere(Terrestrial ecosystem)
Heavy metals
Halogenorganiccompounds
PCBDCB
PAH
Biosphere(Terrestrial ecosystem)
Heavy metals
Halogenorganic
compounds
PCBDCB
PAH
Biosphere(Aquatic ecosystem)
Heavy metals
Halogenorganic
compounds
PCBDCB
PAH
Biosphere(Aquatic ecosystem)
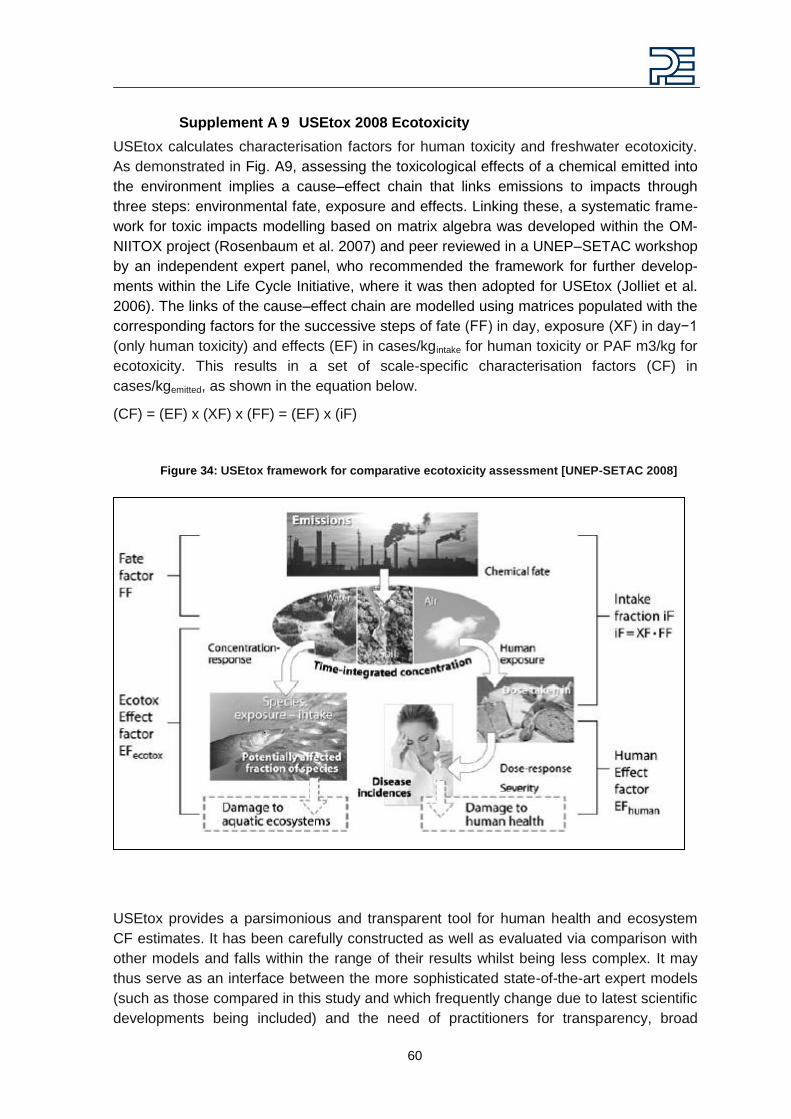
60
Supplement A 9 USEtox 2008 Ecotoxicity
USEtox calculates characterisation factors for human toxicity and freshwater ecotoxicity.
As demonstrated in Fig. A9, assessing the toxicological effects of a chemical emitted into
the environment implies a cause–effect chain that links emissions to impacts through
three steps: environmental fate, exposure and effects. Linking these, a systematic frame-
work for toxic impacts modelling based on matrix algebra was developed within the OM-
NIITOX project (Rosenbaum et al. 2007) and peer reviewed in a UNEP–SETAC workshop
by an independent expert panel, who recommended the framework for further develop-
ments within the Life Cycle Initiative, where it was then adopted for USEtox (Jolliet et al.
2006). The links of the cause–effect chain are modelled using matrices populated with the
corresponding factors for the successive steps of fate (FF) in day, exposure (XF) in day−1
(only human toxicity) and effects (EF) in cases/kgintake for human toxicity or PAF m3/kg for
ecotoxicity. This results in a set of scale-specific characterisation factors (CF) in
cases/kgemitted, as shown in the equation below.
(CF) = (EF) x (XF) x (FF) = (EF) x (iF)
Figure 34: USEtox framework for comparative ecotoxicity assessment [UNEP-SETAC 2008]
USEtox provides a parsimonious and transparent tool for human health and ecosystem
CF estimates. It has been carefully constructed as well as evaluated via comparison with
other models and falls within the range of their results whilst being less complex. It may
thus serve as an interface between the more sophisticated state-of-the-art expert models
(such as those compared in this study and which frequently change due to latest scientific
developments being included) and the need of practitioners for transparency, broad
61
stakeholder acceptance and stability of factors and methods applied in LCA. Based on a
referenced database, USEtox has been used to calculate CFs for several thousand sub-
stances and forms the basis of the recommendations from UNEP–SETAC‘s Life Cycle
Initiative regarding characterisation of toxic impacts in life cycle assessment. USEtox
therefore provides the largest substance coverage presently available in term of numbers
of chemicals covered. Furthermore, model uncertainty has partly been quantified. USEtox
thus represents a significantly improved basis for a wider application of human health and
ecotoxicity characterisation factors in LCA [UNEP-SETAC 2008].
Supplement A 10 Abiotic Depletion Potential (fossil)
The abiotic depletion potential covers all natural resources (incl. fossil energy carriers) as
metal containing ores, crude oil and mineral raw materials. Abiotic resources include all
raw materials from non-living resources that are non-renewable. This impact category
describes the reduction of the global amount of non-renewable raw materials. Non-
renewable means a time frame of at least 500 years. This impact category covers an
evaluation of the availability of natural elements in general, as well as the availability of
fossil energy carriers. The reference substance for the characterisation factors is anti-
mony.
Supplement A 11 Abiotic Depletion Potential (Elements)
APD describes the quantity of non energetic resources directly withdrawn from the geo-
sphere. It reflects the scarcity of the materials in the geosphere and is expressed in Anti-
mony equivalents. The characterization factors are published by the CML, Oers 2010.
Supplement A 12 Water use
Water is a renewable resource and in general (barring chemical reactions) it is neither
created nor destroyed. However it may change from one form to another (liquid water,
vapour/steam or ice) or change quality (i.e. become polluted).
In this assessment net water use is calculated very simply as the liquid water taken from
the environment minus the liquid water returned to the environment. Water in the form of
vapour or steam emitted to atmosphere, or water incorporated into the finished product is
considered to be lost as it is no longer directly available for reuse.
The data for this assessment have been obtained from primary sources at production
sites. Data on raw materials production, transport and other background data have been
sourced from PE datasets.
Water quality has not been assessed but to some extent this is covered by other impact
categories such as eutrophication potential.
62
Supplement B General description of wind plant components
The key component of the typical wind plant is the wind turbine. The wind turbine is bro-
ken down mainly into the nacelle, the gear & mainshaft, the cooler top, the hub, the
blades, the tower, the switch gear and the anchor. Detailed part information on the turbine
components has been taken from the bill of materials and engineering drawings. These
provide exact material and weight information down to the nuts and bolts that make up the
turbine. Other components of an onshore wind plant are the tower foundations, internal
cabling (on-site between turbines and the transformer), access roads, the wind plant
transformer and cabling from transformer to the grid. Information for these parts was
mostly taken from existing EPDs, design drawings as well as expert judgements.
Supplement B 1 Nacelle Module
The nacelle module is the most complicated component system of a wind turbine. The
figure below shows the individual components of the nacelle module.
Figure 35: V112 3.0 MW Nacelle
Most of the individual components are not manufactured by Vestas, but are purchased
from sub-suppliers. Final finishing (welding, metal cutting) and subsequent assembly
takes place at Vestas‘ factories. A description of the most significant individual compo-
nents of the nacelle module is listed below:
Main shaft
The main shaft for the wind turbine is manufactured of high-strength steel. The
main shaft is delivered to Vestas for CNC processing, and then assembled in the
nacelle.
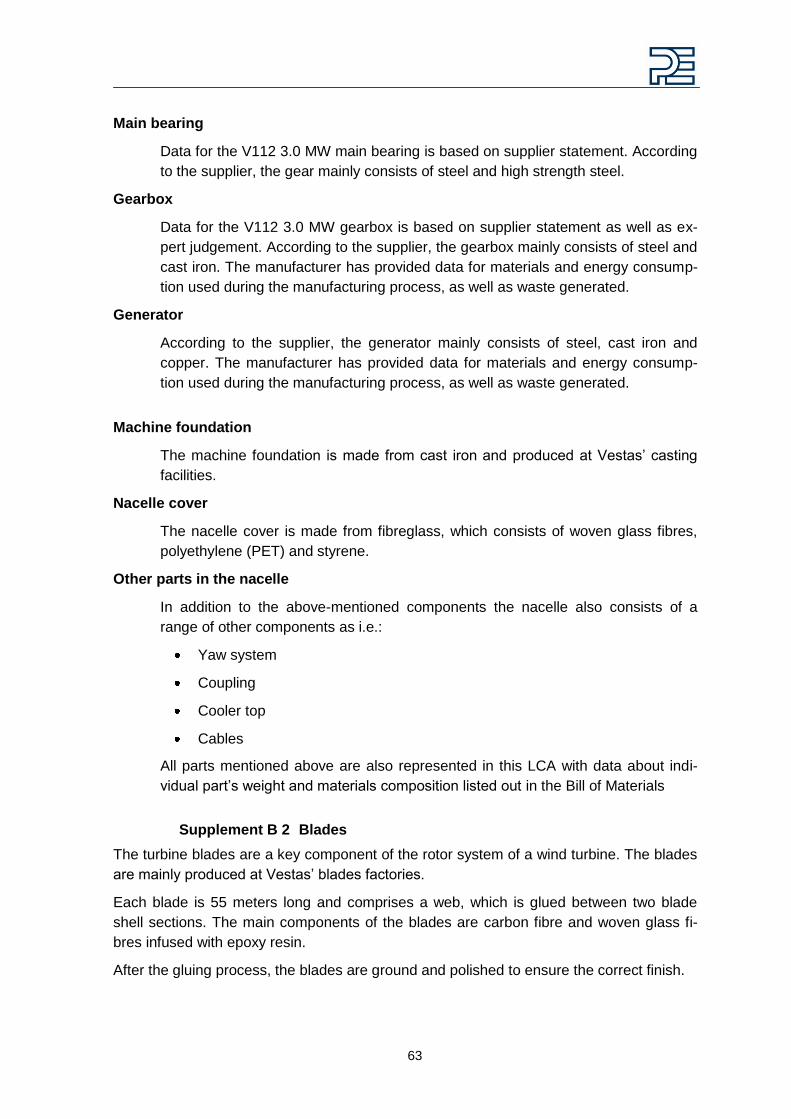
63
Main bearing
Data for the V112 3.0 MW main bearing is based on supplier statement. According
to the supplier, the gear mainly consists of steel and high strength steel.
Gearbox
Data for the V112 3.0 MW gearbox is based on supplier statement as well as ex-
pert judgement. According to the supplier, the gearbox mainly consists of steel and
cast iron. The manufacturer has provided data for materials and energy consump-
tion used during the manufacturing process, as well as waste generated.
Generator
According to the supplier, the generator mainly consists of steel, cast iron and
copper. The manufacturer has provided data for materials and energy consump-
tion used during the manufacturing process, as well as waste generated.
Machine foundation
The machine foundation is made from cast iron and produced at Vestas‘ casting
facilities.
Nacelle cover
The nacelle cover is made from fibreglass, which consists of woven glass fibres,
polyethylene (PET) and styrene.
Other parts in the nacelle
In addition to the above-mentioned components the nacelle also consists of a
range of other components as i.e.:
Yaw system
Coupling
Cooler top
Cables
All parts mentioned above are also represented in this LCA with data about indi-
vidual part‘s weight and materials composition listed out in the Bill of Materials
Supplement B 2 Blades
The turbine blades are a key component of the rotor system of a wind turbine. The blades
are mainly produced at Vestas‘ blades factories.
Each blade is 55 meters long and comprises a web, which is glued between two blade
shell sections. The main components of the blades are carbon fibre and woven glass fi-
bres infused with epoxy resin.
After the gluing process, the blades are ground and polished to ensure the correct finish.
64
Figure 36: V112 wind turbine blade
Polyurethane (PUR) glue is the primary material used to assemble blade shells and web.
Apart from the above-mentioned materials, auxiliary materials such as vacuum fleece and
various plastic films are used in the production of the blades. These materials are also
included in this LCA as part of the Bill of Materials for the V112 3.0 MW wind turbine.
Supplement B 3 Hub
The hub and spinner are also parts of the rotor system. Finished part components for the
spinner are delivered to the Vestas factories where assembly is carried out. The spinner
consists of a cover constructed of glass fibre-reinforced polyester, a blade hub made of
cast iron and internals. Information about all components, material types and weights of
these has been found in technical specifications.
The blade hub has been modelled as described in the ‗Machine foundation‘ section. All
parts mentioned above are also represented in this LCA with data about individual part
weight and material composition listed in the Bill of Materials
Supplement B 4 Tower
The tower accounts for a significant proportion of the entire wind turbine, both by size and
mass. The figure below shows the structure of the bottom section a typical wind turbine
tower and is followed by a description of the labelled parts.
The tower is 84 m high and is built for IEC IIA wind conditions. Other tower heights are
available for other wind conditions for the V112 3.0 MW turbine.
Towers for Vestas‘ turbines are to a minor extent manufactured at Vestas‘ own factories,
the majority is purchased from sub-suppliers. In this project, data from towers manufac-
tured by Vestas has been used. Considering the required technologies for producing tow-
ers, then data from Vestas‘ factory is representative for producing towers.
Towers are manufactured primarily of structural steel. The steel is delivered to Vestas in
steel plates. The steel plates are cut and the cut-off waste is recycled and modelled as
such. The steel plates are then rolled and welded into tower sections. Subsequent treat-
ment, i.e. sandblasting and surface treatment of towers is - depending on the manufactur-
ing site - either performed at Vestas or at sub-suppliers.
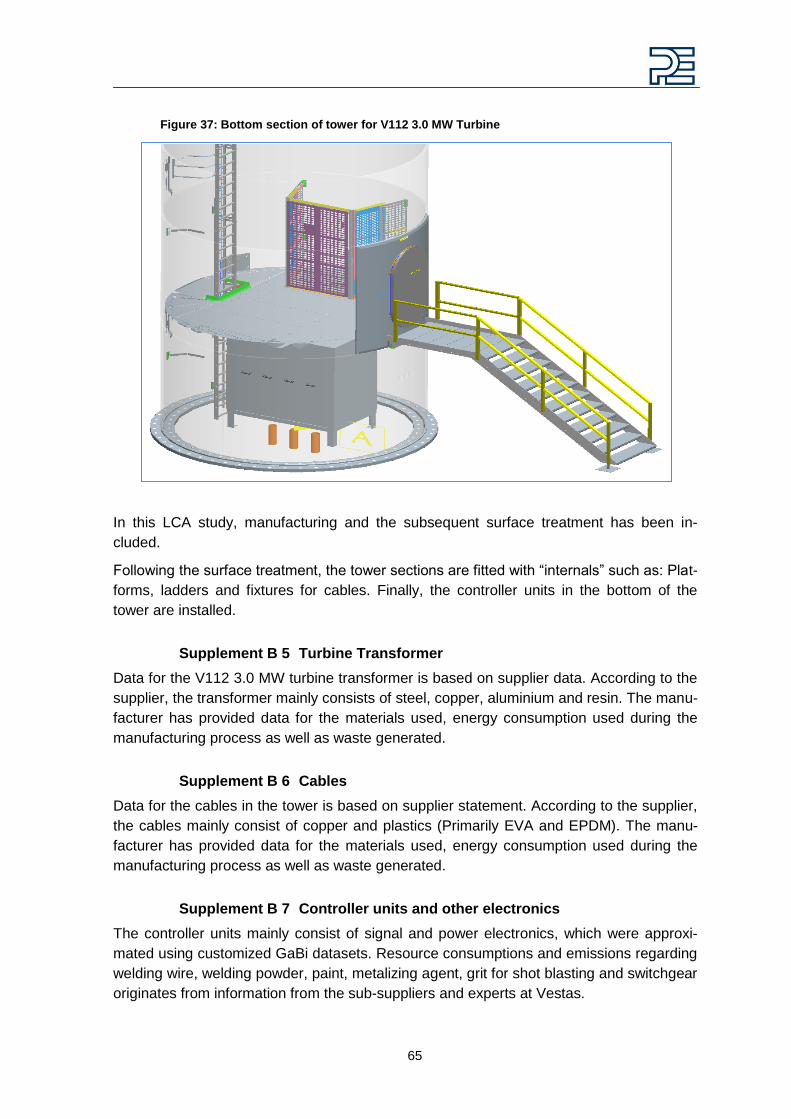
65
Figure 37: Bottom section of tower for V112 3.0 MW Turbine
In this LCA study, manufacturing and the subsequent surface treatment has been in-
cluded.
Following the surface treatment, the tower sections are fitted with ―internals‖ such as: Plat-
forms, ladders and fixtures for cables. Finally, the controller units in the bottom of the
tower are installed.
Supplement B 5 Turbine Transformer
Data for the V112 3.0 MW turbine transformer is based on supplier data. According to the
supplier, the transformer mainly consists of steel, copper, aluminium and resin. The manu-
facturer has provided data for the materials used, energy consumption used during the
manufacturing process as well as waste generated.
Supplement B 6 Cables
Data for the cables in the tower is based on supplier statement. According to the supplier,
the cables mainly consist of copper and plastics (Primarily EVA and EPDM). The manu-
facturer has provided data for the materials used, energy consumption used during the
manufacturing process as well as waste generated.
Supplement B 7 Controller units and other electronics
The controller units mainly consist of signal and power electronics, which were approxi-
mated using customized GaBi datasets. Resource consumptions and emissions regarding
welding wire, welding powder, paint, metalizing agent, grit for shot blasting and switchgear
originates from information from the sub-suppliers and experts at Vestas.

66
Supplement B 8 Anchor
The anchor component is mainly composed of steel (cage), PVC and copper (for
earthing). These materials are included in this LCA as part of the Bill of Materials for the
V112 3.0 MW wind turbine.
Supplement B 9 Foundation
The turbines are erected on foundations. Each turbine foundation is linked to an access
road and working/turning area. The construction of access roads is included in this LCA
and described in more detail in a section below. There are two kinds of foundations for the
94m tower depending on the water level.
High groundwater level - indicates a (maximum) ground water
level equal to the level of the terrain; requires more concrete
Low groundwater level – low ground water scenario
The low groundwater level case has been chosen as the base case as it represents the
majority of wind park sites. Information on the material composition of the foundations was
taken from design specifications. Construction of the foundation was not included in the
model.
Supplement B 10 Internal and External Cables
32.54 km of 32 kV PEX cables with aluminium conductor is used as internal cables for the
wind power plant, i.e. between the turbines and between the turbine plant and the
100MVA transformer. According to the supplier, the cables mainly consist of aluminium,
copper and plastic. The manufacturer has provided data for the materials used, energy
consumption used during the manufacturing process as well as waste generated.
50km of overhead cables are used to connect the park to the grid. These are mainly com-
posed of aluminium and steel. Supporting structures are not included in this study.
Supplement B 11 Wind Plant Transformer
A 100 MVA transformer has been included in the wind plant. The transformer is modelled
from an EPD from ABB on a Power transformer TrafoStar 500 MV and scaled down to
100 MVA.
Supplement B 12 Access roads
Generally a combination of tarred roads and dirt roads need to be built to provide access
to the turbines, usually located in remote optimal wind areas. Expert judgement into the
amount of road building required for the turbine park was used. This was estimated to be
about 10 km of roads for the park.

67
Supplement C Manufacturing Processes
Vestas‘ resource consumption and emissions for manufacturing of turbines is reported on
a monthly basis from each of the more than 90 sites which include all operations from cast
houses and foundries to sales offices. All of these have been included in the LCA and
grouped according to the kind of operation being carried out at the sites as shown in Ta-
ble 12. Country-specific energy mixes and auxiliary material datasets have been used for
each of the sites wherever possible. This also includes sustainable energy shares re-
ported by Vestas sites.
Table 12: Vestas manufacturing location and other sites
Factory Class Description Allocation Rule
Nacelle Assembly Factories where the nacelle is
put together
kg of nacelle produced
Tower Tower shells are fabricated
and assembled into sections
kg of tower produced
Blades Manufacturing of blades. See
Supplement B 2 for more de-
tails.
kg of blades produced
Generator Assembly of the generator MW of power shipped
Assembly Assembly of various parts of
the turbine
# turbines produced
Control Assembly Assembly of controller equip-
ment
# turbines produced
Control Manufacturing Fabrication of controller
equipment (electronics)
# turbines produced
Sales / Services / Insulation - # turbines produced
Overheads - # turbines produced
Casting Cast houses and foundries kg of metal casted
Machining Factories for machining and
finishing casted products
kg of metal machined
Since all materials that form part of the turbine are included in the bill of materials, only
auxiliaries (i.e. materials that are consumed in the process of fabrication) are included in
these manufacturing processes. Transport of raw materials is not included in the model
but a sensitivity analysis for transport has been carried out to ensure the robustness of
this assumption.
Vestas casts approximately 30% of all cast parts used in the turbine. Due to lack of sup-
plier data, the casting and machining processes from Vestas were used to proxy the cast-

68
ing and machining of larger parts of the turbine that are purchased. Metal waste from cast-
ing and machining is re-melted and used again in the fabrication process.
Other wastes are also included in the model (i.e. reported in the waste to landfill indicator)
but are not treated.
69
Supplement D Data quality evaluation
Data quality was evaluated using the Weidema methodology as described in the Interna-
tional Journal of LCA 3 (5) page 259-265; 1998, Weidema et al.; LCA data quality. The
following tables show the evaluation matrix and the evaluation.
Table 13: Data quality evaluation matrix
Table 14: Data quality evaluation results
70
Supplement E Wind Turbine Classes and Wind Conditions
Turbine wind class is one of the factors which need to be considered during the complex
process of planning a wind power plant. Wind classes determine which turbine is suitable
for the normal wind conditions of a particular site.
The DS/ EN 61400 standard specifies the essential design requirements to ensure the engineering integrity of wind turbines, including the wind turbine class. Its purpose is to provide an appropriate level of protection against damage from all hazards during the planned lifetime.
This standard is concerned with all subsystems of wind turbines, but in relation to wind, the standard specifies wind turbines for low, medium and high class designations with reference wind speed and turbulence intensity, as defined in the Table below. The wind turbine class is defined by the average annual wind speed (measured at the turbine‘s hub height), the speed of extreme gusts that could occur over 50 years, and how much turbu-lence there is at the wind site. The wind turbine class for annual average medium wind speed is assumed to be 8.0 m/s for this LCA, and 7 m/s is used for low wind turbine class when determining wind energy generation. This represents the mid-point of each wind class.
The wind turbine is functionally designed for specific wind classifications and when com-parisons are made between turbines, these should only be compared within a specific wind class for which the turbine is designed.
Table 15: Wind turbine classes
Turbine Class IEC I High Wind
IEC II Medium Wind
IEC III Low Wind
Annual average wind speed
8.5 to 10 m/s 7.5 to 8.5 m/s 6.5 to 7.5 m/s
Extreme 50-year gust 70 m/s 59.5 m/s 52.5 m/s Turbulence classes A 18% A 18% A 18% B 16% B 16% B 16%
International Electrotechnical Commission standard (IEC)
71
Supplement F Uncertainties in Life Cycle Assessments
The main assumptions made in the study and their likely effect on uncertainty in the re-
sults are described below
Foreground (primary) data
The primary data collected from the Vestas are considered to be of high quality and the
modelling has been carried out to an extremely high level of detail. GaBi DfX was used to
assess the wind turbine production down to the level of individual components. The BOM
used contained over 50,000 lines of data and was extremely comprehensive. In some
cases it was not possible to map every item to an existing dataset and 1.1% (w/w) of ma-
terials were unknown. These materials were assigned the average impacts of the rest of
the wind turbine.
Manufacturing data were based on average production in Vestas global production facili-
ties as described in supplement C and are also considered to be of high quality.
Background (secondary) data
A major source of uncertainty in any LCA study is the use of background (secondary) data
rather than primary data specific to the system being studied. This study is a model of a
theoretical wind plant so it is not possible to specify how accurate and representative the
background data are, as this would be dependent upon the location of an actual wind
plant. However, for issues relating to wind power technology it is reasonable to assume
that the same production processes will be applied regardless of location so it is not ex-
pected that this will lead to major inaccuracies in the results.
Allocation
Allocation was applied to the production data as described in supplement C. Different al-
location rules would generate different results but the ones selected are based on physical
properties of the system and are the preferred approach specified in the ISO standards for
LCA. Allocation may also be applied in some of the background datasets used in the
model. These assumptions are described in the dataset documentation [PE INTERNA-
TIONAL 2006]. These datasets have been used as received and the allocation procedures
have not been modified.
Impact assessment
Uncertainty is also introduced in the impact assessment phase of the study—and this will
vary according the impact categories considered. The main issues are completeness
(does the impact assessment methodology consider all potential contributing emissions?)
and characterization (has the degree of impact caused by each species been character-
ised properly?). Some impact categories, such as global warming, are considered rela-
tively robust in both of these aspects, others, such as human toxicity and eco-toxicity, are
much less well developed and consequently less robust.
72
Supplement G Life cycle inventory
Life cycle inventory results presented in the table below account for significant flows for 1 kWh of electricity supplied to the grid.
Table 16: LCI data for 1 kWh of wind power production (including recycling credit)
Energy resources, kg TOTAL Wind turbine
Founda-tions
Trans-former
Wind plant set up
Site operations End of life
Non renewable energy resources
Crude oil 6.40E-04 4.83E-04 3.86E-05 3.50E-06 1.14E-04 2.67E-05 -2.54E-05
Hard coal 5.22E-04 1.42E-03 1.16E-04 5.77E-06 2.38E-05 9.49E-05 -1.14E-03
Lignite 6.91E-04 4.96E-04 5.99E-05 4.02E-06 2.77E-05 3.53E-05 6.79E-05
Natural gas 7.25E-04 5.58E-04 3.37E-05 3.09E-06 2.11E-05 3.07E-05 7.79E-05
Renewable energy resources
Renewable fuels 1.27E-06 1.17E-06 5.58E-10 2.18E-11 9.13E-13 1.14E-07 -1.60E-08
Wood 4.53E-06 4.32E-06 1.37E-07 1.89E-10 1.32E-09 3.58E-08 3.60E-08
Material resources, kg TOTAL Wind turbine
Founda-tions
Trans-former
Wind plant set up
Site operations End of life
Non renewable elements
Chromium 1.92E-06 1.74E-06 2.13E-12 2.99E-21 2.49E-18 1.79E-07 -1.26E-17
Copper 4.60E-06 4.60E-06 4.26E-11 4.33E-20 7.81E-15 6.08E-13 -2.97E-16
Nickel 1.42E-06 1.30E-06 1.86E-14 4.44E-12 7.05E-16 1.21E-07 -1.15E-16
Non renewable resources
Basalt 7.12E-06 7.01E-06 1.40E-06 8.76E-08 2.72E-07 1.55E-06 -3.21E-06
Bauxite 1.60E-04 1.95E-04 1.68E-05 3.68E-07 4.76E-05 3.14E-05 -1.31E-04
Bentonite 3.34E-06 1.58E-06 1.04E-06 1.09E-08 1.44E-07 8.48E-08 4.78E-07
73
Material resources, kg TOTAL Wind turbine
Founda-tions
Trans-former
Wind plant set up
Site operations End of life
Cables 34 4.88E-05 4.88E-05 0.00E+00 0.00E+00 0.00E+00 9.77E-14 0.00E+00
Chromium ore (39%) 1.08E-04 8.90E-05 5.84E-08 6.83E-11 7.99E-10 1.85E-05 1.33E-08
Clay 1.83E-04 -1.76E-06 2.65E-05 -1.18E-09 5.02E-08 2.69E-07 1.57E-04
Colemanite ore 2.02E-05 2.02E-05 3.34E-09 9.70E-12 7.53E-11 6.94E-08 5.08E-10
Copper - Gold - Ore (1,07% Cu; 0,54 g/t Au) -9.53E-06 5.45E-07 1.11E-09 8.42E-12 0.00E+00 1.12E-09 -1.01E-05
Copper - Gold - Silver - ore (0,51% Cu; 0,6 g/t Au; 1,5 g/t Ag) -2.74E-05 1.57E-06 3.21E-09 2.43E-11 0.00E+00 3.24E-09 -2.90E-05
Copper - Gold - Silver - ore (1,0% Cu; 0,4 g/t Au; 66 g/t Ag) 6.17E-04 4.65E-04 1.36E-08 4.04E-05 6.01E-05 5.09E-05 -9.84E-09
Copper - Gold - Silver - ore (1,1% Cu; 0,01 g/t Au; 2,86 g/t Ag) -1.18E-03 2.87E-04 1.81E-07 2.46E-05 3.66E-05 3.12E-05 -1.56E-03
Copper - Gold - Silver - ore (1,13% Cu; 1,05 g/t Au; 3,72 g/t Ag) -2.92E-04 2.12E-05 3.46E-08 2.62E-10 0.00E+00 3.49E-08 -3.13E-04
Copper - Gold - Silver - ore (1,16% Cu; 0,002 g/t Au; 1,06 g/t Ag) -6.67E-04 1.62E-04 1.02E-07 1.39E-05 2.07E-05 1.76E-05 -8.82E-04
Copper - Gold - Silver - ore (1,7% Cu; 0,7 g/t Au; 3,5 g/t Ag) -2.32E-05 3.42E-07 2.61E-09 1.97E-11 0.00E+00 2.63E-09 -2.36E-05
Copper - Molybdenum - Gold - Silver - ore (1,13% Cu; 0,02% Mo; 0,01 g/t Au; 2,86 g/t Ag) 6.43E-05 4.31E-05 4.28E-09 2.11E-10 4.67E-09 2.12E-05 -3.69E-09
Copper - Silver - ore (3,3% Cu; 5,5 g/t Ag) -1.54E-05 8.81E-07 1.80E-09 1.36E-11 0.00E+00 1.82E-09 -1.63E-05
Copper ore (0.14%) 7.60E-06 7.98E-06 4.08E-07 2.75E-09 1.07E-08 8.67E-07 -1.67E-06
Copper ore (1.2%) 6.40E-05 4.83E-05 1.41E-09 4.19E-06 6.24E-06 5.28E-06 -1.02E-09
Copper ore (sulphidic, 1.1%) 2.31E-05 2.31E-05 -8.64E-15 -1.87E-17 6.85E-14 3.21E-09 1.09E-13
Dolomite 3.10E-05 4.00E-05 1.44E-05 1.63E-08 1.01E-07 2.19E-06 -2.58E-05
Fluorspar (calcium fluoride; fluorite) 1.71E-06 1.92E-06 1.07E-07 6.44E-10 3.45E-07 2.66E-07 -9.20E-07
Gypsum (natural gypsum) 2.75E-05 -3.11E-06 2.18E-05 -2.20E-09 1.71E-08 -2.06E-07 9.01E-06
Heavy spar (BaSO4) 5.30E-06 4.19E-06 3.10E-07 2.67E-08 3.46E-07 2.31E-07 1.94E-07
Inert rock 8.14E-03 1.59E-02 1.32E-03 1.66E-04 5.74E-04 1.32E-03 -1.11E-02
Iron ore (56,86%) -2.68E-04 1.65E-03 1.53E-04 8.06E-06 3.54E-06 1.25E-04 -2.21E-03
Iron ore (65%) 7.32E-06 -9.39E-07 5.73E-06 -8.97E-10 1.10E-09 -6.28E-08 2.59E-06
74
Material resources, kg TOTAL Wind turbine
Founda-tions
Trans-former
Wind plant set up
Site operations End of life
Kaolin ore 4.20E-05 4.05E-05 5.38E-07 3.18E-09 9.53E-11 1.44E-06 -4.38E-07
Lead - Zinc - Silver - ore (5,49% Pb; 12,15% Zn; 57,4 gpt Ag) -1.80E-05 -5.01E-06 9.71E-08 3.55E-09 4.30E-10 -3.19E-07 -1.27E-05
Lead - zinc ore (4.6%-0.6%) 9.12E-05 9.35E-05 2.06E-06 5.21E-09 3.34E-07 4.49E-06 -9.20E-06
Limestone (calcium carbonate) 1.27E-03 3.82E-04 8.46E-04 2.11E-06 4.68E-06 3.33E-05 -7.65E-07
Magnesium chloride leach (40%) 9.38E-06 7.81E-06 2.73E-07 1.99E-08 8.41E-08 4.58E-07 7.30E-07
Manganese ore (R.O.M.) 1.31E-05 2.51E-05 3.03E-06 8.56E-08 7.11E-08 3.44E-06 -1.87E-05
Molybdenite (Mo 0,24%) 3.92E-05 2.63E-05 2.63E-09 1.29E-10 2.85E-09 1.29E-05 -2.27E-09
Natural Aggregate 5.78E-03 5.27E-04 3.30E-03 1.27E-07 1.54E-03 1.90E-04 2.23E-04
Nickel ore (1,5%) 2.36E-05 2.53E-05 1.08E-07 1.11E-09 2.10E-13 1.12E-07 -1.84E-06
Nickel ore (1.6%) 5.03E-05 4.40E-05 6.95E-08 2.76E-07 1.30E-07 6.60E-06 -8.06E-07
Perlite (Rhyolithe) 3.18E-05 2.25E-05 2.86E-06 0.00E+00 0.00E+00 6.46E-06 0.00E+00
Phosphorus ore (29% P2O5) 1.32E-06 1.04E-06 1.23E-07 1.74E-10 2.31E-16 2.88E-07 -1.31E-07
Precious metal ore (R.O.M) 1.09E-06 1.11E-06 1.82E-09 2.00E-11 1.40E-10 2.58E-09 -1.98E-08
Quartz sand (silica sand; silicon dioxide) 2.40E-04 1.67E-04 2.33E-06 9.35E-07 1.94E-06 4.69E-06 6.28E-05
Rare-earth ore 1.04E-04 7.64E-05 0.00E+00 0.00E+00 0.00E+00 2.72E-05 0.00E+00
Raw pumice 2.19E-06 7.70E-09 2.18E-06 1.61E-12 8.91E-12 8.43E-10 8.81E-11
Sodium chloride (rock salt) 1.39E-04 1.36E-04 2.44E-06 3.13E-07 1.40E-06 4.93E-06 -5.82E-06
Soil 1.31E-03 2.25E-04 6.69E-04 3.22E-07 3.10E-04 4.16E-05 6.65E-05
Talc 1.24E-06 1.23E-06 1.78E-10 2.79E-13 1.63E-11 4.25E-09 3.84E-11
Titanium ore 4.06E-06 5.18E-06 1.04E-07 7.39E-10 2.06E-09 7.54E-08 -1.30E-06
Vanadium ore (ROM) -1.01E-05 1.11E-06 2.43E-06 1.29E-08 0.00E+00 1.66E-06 -1.53E-05
Zinc - copper ore (4.07%-2.59%) 1.28E-04 1.03E-04 1.01E-07 9.17E-06 1.37E-05 1.14E-05 -9.28E-06
Zinc - lead - copper ore (12%-3%-2%) 1.00E-04 7.86E-05 4.67E-08 6.90E-06 1.03E-05 8.64E-06 -3.99E-06
Zinc - Lead - Silver - Ore (7,5% Zn; 4,0% Pb; 40,8 g/t Ag) -5.47E-05 -1.53E-05 2.95E-07 1.08E-08 0.00E+00 -9.71E-07 -3.87E-05
Zinc - Lead - Silver - ore (8,54% Zn; 5,48% Pb; 94 g/t Ag) -8.37E-06 4.79E-07 9.79E-10 7.40E-12 0.00E+00 9.87E-10 -8.85E-06
75
Material resources, kg TOTAL Wind turbine
Founda-tions
Trans-former
Wind plant set up
Site operations End of life
Renewable resources
Water 2.70E-02 2.96E-02 3.88E-03 5.79E-05 5.93E-04 2.13E-03 -9.18E-03
Air 3.69E-02 3.08E-02 1.30E-03 1.37E-04 8.19E-04 1.92E-03 1.99E-03
Carbon dioxide 1.47E-04 1.41E-04 7.23E-06 1.97E-06 3.14E-06 1.15E-05 -1.78E-05
Nitrogen 2.37E-06 1.94E-06 2.69E-08 -2.46E-10 4.13E-07 -9.97E-09 -2.96E-10
Oxygen -5.64E-05 -5.93E-05 -3.95E-06 -1.47E-06 -2.17E-06 -6.12E-06 1.66E-05
Emissions to air, kg TOTAL Wind turbine
Founda-tions
Trans-former
Wind plant set up
Site operations End of life
Inorganic emissions to air
Carbon dioxide 5.78E-03 6.88E-03 8.14E-04 3.28E-05 2.22E-04 4.31E-04 -2.60E-03
Carbon dioxide (biotic) 2.65E-05 8.34E-06 1.47E-05 2.02E-08 9.38E-07 1.06E-06 1.50E-06
Carbon monoxide 4.72E-06 3.46E-05 3.89E-06 1.02E-07 2.26E-07 2.45E-06 -3.66E-05
Nitrogen (atmospheric nitrogen) 1.46E-04 1.46E-04 8.76E-08 8.99E-08 5.40E-08 6.03E-07 -3.19E-07
Nitrogen oxides 1.44E-05 1.31E-05 1.77E-06 5.73E-08 4.96E-07 8.53E-07 -1.87E-06
Oxygen 5.30E-05 4.63E-05 1.14E-06 1.30E-08 1.43E-07 2.42E-06 2.98E-06
Steam 1.08E-02 7.61E-03 4.43E-04 5.14E-05 1.19E-03 5.66E-04 9.23E-04
Sulphur dioxide 1.64E-05 1.79E-05 9.94E-07 9.79E-08 9.07E-07 1.32E-06 -4.82E-06
Organic emissions to air (group VOC)
Non-methane VOC (unspecified) 2.13E-06 2.14E-06 9.17E-08 4.35E-09 3.55E-08 6.91E-08 -2.10E-07
Methane 1.38E-05 1.63E-05 1.25E-06 6.03E-08 6.50E-07 7.91E-07 -5.23E-06
VOC (unspecified) 1.43E-05 1.40E-05 8.71E-08 1.48E-10 3.64E-10 2.08E-07 3.06E-09
Other emissions to air
Exhaust 2.36E-02 1.86E-02 8.80E-04 1.06E-04 6.73E-04 1.12E-03 2.26E-03
Used air 1.55E-03 1.48E-03 2.43E-05 4.75E-06 4.32E-06 7.20E-05 -2.93E-05
Particles to air
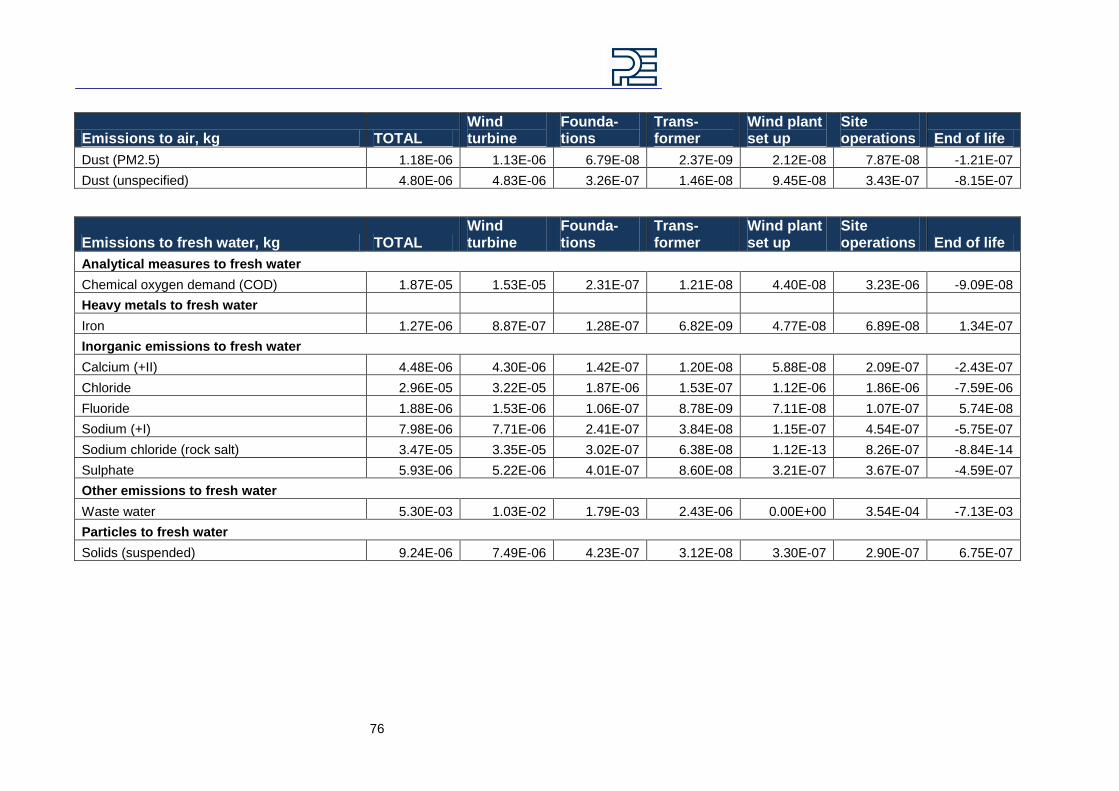
76
Emissions to air, kg TOTAL Wind turbine
Founda-tions
Trans-former
Wind plant set up
Site operations End of life
Dust (PM2.5) 1.18E-06 1.13E-06 6.79E-08 2.37E-09 2.12E-08 7.87E-08 -1.21E-07
Dust (unspecified) 4.80E-06 4.83E-06 3.26E-07 1.46E-08 9.45E-08 3.43E-07 -8.15E-07
Emissions to fresh water, kg TOTAL Wind turbine
Founda-tions
Trans-former
Wind plant set up
Site operations End of life
Analytical measures to fresh water
Chemical oxygen demand (COD) 1.87E-05 1.53E-05 2.31E-07 1.21E-08 4.40E-08 3.23E-06 -9.09E-08
Heavy metals to fresh water
Iron 1.27E-06 8.87E-07 1.28E-07 6.82E-09 4.77E-08 6.89E-08 1.34E-07
Inorganic emissions to fresh water
Calcium (+II) 4.48E-06 4.30E-06 1.42E-07 1.20E-08 5.88E-08 2.09E-07 -2.43E-07
Chloride 2.96E-05 3.22E-05 1.87E-06 1.53E-07 1.12E-06 1.86E-06 -7.59E-06
Fluoride 1.88E-06 1.53E-06 1.06E-07 8.78E-09 7.11E-08 1.07E-07 5.74E-08
Sodium (+I) 7.98E-06 7.71E-06 2.41E-07 3.84E-08 1.15E-07 4.54E-07 -5.75E-07
Sodium chloride (rock salt) 3.47E-05 3.35E-05 3.02E-07 6.38E-08 1.12E-13 8.26E-07 -8.84E-14
Sulphate 5.93E-06 5.22E-06 4.01E-07 8.60E-08 3.21E-07 3.67E-07 -4.59E-07
Other emissions to fresh water
Waste water 5.30E-03 1.03E-02 1.79E-03 2.43E-06 0.00E+00 3.54E-04 -7.13E-03
Particles to fresh water
Solids (suspended) 9.24E-06 7.49E-06 4.23E-07 3.12E-08 3.30E-07 2.90E-07 6.75E-07

77
Emissions to sea water TOTAL Wind turbine
Founda-tions
Trans-former
Wind plant set up
Site operations End of life
Inorganic emissions to sea water
Chloride 2.38E-05 1.72E-05 1.46E-06 1.38E-07 5.15E-06 1.00E-06 -1.22E-06
Other emissions to sea water
Waste water 8.11E-05 7.27E-05 0.00E+00 0.00E+00 0.00E+00 8.33E-06 0.00E+00
Emissions to industrial soil, kg TOTAL Wind turbine
Founda-tions
Trans-former
Wind plant set up
Site operations End of life
Inorganic emissions to industrial soil
Calcium (+II) 9.83E-06 1.69E-09 2.75E-10 1.18E-11 2.48E-10 2.00E-10 9.83E-06

78