Final Report - Science Searchsciencesearch.defra.gov.uk/...Document=13933_BE0112FinalReport.pdf ·...
13
1 Provision of Evidence Statements to accompany the UK and England Species Trend Indicators and an Overview of the Causes of Biodiversity Change Project Reference BE0112 Final Report September 2016 Lead authors: Nick Isaac 1 , Mark Eaton 2 , Contributing authors: Fiona Burns 2 , Rob Dyer 1 , Richard Gregory 2 , Jodey Peyton 1 & David Roy 1 Taxonomic Experts: Tom Brereton 3 , Katherine Boughey 4 , Claire Carvell 1 , Nida al-Fulajj 5 , Steve Langton 6 , David Noble 7 , Chris Shortall 8 & Adam Vanbergen 1 Delphi Panel: Colin Beale 9 , Steve Buckland 10 , Ben Collen 11 , Robin Freeman 12 , Jenny Gill 13 , David Hodgson 14 , Kate Jones 11 , Ken Norris 12 , Helen Roy 1 , Phil Stephens 15 , Mark Stevenson 16 & William Sutherland 17 Project Officer: Natasha Lewis (nee Chick) Project Board: Andy Stott (Defra), Christine Holleran (Defra), James Williams (JNCC), David Allen (NRW) & Dave Johnston (NRW). Name and address of Contractor: NERC Centre for Ecology & Hydrology, Maclean Building, Benson Lane, Crowmarsh Gifford, Wallingford, Oxon OX10 8BB, UK Name and address of Sub-contractor: Centre for Conservation Science, Royal Society for the Protection of Birds, The Lodge, Sandy, Beds SG19 2DL Contractor’s Project Manager: Dr Nick Isaac Project start date: 19 January 2015; End date: 31 March 2016 Affiliations 1. NERC Centre for Ecology & Hydrology 2. Royal Society of the Protection of Birds 3. Butterfly Conservation 4. Bat Conservation Trust 5. People’s Trust for Endangered Species 6. Langton Statistical Consultancy 7. British Trust for Ornithology 8. Rothamsted Research 9. University of York 10. University of St Andrews 11. University College London 12. Zoological Society of London 13. University of East Anglia 14. University of Exeter 15. University of Durham 16. Defra 17. University of Cambridge
Transcript of Final Report - Science Searchsciencesearch.defra.gov.uk/...Document=13933_BE0112FinalReport.pdf ·...

1
Provision of Evidence Statements to accompany the UK and England Species Trend
Indicators and an Overview of the Causes of Biodiversity Change
Project Reference BE0112
Final Report September 2016
Lead authors: Nick Isaac1, Mark Eaton2,
Contributing authors: Fiona Burns2, Rob Dyer1, Richard Gregory2, Jodey Peyton1 & David Roy1
Taxonomic Experts: Tom Brereton3, Katherine Boughey4, Claire Carvell1, Nida al-Fulajj5, Steve Langton6, David Noble7, Chris Shortall8 & Adam Vanbergen1
Delphi Panel: Colin Beale9, Steve Buckland10, Ben Collen11, Robin Freeman12, Jenny Gill13, David Hodgson14, Kate Jones11, Ken Norris12, Helen Roy1, Phil Stephens15, Mark Stevenson16 & William Sutherland17
Project Officer: Natasha Lewis (nee Chick)
Project Board: Andy Stott (Defra), Christine Holleran (Defra), James Williams (JNCC), David Allen (NRW) & Dave Johnston (NRW).
Name and address of Contractor: NERC Centre for Ecology & Hydrology, Maclean Building, Benson Lane, Crowmarsh Gifford, Wallingford, Oxon OX10 8BB, UK
Name and address of Sub-contractor: Centre for Conservation Science, Royal Society for the Protection of Birds, The Lodge, Sandy, Beds SG19 2DL
Contractor’s Project Manager: Dr Nick Isaac
Project start date: 19 January 2015; End date: 31 March 2016
Affiliations
1. NERC Centre for Ecology & Hydrology 2. Royal Society of the Protection of Birds 3. Butterfly Conservation 4. Bat Conservation Trust 5. People’s Trust for Endangered Species 6. Langton Statistical Consultancy 7. British Trust for Ornithology 8. Rothamsted Research 9. University of York
10. University of St Andrews 11. University College London 12. Zoological Society of London 13. University of East Anglia 14. University of Exeter 15. University of Durham 16. Defra 17. University of Cambridge

2
Executive Summary The set of “UK Biodiversity Indicators” includes 11 indicators which show changes in the status of
wildlife through a series of species trend assessments. We have produced a set of Evidence
Statements (Annex 1) to ensure that interpretation of trends, causal factors and relationship to
policy interventions is rigorous, objective and reflects scientific consensus. The Evidence
Statements for each of the 11 indicators have a common format with five sections: 1) a
background section describing the underlying datasets and the species they contain; 2) sets of
bullet points stating what the indicator represents and placing limits on how the line should be
interpreted; 3) a description of how the indicator has changed over time, and the strength of
evidence linking changes in the indicator with changes in the species that contribute; 4) the
wider relevance to ecosystem services, where known, and biodiversity targets; and 5) a review of
evidence about the factors driving change in the indicator line.
The eleven species indicators report on a broad range of organisms, but the taxonomic coverage
remains biased towards charismatic vertebrates: five of the eleven indicators contain only birds
and a sixth contains only bats. There are three indicators for insects, of which two contain only
butterflies. The other two indicators are for species categorised as conservation priorities,
comprising some birds and mammals, a large number of moths and other terrestrial insects, and
a small number of plants. There are substantial differences in the trends of the eleven indicators,
suggesting that no one taxon can represent the whole of biodiversity adequately. Thus, the
broadened taxonomic coverage of the current indicator set presents a fuller but more complex
picture of how biodiversity has changed over recent decades.
The datasets that contribute to the indicators contain a range of biases. Many of these biases are
well-known, such as the spatial bias caused by schemes that allow volunteers to select the
locations of monitoring sites. In general, we find that indicators based on data with the fewest
biases also contain the most complete forms of bias correction. At one extreme, the Breeding
Bird Survey contains the lowest overall spatial bias, but the wild bird indicators to which it
contributes are the only indicators that contain a correction for spatial bias.
There are substantial differences in how the indicators are constructed from raw data. In part
these differences reflect the biases in the underlying data, and the decisions on choices about
which species should be included. However, the biggest differences lie in whether the headline
indicator is statistically smoothed and, if so, how the smoothing is conducted. These and other
differences mean that confidence intervals around the indicator line represent different aspects
of the overall uncertainty in different indicators. Harmonising the production of species
indicators around a set of common standards would therefore make it easier to communicate
what the indicators represent.
One feature that the indicators share is that uncertainty is measured relative to the index value
in the first year (typically set at 100). This has the peculiar property that confidence intervals
tend to become progressively wider over time. This is both undesirable and counter-intuitive,
because the quantity of data generally increases over time and the first year is typically the one
with the least data. A variety of alternative statistical treatments exist, each of which has
different implications for how uncertainty in the headline indicator can be presented and
interpreted.
There is little published evidence linking changes in species populations at a national scale, to
changes in the provision of ecosystem services, and so the current indicators, with the exception
of pollinating insects, cannot be used as service indicators.

3
The indicators show how some aspects of the natural environment are changing, but would need
to be supplemented with additional data or qualitative assessment to draw conclusions about
progress to international targets such as those in the CBD Strategic Plan.
We conducted a structured review using expert opinion to score the relative importance of
putative drivers of biodiversity trends. We assessed a representative sample of 398 species that
contribute to the indicators using a peer-reviewed framework for assessing drivers of change and
their impacts (both positive and negative). We collated these scores to identify the principle
drivers for each of the eleven species trend indicators. Across all indicators, our review found
that agricultural intensification has been the principle driver of change in UK biodiversity. This
review, covering drivers of change across the eleven species trend indicators, is presented as
Annex 2.
We used a modified Delphi technique to determine whether the Evidence Statements are an
adequate reflection and synthesis of the available evidence. A panel of independent experts
scored their level of agreement with 139 assertions within the Evidence Statements. Assertions
for which there was no consensus were discussed, rewritten and rescored at a workshop. The
mean agreement score and the consensus among delegates were used to assign confidence
ratings to each assertion. The Delphi technique provided a transparent way to synthesize a large
body of evidence without being overly influenced by the opinions of individual experts. In this
way, we were able to review and fine tune the Evidence Statements for each indicator.

4
Contents Executive Summary ................................................................................................................................. 2
1. Introduction and aims ......................................................................................................................... 5
2. The Evidence Statements .................................................................................................................... 6
2.1 Structure and format ..................................................................................................................... 6
2.2 Existing examples of Evidence Statements ................................................................................... 7
2.3. Drafting and revising the Evidence Statements ........................................................................... 7
3. Assessing confidence via a Delphi process .......................................................................................... 8
3.1. The Delphi Panel ........................................................................................................................... 8
3.2. Delphi part 1: Assessment by online survey................................................................................. 8
3.3. Identifying assertions with disagreement .................................................................................... 9
3.4. Delphi part 2: Workshop & re-scoring ........................................................................................ 10
3.5. Assigning confidence .................................................................................................................. 12
4. References ......................................................................................................................................... 13

5
1. Introduction and aims The “UK Biodiversity Indicators” (UKBI) is an annual compendium of figures and statistics about the state of biodiversity, pressures upon it, the response of biodiversity to those pressures, and about the benefits that people derive from biodiversity. There are eleven indicators showing changes in the status of wildlife through a series of species trend assessments. UKBI includes eleven ‘species indicators’, all of which are generated from observations of wild animals (table 1). Further information about these indicators, including how they are constructed and assessed, can be found in Section 2 of Annex 3 (Summary of Evidence).
Table 1: The eleven species trend indicators under consideration in BE0112. Species numbers refer to the 2014 indicator set: for 2015 two indicators were substantially overhauled (C4b and D1c) and one (C5d) experienced minor changes in species composition.
Indicator Indicator reference
Number of species
Priority Species [Abundance] C4a 213 Priority Species [Distribution] C4b 179 Farmland birds C5a 19 Woodland birds C5b 37 Wetland birds C5c 26 Seabirds C5d 14 Wintering waterbirds C5e 46 Insects [Habitat specialists] C6a 26 Insects [Wider countryside] C6b 24 Mammals [Bats] C8a 8 Pollinating insects D1c 216
In late 2014, Defra commissioned this project (BE0112) to undertake a formal review of evidence about the species trend indicators at UK and England levels. The project included the following deliverables:
1. A set of Evidence Statements, with associated measures of confidence, to accompany publication of the eleven species indicators. The evidence statements are intended to provide context for how the trend lines should be interpreted.
2. A synoptic report looking across all indicators, providing an overview of the causes of biodiversity change.
These two deliverables are presented as Annexes 1 and 2. Both are built upon an evidence base that was gathered in two parallel work packages: 1) a comparative study of the indicators and their statistical properties (including spatio-temporal biases), and 2) a structured literature review on drivers of change. The totality of evidence gathered by these two work packages constitutes Annex 3 – Summary of Evidence. Section 2 of this document defines the scope of the Evidence Statements and how they were written. Section 3 describes the Delphi process that was used to assign measures of confidence to the statements.
The contract was awarded to a consortium comprising the Centre for Ecology & Hydrology (CEH) and the Royal Society for the Protection of Birds (RSPB) and ran from January 2015 until March 2016. The project ran in parallel with an ad hoc Panel to Quality Assure the Species Trend Indicators (BE0102), chaired by Professor Ken Norris. A report by the QA panel entitled “Review of UK biodiversity indicators that provide status and trends for species” was used as a supplementary source of material for the Evidence Statements.

6
2. The Evidence Statements The Evidence Statements are primarily written for policy advisers at Defra and related conservation bodies (e.g. JNCC, NE, SNH), and interested stakeholders. The biodiversity indicators are used for a diverse set of applications, including reviewing the status of biodiversity, assessing the impacts of policy interventions, measuring progress against national and international obligations (including the Aichi targets) and informing the Natural Capital agenda. The Evidence Statements have been written to provide guidance on what the indicators do, and do not, show, and to place limits on the kinds of applications that are appropriate. The Evidence Statements help increase the usefulness of the indicators to policy makers and other stakeholders, by improving understanding and increasing their confidence in the indicators.
2.1 Structure and format The Evidence Statements are written as a set of stand-alone documents (one for each of the eleven species trend indicators) of around 1000 words each. These documents collectively constitute Annex 1. The contents of each document are a synthesis of the material in Annex 3 (the Summary of Evidence), supplemented by material from other sources (particularly the indicator fiches and technical background documents on the JNCC website: http://jncc.defra.gov.uk/page-1824).
The Evidence Statements for each indicator are written in a common style and similar phrases appear in the statements for each indicator. The statements are written in five sections:
A. Background: 3-5 bullet points describing the species composition of the indicator, the raw data that contribute to the indicator, known biases in those data, and the statistical tools used to construct and assess the indicator.
B. Representation: 1-3 numbered paragraphs about what the indicator represents, given known biases, and the degree to which the species within the indicator are believed to represent others (e.g. what can we infer from changes in farmland birds about changes in wider biodiversity within farmland?).
C. The trend: 3-5 numbered paragraphs about what the indicator shows about change over time, and what it tells us about the species contained in it. Specifically, the magnitude of change in species contributing to the indicator over long (since the start of the data series) and short (5 year) time periods, and the confidence in that change (given known biases). An assessment of the evidence for change and for systematic variation across the UK, and the degree to which the indicator masks differential trends.
D. Wider application: 2-4 numbered paragraphs on the indicator’s relevance for ecosystem services and Aichi targets.
E. Drivers of change: 4-5 numbered paragraphs summarizing what is known about the factors responsible for driving change in the indicator (both positive and negative changes). This section reports on all drivers identified that account for >5% of the summed impact across all species, with the paragraphs arranged in order of relative importance.
The numbered paragraphs in sections B-E form the basis of assessment by the Delphi process (section 3 of this report). However, the numbered paragraphs are too long to be assessed in a straightforward manner. For this reason, the numbered paragraphs each contain a single sentence assertion written in bold text. Each assertion is labelled with a confidence rating: low, medium or high (see section 3 for details). Section A is largely factual background information and therefore not appropriate for assessment.
Material from section E of each of the Evidence Statements has been synthesised into a synoptic report on the drivers of biodiversity change across the UK (Annex 2).

7
2.2 Existing examples of Evidence Statements We considered two contrasting models for how the Evidence Statements might eventually look. Whilst both contain approximately the same number of words, they differ greatly in the way information is partitioned, and in how the strength of evidence is assessed.
The LWEC Climate Change Impact Report Cards (http://www.lwec.org.uk/resources/report-cards/) provide pithy summaries of evidence on the impacts of climate change on terrestrial biodiversity and water. The 2014 Terrestrial Biodiversity report card contains around 125 statements of 1-2 sentences each (about 40 words on average). Each of the statements is scored for both the amount of evidence and the consistency of that evidence on a three point scale: from the two scores a single metric of overall confidence (high, medium or low) is derived.
By contrast, the Godfray et al., (2014) review of evidence concerning neonicotinoid insecticides and insect pollinators contains 46 numbered statements grouped under seven headings. The statements have a median length of around 100 words each. The statements include within them a measure of the strength of evidence (e.g. “there is a weak evidence base to …. “). Within each statement there are several (up to ten) sub-statements about whether the evidence is supported by a) data, b) expert opinion, c) supporting evidence, or d) projections.
Over the course of writing the Evidence Statements to underpin the species trend indicators, it became apparent that the Godfray approach is better suited to the heterogeneous nature of the evidence base than the LWEC system. However, we have attempted to mimic the overall confidence assessment of the LWEC system (see section 4 for details).
2.3. Drafting and revising the Evidence Statements The project team prepared draft Evidence Statements for each indicator, following the format and source material above. The draft Evidence Statements and supporting evidence were then sent out for review by a set of experts (table 2) with knowledge about the species and datasets under scrutiny.
Table 2: Taxonomic experts who reviewed the Evidence statements and supporting evidence. BC=Butterfly Conservation; BCT=Bat Conservation Trust; BTO=British Trust for Ornithology; CEH=Centre for Ecology & Hydrology; PTES=People’s Trust for Endangered Species; RR=Rothamsted Research.
Taxon Indicators Taxonomic Expert(s)
Terrestrial Mammals C4a Mammals: Nida al-Fulajj (PTES) Moths C4a-b Chris Shortall (RR) Birds C5a-e, C4a Staff at BTO, coordinated by David Noble Butterflies C6a-b, C4a Tom Brereton (BC) supported by Martin Warren, Sam
Ellis & Mark Parsons Bats C8a, C4a Katherine Boughey (BCT) & Steve Langton (consultant) Bees D1c Claire Carvell & Adam Vanbergen (CEH)
The taxonomic experts were asked to perform a very specific role, as follows: 1. To assess whether the Evidence Statements are an adequate reflection of the Summary of
Evidence document (Annex 3 to this report). 2. To report any glaring omissions in the Summary of Evidence. 3. To tighten up the statements, add detail and caveats, as much as length constraints allow.
The eleven Evidence Statements and Summary of Evidence were thus amended in the light of this review process.

8
3. Assessing confidence via a Delphi process The Delphi technique is a formal process for achieving a consensus to complex problems. It has recently gained currency as a tool in ecology and conservation (Mukherjee et al., 2015), but has not previously been used to formulate advice on environmental issues. Several variants of the Delphi process exist (Mukherjee et al., 2015), but the common features are 1) a panel of experts capable of forming a view on complex issues, and 2) a scoring or voting system is used by panel members, in which the scores of individual delegates remain anonymous.
We were fortunate enough to secure the services, free of charge, of Professor William Sutherland of the University of Cambridge to design and chair a Delphi process suitable for the goals of this project. The five stages of this process were:
1. Assemble a panel of experts 2. Solicit scores from these experts on the Evidence Statements 3. Identify areas of disagreement 4. Convene a workshop to explore the areas of disagreement and re-score 5. Apply a confidence rating to each statement.
3.1. The Delphi Panel We recruited eleven experts to sit on the Delphi Panel: expertise was judged not in terms of familiarity with the biodiversity indicators, but rather the ability to review a large amount of information and form an objective viewpoint. Panel members were not paid, but have been offered authorship of any resulting publication.
Table 3: Makeup of the Delphi Panel. *Panel members with an asterisk were also members of the ad hoc Quality Assurance panel on biodiversity indicators.
Name Affiliation
Colin Beale University of York Steve Buckland* University of St Andrews Ben Collen University College London Robin Freeman Institute of Zoology, Zoological Society of London Jenny Gill University of East Anglia Dave Hodgson University of Exeter Kate Jones University College London Ken Norris* Institute of Zoology, Zoological Society of London Helen Roy* Centre for Ecology & Hydrology Phil Stephens* University of Durham Mark Stevenson Defra
3.2. Delphi part 1: Assessment by online survey The purpose of the assessment process is to determine whether the Evidence Statements are an adequate reflection and synthesis of the available evidence.
The delegates completed an online questionnaire to assess the evidence, having first read the Summary of Evidence (Annex 3) and the Evidence Statements (Annex 1). As noted in section 2.1, the 139 numbered paragraphs in the evidence statements contain too much information to be assessed unambiguously as a whole. We therefore asked the delegates to score their level of agreement (on a five point scale) with a single assertion within the paragraph written in bold typeface. We used a five point scale over a continuous score in order that the results would be comparable across delegates. The statement should reflect and be supported by the rest of the paragraph. Delegates were instructed to indicate their agreement or disagreement that “this assertion is an adequate reflection of available evidence”.
9
Disagreement with a statement indicates that the text does not adequately reflect the evidence, either because we overlooked a critical detail, or because our synthesis contains error of fact, interpretation or logic. Disagreements also arose over the precise choice of words that we used in the Evidence Statements.
We recognize that our evidence base probably contains some omissions and that the Delphi Panel contains substantial expertise on the subject matter under consideration. However, time available (at the workshop) prohibited fulsome discussion of gaps in the evidence base. Panel members were therefore invited to submit additional evidence at this initial stage, if they felt it would substantially alter the assertion or the strength of evidence that was reported. Additional evidence relevant to one of the statements was submitted at this stage. Additional evidence was not permitted at the workshop.
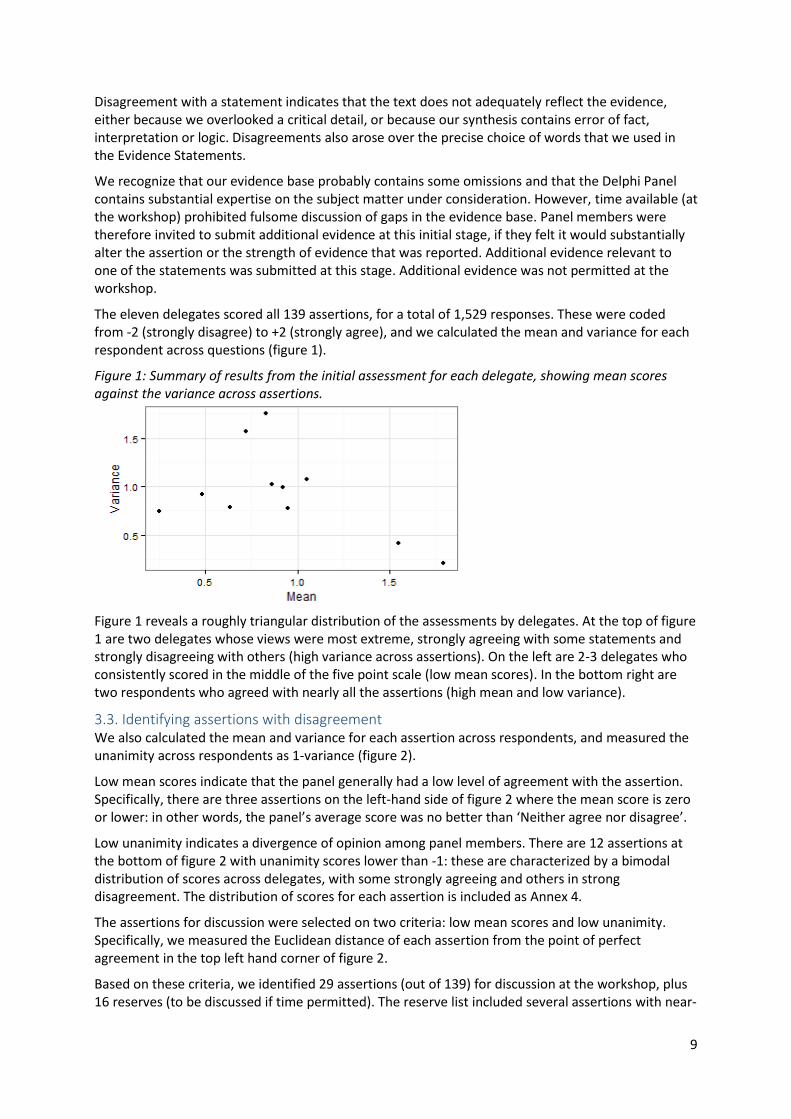
The eleven delegates scored all 139 assertions, for a total of 1,529 responses. These were coded from -2 (strongly disagree) to +2 (strongly agree), and we calculated the mean and variance for each respondent across questions (figure 1).
Figure 1: Summary of results from the initial assessment for each delegate, showing mean scores against the variance across assertions.
Figure 1 reveals a roughly triangular distribution of the assessments by delegates. At the top of figure 1 are two delegates whose views were most extreme, strongly agreeing with some statements and strongly disagreeing with others (high variance across assertions). On the left are 2-3 delegates who consistently scored in the middle of the five point scale (low mean scores). In the bottom right are two respondents who agreed with nearly all the assertions (high mean and low variance).
3.3. Identifying assertions with disagreement We also calculated the mean and variance for each assertion across respondents, and measured the unanimity across respondents as 1-variance (figure 2).
Low mean scores indicate that the panel generally had a low level of agreement with the assertion. Specifically, there are three assertions on the left-hand side of figure 2 where the mean score is zero or lower: in other words, the panel’s average score was no better than ‘Neither agree nor disagree’.
Low unanimity indicates a divergence of opinion among panel members. There are 12 assertions at the bottom of figure 2 with unanimity scores lower than -1: these are characterized by a bimodal distribution of scores across delegates, with some strongly agreeing and others in strong disagreement. The distribution of scores for each assertion is included as Annex 4.
The assertions for discussion were selected on two criteria: low mean scores and low unanimity. Specifically, we measured the Euclidean distance of each assertion from the point of perfect agreement in the top left hand corner of figure 2.
Based on these criteria, we identified 29 assertions (out of 139) for discussion at the workshop, plus 16 reserves (to be discussed if time permitted). The reserve list included several assertions with near-

10
identical wording across multiple indicators (green crosses in figure 2). The number of assertions of discussion was limited in order to allow sufficient time for each to be discussed at the workshop (mean discussion time was approximately 10 minutes per assertion).
Figure 2: Summary of results from the initial assessment, showing mean scores against Unanimity (1-variance). The black line is a constraint (if everyone strongly agrees then the assessment is also unanimous).
3.4. Delphi part 2: Workshop & re-scoring A one day workshop was held at CEH Wallingford on 3 March 2016. It was attended by Prof Sutherland and ten members of the Delphi panel. The eleventh member was ill on the day but provided an assessment of the revised assertions after the workshop. Members of the project team attended in order to provide clarification on certain points. James Williams from the Project Board attended as an observer.
In advance of the workshop, delegates were sent a summary of the scores from the initial assessment (specifically figure 1 and Annex 4), along with more detailed information about the assertions to be discussed on the day (including some notes to stimulate discussion).
At the workshop, panel members discussed their reservations about each assertion, without revealing their original scores. The discussions were chaired by Professor Sutherland and facilitated by the project team (where appropriate). The full text of each paragraph was projected on a screen during the discussion, and the text was modified to reflect concerns of the panel members. At the end of each discussion, the panel members each scored their level of agreement with the new version of the text, using an Excel spreadsheet.
During the discussion, the panel rejected assertions concerning cultural and pest-control ecosystem services. It was felt that the evidence base on how indicators relate to pest control and cultural ecosystem services was insufficient to make any kind of statement. This logic extends beyond the set that were discussed at the workshop (13 assertions in total: ten for cultural services, three for pest

11
control). In the light of this we have replaced the bold text for these 13 assertions with the following generic statement, in plain text: “it remains unclear how changes in the indicator could be used as a measure of cultural ecosystem services”. NB The link between bees and pollination services was felt to be well-established, so this assertion remains, with an associated confidence rating.
Figure 3: Change in mean agreement and unanimity as a result of the workshop stage.
Of the remaining 26 assertions, the majority achieved much higher levels of consensus (increase in mean and unanimity) as a result of the discussion and rewriting process (figure 3), although there were some notable exceptions. Three assertions experienced an increase in the mean score but not unanimity (table 4). The most extreme example was the assertion that “the total number of bats has increased since 1999”, which achieved a far lower level of agreement after the underpinning evidence had been discussed openly. The final mean score is below -1, i.e. most of the panel strongly disagreed. As a result, the assertion has been removed from the Evidence Statements.
12
Table 4: assertions for which the Delphi process did not lead to substantial increase in unanimity. Text in bold was added during the workshop; text that is struck through was deleted. Indicator Assertion
Assertion Text Initial Final
Mean Unanimity Mean Unanimity
C4a #9 Trends in abundance of about half of the species within this indicator are associated with climate change, with more species decreasing than increasing
0.91 -0.09 1.27 0.18
C4b #8 The Priority species indicator (distribution) is among of the best available metrics a useful metric for assessing progress towards Aichi Target 12
0 -0.80 0.55 -0.87
C8 #4 the total number of bats has probably increased since 1999 0.36 0.15 -1.00 -2.00
D1c #5 There is some good evidence that for a sharp declines in bee distributions have been especially severe since 2005, but hoverflies appear to be recovering increasing.
0.18 -0.56 1.00 -0.40
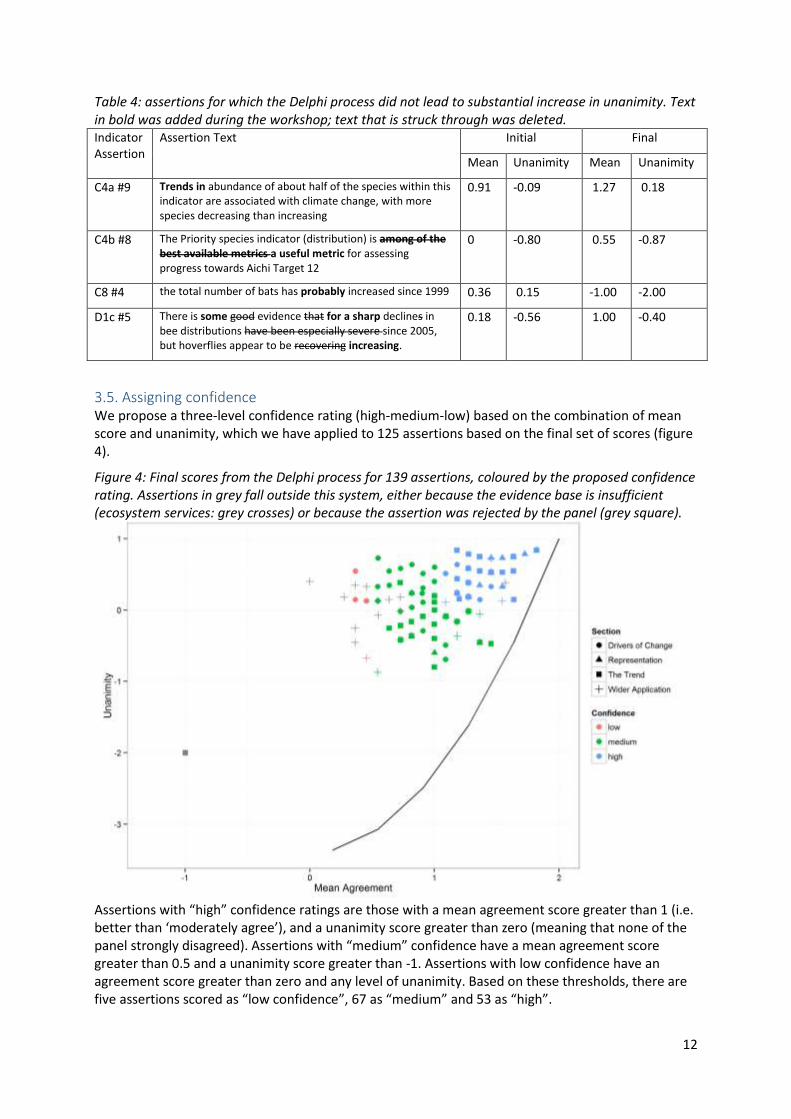
3.5. Assigning confidence We propose a three-level confidence rating (high-medium-low) based on the combination of mean score and unanimity, which we have applied to 125 assertions based on the final set of scores (figure 4).
Figure 4: Final scores from the Delphi process for 139 assertions, coloured by the proposed confidence rating. Assertions in grey fall outside this system, either because the evidence base is insufficient (ecosystem services: grey crosses) or because the assertion was rejected by the panel (grey square).
Assertions with “high” confidence ratings are those with a mean agreement score greater than 1 (i.e. better than ‘moderately agree’), and a unanimity score greater than zero (meaning that none of the panel strongly disagreed). Assertions with “medium” confidence have a mean agreement score greater than 0.5 and a unanimity score greater than -1. Assertions with low confidence have an agreement score greater than zero and any level of unanimity. Based on these thresholds, there are five assertions scored as “low confidence”, 67 as “medium” and 53 as “high”.
13
4. References Godfray, H. C. J., Blacquiere, T., Field, L. M., Hails, R. S., Petrokofsky, G., Potts, S. G., … McLean, A. R.
(2014). A restatement of the natural science evidence base concerning neonicotinoid insecticides and insect pollinators. Proceedings of the Royal Society B: Biological Sciences, 281(1786), 20140558–20140558. doi:10.1098/rspb.2014.0558
Mukherjee, N., Hugé, J., Sutherland, W. J., McNeill, J., Van Opstal, M., Dahdouh-Guebas, F., & Koedam, N. (2015). The Delphi technique in ecology and biological conservation: applications and guidelines. Methods in Ecology and Evolution, 6(9), 1097–1109. doi:10.1111/2041-210X.12387