Trust, Distrust, Confidence, Lack of Confidence: New Evidence of
Project number NF0161 BC-76-2006
March 2006-03-08 Page 1 of 18
COMMERCIAL IN CONFIDENCE
TESTING AND ANALYSIS OF HEMP FIBRE AND HURD AND FORMED BIOCOMPOSITES
Report prepared for: Jacqueline Garrood, PhD. Technical Coordinator, Fibre Crops Springdale Crop Synergies Ltd. Report prepared by: Mark Hughes, Graham Ormondroyd and Gwynn Lloyd Jones The BioComposites Centre University of Wales Bangor Gwynedd LL57 2UW Date: 8th March 2006
Project number NF0161 BC-76-2006
March 2006-03-08 Page 2 of 18
1. Background and objectives: Green decortication offers a potentially cost effective way to process hemp straw. Once decorticated and separated into the “fibre” and “hurd” fractions, they are available for secondary processing into products such as textiles, composites and panel products for the building industry. The work undertaken by the BioComposites and reported herein concerns an evaluation of the raw materials and their potential end use in biocomposites and panelboard products. Specifically, the objectives of the study were to: • assess the fibre source developed by the novel dry decortication and the green
decortication of hemp by analysis of the decortication input and output; • assess the hurd material produced; • create and test composite materials utilising fibre samples provided; • manufacture and evaluate prototype panel board products from hurds. 2. Chemical analysis of fibre:
2.1 Introduction The three main chemical constituents of hemp that are important structurally are cellulose, the hemicelluloses and lignins. The cellulose and hemicelluloses combined together are known as the polysaccharides and form the fundamental building block of the cell wall, namely the microfibril. These chemical components are distributed throughout the plant cell wall. Chemical composition varies from plant to plant, and within different parts of the same plants. Chemical composition also varies within plants from different locations, soil types, climate and ages. Cellulose is the major component. The majority of cellulose is in crystalline form and consists of saccharide monomers linked together by glycosidic linkages. Hemicelluloses are smaller, branched molecules (DP approximately 150) consisting of a variety of sugars, principally glucose, mannose, galactose and xylose. The function of lignin in plants is as a cementing agent within the cellulose / hemicellulose matrix. It is distributed throughout the secondary cell wall with the highest concentration in the middle lamella. Lignin is a brownish-white material, amorphous in structure and hydrophobic in nature. It is a complex 3-dimensional aromatic compound built from phenyl propane molecules. Hemp also contains a wide range of compounds that do not contribute to the cell wall structure, known as extractives as well as inorganic matter. These include resins, polyphenols, gums, fats, waxes, oils, silica, sulphur and calcium salts. Extractives contribute to the odour and colour of the Hemp and are toxic to some microorganisms.
2.2 Materials and methods The samples provided for chemical analysis by Springdale Crop Synergies Ltd were as follows: • green processed fibre • dry processed fibre • Finola fibre (a dual purpose hemp crop)
Project number NF0161 BC-76-2006
March 2006-03-08 Page 3 of 18
Moisture content, extractives, Klason lignin, holocellulose, alphacellulose, hemicellulose and ash analyses have been carried out on all samples.. The samples were milled and sieved to pass through a 40 mesh Endecott screen using a shaker. All over sized-material was re-milled and re-sieved to provide 40-mesh flour, thus ensuring that all components within the sample was available for chemical analysis. Each sample was milled cold from a fridge (5°C) to ensure minimum loss of volatile extractives during milling.
2.2.1 Moisture content Hemp fibre and shive are hygroscopic materials and can contain varying amounts of moisture. To have meaning, the results of the chemical analysis are reported on the ovendry basis. Moisture in the fibre and shive samples was measured by oven drying 5g of each milled flour at 105°C for 16 hrs.
2.2.2 Extractives The extractives in Hemp fibre and shive are soluble in neutral solvents. Duplicate samples of approximately 10 grams oven dry flour from each material were extracted in the Soxhlet extraction apparatus using Toluene, Acetone, and Industrial Methylated Spirit (4:1:1) for 8 hrs. The heating rate of the Soxhlet extraction equipment provided at least 50 solvent cycles during the extraction period. The solvent containing the extractives was filtered and evaporated to dryness on a steam bath. All samples were further dried in an oven at 75°C overnight, reweighed and the extractives calculated as the percentage of the oven dry flour.
2.2.3 Spectrophotometeric evaluation of extractives 5 mg samples of each oven-dried extractive was dissolved in 50% dioxane. When dissolution was complete the absorbance of the solution was measured from 200 to 500 nm. The presence of lignin, ferulic p-coumaric acids and chlorophyll show absorbance at 280, 325 and 410 respectively.
2.2.4 Klason Lignin (Tappi 222 om 88) The standard Tappi method was used to determine lignin concentration in all the samples. This method involves acid hydrolysis of the polysaccharides in 72% sulphuric acid. The carbohydrates are completely hydrolysed and solubilised. The insoluble residue remaining is measured gravimetrically as lignin. Duplicate samples of 1.5g of extractive free flour were used. 15 mls of 72% sulphuric acid were added to each sample and they were continuously stirred for 2 hrs in a 20°C water bath. At the end of the initial hydrolysis, the acid was diluted to 3% by the addition of 345 mls deionised water. The mixture was then refluxed at 100°C for 4 hrs. After 4 hrs the mixture was cooled, and filtered through pre-weighed, oven-dry glass fibre filter circles and dried in a forced draught oven at 105°C overnight. The samples were re-weighed and the lignin calculated as the percentage of the oven dry flour.
2.2.5 Holocellulose Holocellulose is the total carbohydrate fraction of the sample. The holocellulose content of the extractive-free samples was determined by the sodium chlorite method (Browning, 1967). Approximately 2g of duplicate samples were used. To the samples the following were added successively; 320mls distilled water, 1ml glacial acetic acid and 20mls 15% sodium chlorite. The reaction was carried out at 75°C. At 1, 2 and 3 hours further additions of the acid and the chlorite solutions were made and the reaction stopped at the end of the fourth hour. The samples were cooled in an ice bath and the holocellulose was filtered through an oven dried pre-weighed sintered glass crucible. The samples were washed with 200ml ethanol and 25ml
Project number NF0161 BC-76-2006
March 2006-03-08 Page 4 of 18
acetone and oven dried overnight in an oven at 50°C. The samples were re-weighed and the holocellulose calculated as the percentage of the oven dry flour.
2.2.6 Alpha Cellulose and Hemicellulose Alpha cellulose and hemicellulose were extracted from the holocellulose preparations. Approximately 1.5g duplicate samples of the oven dry holocellulose were weighed and 100mls of 17.5% sodium hydroxide solution were added. The reaction was maintained at 20°C for 2 hours with continuous shaking and kept under nitrogen. On completion of the reaction, the samples were filtered through a pre-weighed sinter glass crucible into excess acetic acid (to neutralise the sodium hydroxide). The alpha cellulose retained in the crucible was further washed with 10mls of 10% acetic acid, 200mls distilled water, 100mls IMS and then oven dried overnight at 50°C. The samples were re-weighed and the alpha cellulose calculated as a percentage of the oven dry flour. The filtrate and washings were neutralised to pH 7.0 with acetic acid and 2 litres of ethanol were added to precipitate the hemicellulose. The hemicelluloses were filtered through pre-weighed oven dry scintaglass crucibles and washed with 50mls IMS. They were dried in an oven at 50°C overnight and re-weighed. The hemicelluloses were calculated as a percentage of the oven dry flour.
2.2.7 Carbohydrate Analysis The carbohydrates in the samples of fibre and shive were completely hydrolysed and solubilised into sulphuric acid. Duplicate samples of 15mg of extractive free flour were used. 0.125 mls of 72% sulphuric acid were added to each sample and they were continuously agitated for 2 hrs in a 20°C water bath. At the end of the initial hydrolysis, the acid was diluted to 3% by the addition of deionised water. The mixture was then refluxed at 105°C for 4 hrs, cooled, and then filtered. The hydrolysed sugars were analysed by high performance anion exchange chromatography, using pulsed amperoteric detection through a Dionex GP gradient pump, ED50 electrochemical detector, AS50 autosampler and a Carbopac ™ PA1 column. Samples injected into the system were eluted with 0.004M NaOH (carbohydrate free and purged with Helium) with post – column addition of 0.3M NaOH at a rate of 1ml/min. Run time was 45 minutes, followed by 8 minutes elution with 0.5M NaOH to wash the column, and then 15 minutes elution with 0.004M NaOH to re-equilibrate it. The analysis was quantified against two separate known concentrates of pure standard sugar solutions using Chromeleon ™ computer software.
2.2.8 Ash Three grams of oven-dried material was placed in a muffle furnace at 550°C for 16 hrs, cooled and then re-weighed. The ash content was calculated as a percentage of the oven-dried flour.

Project number NF0161 BC-76-2006
March 2006-03-08 Page 5 of 18
The results of the chemical analysis of the fibres are summarised in Table 1 below.
Table 1: Summary of chemical composition of the three fibre types investigated
Sample Moisture content Ash Extractive
s KlasonLignin
Holo cellulose
Alpha cellulose
Hemi cellulose
(%*) (%*) (%*) (%*) (%*) (%*) (%*) Green Fibre
1 4.37 1.86 1.64 4.82 92.67 79.14 11.93 2 4.47 1.86 1.39 4.68 92.07 79.95 10.33
Mean 4.42 1.86 1.52 4.75 92.37 79.55 11.13 St Dev 0.07 0.00 0.18 0.10 0.42 0.57 1.13
Dry Fibre
1 4.15 4.20 1.65 4.06 84.61 68.97 14.98 2 3.95 4.50 1.72 3.98 84.97 67.37 16.94
Mean 4.05 4.35 1.69 4.02 84.79 68.17 15.96 St Dev 0.14 0.21 0.05 0.06 0.25 1.13 1.39
Finola Fibre 1 6.14 2.73 1.23 5.94 81.36 60.68 19.20 2 5.88 2.75 1.09 6.02 82.27 60.56 20.22
Mean 6.01 2.74 1.16 5.98 81.82 60.62 19.71 St Dev 0.18 0.01 0.10 0.06 0.64 0.08 0.72 *The above results are percent of oven dry starting material.
0% 20% 40% 60% 80% 100%
Green Fibre
Dry Fibre
Shive
Finolia Fibre
Relative % Sugars
ArabinoseRhamnoseGalactoseGlucoseXyloseMannose

Project number NF0161 BC-76-2006
March 2006-03-08 Page 6 of 18
3. Fibre strength For the measurement of fibre strength, a method developed by The BioComposites Centre, based on a number of standard methods for fibre analysis, was employed. Whilst it is recognised that similar results to standard single fibre tests are obtained by this method, it is based upon the assessment of the strength of a ‘zero twist yarn’, rather than single fibres. This method yields a simple and quick method of screening large numbers of samples, which would otherwise be extremely time consuming and costly. This method is not a standard method and as such the results from the test should only be used for comparison between materials tested by this method.
3.1 Materials and method Straight lengths of fibre cut to 80mm lengths were weighed out into 0.02g (+/- 0.001g) bundles. The bundles were glued to cardboard end tabs with PVA glue, maintaining a constant 40mm (gauge length) between the tabs. Great care was taken to ensure that the fibres were aligned parallel to one another. The samples were conditioned at 65% RH and 20°C for 24 h before testing. Testing was conducted on an Instron universal testing machine equipped with a 5kN load cell. The test speed was 1 mm/min. The samples were gripped using pneumatic jaws. 20 replicate samples were tested per hemp variety. The breaking strength of yarn is often reported as the breaking load (N) divided by the linear density (Tex) and is termed tenacity. Linear density is the mass, in g, of 1 km of fibre. The tenacity of the fibre tested is expressed as the breaking load in Newtons (over a known gauge length) divided by the linear density and reported in units of N/tex, or more commonly mN/tex.
3.2 Results and discussion The results of the tensile tests are summarised in Table 2 below. As my be seen, there was no significant difference between the tensile strengths of the dry decorticated fibre and the Finola fibre, both of which displayed a mean breaking strengths of around 240 mN/tex. Although the results show significant scatter, the green decorticated fibre was weaker, with a mean strength of only around 75% that of the other fibre types. These results are comparable with other fibre types such as flax which show tenacity figures in the region of 300 to 400 mN/tex when tested in the same manner.
Table 2: Tenacity of fibre Fibre type Mean tenacity (mN/tex) Standard deviation (mN/tex) Green decorticated 182 42 Dry decorticated 241 59 Finola 236 66
Project number NF0161 BC-76-2006
March 2006-03-08 Page 7 of 18
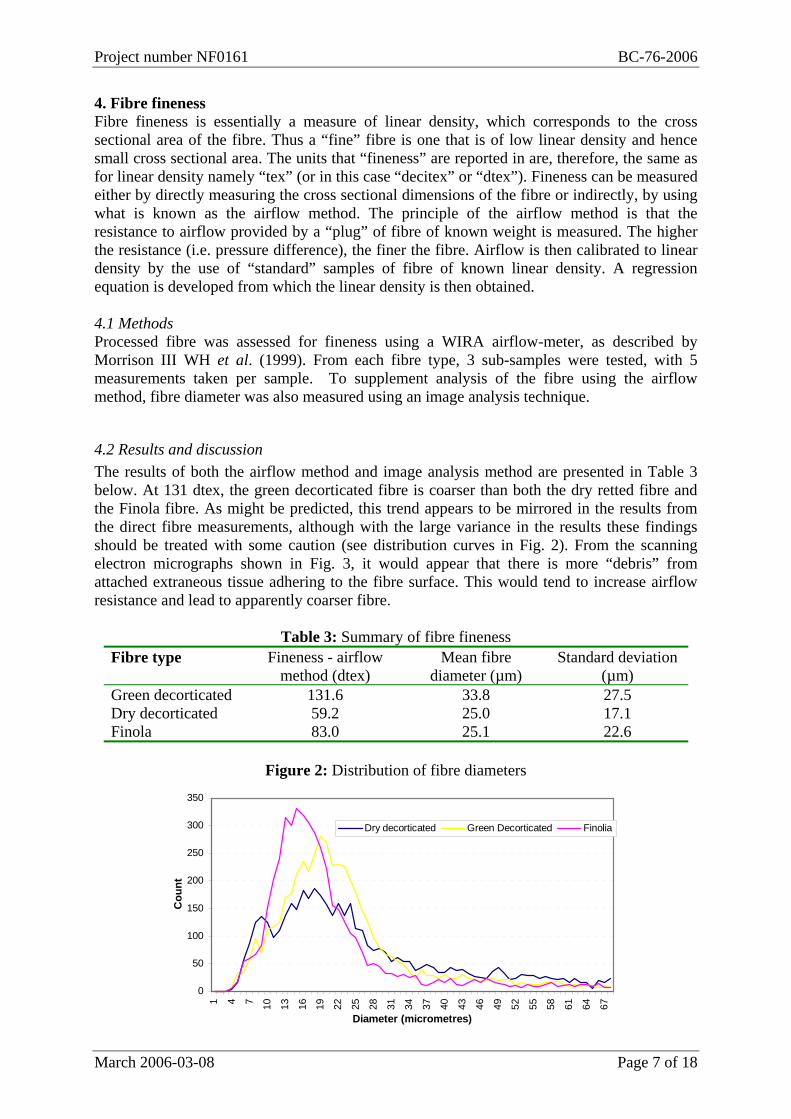
4. Fibre fineness Fibre fineness is essentially a measure of linear density, which corresponds to the cross sectional area of the fibre. Thus a “fine” fibre is one that is of low linear density and hence small cross sectional area. The units that “fineness” are reported in are, therefore, the same as for linear density namely “tex” (or in this case “decitex” or “dtex”). Fineness can be measured either by directly measuring the cross sectional dimensions of the fibre or indirectly, by using what is known as the airflow method. The principle of the airflow method is that the resistance to airflow provided by a “plug” of fibre of known weight is measured. The higher the resistance (i.e. pressure difference), the finer the fibre. Airflow is then calibrated to linear density by the use of “standard” samples of fibre of known linear density. A regression equation is developed from which the linear density is then obtained. 4.1 Methods Processed fibre was assessed for fineness using a WIRA airflow-meter, as described by Morrison III WH et al. (1999). From each fibre type, 3 sub-samples were tested, with 5 measurements taken per sample. To supplement analysis of the fibre using the airflow method, fibre diameter was also measured using an image analysis technique.
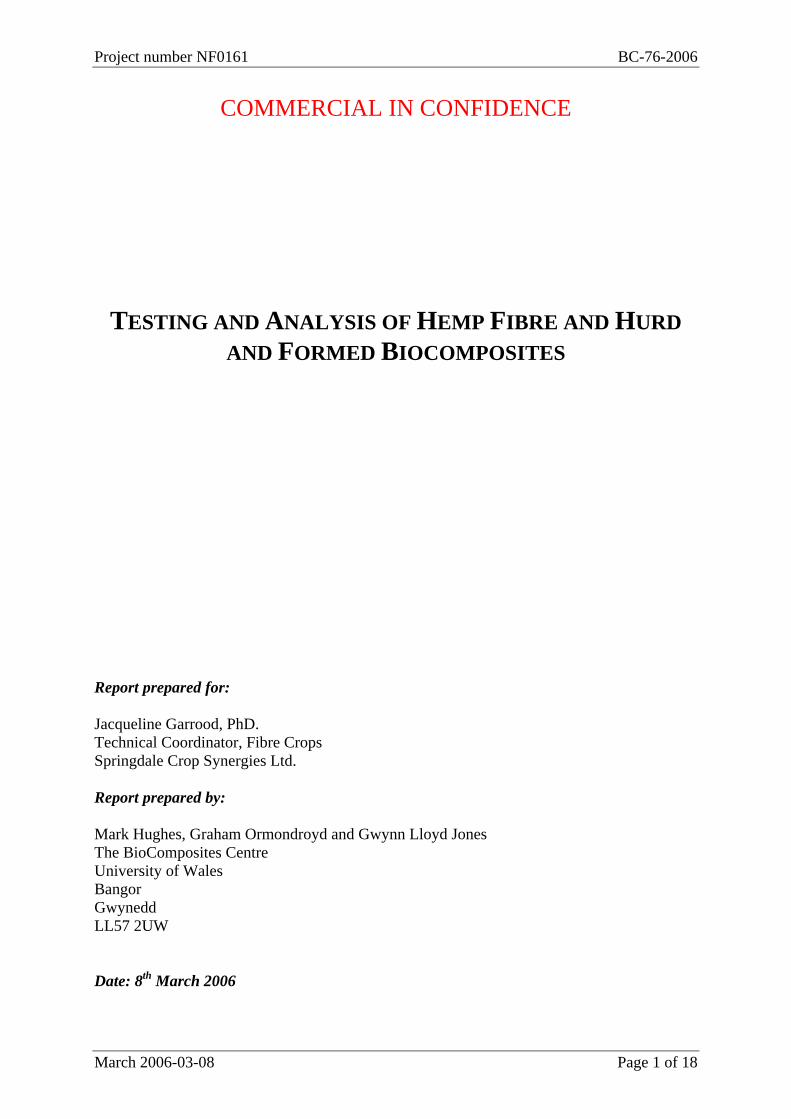
4.2 Results and discussion The results of both the airflow method and image analysis method are presented in Table 3 below. At 131 dtex, the green decorticated fibre is coarser than both the dry retted fibre and the Finola fibre. As might be predicted, this trend appears to be mirrored in the results from the direct fibre measurements, although with the large variance in the results these findings should be treated with some caution (see distribution curves in Fig. 2). From the scanning electron micrographs shown in Fig. 3, it would appear that there is more “debris” from attached extraneous tissue adhering to the fibre surface. This would tend to increase airflow resistance and lead to apparently coarser fibre.
Table 3: Summary of fibre fineness Fibre type Fineness - airflow
method (dtex) Mean fibre
diameter (µm) Standard deviation
(µm) Green decorticated 131.6 33.8 27.5 Dry decorticated 59.2 25.0 17.1 Finola 83.0 25.1 22.6
Figure 2: Distribution of fibre diameters
0
50
100
150
200
250
300
350
1 4 7 10 13 16 19 22 25 28 31 34 37 40 43 46 49 52 55 58 61 64 67
Diameter (micrometres)
Cou
nt
Dry decorticated Green Decorticated Finolia

Project number NF0161 BC-76-2006
March 2006-03-08 Page 8 of 18
Figure 3: Scanning electron micrographs of fibres
Green hemp Green hemp
Dry hemp Dry hemp
Finola fibre Finola fibre
100um
100um
100um

Project number NF0161 BC-76-2006
March 2006-03-08 Page 9 of 18
5. Hurd Analysis
5.1 Chemical analysis A chemical analysis of the hurds was performed using the same methodology as described in Section 3.2 above. The chemical composition of the hurd is summarised in Table 4 below. The principal difference between the composition of the hurd and that of the fibre relates to the amount of lignin and the cell wall polysaccharides. At around 23%, the amount of lignin is much higher in the hurds. This compares with around 4-6% for the fibre. Alpha cellulose, the principal structural polymer at around 36% in the hurd is only about 50% of that found in the fibre. The chemical composition of the hurd is more akin to that of wood than bast fibres.
Table 4: Chemical composition of hurds Sample Moisture Ash Extractives Klason Holo Alpha Hemi
content Lignin cellulose cellulose cellulose (%*) (%*) (%*) (%*) (%*) (%*) (%*) 1 4.16 4.25 2.25 23.27 70.24 36.46 31.06 2 3.98 4.26 2.64 23.17 70.58 36.52 31.33
Mean 4.07 4.26 2.45 23.22 70.41 36.49 31.20 St Dev 0.13 0.01 0.28 0.07 0.24 0.04 0.19 *The above results are percent of oven dry starting material.
5.2 Hurd size distribution A sieve analysis of the hurds was carried out to obtain a distribution of particle sizes. As may be seen form Figure 4, approximately 50% of the particles were of a size greater than 3.15mm, with approximately 30% in the range 1.4 to 3.15 mm and less than 10% in the 0.71 to 1.40 mm and smaller than 0.71 mm ranges.
Figure 4: Hurd particle size distribution
>3.15mm3.15mm -1.40mm 1.40mm -
0.71mm 0.71mm >
0.0
10.0
20.0
30.0
40.0
50.0
60.0
Perc
enta
ge o
f tot
al
wei
ght.
Particle size
Project number NF0161 BC-76-2006
March 2006-03-08 Page 10 of 18
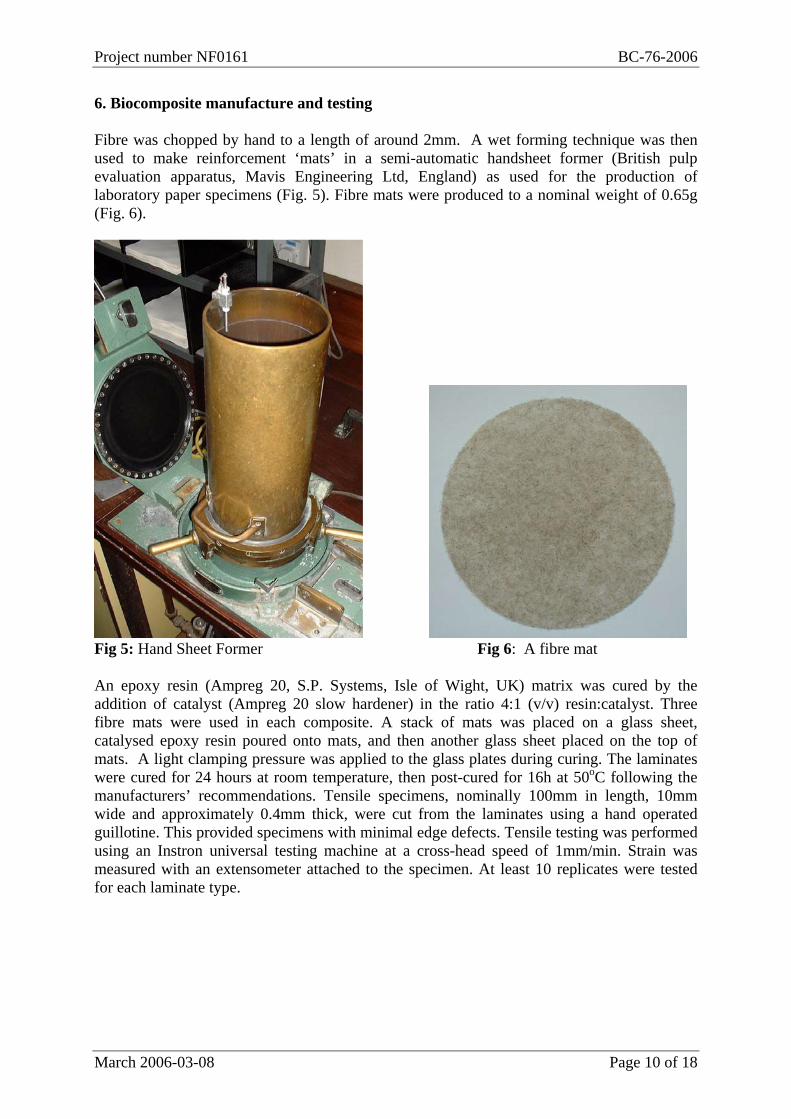
6. Biocomposite manufacture and testing Fibre was chopped by hand to a length of around 2mm. A wet forming technique was then used to make reinforcement ‘mats’ in a semi-automatic handsheet former (British pulp evaluation apparatus, Mavis Engineering Ltd, England) as used for the production of laboratory paper specimens (Fig. 5). Fibre mats were produced to a nominal weight of 0.65g (Fig. 6).
Fig 5: Hand Sheet Former Fig 6: A fibre mat An epoxy resin (Ampreg 20, S.P. Systems, Isle of Wight, UK) matrix was cured by the addition of catalyst (Ampreg 20 slow hardener) in the ratio 4:1 (v/v) resin:catalyst. Three fibre mats were used in each composite. A stack of mats was placed on a glass sheet, catalysed epoxy resin poured onto mats, and then another glass sheet placed on the top of mats. A light clamping pressure was applied to the glass plates during curing. The laminates were cured for 24 hours at room temperature, then post-cured for 16h at 50oC following the manufacturers’ recommendations. Tensile specimens, nominally 100mm in length, 10mm wide and approximately 0.4mm thick, were cut from the laminates using a hand operated guillotine. This provided specimens with minimal edge defects. Tensile testing was performed using an Instron universal testing machine at a cross-head speed of 1mm/min. Strain was measured with an extensometer attached to the specimen. At least 10 replicates were tested for each laminate type.

Project number NF0161 BC-76-2006
March 2006-03-08 Page 11 of 18
Figure 7: Typical stress-strain curves for hemp fibre reinforced biocomposites
0.0 0.2 0.4 0.6 0.8 1.0 1.2
0
10
20
30
40
50
60
Stre
ss (M
Pa)
Strain (%)
Green hemp Finola
Table 5: Tensile properties of composites Tensile strength
(MPa) Young’s Modulus
(GPa) Fibre volume fraction (%)
Finola fibre/Epoxy 36.21 (4.29) 4.29 (0.28) 13.4 Green hemp/Epoxy 40.11 (5.62) 4.41 (0.37) 13.2
7. Hurd particleboard manufacture and testing
7.1 Board manufacture and testing Single layer particleboards were manufactured using hurd, supplied by Springdale Crop Synergies Limited, on the laboratory facilities at the BioCompoistes Centre, University of Wales, Bangor, shown in Figure 8. The hurd material was used “as received “ and was not screened prior to use. Before resination, however, the chips were dried to constant moisture content (MC). The resin used was commercial EI Urea Formaldehyde (UF) resin and was supplied by Kronospan Ltd, Chirk. In view of its short shelf life, the resin was collected just prior to the commencement of the trial. The resin, having a solids content of circa 65%, was applied to the hurds by spraying in a blender; 8, 10 and 12% resin was added to the hurd (weight of resin solids to weight of dry wood). The resin was hardened by the addition of ammonium sulphate at 1.5% (w/w).

Project number NF0161 BC-76-2006
March 2006-03-08 Page 12 of 18
Figure 8: Blending and hot pressing facilities for the preparation of particleboard
After blending the resin, additives and chips, the resultant “furnish” was transferred to a forming box (Fig. 9) and lightly compacted before being hot pressed for final consolidation and resin curing.
Fig. 9: Forming box (foreground)
Panels were 500 mm by 500mm square and 12mm thick. The press platen temperature was 210°C with a pressing factor of 10 sec per mm.

Project number NF0161 BC-76-2006
March 2006-03-08 Page 13 of 18
7.1.1 Sample preparation After cooling the samples were trimmed and cut into 50mm by 50mm squares, according to the appropriate EN standard, for testing.
7.1.2 Testing The boards were tested for transverse Internal Bond Strength (IBS) following EN 319 and for Thickness Swelling (TS) and Water Absorption (Abs) after 24 h immersion in water at 20°C (EN 317).
7.2 Results
I.B. MOE MOR Thickness Swell (24h) Resin
Loading Average (N/mm2) S.D. Average
(N/mm2) S.D. Average (N/mm2) S.D. Percentage
Swelling S.D.
10% 0.62 0.062 2373.9 156.3 16.33 1.11 33.70 2.27 12% 0.65 0.034 2329.3 284.4 16.82 1.30 32.05 1.24
Table 6: Results of particleboard testing.
It can be seen from Table 6 that the results for the testing of the particleboard are as would be expected, it can be seen that as the resin content of the board increases so do the properties. It can also be noted that the results for the particleboard are comparable to the specifications laid down in the standard BS 5669: Part 2 1989, which specifically deals with particleboard made from wood. It can be seen form the standard that the boards here are comparable with the C1A specification. It can be seen that the thickness swells are similar, this is because the resin used, a standard particleboard UF resin, is not resistance to moisture. If a moisture resistant board was required then other resins should be employed, such as melamine formaldehyde or MDIs.
Project number NF0161 BC-76-2006
March 2006-03-08 Page 14 of 18
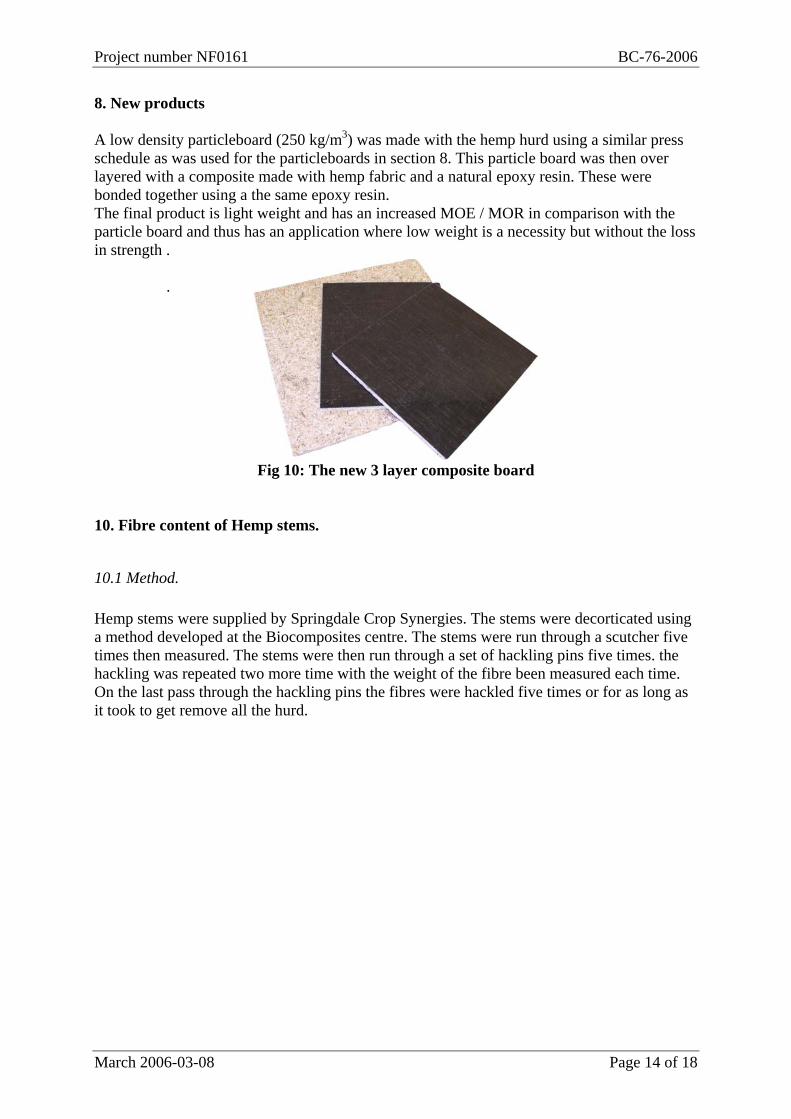
8. New products A low density particleboard (250 kg/m3) was made with the hemp hurd using a similar press schedule as was used for the particleboards in section 8. This particle board was then over layered with a composite made with hemp fabric and a natural epoxy resin. These were bonded together using a the same epoxy resin. The final product is light weight and has an increased MOE / MOR in comparison with the particle board and thus has an application where low weight is a necessity but without the loss in strength .
.
Fig 10: The new 3 layer composite board 10. Fibre content of Hemp stems.
10.1 Method. Hemp stems were supplied by Springdale Crop Synergies. The stems were decorticated using a method developed at the Biocomposites centre. The stems were run through a scutcher five times then measured. The stems were then run through a set of hackling pins five times. the hackling was repeated two more time with the weight of the fibre been measured each time. On the last pass through the hackling pins the fibres were hackled five times or for as long as it took to get remove all the hurd.

Project number NF0161 BC-76-2006
March 2006-03-08 Page 15 of 18
10.2 Results.
Hackling Scutching 1st Pass 2nd Pass 3rd Pass Location Date
sown Date
sampled treatment type of hemp
Initial Weight % of original
weight % of original
weight % of original
weight % of original
weight ferimon 30.25 29.16 16.46 15.60 15.27 fedora
17 27.3 28.28 18.79 17.25 16.56 futura 32.67 25.13 17.75 17.14 16.16
sewage
felina 32 33.15 20.06 8.02 7.48 6.15
ferimon 27.74 30.86 11.18 9.99 7.57 fedora
17 25.82 27.50 21.07 17.16 15.34 futura 33.08 37.61 21.25 18.17 12.79
8/29/05
no sewage
felina 32 41.18 29.82 18.16 15.10 12.89
ferimon 30.45 26.67 11.33 11.33 7.82 fedora
17 40.65 25.98 12.87 12.82 10.41 futura 34.59 24.54 9.34 8.99 7.72
sewage
felina 32 31.45 28.71 11.00 8.52 8.14
ferimon 34.98 20.98 20.58 19.64 14.24 fedora
17 36.45 25.62 20.44 15.28 11.50 futura 40.01 20.29 17.80 14.50 13.32
Water works 6/10/05
9/21/05
no sewage
felina 32 41.23 20.52 16.66 13.70 10.60
ferimon 18.37 22.37 17.80 15.41 12.36 Springdale 6/17/05 8/19/05 Non fedora
17 20.55 78.83 25.50 21.61 17.57

Project number NF0161 BC-76-2006
March 2006-03-08 Page 16 of 18
futura 21.43 70.18 18.71 12.09 9.57 felina
32 12.25 66.69 21.06 13.14 11.59 santhica 17.17 84.45 31.74 23.35 18.52 beniko 18.93 78.87 31.75 21.45 16.48
epsilon 19.04 fibre brittle and
broke felina
34 17.73 89.73 fibre brittle and
broke finola 29.39 61.48 32.22 23.17 21.61
g99 20.32 81.84 31.25 25.39 22.93 ferimon 21.84 50.92 21.61 17.17 16.03 fedora
17 22.34 46.69 17.82 15.26 14.86 futura 29.66 25.35 12.71 10.59 10.89 felina
32 25.34 53.55 17.13 16.65 15.63 santhica 30.01 53.12 19.76 15.96 13.73 beniko 34.23 36.69 10.08 9.41 7.51 epsilon 21.54 46.43 21.77 20.01 19.64 felina
34 34.23 52.26 10.08 9.11 9.06 finola 14.55 57.75 20.35 14.16 13.06
8/31/05 Non
g99 Missing ferimon 31.58 40.41 21.47 20.58 20.49 fedora
17 33.05 49.11 19.18 16.61 14.98
futura 40.55 fibre brittle and
broke felina
32 33.45 fibre brittle and
broke santhica 32.21 48.34 23.81 19.03 17.70 beniko 25.98 56.24 21.59 16.51 12.01
9/9/05 Non
epsilon 31.22 75.50 18.51 17.52 15.82

Project number NF0161 BC-76-2006
March 2006-03-08 Page 17 of 18
felina 34 33.34 83.05 14.73 12.33 10.05
finola 9.4336 34.35 13.25 10.60 9.54
g99 46.55 75.83 41.18 28.31 23.27 ferimon 17.64 74.09 28.06 27.21 25.45 fedora
17 26.58 46.80 27.39 23.93 21.90 futura 27.78 65.19 26.10 18.75 13.68 felina
32 13.46 68.80 28.31 26.45 23.92 santhica 22.13 70.72 28.02 22.01 20.88 beniko 22.02 72.84 25.11 21.80 17.94 epsilon 23.19 55.80 20.57 16.43 14.45 felina
34 11.2 80.36 32.86 22.41 18.75 finola Missing
9/19/05 Non
g99 30.78 24.11 11.27 10.07 9.65 ferimon 24.04 48.29 27.20 24.63 21.96 fedora
17 19.1 35.76 20.05 18.17 17.64 futura 22.86 36.00 22.09 17.45 15.62 felina
32 25.18 55.08 24.98 23.71 20.06 santhica 18.16 49.78 28.91 23.84 21.37 beniko 24.75 33.62 19.07 15.35 13.94 epsilon 11.6 27.16 24.40 23.10 20.43 felina
34 13.04 46.47 42.02 34.20 29.91 finola Missing
7/4/05
10/10/05 Non
g99 33.15 35.90 27.75 24.74 20.27

Project number NF0161 BC-76-2006
March 2006-03-08 Page 18 of 18
REFERENCES
Browning BL, Methods of Wood Chemistry, Volumes 1 & 2, 1967. Tappi T222 om-88 1988 BSi (1989) BS 5669: Part 2:1989 Particle Board Part 2. Specification for wood chipboard BSi (1993) BS En310: Wood based panels. Determination of modulus of elasticity in bending and of bending strength. BSi (1993) BS EN317: Particleboards and Fibreboards. Determination of Thickness after immersion in water BSi (1993) BS EN319: Particleboards and Fibreboards: Determination of tensile strength perpendicular to the plane of the board. Morrison III W.H. et al. (1999)