FINAL REPORT - Ministry of Health · William May, Agriculture, and Agri-Food Canada, Research Farm...
32
FINAL REPORT 20150176 IMPROVING FUSARIUM HEAD BLIGHT MANAGEMENT IN DURUM WHEAT IN SASKATCHEWAN Funded by: The Agriculture Development Fund March 2019 Prepared by: University of Saskatchewan
Transcript of FINAL REPORT - Ministry of Health · William May, Agriculture, and Agri-Food Canada, Research Farm...

FINAL REPORT
20150176
IMPROVING FUSARIUM HEAD BLIGHT MANAGEMENT IN DURUM WHEAT IN
SASKATCHEWAN
Funded by: The Agriculture Development Fund
March 2019
Prepared by: University of Saskatchewan

1
ADF Project Final Report
1. Project title and ADF file number.
ADF project #20150176 – February 15, 2018 to February 14, 2019 “Improving Fusarium Head Blight
Management in Durum Wheat in Saskatchewan
2. Name of the Principal Investigator and contact information.
Randy Kutcher
Crop Development Centre, Department of Plant Sciences, University of Saskatchewan, 51 Campus Drive,
Saskatoon, SK S7N 5A8; [email protected]; 306-966-4951.
3. Name of the collaborators and contact information.
Gary Peng, 107 Science Place Saskatoon, Saskatchewan S7N 0X2; [email protected] ; 306-385-9410.
Garry Hnatowich, Irrigation Crop Diversification Corporation (ICDC), Box 609, Outlook, SK S0L 2N0;
[email protected] ;306-867-5405.
Jessica Webber, Western Applied Research Corporation (WARC), Box 89, Scott, SK S0K 4A0;
[email protected]; 306-361-8703.
William May, Agriculture, and Agri-Food Canada, Research Farm - Indian Head, Box 760, SK S0G 2K0;
[email protected] 306-695-5225.
Tom Wolf, AgriMetrix Research and Training, #208-111 Research Drive; Saskatoon, SK S7N 3B2
[email protected] 306-241-1795 (advisor).
2
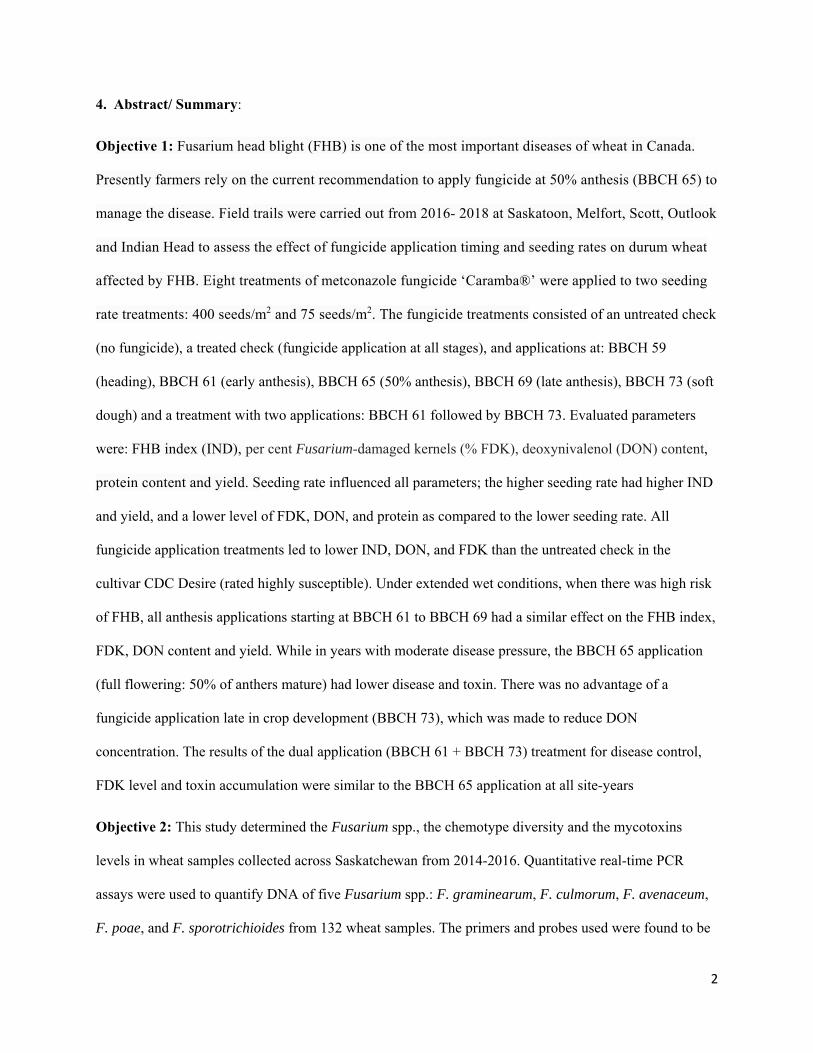
4. Abstract/ Summary:
Objective 1: Fusarium head blight (FHB) is one of the most important diseases of wheat in Canada.
Presently farmers rely on the current recommendation to apply fungicide at 50% anthesis (BBCH 65) to
manage the disease. Field trails were carried out from 2016- 2018 at Saskatoon, Melfort, Scott, Outlook
and Indian Head to assess the effect of fungicide application timing and seeding rates on durum wheat
affected by FHB. Eight treatments of metconazole fungicide ‘Caramba®’ were applied to two seeding
rate treatments: 400 seeds/m2 and 75 seeds/m2. The fungicide treatments consisted of an untreated check
(no fungicide), a treated check (fungicide application at all stages), and applications at: BBCH 59
(heading), BBCH 61 (early anthesis), BBCH 65 (50% anthesis), BBCH 69 (late anthesis), BBCH 73 (soft
dough) and a treatment with two applications: BBCH 61 followed by BBCH 73. Evaluated parameters
were: FHB index (IND), per cent Fusarium-damaged kernels (% FDK), deoxynivalenol (DON) content,
protein content and yield. Seeding rate influenced all parameters; the higher seeding rate had higher IND
and yield, and a lower level of FDK, DON, and protein as compared to the lower seeding rate. All
fungicide application treatments led to lower IND, DON, and FDK than the untreated check in the
cultivar CDC Desire (rated highly susceptible). Under extended wet conditions, when there was high risk
of FHB, all anthesis applications starting at BBCH 61 to BBCH 69 had a similar effect on the FHB index,
FDK, DON content and yield. While in years with moderate disease pressure, the BBCH 65 application
(full flowering: 50% of anthers mature) had lower disease and toxin. There was no advantage of a
fungicide application late in crop development (BBCH 73), which was made to reduce DON
concentration. The results of the dual application (BBCH 61 + BBCH 73) treatment for disease control,
FDK level and toxin accumulation were similar to the BBCH 65 application at all site-years
Objective 2: This study determined the Fusarium spp., the chemotype diversity and the mycotoxins
levels in wheat samples collected across Saskatchewan from 2014-2016. Quantitative real-time PCR
assays were used to quantify DNA of five Fusarium spp.: F. graminearum, F. culmorum, F. avenaceum,
F. poae, and F. sporotrichioides from 132 wheat samples. The primers and probes used were found to be

3
specific and sensitive. Fusarium graminearum was the dominant species detected followed by F.
avenaceum from qPCR and identification based on morphology. Multiplex PCR based on the TRI3 gene
revealed the chemotypes 3-ADON and 15-ADON. The detection of the 3-ADON amplicon among
samples was more frequent than 15-ADON; no NIV amplicon was detected. Sample was tested for the
presence of thirteen mycotoxins; five toxins were detected and quantified. The highest concentration was
of DON, followed by 3-ADON, 15-ADON, T2 toxin and HT2 toxin. A weak correlation was detected
between F. graminearum DNA and DON (R2= 0.37, P = 0.0004), while the correlation between DNA of
other Fusarium spp., mycotoxin levels and FDK was not significant.
5. Key Messages:
Under the conditions of study, fungicide applied to durum wheat under high FHB severity
conditions was most effective to reduce FDK and DON between the BBCH61 to 69 stages.
Under low to moderate FHB severity, fungicide was of benefit, however the window of
application appeared to be smaller, BBCH61-65. There was no reduction in DON content from
the application of fungicide late in crop development (BBCH 73).
The optimum timing of application was the same for both seeding rates. The high seeding rate
increased yield, but there was no interaction with fungicide application timing.
Fusarium graminearum was the Fusarium spp. most often identified from infected wheat
samples collected from the 2014 and 2016 epidemics. Five toxins were detected with DON
observed to be in the greatest quantity.
6. Introduction:
Canada is the sixth largest producer of wheat in the world and the second largest exporter (~20% of
the world market). Even a small per hectare yield loss due to FHB results in the loss of tens of
thousands of dollars per grower and millions of dollars collectively. In 2012, 2014, and again in 2016,
4
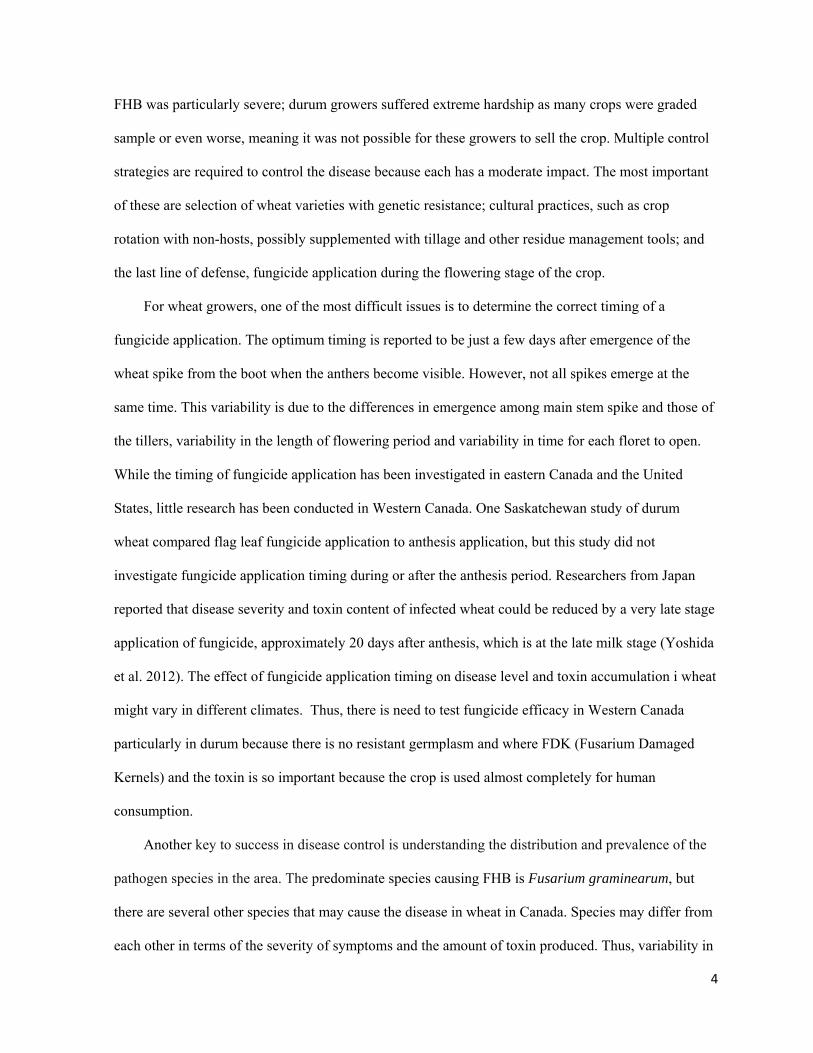
FHB was particularly severe; durum growers suffered extreme hardship as many crops were graded
sample or even worse, meaning it was not possible for these growers to sell the crop. Multiple control
strategies are required to control the disease because each has a moderate impact. The most important
of these are selection of wheat varieties with genetic resistance; cultural practices, such as crop
rotation with non-hosts, possibly supplemented with tillage and other residue management tools; and
the last line of defense, fungicide application during the flowering stage of the crop.
For wheat growers, one of the most difficult issues is to determine the correct timing of a
fungicide application. The optimum timing is reported to be just a few days after emergence of the
wheat spike from the boot when the anthers become visible. However, not all spikes emerge at the
same time. This variability is due to the differences in emergence among main stem spike and those of
the tillers, variability in the length of flowering period and variability in time for each floret to open.
While the timing of fungicide application has been investigated in eastern Canada and the United
States, little research has been conducted in Western Canada. One Saskatchewan study of durum
wheat compared flag leaf fungicide application to anthesis application, but this study did not
investigate fungicide application timing during or after the anthesis period. Researchers from Japan
reported that disease severity and toxin content of infected wheat could be reduced by a very late stage
application of fungicide, approximately 20 days after anthesis, which is at the late milk stage (Yoshida
et al. 2012). The effect of fungicide application timing on disease level and toxin accumulation i wheat
might vary in different climates. Thus, there is need to test fungicide efficacy in Western Canada
particularly in durum because there is no resistant germplasm and where FDK (Fusarium Damaged
Kernels) and the toxin is so important because the crop is used almost completely for human
consumption.
Another key to success in disease control is understanding the distribution and prevalence of the
pathogen species in the area. The predominate species causing FHB is Fusarium graminearum, but
there are several other species that may cause the disease in wheat in Canada. Species may differ from
each other in terms of the severity of symptoms and the amount of toxin produced. Thus, variability in

5
the causal Fusarium spp. across the province may be a reason for the variable results obtained from a
fungicide application. Differences in Fusarium spp. and the toxins they produce may even influence
the appropriate fungicide timing. Knowledge of the species involved in the 2014 and 2016 epidemics
would be useful to better understand this pathogen and the toxins present in the infected grain
7. Objectives and progress towards meeting each objective.
Objectives Progress
1) Optimize fungicide timing in durum to control fusarium head blight
(FHB) in SK.
Completed
2) Identify fusarium species and toxins produced from FHB infected spring
and durum wheat from 2014-2016.
Completed
8. Methodology:
Objective 1: to optimize fungicide timing in durum to control fusarium head blight (FHB) in SK.
Material and Methods
The study was conducted from 2016-2018 at five locations, depending on the year: Saskatoon (University
of Saskatchewan), Outlook (Canada-Saskatchewan Irrigation Diversification Centre), Melfort
(Agriculture and Agri-Food Canada, Melfort Research Farm) Scott (Western Applied Research
Corporation) and Indian Head (Agriculture and Agri-Food Canada, Indian Head Research Farm). There
were four locations in 2016, five in 2017 and four in 2018.
The susceptible (S) durum variety ‘CDC Desire’ was used for each experiment and the foliar
fungicide used was metconazole (Caramba®, BASF). The experiment was conducted in a randomized
complete block design (RCBD) with four replications. Eight treatments of metconazole fungicide were
applied to two seeding rates (400 seeds/m2 and 75 seeds/m2) at the following crop stages:
i) Application at BBCH 59 (end of heading, spike fully emerged)

6
ii) BBCH 61 (beginning of flowering: first anthers visible)
iii) BBCH 65 (full flowering: 50% of anthers mature)
iv) BBCH 69 (end of flowering: all spikelets have completed flowering, dehydrated anthers may remain)
v) BBCH 73 (early milk)
vi) BBCH 61 + BBCH 73 (beginning of flowering: first anthers visible + early milk)
vii) Unsprayed check
viii) Sprayed check, application at all timings to attempt as close as possible to a a disease- and toxin-free
check.
Inoculations: Corn spawn and FHB infected wheat residue were spread around the periphery of the trial
sites and within alley-ways of each experiment to initiate disease in the test. Irrigation was provided at
Saskatoon and Outlook to create favorable conditions for the disease.
Data was collected on emergence counts (plants / per square meter of each plot), days to
beginning and end of flowering, some spikes at fungicide application times and soft dough stage (spikes /
per square meter of each plot), FHB severity and incidence in the growing season.
Fusarium head blight was assessed using the FHB index [FHB index = (FHB severity * FHB
incidence)/100] (Stack and McMullen, 1995). For each plot, 50 wheat heads were assessed visually to
estimate the severity and incidence of FHB within each plot using the Horsfall-Barratt scale (Horsfall and
Barratt, 1945). The harvested grain was weighed after cleaning to calculate the final yield, later adjusted
to 14.5% moisture content. Test weight (TW; kg hl-1), thousand kernel weight (TKW; g), number of
Fusarium Damaged Kernel (FDK; %), and protein content (%) were measured for each plot. A
subsample of wheat kernels was ground to measure the protein and toxin (DON in ppm) contents.
Data analysis: Data were analyzed using PROC MIXED in SAS (9.4 SAS Institute Inc., 2010) to
evaluate the effect of fungicide application timing on yield, FHB index, FDK, toxin levels (DON) and

7
protein. Prior to analysis, the data from each location was tested for homogeneity using Levene’s test.
Heterogeneous variances were modeled with the repeated/group statement in SAS as required. The
experiment at each location was analyzed separately, where replicate was considered random, and
fungicide timing (growth stage) as fixed. Due to high variation in plant densities within plots and non-
significant interactions between seed rate and fungicide treatment, the analysis was done using seed rate
as a covariate, and the final modeling was based on fungicide application timing. The FHB index, yield,
FDK, protein content and DON were analyzed to determine the optimum fungicide application timing for
each factor.
For all statistically significant effects, contrast and least squared means estimate statements in
PROC MIXED were used to compare the unsprayed with the BBCH 59, BBCH 61, BBCH 65, BBCH 69,
BBCH 73 and (BBCH 61 + 73) treatments.
Objective2: to identify Fusarium spp. and toxins produced from FHB infected spring and durum wheat
in SK between 2014 and 2016.
Plant Material: naturally infected wheat samples were collected during crop years 2014 (n= 69), 2015
(n= 18) and 2016 (n=45) by the Saskatchewan Crop Insurance Corporation. Grain samples were ground
with a Laboratory Mill 3100-v3.3 EN, and 50 mg of the homogenised sample was used for DNA
extraction.
DNA extraction
Pure isolates of five Fusarium species were grown in potato dextrose broth at 25°C for four days.
Mycelium was harvested and freeze-dried using liquid nitrogen. Genomic DNA was extracted from the
freeze-dried fungal mycelium and the ground wheat kernels of each sample using the QIAGEN DNeasy
Blood & Tissue Kit (50) following the instruction manual provided by the manufacturer. Total genomic
DNA extracted was quantified using the spectrophotometer.
8
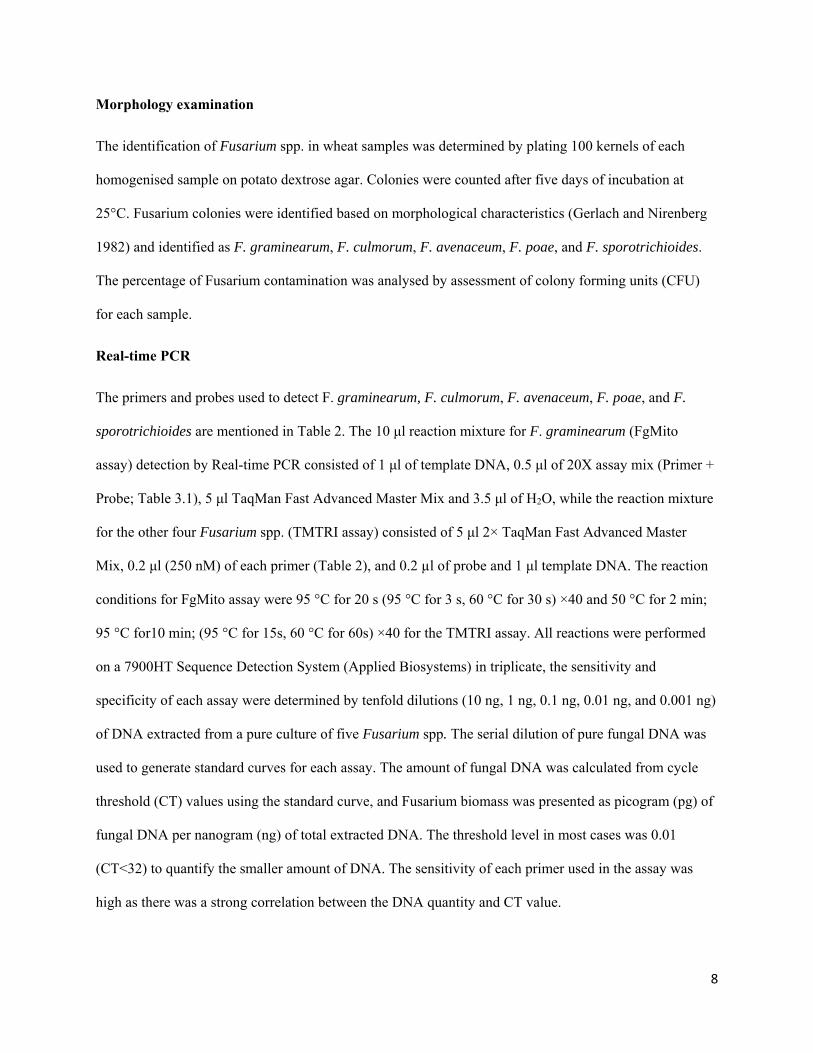
Morphology examination
The identification of Fusarium spp. in wheat samples was determined by plating 100 kernels of each
homogenised sample on potato dextrose agar. Colonies were counted after five days of incubation at
25°C. Fusarium colonies were identified based on morphological characteristics (Gerlach and Nirenberg
1982) and identified as F. graminearum, F. culmorum, F. avenaceum, F. poae, and F. sporotrichioides.
The percentage of Fusarium contamination was analysed by assessment of colony forming units (CFU)
for each sample.
Real-time PCR
The primers and probes used to detect F. graminearum, F. culmorum, F. avenaceum, F. poae, and F.
sporotrichioides are mentioned in Table 2. The 10 μl reaction mixture for F. graminearum (FgMito
assay) detection by Real-time PCR consisted of 1 μl of template DNA, 0.5 μl of 20X assay mix (Primer +
Probe; Table 3.1), 5 μl TaqMan Fast Advanced Master Mix and 3.5 μl of H2O, while the reaction mixture
for the other four Fusarium spp. (TMTRI assay) consisted of 5 μl 2× TaqMan Fast Advanced Master
Mix, 0.2 μl (250 nM) of each primer (Table 2), and 0.2 µl of probe and 1 μl template DNA. The reaction
conditions for FgMito assay were 95 °C for 20 s (95 °C for 3 s, 60 °C for 30 s) ×40 and 50 °C for 2 min;
95 °C for10 min; (95 °C for 15s, 60 °C for 60s) ×40 for the TMTRI assay. All reactions were performed
on a 7900HT Sequence Detection System (Applied Biosystems) in triplicate, the sensitivity and
specificity of each assay were determined by tenfold dilutions (10 ng, 1 ng, 0.1 ng, 0.01 ng, and 0.001 ng)
of DNA extracted from a pure culture of five Fusarium spp. The serial dilution of pure fungal DNA was
used to generate standard curves for each assay. The amount of fungal DNA was calculated from cycle
threshold (CT) values using the standard curve, and Fusarium biomass was presented as picogram (pg) of
fungal DNA per nanogram (ng) of total extracted DNA. The threshold level in most cases was 0.01
(CT<32) to quantify the smaller amount of DNA. The sensitivity of each primer used in the assay was
high as there was a strong correlation between the DNA quantity and CT value.

9
Chemotyping of Fusarium isolates
The Tri3 gene specific primers were used in multiplex PCR to determine the chemotype of Fusarium spp.
isolated from the wheat samples (Ward et al. 2002). The primers included 3CON (5′-TGGCAAAGACT
GGTTCAC-3′), 3NA (5′-GTGCACAGAATATACGAGC-3′), 3D3A (5′CGCATTGGCTAACAC ATG-
3′), and 3D15A (5′-ACTGACCCAAGCTGCCATC-3′). The reaction produced amplicons of
approximately 243 bp, 610 bp, and 840 bp for isolates that had 3-ADON, 15-ADON, and NIV
chemotypes, respectively. The DNA was extracted from the three F. graminearum isolates with
chemotypes 3-ADON, 15-ADON, and NIV, which were used as standard checks for the reactions. The
reaction mixture of 25 μl for the Tri3 multiplex PCR consisted of 2 μl template DNA, 0.5 µl of the four
primers (3CON, 3D3A, 3D15A, and 3NA), 12.5 µl of RedTaq and 8.5 µl of PCR water. The PCR was
performed on a Mastercycler Pro (Eppendorf) using the following cycling protocol: 5 min at 95°C for
initial denaturation; 30 cycles of 95°C for 45 sec (denaturation), 57°C for 45 sec (annealing) and 72°C for
2 min (extension), with a final extension step at 72°C for 10 min. Fifteen μl of the resulting PCR product
was run on a 2% agarose gel in TBE buffer; electrophoresis was carried out at 90 volts for 1.5 h. The
bands were visualized under UV light.
Mycotoxin
Four hundred g of each grain sample from 2014 and 2015 were submitted for toxin quantification to the
Prairie Diagnostic Services (Saskatoon), whereas toxin from 2016 samples was quantified in the Cereal
and Flax Pathology lab, Plant Sciences, University of Saskatchewan. The samples were tested for the
presence of thirteen mycotoxins [deoxynivalenol (DON), 3-acetyldeoxynivalenol (3-ADON), 15-
acetyldeoxynivalenol (15-ADON), diacetoxyscirpenol (DAS), nivalenol (NIV), T2 toxin (T2), HT2 toxin
(HT2), Alpha Zearalenol (AZEL), Beta Zearalenol (BZEL), Fumonisin B1, Fumonisin B2, Ochratoxin A
(OTA), and Zearalenone (Zen)].

10
9. Results and discussion:
Objective 1: Disease pressure was high at all sites in 2016, except Scott, which was dry during the crop
anthesis stage and therefore little to no disease developed. At Indian Head, conditions were favourable for
the disease, but due to very wet weather during anthesis, fungicide was not applied at all targeted crop
growth stages. In 2017, there was moderate disease pressure at Saskatoon, Scott, Outlook and Melfort;
however, Indian Head had low disease pressure. Disease pressure in 2018 was very low at all sites, except
Melfort, where it was low to moderate. The following results are from seven sites over the three years of
the study: 2016 (Saskatoon and Outlook), 2017 (Saskatoon, Scott, Melfort, and Outlook) and 2018
(Melfort). The interaction between fungicide treatments and seeding rates was non-significant in all years
at all sites.
Emergence and head density
At all locations and years, seeding rate treatment (high and low) affected seedling emergence and head
density (Fig 1.1).
Yield (kg ha-1)
2016. Seed rates (high and low) influenced yield at Saskatoon and Outlook (Table 1). Yield of the high
seed rate treatment was greater than the low seed rate treatment at both sites (Fig. 1.2). Fungicide application
timing effects on yield were significant compared with the unsprayed check at Saskatoon, but were non-
significant at Outlook (Table 1). The yield was increased by 40-45% in Saskatoon by applying metconazole
at BBCH 61 and BBCH 65 (Table 2.2).
2017. Seeding rate affected yield at Saskatoon, Outlook and Scott in 2017 (Table 1). Only at Melfort was
there no effect of seeding rate. Yields were greater with the higher seeding rate than the low seeding rate
(Figure 1.2). There was an effect of fungicide treatment on yield at Saskatoon and Outlook in 2017. At
Outlook, yield did not differ between the unsprayed check and all other fungicide treatments, except the
sprayed check, which had a higher yield than most other treatments (data not shown). At Saskatoon, there

11
was no difference in yield among fungicide timing treatments of BBCH61 to 73 or the dual treatment of
BBCH61 + 73, although yield tended to be greater at BBCH65 and 69 (Fig. 1.2). The heading application
(BBCH59) and the unsprayed check had comparable yields, which were lower than the other treatments.
2018. Yields of the two seed rates treatment did not differ from each other at Melfort (Table 1). Fungicide
treatments effects on yield were greater than the unsprayed check at BBCH59, 61, 65, and for the dual
treatment of BBCH61 + 73 (Fig. 1.2). Later application timings (BBCH 69 and 73) did not differ from
the unsprayed check.
FHB Index (%)
2016. The FHB index was greater under the high seeding rate treatment than the low seeding rate treatment
at Saskatoon and Outlook (Table 1, Fig. 1.3). Fungicide treatments influenced FHB index at Saskatoon
and Outlook. FHB index was decreased by approximately 50% in fungicide treatments compared with the
unsprayed check at both locations (Fig. 1.3). At Saskatoon, the dual application at BBCH 61+ 73 had lower
FHB index compared with all other application timings. At Outlook, all anthesis treatments had similar
effects on FHB index (Fig 1.3).
2017. Due to dry weather during crop anthesis, the disease pressure was moderate at all locations. As in
2016, at Melfort and Scott in 2017, the high seeding rate treatment had higher FHB index than the low
seeding rate treatment (Table 1, Fig. 1.3). The untreated check generally had the highest FHB index and
the sprayed check the lowest. The FHB index varied among other fungicide treatments, but generally,
fungicide application at the BBCH 65 crop growth stage tended to have the lowest FHB index at all
locations, although it was often not statistically different from FHB index at BBCH 61 or BBCH 69.
2018. There was no effect of seeding rate or fungicide treatment on FHB index at Melfort 2018 (Table 1)
2018. At Melfort BBCH 65 and dual fungicide treatment (BBCH 61+73) had similar and lower DON
content as compared to other treatments (Fig. 1.4).

12
Fusarium Damaged Kernels (%)
The FDK ranged from 3.1 to 28.8% at Saskatoon and 10.4 to 34.6% at Outlook. The effect of seeding rate
affected FDK levels only at Saskatoon 2016 (Fig 1.4).
2016. Fungicide treatments affected FDK at both Saskatoon and Outlook in 2016 (Table 1): the dual
fungicide treatment (BBCH 61 + 73) tended to have the lowest FDK count as compared to other fungicide
treatments at both locations although it was statistically imilar to BCH 69 (Fig. 1.4).
2017. The fungicide treatment effect on FDK was significant at Outlook (Table 1). The BBCH 65
application and dual fungicide treatment (BBCH 61 + 73) had comparable and low FDK as compared to
other fungicide treatments (Fig. 1.4).
2018. At Melfort, the dual fungicide treatment (BBCH 61 + 73) had the lowest FDK count followed by the
BBCH 65 application treatment (Fig.1.4).
DON (ppm)
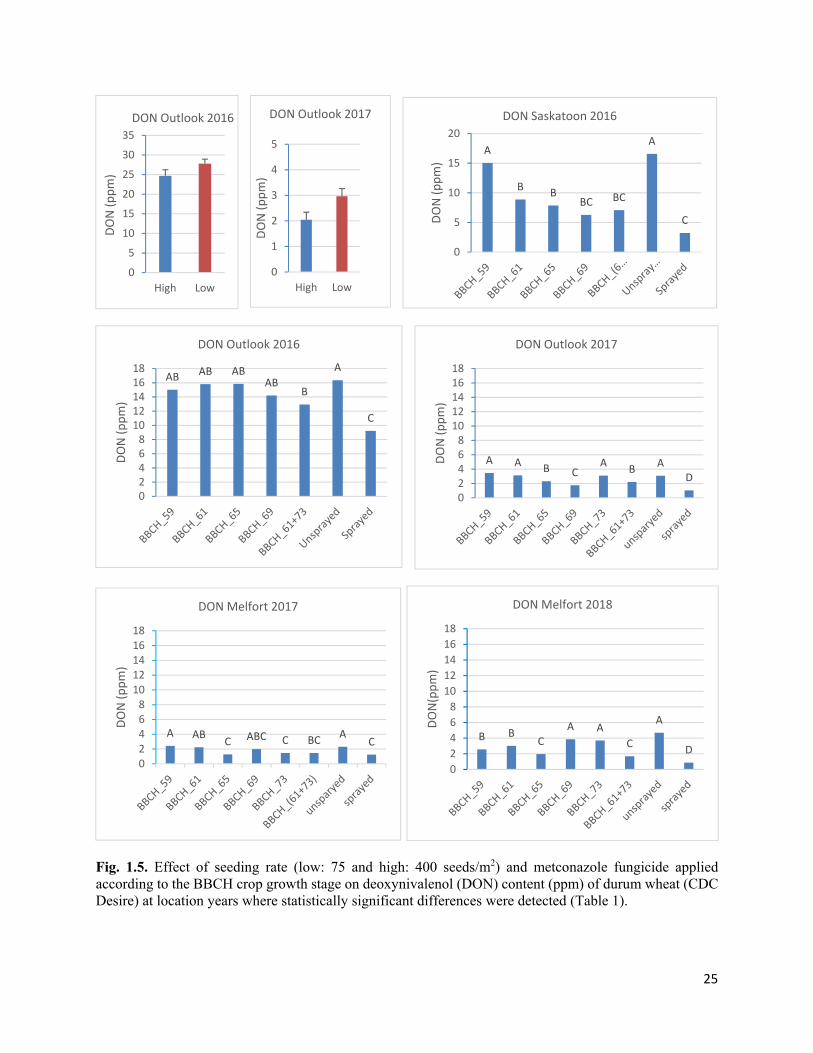
The DON content was high in 2016 due to an unusually wet year; mean DON content ranged from 2.4 to
22.0% at Saskatoon and 13.9 to 35.9% at Outlook. There was an effect of seed rate on DON content only
at Outlook (Table 1; Fig 1.5). In 2017, the mean DON content was <1 ppm at Saskatoon and Scott (data
not shown), although the effect of seeding rate was significant (Table 1). At Outlook, the range was 0.36
to 6.22 ppm and the high seeding rate treatment had lower DON content compared to the low seeding rate
treatment (Table 1; Fig. 1.5). At Melfort, the seeding rate treatments did not differ from each other in either
2017 or 2018.
2016. The DON content in the grain varied among fungicide application timing treatments. The DON
content at both locations was highest in the untreated check (Fig. 1.5). At Saskatoon, all fungicide
treatments had similar effects on DON content in the grain and the BBCH 59 application had the same
DON content as the unsprayed treatment. At Outlook, BBCH 61 and BBCH 69 applications had higher
toxin content than BBCH 65 or the dual fungicide treatment (BBCH 61 + 73).

13
2017. Differences were not biologically meaningful at Saskatoon and Scott as the DON content was <1
ppm. At Outlook, the BBCH 69 application resulted in lower DON content followed by the BBCH 65
application; whereas at Melfort the DON content was similar in the BBCH 65, BBCH 73 and the sprayed
check. (Fig. 1.5).
2018. DON content at Melfort was reduced by the dual application treatment and the BBCH 65 treatment
by a similar amount (~2 ppm) compared to the unsprayed check (~4.5 ppm).
In this study we tested the hypothesis that a late fungicide application timing, or a dual timing or early and
late, would reduce DON content more than fungicide applied at earlier timings, as was reported by Japanese
researchers (Yoshida et al. 2012). While there was a trend to reduced DON content with fungicide
applications at BBCH69 or 73, or by the dual treatment (BBCH 61 + 73), the magnitude was not usually
great enough that they were statistically different from earlier fungicide application timings.
Protein content (%)
2016. At Saskatoon and Outlook, there were differences in protein content between seeding rates (Table 1).
The protein content of the high seeding rate treatment was lower than the low seeding rate treatment (Fig.
1.6). At Saskatoon, the protein content of the high and low seeding rate treatments were 15.4% and 16.6%,
while the protein content at Outlook ranged between 16.4 and 17.9%. Fungicide treatment had an effect on
protein content at Saskatoon (P< 0.0013), but the effect was non-significant at Outlook. Protein content
was highest in the unsprayed treatment and was lowest in the BBCH 69 and BBCH 61+ 73 treatments.
2017. The effect of fungicide treatment on protein content was significant only at Outlook. The early
fungicide application, BBCH 59 had greater protein content than the sprayed check, but it did not differ
among all other fungicide treatments (Fig. 1.6).
2018. The protein content at Melfort ranged between 10.2 to 12.3% and the fungicide treatments had a
significant effect. The levels were highest in the BBCH 69 and BBCH 73 treatments and lowest in the
BBCH 59 treatment (Fig. 1.6).

14
Thousand Kernel Weight (g)
2016. Thousand kernel weight (TKW) differed among fungicide application treatments (Table 1; Fig. 1.7),
but seeding rate did not have any effect on TKW (g) at either Saskatoon or Outlook. Fungicide treatment
had an effect on TKW between the unsprayed treatment and the sprayed treatments at both locations with
increased TKW under all treatments [BBCH 61, BBCH 65, BBCH 69, BBCH (61+73)] except BBCH 59.
2017. Seeding rate treatment effect on TKW was significant for all locations in 2017. Low seeding rate
plots had great TKW than high seeding rate treatment. At Saskatoon, the results for TKW were
unexpected as the unsprayed check and fungicide treatments: BBCH61, BBCH65, BBCH69 all had
higher TKW than the sprayed check or the BBCH59 and BBCH 61 + 73 treatments (Fig. 1.7).
2018. No significant seed rate or fungicide application timing treatment effect was detected at Melfort in
2018 (Table 1).
Test weight (kg/hl)
2016. Seeding rate treatments had an effect on the test weight of the sample at Saskatoon and Outlook in
2016 (Table 1; Fig. 1.8). Test weight was greater in the high seeding rate treatment compared with the low
seeding rate. Fungicide application had an effect on test weight. The test weight was greater in the
unsprayed treatment compared with the sprayed treatment at both Saskatoon and Outlook. At Saskatoon,
BBCH 61, BBCH 65, BBCH 69 and the dual fungicide treatment (BBCH 61+ 73) had similar effects on
test weight, while the BBCH 59 treatment was like the unsprayed treatment (Fig. 1.8). At Outlook, the dual
fungicide treatment (BBCH 61 + 73) and BBCH 69 had test weight higher than the BBCH 61 or BBCH 65.
2017. Seeding rate affected test weight at Melfort; the high seeding rate treatment had higher test weight.
Fungicide treatment effect on TW was significant only at Outlook, although none of the fungicide
treatments differed from the unsprayed check. The sprayed check had substantially greater TW than all
other fungicide treatments except BBCH 69 (Fig. 1.8).

15
2018. There was no significant seeding rate or fungicide application timing treatment effect at Melfort
(Table 1).
Objective2:
Morphological examination
Among the 132 wheat samples plated, Fusarium spp. identified were: F. graminearum, F. culmorum, F.
avenaceum, F. poae and F. sporotrichioides. The saprophytes Alternaria alternata and Epicoccum nigrum
were also observed. Fusarium graminearum was the predominant species, identified in all the samples as
determined by the dark red colony color. Fusarium avenaceum was the second most frequent species
observed followed by F. culmorum, F. poae and F. sporotrichioides.
Species quantification (qPCR)
The FgMito and the TMTRI assays were used to quantify the five Fusarium spp. All the standard
concentrations conferred the presence of individual Fusarium spp. with a fluorescent signal. From a total
of 132 Fusarium infected wheat samples, qPCR analysis confirmed the presence of F. graminearum in all
wheat samples, although the concentration of each Fusarium spp. varied greatly among samples due to
differences in the amount of template DNA extracted (2.1 – 742.0 ng). The concentration of F.
graminearum DNA ranged from 0.5 to 139.4 pg/ng. Fusarium avenaceum DNA concentration ranged
between 0.02 to 19.8 pg/ng, while that of F. culmorum ranged between 0 to 3.2 pg/ng. Fusarium poae and
F. sporotrichioides DNA content was limited and ranged between 0 to 1.56 pg/ng and 0.3 to 0.71 pg/ng.
There was a difference in the average concentrations of Fusarium spp. over the years (Table 3). The
detection rate and level of all Fusarium spp. were higher in 2014 and 2016 and was lowest in 2015 samples.
Chemotyping of Fusarium isolates
The chemotype identification was done using the Tri3 gene-based PCR assay. Seventy-nine samples
produced two amplicons of approximately 243 bp and 610 bp, which corresponded to 3-ADON and 15-

16
ADON, respectively. Twenty-five samples had a single amplification of 243 bp equivalent to 3-ADON,
while only six samples had a single DNA band amplicon of 610 bp for 15-ADON. The remaining 22
samples did not amplify DNA. Thus, only 3-ADON and 15-ADON chemotypes were identified from the
fusarium infected wheat samples; 3-ADON were most common. The NIV chemotype was not detected
among the infected wheat samples collected.
Mycotoxin analysis
Trichothecene content was determined in 132 wheat samples. Of 13 mycotoxins, five (DON, 3-ADON, 15-
ADON, T2 and HT2 toxins) were detected among the samples. The highest concentration was DON,
followed by 3-ADON and 15-ADON. The T2 toxin was detected in 76% of the samples and the HT2 toxin
in 31%; however the concentration of HT2 toxin was approximately seven times higher than that of the T2
toxin. Deoxynivalenol content in the 2014 wheat samples ranged from 0.025 to 7.0 ppm, while the DON
levels in the 2015 and 2016 samples were lower; a few samples had DON contents below the limit of
detection (0.025 ppm). The DON derivatives 3-ADON and 15-ADON were also present in significant
amounts in all the years.
Correlation between qPCR and mycotoxin results
The CORR Procedure (Pearson correlation statistics) in SAS was used to determine the correlation between
the Fusarium DNA and the mycotoxins (DON, 3-ADON, 15-ADON, T2 and HT2). A weak correlation
(R2= 0.37, P = 0.0004) was detected between F. graminearum DNA and DON levels in the combined FHB
infected wheat samples of 2014 – 2016 (Table 4).
10. Conclusions and Recommendations:
Objective 1: Results from this study illustrate the importance of fungicide timing for the control of FHB
symptoms and deoxynivalenol accumulation in durum wheat. Yearly weather differences led to variability
in disease levels on the susceptible durum variety (CDC Desire) tested in 2016, 2017 and 2018. In 2016,

17
due to wet weather in Saskatchewan generally, conditions were favourable for the development of FHB;
whereas the drier summer of 2017, and the dry summer of 2018 resulted in conditions unfavorable for FHB
leading to low-moderate disease pressure. In this study, application of metconazole (a triazole fungicide)
significantly reduced FHB index, FDK and DON content at most of the locations and increased the yield
compared to the unsprayed inoculated check. The seeding rate treatment had a variable effect on parameters
evaluated across all locations. The fungicide*seed rate interaction was non-significant at all site years.
Due to the variation in disease pressure in seven site-years, the optimal time to apply fungicide to
control FHB varied. Under extended wet conditions, when the potential of severe FHB occurs as was the
case in 2016, all anthesis applications starting at BBCH 61 to BBCH 69 had a similar effect on the FHB
index, FDK, DON content and yield. Fungicide application at these growth stages would benefit durum
growers of Saskatchewan in controlling disease and reducing toxin levels in the grain. On the other hand,
in years with moderate disease pressure, as was the case in 2017 and 2018, the BBCH 65 application (full
flowering: 50% of anthers mature) may be of benefit to Saskatchewan durum growers. Application of
fungicide at the late stage (BBCH 73) generally did not reduce DON concentration more than a single
application at BBCH 65 to 73. These results are in contrast with the study done by the Japanese
researchers, Yoshida et al. (2012), who suggested that application of fungicide at 20 days after anthesis
greatly reduced the DON level in grain at maturity. The results of the dual application (BBCH 61 +
BBCH 73) treatment for disease control, FDK level and toxin accumulation were similar to the BBCH 65
application at all site-years.
Overall, the response of fungicide timing depended on environmental conditions. For instance, in high
disease pressure conditions, any of the anthesis applications (BBCH 61-69) will provide a similar benefit,
reduced disease symptoms (FDK), increased yield, and increased quality by lowering DON content in the
grain.

18
Objective 2:
Five Fusarium spp.: F. graminearum, F. culmorum, F. avenaceum, F. poae, and F. sporotrichioides were
identified among 132 field samples of wheat collected in 2014-2016. Fusarium graminearum was the most
frequent species identified and quantified followed by F. avenaceum. The chemotypes associated with the
Fusarium spp. were 3-ADON and 15-ADON. The NIV chemotype was not detected among the infected
wheat samples collected. Chemotype 3-ADON was detected more frequently and in higher number than
15-ADON. Mycotoxins quantified were DON, 3-ADON, 15-ADON, T2 and HT2 toxins. A weak
correlation (R2= 0.37, P = 0.0004) was detected between F. graminearum DNA and DON.
11. Is there a need to conduct follow up research?
This information is of value to wheat growers to assure them that under FHB conducive environmental
conditions they can widen their window of application. Our results suggest improved FHB control within
the BBCH61-69 growth stages, which is a wider window than currently recommended (BBCH61-65).
This information will be included in technical transfer events and published in the scientific literature.
More information on FHB management in durum in more environments would be beneficial, but more
experiments not necessary at this time.
12. Patents/ IP generated/ commercialized products: none. 13. List technology transfer activities:
WARC Scott, July 11th, 2018, a presentation on fungicide timing in durum. CSIDC Field Day Tour, July 12th, 2018, Outlook, SK. Presentation on FHB in durum (Gursahib
Singh). AAFC Melfort Research Farm Annual Field Day, July 18th, 2018. Presentation on fungicide timing in
durum. Fungicide Application? It’s Effective If You Do It Smart. Discover USASK.ca, Graduate and
Postdoctoral Studies, spring 2018. University of Saskatchewan Magazine article. Geddes, Geoff. Fusarium head blight as bad as it sounds. Grainews, Feb 7, 2017. Vol. 43 (3): 1 & 5. Fleury, Donna. Optimizing pesticide efficacy: a study of spray deposition into canopies. Article on
research with Dr. Tom Wolf, Agrimetrix Research and Training, on fungicide application strategies to

19
improve disease control of FHB in wheat and other diseases of canola and pea. Top Crop Manager, February 2017, pages 62-63.
Barber, Jennifer. Fusarium head blight – breaking the disease triangle. Pages 4-6 in Country Guide special supplement: ‘Disease & yield management guide,’ March 1, 2017
Barber, Jennifer. Leaf diseases and FHB – one application or two? Pages 10 & 14 in Country Guide special supplement: ‘Disease & yield management guide,’ March 1, 2017.
Fleury, Donna. Improving FHB management in durum. Pages 3, 4 & 14 in Top Crop Manager – Fungicide Guide, April 2017.
Bayer preferred grower seminar. Fusarium head blight management. Radisson Hotel, March 9th, 2017, Saskatoon, SK. (approximately 60 large acreage growers and 10 Bayer agronomists).
Meadow Lake Coop, What We Know About Fungicides To Manage Leaf Spot and Fusarium Head Blight in Wheat, contact Dave Cubbon and Bailey Wagman, March 15, 2017 (approximately 50 farmers and 10 industry agronomists)
33rd Annual Plant Sciences Graduate Student Symposium (PSGSS). University of Saskatchewan. March 31- April 1. Effect of fungicide application timing on Fusarium head blight in durum wheat
2017 Canadian Phytopathological Society Meeting Winnipeg. Fungicide timing for FHB in durum, June 19-21.
CropSphere, invited to speak on fusarium head blight management by SaskWheat, Jan. 10, 2017 at Prairieland Park (approximately 200 farmers and industry people).
SK Ministry of Agriculture Webinar, Series. November 22nd, 2016, 70 participants live and 170 in total, mainly CCAs. Fusarium head blight management.
Cross, Brian. Managing FHB, in person interview November 18th, 2016 for the Western Producer. Indian Head Field Day, July 18th, 2016, presentation on fungicide timing in durum. >250 farmers and
agronomists in attendance. [(Dr Guy Lafond Memorial Award (IHARF) recipient]. CSIDC Field Day Tour, July 20th, 2016, Outlook, SK. Presentation on fungicide application in durum
wheat to control FHB. AAFC Melfort Research Farm Annual Field Day, July 26th, 2016, presentation on fungicide timing in
durum. 14. List any industry contributions or support received. none 15. Acknowledgements.
Support for this study by the Saskatchewan Ministry of Agriculture, Agriculture Development Fund and the Canada-Saskatchewan Growing Forward 2 bilateral agreement. This support will be, acknowledged in all publications and presentations of this work in scientific journals, media articles, conference presentations and industry meetings.
16. Appendices:
Literature cited: Littell, R. C., Milliken, G. A., Stroup, W. W. and Wolfinger, R. D. 2006. SAS system for mixed models.
2nd ed. SAS Institute, Inc, Cary, NC. Horsfall, J.G., and Barratt, R.W. 1945. An improved grading system for measuring plant diseases.
Phytopathol. 35:65 (abstract). Stack, R. W., and McMullen, M. P. 1995. A visual scale to estimate the severity of Fusarium head blight
in wheat. N. D. State Univ. Ext. Ser. PP-1095. Starkey, D. E., Ward, T. J., Aoki, T., Gale, L. R., Kistler, H. C., Geiser, D. M., Suga, H., et al. 2007.
Global molecular surveillance reveals novel Fusarium head blight species and trichothecene toxin diversity. Fungal Genetics and Biology 44: 1191-1204.

20
Gale, L. R., Ward, T. J., Balmas, V. and Kistler, H. C. 2007. Population subdivision of Fusarium graminearum sensu stricto in the upper Midwestern United States. Phytopathology 97: 1434-1439.
Gerlach, W., and Nirenberg, H. (1982) The genus Fusarium - A pictorial atlas. Mitteilungen aus der Biologischen Bundesanstalt Für Landund Forstwirtschaft (Berlin – Dahlem) 209:1-405.
Yoshida M, Nakajima T, Tomimura K, Suzuki F, Arai M and Miyasaka A. 2012. Effect of the timing of fungicide application on Fusarium head blight and mycotoxin accumulation in wheat. Plant Disease 96: 845-851.

21
Figures and tables
Fig. 1.1. Effect of seeding rate (low: 75 and high: 400 seeds/m2) on plant/seedling and head density (plants or heads/m2) of durum wheat (CDC Desire) at location years where statistically significant differences were detected (Table 1).
0
100
200
300
400
500
600
Saskatoon Outlook
Plants /m2
Plant density 2016
High Low
0
100
200
300
400
500
600
Saskatoon Outlook
Heads / m2
Head density 2016
High Low
0
100
200
300
400
500
600
Saskatoon Outlook Scott Melfort
Plants/ sq m
Plant density 2017
High Low
0
100
200
300
400
500
600
Saskatoon Outlook Scott Melfort
Heads / m2
Head density 2017
High Low
0
100
200
300
400
500
600
High Low
Plants/ m2
Plant density Melfort 2018
0
100
200
300
400
500
600
High Low
Heads /m
2
Head density Melfort 2018

22
Fig. 1.2. Effect of seeding rate (low: 75 and high: 400 seeds/m2) and metconazole fungicide applied according to the BBCH crop growth stage on yield (kg/ha) of durum wheat (CDC Desire) at location years where statistically significant differences were detected (Table 1).
0
1000
2000
3000
4000
5000
6000
7000
Saskatoon Outlook
Kg/ha
Yield 2016
D
BC ABC C
D
A
010002000300040005000600070008000
Kg/ha
Yield Saskatoon 2016
0
1000
2000
3000
4000
5000
6000
7000
Outlook 2017 Scott 2017
Kg/ha
Yield 2017
high low B ABCA A
AB ABC C ABC
010002000300040005000600070008000
kg/ha
Yield Saskatoon 2017
B BC BCD CD
ABD
A
0
1000
2000
3000
4000
5000
6000
7000
8000
BBCH_59 BBCH_61 BBCH_65 BBCH_69 BBCH_73 BBCH_61+73 unsprayed sprayed
Kg/ha
Yield Melfort 2018

23
Fig. 1.3. Effect of seeding rate (low: 75 and high: 400 seeds/m2) and metconazole fungicide applied according to the BBCH crop growth stage on Fusarium head blight (FHB; %) index of durum wheat (CDC Desire) at location years where statistically significant differences were detected (Table 1).
02468
10121416
Saskatoon Outlook
FHB In
dex (%)
FHB index 2016
High Low
02468
10121416
Melfort 2017 Scott 2017
FHB index (%)
FHB index 2017
High Low
B BB
B
C
A
C
0
5
10
15
20
25
FHB In
dex (%)
FHB index Saskatoon 2016
BC BC C C
A
C
0
5
10
15
20
25
FHB In
dex (%)
FHB index Outlook 2016
AB
CD BC BA A
D
05
10152025
FHB index (%)
FHB index Saskatoon 2017
BC BCDE DE
BCDE
A
F
05
10152025
FHB index Outlook 2017
B B C BC BC BC
A
D05
10152025
FHB index (%)
FHB index Scott 2017
ABC C
ABCC BC
ABC
0
5
10
15
20
25
FHB index (%)
FHB index Melfort 2017

24
Fig. 1.4. Effect of seeding rate (low: 75 and high: 400 seeds/m2) and metconazole fungicide applied according to the BBCH crop growth stage on Fusarium damaged kernels (FDK; %) of durum wheat (CDC Desire) at location years where statistically significant differences were detected (Table 1).
0
2
4
6
8
10
12
14
16
High Low
FDK (%)
FDK Saskatoon 2016
A
BBC BC
CD
A
D
0
5
10
15
20
25
30
FDK (%)
FDK Saskatoon 2016
AB AB AB
BCCD
A
D
0
5
10
15
20
25
30
FDK (%)
FDK Outlook 2016
ABB B
AB ABB
A
B
0
5
10
15
20
25
30
FDK (%)
FDK Scott 2017
AB ABBC
AB AB
C
A
C
0
5
10
15
20
25
30
FDK (%)
FDK Outlook 2017
A
BC BC BC
D
A
E
0
5
10
15
20
25
30
FDK (%)
FDK Melfort 2018
25
Fig. 1.5. Effect of seeding rate (low: 75 and high: 400 seeds/m2) and metconazole fungicide applied according to the BBCH crop growth stage on deoxynivalenol (DON) content (ppm) of durum wheat (CDC Desire) at location years where statistically significant differences were detected (Table 1).
0
5
10
15
20
25
30
35
High Low
DON (ppm)
DON Outlook 2016
0
1
2
3
4
5
High Low
DON (ppm)
DON Outlook 2017
A
BB
BC BC
A
C
0
5
10
15
20
DON (ppm)
DON Saskatoon 2016
AB AB ABAB
B
A
C
02468
1012141618
DON (ppm)
DON Outlook 2016
A A B CA
BA
D
02468
1012141618
DON (ppm)
DON Outlook 2017
A ABC ABC C BC
AC
02468
1012141618
DON (ppm)
DON Melfort 2017
B BC
A A
C
A
D
0
2
4
6
8
10
12
14
16
18
DON(ppm)
DON Melfort 2018

26
Fig. 1.6. Effect of seeding rate (low: 75 and high: 400 seeds/m2) and metconazole fungicide applied according to the BBCH crop growth stage on protein content (%) of durum wheat (CDC Desire) at location years where statistically significant differences were detected (Table 1).
14.5
15.5
16.5
17.5
18.5
Saskatoon Outlook
Protein (%)
2016High Low
AB B
C C
A
C
101112131415161718
Protein (%)
Protein Saskatoon 2016
A AB AB AB AB AB AB B
10
11
12
13
14
15
16
17
Protein (%)
Protein Outlook 2017
C BC BCA A ABC AB
C
10
11
12
13
14
15
16
17
Protein (%)
Protein Melfort 2018

27
Fig. 1.7. Effect of seeding rate (low: 75 and high: 400 seeds/m2) and metconazole fungicide applied according to the BBCH crop growth stage on thousand kernel weight (TKW) of durum wheat (CDC Desire) at location years where statistically significant differences were detected (Table 1).
05
101520253035404550
Saskatoon2017
Outlook2017
Melfort2017
Scott 2017
(g)
TKW
High LowC
B B B B
D
A
05
101520253035404550
(g)
TKW Saskatoon 2016
C B BC BC BC CA
05
101520253035404550
(g)
TKW Outlook 2016
BC A A A AB BC A C
05
101520253035404550
(g)
TKW Saskatoon 2017

28
Fig. 1.8. Effect of seeding rate (low: 75 and high: 400 seeds/m2) and metconazole fungicide applied according to the BBCH crop growth stage on test weight of durum wheat (CDC Desire) at location years where statistically significant differences were detected (Table 1).
6668707274767880
Saskatoon 2016 Outlook 2016 Melfort 2017
Kg/hl
Test weight
High Low
C
B B B B
C
A
6668707274767880
Kg/hl
Test weight Saskatoon 2016
EFDE CD
BC B
F
A
66
68
70
72
74
76
78
80
Kg/hl
Test weight Outlook 2016
C BC BC AB BC BC BCA
66
68
70
72
74
76
78
80
Kg/hl
Test weight Outlook 2017

29
Table 1: Probability table for treatment and interaction effects on the parameters recorded for metconazole fungicide applied to durum wheat in Saskatchewan, 2016-2018. TRT – fungicide treatment; SR – seeding rate.
Factors FHB Index FDK DON Yield Protein TKW Test Weight Outlook 2016
F value P F value P F value P F value P F value P F value P F value P
TRT 12.49 <.0001 5.20 0.0012 4.53 0.0029 1.64 0.1846 3.50 0.0114 7.44 0.0001 22.72 <.0001
SR 9.23 0.0054 0.11 0.7401 14.33 0.0008 70.36 <.0001 62.60 <.0001 0.47 0.5001 37.11 <.0001
SR*TRT 1.77 0.1452 0.57 0.7511 1.58 0.1919 2.26 0.0755 1.23 0.3241 2.96 0.2440 0.57 0.7506
Saskatoon 2016 TRT 74.04 <.0001 41.83 <.0001 32.71 <.0001 16.01 <.0001 10.74 <.0001 47.75 <.0001 17.78 <.0001
SR 7.95 0.0076 4.89 0.0331 1.11 0.2994 57.60 <.0001 64.88 <.0001 3.59 0.0659 18.34 0.0001
SR*TRT 3.90 0.3900 0.66 0.6825 7.08 <.0001 0.76 0.6029 1.27 0.2924 0.37 0.8952 1.05 0.4079
Saskatoon 2017 TRT 10.67 <.0001 0.59 0.6950 28.98 <.0001 4.10 0.0026 2.01 0.0741 4.35 0.0009 0.14 0.9947 SR 0.50 0.4840 0.43 0.4001 31.53 <.0001 4.35 0.0451 3.01 0.0897 65.74 <.0001 0.45 0.5103 SR*TRT 0.26 0.9659 0.78 0.6083 4.67 0.651 0.43 0.8787 0.95 0.4759 1.19 0.3268 0.14 0.9946
Melfort 2017 TRT 3.30 0.0091 0.14 0.9947 8.77 0.0005 1.47 0.2500 0.98 0.4557 0.71 0.6627 1.46 0.2070 SR 35.06 <.0001 0.90 0.8559 1.52 0.2281 0.02 0.8793 16.39 0.0002 16.28 0.0002 42.61 <.0001 SR*TRT 2.48 0.3690 0.66 0.6875 1.40 0.2877 1.13 0.3948 2.06 0.0680 0.78 0.6083 1.43 0.2166
Outlook 2017 TRT 43.95 <.0001 6.23 0.0001 15.36 <.0001 2.74 0.0186 2.66 0.0215 0.87 0.5471 2.62 0.0233 SR 0.43 0.5183 0.45 0.5074 14.49 0.0007 8.03 0.0069 57.75 <.0001 7.18 0.0135 0.27 0.6086 SR*TRT 1.71 0.3122 1.40 0.2425 0.75 0.6367 1.93 0.0876 1.14 0.3532 0.48 0.8365 1.82 0.1144
Scott 2017 TRT 22.68 <.0001 2.06 0.0569 F value P 1.45 0.2250 1.08 0.3940 1.49 0.2413 2.93 0.1001 SR 22.17 <.0001 1.00 0.3227 4.53 0.0353 61.37 <.0001 15.22 0.0003 15.90 0.0054 0.09 0.7671 SR*TRT 1.11 0.3749 0.54 0.8018 14.48 0.2500 0.24 0.9718 1.20 0.3197 0.61 0.7392 1.86 0.0984
Melfort 2018 TRT 7.95 0.930 121.64 <.0001 10.32 0.002 5.65 0.0010 2.65 0.0210 1.76 0.1198 0.34 0.2390
SR 59.24 0.115 4.55 0.482 0.17 0.686 3.08 0.0860 4.93 0.3200 0.01 0.9361 0.13 0.8630
SR*TRT 3.12 0.438 3.66 0.268 2.08 0.123 0.45 0.8630 1.36 0.2440 1.35 0.2510 0.46 0.4610

30
Table 2: Primers and probes used to detect the five species of Fusarium DNA in wheat samples Species Primer/probe
name Primer/probe sequence
F. graminearum COB1 primer COB2 primer COB probe
TGGCCTGAATGAAGGATTTCTAG CATCGTTGTTAACTTATTGGAGATG FAM-TTAAACACTCAAACACTACA-MGB
(Kulik et al. 2015)
F. culmorum TMFcf TMFcr TMFcp
CACCGTCATTGGTATGTTGTCACT CGGGAGCGTCTGATAGTGG TGCTGTCATCACATTCTCATACTAAC
(Nicolaisen et al. 2009)
F. avenaceum TMAVf TMAVr TMAVp
AGATCGGACAATGGTGCATTATAA GCCCTACTATTTACTCTTGCTTTTG 6FAM-CTCCTGAGAGGTCCCAGAGATGAACATAACTTC
(Halstensen et al. 2006)
F. poae TMpoaef TMpoaer probe
GCTGAGGGTAAGCCGTCCTT TCTGTCCCCCCTACCAAGCT ATTTCCCCAACTTC GACTCTCCGAGGA
(Yli-Mattila et al. 2008)
F. Sporotrichioides
TMLANf TMLANr TMLANp
GAGCGTCATTTCAACCCTCAA GACCGCCAATCAATTTGGG 6FAM-AGCTTGGTGTTGGGATCTGTCCTTACCG
(Halstensen et al. 2006)
Table 3. The quantity of DNA detected among fusarium infected wheat samples in 2014, 2015 and 2016
2014 2015 2016
Fusarium spp. Samples Min
(pg/ng) Max
(pg/ng) Mean
(pg/ng) Samples
Min (pg/ng)
Max (pg/ng)
Mean (pg/ng)
Samples Min
(pg/ng) Max
(pg/ng) Mean
(pg/ng) F. avenaceum 69 0.09 19.8 3.03 18 0.02 8.07 1.6 32 0.08 14.44 4.65 F. culmorum 65 0.01 3.2 0.49 16 0.00 0.95 0.2 28 0.01 1.97 0.23 F. poae 69 0.01 1.56 0.28 17 0.01 0.75 0.1 29 0.04 1.48 0.37 F. sporotrichioides 2 0.34 0.38 0.36 1 0.70 0.7 0.7 3 0.08 0.26 0.15 F. graminearum 69 5.31 139.4 20.04 18 0.53 4.82 2.3 44 0.19 49.81 7.78
Min- minimum DNA quantity of Fusarium spp. (pg) in total DNA (ng); Max- maximum DNA quantity of Fusarium spp. (pg) in total DNA (ng); Mean- mean DNA concentration among samples.

Table 4. Pearson correlation coefficients between Fusarium spp. (F. graminearum, F. avenaceum, F.
culmorum, F. poae and F. sporotrichioides), fusarium damaged kernel (FDK) and mycotoxin (DON,
3ADON, 15ADON, T2 and HT2) content (ppm) in 2014 and 2016.
2014-2016 F. avenaceum F. culmorum F. poae F. sporotrichioides
F. graminearum
Fusarium damaged kernel (FDK)
r 0.2 -0.20797 0.05091 -0.62615 0.1171 P 0.0633 0.0625 0.6416 0.5693 0.2801 N 87 81 86 3 87
Deoxynivalenol (DON)
r 0.19372 -0.1087 0.22094 -0.96658 0.37415 P 0.0757 0.3372 0.0434 0.1650 0.0004 N 85 80 84 3 85
3-ADON r -0.13606 0.01717 0.00586 -0.02796 0.14234 P 0.2349 0.8862 0.9597 0.9822 0.2138 N 78 72 77 3 78
15-ADON r -0.06285 0.06628 0.11526 0.19701 0.3131 P 0.6026 0.5970 0.3420 0.8738 0.0078 N 71 66 70 3 71
T2 toxin r 0.25567 0.12945 0.19978 -0.28539 0.10243 P 0.0414 0.3243 0.1165 0.8158 0.4206 N 64 60 63 3 64
HT2 toxin r 0.38477 -0.11471 0.22784 0.97106 -0.09203 P 0.0393 0.5689 0.2436 0.1535 0.6349 N 29 27 28 3 29