Final Report for State of Minnesota Project Contract ...
99
Nutrient removal in agricultural drainage ditches Final Report for State of Minnesota Project Contract #63906 Prepared by Jeff Strock, Andry Ranaivoson, Gary Feyereisen, Kurt Spokas, David Mulla and Marta Roser January, 2017 Page 1 of 99
Transcript of Final Report for State of Minnesota Project Contract ...
Nutrient removal in agricultural drainage ditches
Final Report for State of Minnesota Project Contract #63906
Prepared by
Jeff Strock, Andry Ranaivoson, Gary Feyereisen, Kurt Spokas, David Mulla and Marta Roser
January, 2017
Page 1 of 99
katiee
Stamp small

(intentionally blank page)
Page 2 of 99

Acknowledgements
First and foremost, we would like to thank Heather Johnson (MDA) and Heidi Peterson (MDA) for their support and guidance throughout the project. Marta Roser (former UMN graduate student) for her diligent research in the laboratory. We thank Todd Schumacher for his experienced help with the column experiment and laboratory analyses. Lastly, thanks to Mark Coulter (UMN Technician) for his invaluable help in the field with the bioreactors.
Page 3 of 99

(intentionally blank page)
Page 4 of 99
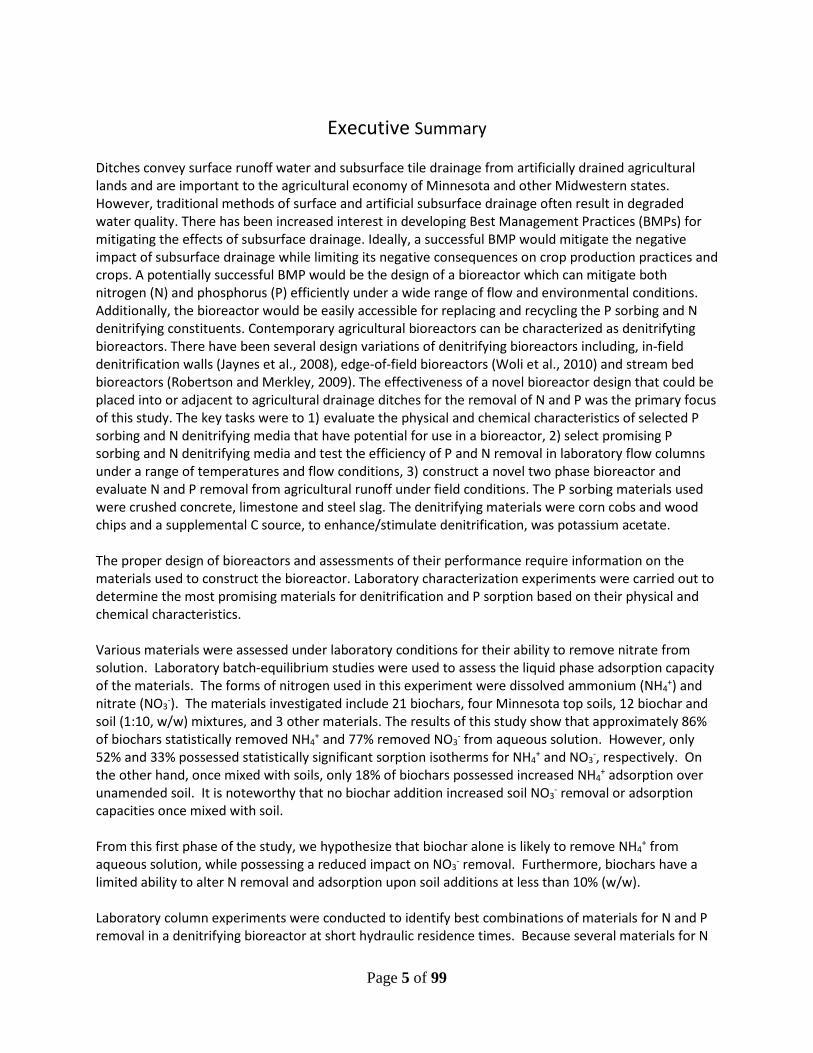
Executive Summary
Ditches convey surface runoff water and subsurface tile drainage from artificially drained agricultural lands and are important to the agricultural economy of Minnesota and other Midwestern states. However, traditional methods of surface and artificial subsurface drainage often result in degraded water quality. There has been increased interest in developing Best Management Practices (BMPs) for mitigating the effects of subsurface drainage. Ideally, a successful BMP would mitigate the negative impact of subsurface drainage while limiting its negative consequences on crop production practices and crops. A potentially successful BMP would be the design of a bioreactor which can mitigate both nitrogen (N) and phosphorus (P) efficiently under a wide range of flow and environmental conditions. Additionally, the bioreactor would be easily accessible for replacing and recycling the P sorbing and N denitrifying constituents. Contemporary agricultural bioreactors can be characterized as denitrifyting bioreactors. There have been several design variations of denitrifying bioreactors including, in-field denitrification walls (Jaynes et al., 2008), edge-of-field bioreactors (Woli et al., 2010) and stream bed bioreactors (Robertson and Merkley, 2009). The effectiveness of a novel bioreactor design that could be placed into or adjacent to agricultural drainage ditches for the removal of N and P was the primary focus of this study. The key tasks were to 1) evaluate the physical and chemical characteristics of selected P sorbing and N denitrifying media that have potential for use in a bioreactor, 2) select promising P sorbing and N denitrifying media and test the efficiency of P and N removal in laboratory flow columns under a range of temperatures and flow conditions, 3) construct a novel two phase bioreactor and evaluate N and P removal from agricultural runoff under field conditions. The P sorbing materials used were crushed concrete, limestone and steel slag. The denitrifying materials were corn cobs and wood chips and a supplemental C source, to enhance/stimulate denitrification, was potassium acetate. The proper design of bioreactors and assessments of their performance require information on the materials used to construct the bioreactor. Laboratory characterization experiments were carried out to determine the most promising materials for denitrification and P sorption based on their physical and chemical characteristics. Various materials were assessed under laboratory conditions for their ability to remove nitrate from solution. Laboratory batch-equilibrium studies were used to assess the liquid phase adsorption capacity of the materials. The forms of nitrogen used in this experiment were dissolved ammonium (NH4
+) and nitrate (NO3
-). The materials investigated include 21 biochars, four Minnesota top soils, 12 biochar and soil (1:10, w/w) mixtures, and 3 other materials. The results of this study show that approximately 86% of biochars statistically removed NH4
+ and 77% removed NO3- from aqueous solution. However, only
52% and 33% possessed statistically significant sorption isotherms for NH4+ and NO3
-, respectively. On the other hand, once mixed with soils, only 18% of biochars possessed increased NH4
+ adsorption over unamended soil. It is noteworthy that no biochar addition increased soil NO3
- removal or adsorption capacities once mixed with soil. From this first phase of the study, we hypothesize that biochar alone is likely to remove NH4
+ from aqueous solution, while possessing a reduced impact on NO3
- removal. Furthermore, biochars have a limited ability to alter N removal and adsorption upon soil additions at less than 10% (w/w). Laboratory column experiments were conducted to identify best combinations of materials for N and P removal in a denitrifying bioreactor at short hydraulic residence times. Because several materials for N
Page 5 of 99

and for P removal were identified, testing all combinations was deemed to be too complicated for one experiment. So, six materials or material combinations were tested in columns with a focus on nitrate removal performance. The experiment was operated at 15°C for 14 weeks, 5°C for 13 weeks, and again at 15°C for 7 weeks. Flow simulated a typical drainage hydrograph throughout each week, with water sampling occurring after HRTs of 1.5, 8, 12, and 24 hours. Nitrate-N load reductions ranged from 24 to 96% in the two runs at 15°C and from 4 to 80% during the cold run. The addition of acetate, a readily available carbon source, to wood chips resulted in the highest removal of nitrate-N. The three treatments with corn cobs – corn cobs, corn cobs + modified coconut coir, corn cobs + MCC + biochar – performed better than wood chips and wood chips + biochar. A separate, preliminary experiment identified P-sorbing candidate materials for the field experiment: crushed concrete, steel slag, and limestone. Field experiments were conducted at the University of Minnesota Southwest Research and Outreach Center (SWROC) in Lamberton, Minnesota to experimentally assess the impact of a novel two phase bioreactor design for removing N and P from agricultural subsurface drainage water. Modular bioreactors were constructed using mixed woodchips plus corn cobs for facilitating denitrification plus either crushed concrete, steel slag or limestone fragments for P sorption. Experimental bioreactors were installed adjacent to an existing drainage ditch/waterway. Flows from the bioreactors were directed to flow gauges and water sampling equipment. The response of the different bioreactors was assessed using a calibration and a treatment period. During the calibration period only subsurface drainage water was delivered to the bioreactors. During the treatment period subsurface drainage water spiked with potassium acetate was delivered to the bioreactors. Data were collected and analyzed to determined the performance and efficiency of the modular bioreactors under various temperature regimes. Nitrate removal was tied to the retention time in the bioreactor coupled with the addition of acetate. Longer retention time resulted in a greater removal of nutrients however, acetate improved nitrogen removal efficiency. Results also indicate that reduced conditions within the bioreactors but only consistently when acetate was added to the subsurface drainage water.
Page 6 of 99
Table of Contents Acknowledgements ......................................................................................................................... 3
Executive Summary ........................................................................................................................ 5
Chapter 1 ....................................................................................................................................... 13
1.1 Introduction ............................................................................................................................. 13
Chapter 2 ....................................................................................................................................... 15
2.1 Introduction ............................................................................................................................. 15
2.2 Materials and Methods ............................................................................................................ 18
Biochar .................................................................................................................................. 18
Table 2.1 Various materials evaluated in this study............................................................. 19
Soil and Reference Materials. ............................................................................................... 20
Table 2.2. Soil physical and drainage water chemistry properties ....................................... 21
ICP testing for natural drainage waters from Granite Falls and Grand Meadow ................. 21
Table 2.3. Ultimate and Proximate Analysis of the materials used in this experiment ....... 22
Figure 2-1 Locations where soil was sampled for this study are shown in the blue outlined
symbols: ( ) Rosemount, ( ) Becker, ( ) Morris, and ( ) Hayward, Wi. The filled in symbols in green represent the two drainage water sampling locations: ( ) Grand Meadows and ( ) Granite Falls. ........................................................................................ 23
Ultimate, Proximate and pH Analysis .................................................................................. 24
Batch Equilibrium Incubation and Analysis ......................................................................... 24
P-Adsorbing Materials .......................................................................................................... 26
Figure 2-2 Triplicate run for pH; biochar is activated biochar No 26. ................................ 27
Amination procedure for modified biochar .......................................................................... 29
Statistics ................................................................................................................................ 30
2.3 Results and Discussion ........................................................................................................... 30
Biochar properties ................................................................................................................. 30
Temperature effect on biochar properties. ............................................................................ 31
Soil Properties ....................................................................................................................... 31
Laboratory Sorption Experiments ......................................................................................... 31
Biochar N sorption incubations. ........................................................................................... 31
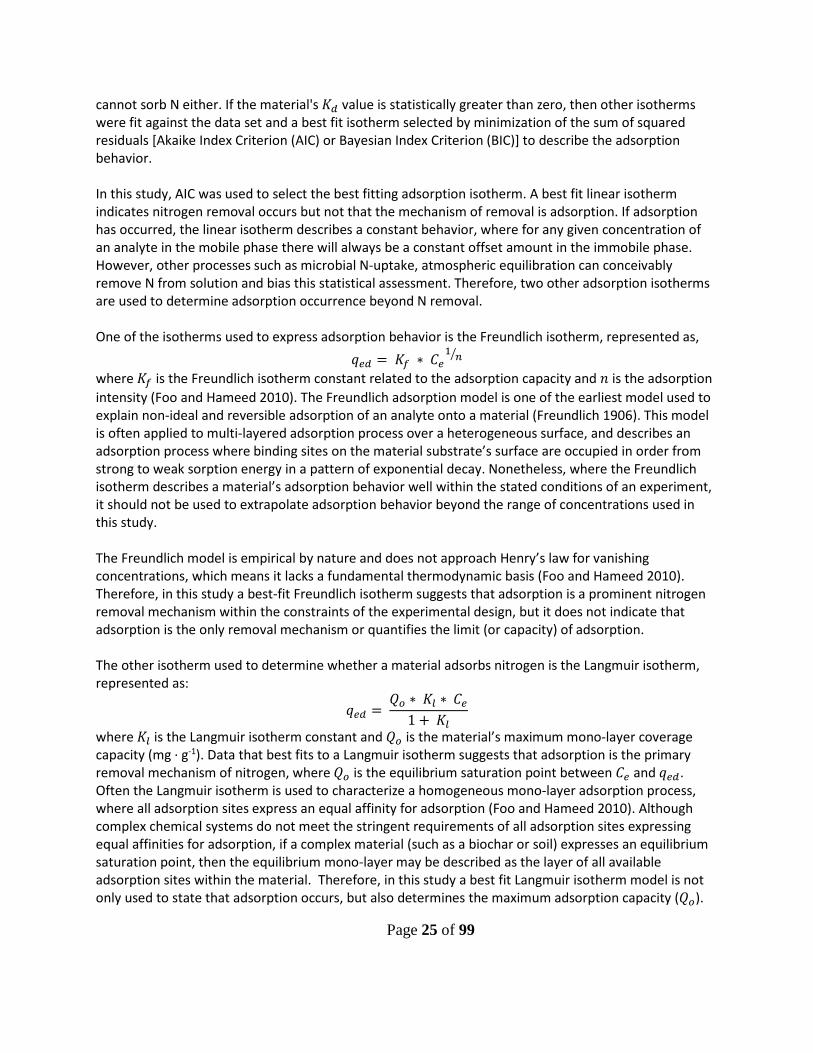
Figure 2-3. Isotherms across the 21 different materials from the laboratory incubations for the sorption of ammonium (NH4
+). ....................................................................................... 33
Figure 2-4. Isotherms across the 21 different materials from the laboratory incubations for the sorption of nitrate (NO3
-). ............................................................................................... 34
Page 7 of 99
Table 2.4. Isotherm fitting coefficients ................................................................................ 35
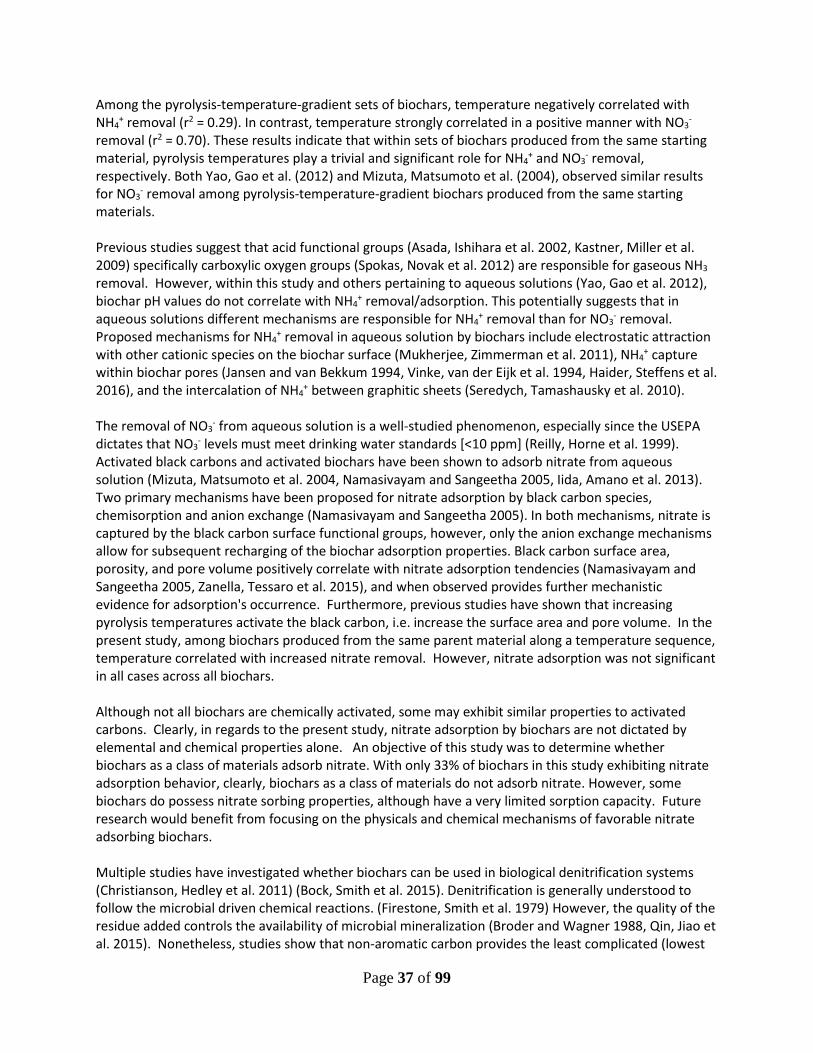
Soil N incubations ................................................................................................................. 38
Reference materials N incubations ....................................................................................... 38
Figure 2-5. Sorption isotherms for the four soils used in this experiment for A) ammonium and B) nitrate......................................................................................................................... 39
Figure 2-6. Sorption isotherms for the three reference materials (concrete, phosphorus remover, and nitrate remover) that were evaluated in this experiment for A) ammoniuim and B) nitrate sorption. ................................................................................................................ 40
Biochar amended soil N incubations .................................................................................... 41
Figure 2-7. Amended soil incubations for the sorption of ammonium across Morris and Rosemount soils. ................................................................................................................... 42
Figure 2-8. Amended soil incubations for nitrate sorption across Morris and Rosemount. soils ....................................................................................................................................... 42
Longer term continuous monitoring experiments ................................................................. 43
Figure 2-9. Percentage of phosphorus removed from a known initial concentration as a function of contact time for the four materials (activated charcoal, concrete, coconut biochar, and modified coconut biochar). .............................................................................. 44
Figure 2.10 – Kinetic evaluation of phosphorus disappearance fit to a first-order kinetic model (y = a e − bt) for a) activated charcoal, b) crushed concrete, c) coconut coir biochar, and d) modified coconut coir biochar. Blue line represents the 95% confidence bands on the model fit. This data is for drainage water from Granite Falls (Western Minnesota). ..... 45
Figure 2.11 – Kinetic evaluation of phosphorus disappearance fit to a first-order kinetic model (y = a e − bt) for a) activated charcoal, b) crushed concrete, c) coconut coir biochar, and d) modified coconut coir biochar. Blue line represents the 95% confidence bands on the model fit. This data is for drainage water from Grand Meadow (Southern Minnesota). 46
Table 2.5 Kinetic parameters from fits shown in Figure 2.9 & 2.10. The data was fit to the model : y = a e − bt, where y is the concentration of phosphorus, t is the time, and a & b are the coefficients given in the table. The numbers in parentheses are the standard errors of the non-linear fit of the model coefficient determination. .................................................... 47
Figure 2-12. Nitrate concentration as a function of time with four materials (activated charcoal, concrete, coconut biochar, and modified coconut biochar) for the two different tile drainage waters (Grand Meadows and Granite Falls)........................................................... 48
Table 2.6 Kinetic parameters from fits shown in Figure 2.11. The data was fit to the model : y = a e − bt, where y is the concentration of nitrate, t is the time, and a & b are the coefficients given in the table. The numbers in parentheses are the standard errors of the model coefficient determination. .......................................................................................... 49
Electrical Conductivity, pH and ORP alterations with time ................................................. 50
Figure 2.13 Trends in pH and electrical conductivity for 24 hours following addition of the materials to Granite Falls drainage water: a) activated charcoal, b) concrete, c) coconut biochar, and d) modified coconut biochar. ........................................................................... 51
Page 8 of 99
Figure 2.14 Oxidation-Reduction Potential (ORP) changes in the first 24 hours for a) activated charcoal, b) concrete, c) coconut biochar, and d) modified coconut biochar. ....... 52
2.4 Conclusions ............................................................................................................................. 53
Nitrate/Ammonium: .............................................................................................................. 53
Phosphorus: ........................................................................................................................... 53
2.5 References ....................................................................................................................... 54
Chapter 3 ....................................................................................................................................... 58
3.1 Introduction ............................................................................................................................. 58
3.2 Materials and Methods ............................................................................................................ 58
3.3 Statistical Analysis .................................................................................................................. 60
3.4 Results ..................................................................................................................................... 61
Nitrogen ................................................................................................................................ 61
Table 3.1†: Mean (standard deviation) of nitrate removal rate (NRR) at each hydraulic residence time (HRT) during the warm, cold, and rewarm runs for the six treatments. ....... 62
Figure 3.1†: Mean cumulative nitrate-N load reduction as a percentage for treatments in the a) warm run, b) cold run, and c) rewarm run. Error bars signify standard deviation. Within a temperature run, columns with the same lowercase letter indicate no significant difference between treatments (P ≤ 0.05). ............................................................................................. 63
Phosphorus ............................................................................................................................ 64
Table 3.2†: Mean (standard deviation) of dissolved reactive phosphorus (DRP) outlet concentrations at each hydraulic residence time (HRT) during the warm, cold, and rewarm runs for the six treatments. Target inlet DRP concentration was 0.3 mg P L-1. Measured mean concentration was 0.23 ± 0.05 mg P L-1. ..................................................................... 65
Table 3.3†: Mean (standard deviation) of dissolved reactive phosphorus (DRP) concentration reduction as a percentage at all hydraulic residence times (HRT) during the warm, cold, and rewarm runs for the six treatments. ............................................................ 67
Figure 3.2 †: Mean cumulative dissolve reactive phosphate (DRP) load reduction as a percentage for treatments in the a) warm run, b) cold run, and c) rewarm run. Error bars signify standard deviation. Within a temperature run, columns with the same lowercase letter indicate no significant difference between treatments (P ≤ 0.05). .............................. 69
Figure 3.3†: Microscope photographs of DAPI (4’,6-diamidino-2-phenylindole) fluorescent-stained samples from a) CC+MC and b) WC+A treatments after the cold run. The microorganisms are stained light blue and the polyphosphate is stained yellow. Alignment of polyphosphate and microbial bodies indicates that polyphosphate was stored inside cell bodies. .................................................................................................................. 70
3.5 Discussion ............................................................................................................................... 71
Nitrate Removal Performance ............................................................................................... 71
Factors Influencing Denitrification ....................................................................................... 72
Potential for Adverse Effects ................................................................................................ 73
Page 9 of 99
Dissolved reactive phosphate data ........................................................................................ 73
Mechanism for phosphate-P removal ................................................................................... 74
3.6 Conclusions ............................................................................................................................. 74
3.7 References ............................................................................................................................... 75
3.8 Chapter 3 Appendices ............................................................................................................. 78
Chapter 4 ....................................................................................................................................... 81
4.1 Introduction ............................................................................................................................. 81
Figure 4.1. Experimental design and components of novel N and P removal modular cube bioreactors. ............................................................................................................................ 82
4.2 Modular Bioreactor Design and Construction ........................................................................ 83
Figure 4.2. Top row from left: reinforced modular container; container with top cut off; rock layer; geotextile honeycomb material in position. Bottom row from left: filling and packing mixed woodchips; filling and packing corn cobs; crushed concrete; complete modular bioreactor deployed in the field. ............................................................................. 83
4.3 Study Location ........................................................................................................................ 83
Figure 4.3. Location of the project site at the University of Minnesota Southwest Research and Outreach Center near Lamberton, MN. .......................................................................... 84
Figure 4.4. From the left: three-way subsurface drain flow splitter to distribute water from the subsurface drain outlet to the bioreactors; block of three bioreactors with a set of three solar panels, one paddle wheel, and a datalogger in the white enclosure; portable samplers for collecting bioreactor discharge for water quality component analysis. .......................... 85
4.4 Research design ...................................................................................................................... 85
Carbon source augmentation................................................................................................. 85
Table 4.1. Potassium acetate addition date, rate and concentration to modular bioreactors.86
Data collection periods ......................................................................................................... 86
Table 4.2. Experiment phases of no acetate and acetate addition to modular bioreactors ... 87
4.5 Statistical analysis ................................................................................................................... 87
4.6 Results and Discussion ........................................................................................................... 88
Precipitation .......................................................................................................................... 88
Drain flow ............................................................................................................................. 88
Bioreactor hydrology ............................................................................................................ 88
Table 4.3. Cumulative discharge volume (m3), in chronological order, from bioreactors grouped by P-treatment ......................................................................................................... 89
Table 4.4. Mean discharge rate (m3 d-1), in chronological order, from modular bioreactors grouped by P-treatment ......................................................................................................... 90
Table 4.5. Mean porosity and hydraulic residence time (hour), in chronological order, for bioreactors grouped by P-treatment ...................................................................................... 90
Page 10 of 99

Oxidation-Reduction potential and pH ................................................................................. 90
Figure 4.5. Oxidation-reduction potential and pH of bioreactors during 2016.................... 91
Air and Water Temperature .................................................................................................. 91
Figure 4.6. Oxidation-reduction potential and pH of bioreactors during 2016.................... 92
Nitrogen ................................................................................................................................ 92
Table 4.6. Mean NO3-N concentration (mg/L), in chronological order, from bioreactors grouped by P-treatment ......................................................................................................... 93
Table 4.7. Percent NO3-N concentration reduction, in chronological order, compared to subsurface drainage source water NO3-N concentration from bioreactors grouped by P-treatment ............................................................................................................................... 93
Figure 4.7. Cumulative bioreactor discharge and cumulative bioreactor NO3-N load for Crushed Concrete (CC), Limestone (LM) and Steel Slag (SS) during 2016. ....................... 94
Table 4.8. Mean NO3-N load (kg), in chronological order, from bioreactors grouped by P-treatment ............................................................................................................................... 94
Table 4.9. Percent NO3-N load reduction, in chronological order, from bioreactors grouped by P-treatment ....................................................................................................................... 95
Phosphorus ............................................................................................................................ 95
Table 4.10. Mean total phosphorus concentration (ug/L) from bioreactors grouped by P-treatment ............................................................................................................................... 95
Table 4.11. Percent total phosphorus concentration reduction, in chronological order, from bioreactors grouped by P-treatment ...................................................................................... 96
Figure 4.8. Cumulative bioreactor discharge and cumulative bioreactor Total Phosphorus load for Crushed Concrete (CC), Limestone (LM) and Steel Slag (SS) during 2016. ......... 97
Table 4.12. Mean total phosphorus load (g) from bioreactors grouped by P-treatment ...... 97
4.7 Conclusions ............................................................................................................................. 98
4.8 References ............................................................................................................................... 99
Page 11 of 99

(intentionally blank page)
Page 12 of 99

Chapter 1
1.1 Introduction
Background Information Although artificial subsurface drainage enhancement improves crop yields, subsurface drainage systems provide a direct route for discharge of nitrate- and phosphorus-rich water to local water bodies like ditches and streams. There is increased interest in developing Best Management Practices (BMPs) for treating subsurface drainage water. Ideal BMPs would be low-cost, simple technologies which would mitigate the negative impact of artificial drainage while limiting their potential negative impacts on crop production and crops. A potential BMP for treating subsurface drainage water before it enters a ditch or stream is the design of a novel bioreactor which can rapidly remove N and P while requiring minimal management and maintenance and at the same time that does not take land out of production. Bioreactors are a treatment approach where solid carbon (C) substrates are added into the flow path of contaminated water. These C substrates, often corn cobs or fragmented wood-products (e.g. woodchips), act as a C and energy source to support biological denitrification; the conversion of nitrate (NO3
−) to nitrogen gases. Denitrification in bioreactors has observed to be limited by the rate of C supply from degrading substrates. There have been several design variations of denitrifying bioreactors including, in-field denitrification walls (Jaynes et al., 2008), edge-of-field bioreactors (Woli et al., 2010) and stream bed bioreactors (Robertson and Merkley, 2009). However, little research has been done to quantify the impact of two-phase/dual treatment bioreactors on N and P removal and on additives introduced into the bioreactor in order to overcome the C limitation. Research is needed on the effectiveness of alternative designs and materials as potential BMPs for treating agricultural drainage water. Scope of Report The Minnesota Department of Agriculture provided support from the Minnesota Clean Water Land and Legacy funds to investigate nutrient removal from agricultural drainage ditches. The overall project goal was to investigate the effectiveness of a novel bioreactor design that could be placed into or adjacent to agricultural drainage ditches for the removal of N and P. This report summarizes the activities for the three objectives of the project. Activities of objective 1 were to evaluate the physical and chemical characteristics of selected P sorbing and N denitrifying media for their potential for use in a bioreactor agricultural drainage water. The first objective focused on laboratory screening of various materials for biotic and abiotic nitrate and phosphorus removal, respectively, and to select three P sorbing and three N denitrifying materials for laboratory column testing. Activities of objective 2 were to test the three P sorbing and three N denitrifying materials identified in objective one for efficiency of P and N removal from simulated drainage water in laboratory flow columns under a range of temperatures and flow conditions. The second objective focused on evaluating the combined biotic and abiotic removal of N and P from simulated drainage water. Activities of objective 3 were to upscale the results from the laboratory column experiments and construct a novel two phase bioreactor in or adjacent to an agricultural ditch to evaluate N and P removal from agricultural drainage water under field conditions. The third objective focused on evaluating the performance of three P sorbing materials, crushed concrete, limestone and steel slag, and a combination of corn cobs and wood chips on the removal of N and P from drainage water.
Page 13 of 99

The report is divided into four main chapters. Chapter 2 is used to describe the activities and results of the characterization and evaluation of phosphorus sorbing and denitrifying media. This information is an important component of the laboratory and field activities. The results of the media characterization activities were used to design laboratory column experiments to measure the efficiency and efficacy of the selected N and P removal materials under controlled conditions given in Chapter 3. Chapter 3 also includes the analysis and discussion of the results from these experiments. Chapter 4 is used to describe the activities and performance of a novel design phosphorus sorbing and denitrifying bioreactor. Results consist of comparisons of nitrate and total phosphorus reduction for “representative” growing season and post-growing season conditions. Details of the bioreactor design are also given in Chapter 4. A summary of the activities is given in the Executive Summary.
Page 14 of 99

Chapter 2
Characterization and evaluation of various media for phosphorus, nitrate, and ammonium removal
2.1 Introduction
Nitrate ions can be removed from solution by a variety of processes, such as chemical reduction with iron (Hansen, Koch et al. 1996, Huang and Zhang 2004), microbial denitrification with carbon sources (Robertson, Ford et al. 2005), autotrophic denitrification utilizing iron as the electron donor in the microbial reactions (Su and Puls 2007), autotrophic denitrification with sulfur as the electron donor source (Furumai, Tagui et al. 1996), as well as physical adsorption (Chatterjee, Lee et al. 2009) and precipitation reactions (Otto, Blank et al. 1988). This is similar for phosphorus, but the one disadvantage is the lack of known microbial pathways for direct phosphorus removal, limiting the processes to solely sorption or precipitation reactions, which mainly involve materials that contain high levels of Fe, Al, or Ca (Spears, Meis et al. 2013). There is a commercial product that relies on the P precipitation/sorption with lanthanum (La) (Phoslock™; SePRO Corporation, Carmel, IN). On the other hand, some other efforts are focusing on algae and other plant systems for P removal systems (Aslan and Kapdan 2006). In addition to Fe, recent work has also demonstrated that the presence of divalent metal ions in the filter material can improve nitrate sorption (Divya Jyothi, Kiran et al. 2012). Yao et al. (2011) has also observed that the thermally pyrolyzed sugar beet residues have a large capacity for the simultaneous sorption of N and P, making this material as one of the first simultaneous sorbents for nitrate and phosphorus. This action is hypothesized to be due to the presence of Mg in the sugar beet tailings that could potentially form colloidal or nanosized MgO particles on the charred surfaces after pyrolysis (Yao, Gao et al. 2011). As can be seen in their data, there is justification to pursue the potential in determining the effect of various metal species additions and impacts of metal species presence during the pyrolysis on abiotic sorption of N and P species. Despite our ability to optimize materials, a majority of prior efforts for agricultural biofilters have examined primarily unmodified materials. However, the selection of these materials have been focused on those that possess positive hydraulic properties in their native biomass form (e.g., wood chips, corn stover; Roberston et al., 2005). However, Della Rocca et al. (2006) proposed that a mixture of different filter substrates into a single biofilter can be successful for the treatment of drinking water, and is also the basis for ultra-pure water filtration systems with specific filters targeting specific impurities. Biochars, also known as black carbon or charcoal, were assessed in their capacities to remove and adsorb nitrogen from aqueous solutions. Laboratory batch-equilibrium studies were used to assess the liquid phase adsorption capacity of various biochars. The forms of nitrogen used in this experiment were dissolved ammonium (NH4
+) and nitrate (NO3-). Biochar is often associated and justified by the
Terra Preta de Indio (TPI; Portuguese for Dark Earth of the Indians), located in the Amazonian River Basin, which today is a more fertile soil as compared to the surrounding weathered Oxisols (German 2003). Supported by the confirmation that TPIs contain a higher black carbon content, it has been hypothesized that the indigenous populations intentionally added biochar in soil to improve crop
Page 15 of 99

productivity (Glaser, Haumaier et al. 2001). Due to the stark difference between the TPI soil and the Oxisols, researchers further hypothesized that the elevated black carbon (biochar) concentrations are responsible for the improved agronomic TPI performance (Liang, Lehmann et al. 2006). However, research on soil enhancement with black carbon amendments have been inconsistent (Atkinson, Fitzgerald et al. 2010, Jeffery, Verheijen et al. 2011). Even though a higher black carbon concentration occasionally correlates with increased soil productivity, the exact mechanisms have remained elusive. This has led to an increased effort to understand the mechanisms behind how black carbons may enhance soil fertility. Coal, charcoal, gunpowder, and activated charcoal are some of the examples of black carbons that have been heavily researched in the past for various purposes from energy production to water filtration (Highwood and Kinnersley 2006, Malanima 2006). However, since the dawn of agricultural research, charcoal amendments to soil have been attempted and researched (Durden 1849). Within agriculture, previous research demonstrates that black carbons insignificantly add direct plant available nutrients, implying that if biochars affect soil fertility, they must do so indirectly by affecting the interaction between soil and plant growth factors (Biederman and Harpole 2013). Reasons suggested for the observed crop yield variations in black carbon amended soil experiments include affecting cation exchange capacities, changing microbial populations/diversities, and interacting with soil nutrients (Glaser, Haumaier et al. 2001, DeLuca, MacKenzie et al. 2006, Laird, Fleming et al. 2010, Bailey, Fansler et al. 2011). Notably, black carbon soil amendments do appear to reduce nitrogen leaching (Glaser, Lehmann et al. 2002, Spokas, Novak et al. 2012, Barnes, Gallagher et al. 2014) and to increase N-retention times (Asada, Ohkubo et al. 2006, Laird, Fleming et al. 2010, Yao, Gao et al. 2012), which have lead the same researchers to hypothesize that biochar may affect nitrogen leaching rates through adsorption. Nitrogen adsorption is a particularly compelling explanation for enhanced soil N-retention. Biochar and black carbons have been long-known to adsorb various substances (Hunter 1863). Individual chemical components in smoke (i.e., karrikins, cyanohydrins, strigolactones) are known to impact seed germination and plant growth (Nelson, Flematti et al. 2012). These and other compounds have been observed adsorbing to black carbons (Spokas, Novak et al. 2011). Furthermore, studies have reported direct evidence of biochar removing ammonia and nitrate from both gas and aqueous solutions (Mizuta, Matsumoto et al. 2004, Tsukagoshi, Shinoyama et al. 2010, Taghizadeh-Toosi, Clough et al. 2011). Nitrate ions are removed from aqueous solution by a variety of processes. Some of these include: 1) chemical reduction with iron (Hansen, Koch et al. 1996, Huang and Zhang 2004), 2) microbial denitrification with carbon sources (Robertson, Ford et al. 2005), 3) autotrophic denitrification utilizing iron as the electron donor in the microbial reactions (Su and Puls 2007), 4) autotrophic denitrification with sulfur as the electron donor source (Furumai, Tagui et al. 1996), 5) physical adsorption (Chatterjee, Lee et al. 2009), and 6) precipitation reactions (Otto, Blank et al. 1988). The dilemma that remains, then, is to determine whether biochar as a class of materials exhibit nitrogen retention properties, and to determine the primary adsorption mechanisms. Research has recently begun to focus on using agricultural ditches as sites for treatment and removal of P and N. As noted by Kleinman (2007), although drainage ditches are ubiquitous, research on nutrient removal from drainage ditches was until recently neglected. Initial efforts on alternative strategies for ditch management focused on improving their hydrologic functioning at low flow by constructing a two-
Page 16 of 99

stage ditch (Powell et al., 2007). The two-stage ditch involves use of earthmoving equipment to widen ditches and construct low floodplain benches that allow flow paths to meander within the channel at low flow and dissipate energy along bench tops at higher flows. These functions are desirable from the point of view of reducing channel maintenance costs, creating stable fluvial channels that do not degrade, and improving aquatic habitat. Adoption of two stage ditches is likely to be slow, however, due to high costs of earthworks that takes land adjacent to ditches out of annual production. These costs can range from $120 - $450 per linear m of excavation (Evans et al., 2007), which do not include the land taken out of production as a result of overwidening. Ditch management alternatives have recently focused on placing sorbing materials in ditches to remove phosphorus (Penn et al., 2007). Sorbing materials evaluated by Penn et al. (2007) included fly ash, waste gypsum, bauxite waste, and acid mine drainage waste. The most effective material, acid mine drainage waste, had many desirable characteristics, including high P sorption capacity, fast P sorption kinetics, high hydraulic conductivity, neutral pH, and low concentrations of toxic metals. Acid mine drainage waste placed in a flow through structure in the ditch removed 99% of the soluble P flowing through the ditch in response to a day-long storm event producing runoff from a nearby field that had high soil P concentrations due to a long history of poultry manure application. In a subsequent study, Penn et al. (2012) were able to remove 25% of the phosphorus over a 5 month period in runoff from a small drainage ditch using a flow through structure containing steel slag. Much less research has been conducted on ditch management for removal of nitrogen. Strock et al. (2007) constructed a paired ditch experiment where flow out of one ditch could be slowed, while water in the other ditch was allowed to flow freely. Monitoring of nitrogen loads in the two ditches showed little effect of increased hydraulic retention times in the controlled ditch. Robertson and Merkely (2009) constructed a bioreactor in the bed of an agricultural ditch using a trench filled with wood chips and covered with a layer of gravel. Water flowing along the ditch enters the bioreactor, where the wood chips serve as a carbon source for denitrifying bacteria. Nitrate concentrations over a one and a half year period were reduced from about 4 to 1 mg/L after water from the ditch was treated in the bioreactor. Treatment efficiency was much higher during summer than during winter months as a result of higher temperatures. Laboratory adsorption kinetic studies provide a means of determining the nitrogen adsorption capacities of materials in a timely and efficient manner. Typically, in biochar adsorption studies there are a limited number of biochars examined, whereas other factors are examined to elucidate the material’s adsorption behavior under different conditions (e.g. pH; temperature). However, because biochar is a diverse class of materials, there has not been a wide-reaching assessment of its ability to adsorb nitrogen. The present study aims to survey biochars in their capacity to adsorb nitrogen under standard laboratory conditions. Furthermore, since a primary objective in biochar research is to increase soil fertility, this study also includes adsorption tests of soil-biochar mixtures to improve our understanding into the effect of biochar additions on soil N-retention. Several materials (biochar of various origins and crushed concrete) tested for P adsorption have shown promise and were investigated further for their suitability in a field denitrifying bioreactor. This experiment is aimed at establishing the ability of the materials to sorb P or precipitate P with the consideration of experimental parameters such as pH and kinetics. The pH measurement reflects the reactivity of drainage water in the field (sites across southern MN) and dictates the species of P present
Page 17 of 99

in solution. Kinetics will shed light on the rate of cumulative amount sorbed/precipitated per time period; proposed shaking duration ranges from 30-minute to 48-hour period (30 min, 60 min, 120 min, 24 hour, and 48 hour). The speciation of P under different solution pH yields several compounds that will behave differently in terms of their association with alkali cation (Ca, Mg) and thus possible different minerals with varying solubility that can precipitate (Song et al., 2001; Cao and Harris, 2008). In the case of crushed cement material, the ortho-P anion can replace the hydroxyl anion of Ca(OH)2 within the crystalline structure (Naus et al., 2006). With respect to actual field bioreactors, parent material and eco-region delineation can be reflected in the range of pH values: 6.87 – 8.04 (Southwest MN) and 6.69 – 7.25 (Southeast MN). Kinetic analysis will provide insight into the rates of precipitation of Ca-phosphate or sorption of phosphate on the materials tested. Kinetics can dictate reaction mechanisms (i.e., precipitation; diffusion limitations; surface sorption) which, in turn, will be different depending on the chemical and physical arrangements of the material.
2.2 Materials and Methods
Biochar The production and acquisition of biochars used in this study was previously described by Spokas, Novak et al. (2011). As a brief overview, biochars were obtained from a variety of commercial and research sources and were manufactured under an array of production processes, including homemade, laboratory, and pilot scale pyrolysis equipment. Because some biochars were created in pyrolysis units lacking industrial process monitoring equipment, not all production parameters are known. Nonetheless, biochars without fully known production parameters were included among the employed suite to capture variability in the types of biochars currently available. There were 21 different biochars evaluated in this study (Table 2.1). All biochars were evaluated as received from the various suppliers. Three general conversion technologies were used to produce black carbons, which include fast pyrolysis (1), slow pyrolysis (16), and microwave-assisted pyrolysis (2). Pyrolysis unit definitions are further discussed by Spokas, Novak et al. (2011). The parent materials used to produce temperature sequence sets were soybean residue, coconut coir, urban yard waste (mixed leaves and grass), and pine pellets. One steam activated charcoal from a parent material of bituminous coal was included in this study.
Page 18 of 99

Table 2.1 Various materials evaluated in this study
Material Parent Material Supplier Production Scale
Style Temperature (°C)
Mix Wood 1 Mixed Hardwoods eBay Homemade Slow -- Mix Wood 2 Mixed Woodchips Univ. of MN Homemade Slow -- Mix Wood 3 Mixed Hardwoods Univ. of MN Homemade Slow -- Mix Wood 4 Hardwood Pellets Chip Energy Commercial Slow -- Mac. Nut Macademia Nut Shell Eterna
Green Commercial Fast --
Wheat Midds Wheat Middlings ICM Mass Prod. Slow 550 DDGs Dried Distiller Grains Univ. of MN Laboratory MAP -- Corn:DDGs 50:50, Stover:DDGs Univ. of MN Laboratory MAP -- Mix Pine 550 Mixed Pine Woodchips ICM Commercial Slow 550 Mix Pine 650 Mixed Pine Woodchips Sylva Corp. Commercial Slow 650 Soy Res. 350 Soybean Combine Residue USDA-ARS Laboratory Slow 350 Soy Res. 500 Soybean Combine Residue USDA-ARS Laboratory Slow 500 Soy Res. 700 Soybean Combine Residue USDA-ARS Laboratory Slow 700 Coconut 350 Coconut Coir USDA-ARS Laboratory Slow 350 Coconut 700 Coconut Coir USDA-ARS Laboratory Slow 700 Urban 350 Urban Yard Waste USDA-ARS Laboratory Slow 350 Urban 500 Urban Yard Waste USDA-ARS Laboratory Slow 500 Pine Pell. 400 Pine Pellets USDA-ARS Laboratory Slow 400 Pine Pell. 550 Pine Pellets USDA-ARS Laboratory Slow 550 Unk. Biochar -- eBay Homemade -- -- Activated Coal Bituminous Coal ACUREL Commercial Act. --
Notes: Double dash (–) indicates that the source information is not available.
Page 19 of 99

Soil and Reference Materials. Four Minnesota soils and three reference materials were included in this study. The physical and chemical properties of each soil are given in Table 2.2. Surface soil (0-5 cm) was collected from all sites (Fig. 2.1), sieved to <2 mm and homogenized for the incubation study. The Forest Nursery Soil was collected from the Hayward Wisconsin State Nursery (Hayward, WI) and was previously described by Spokas and Reicosky (2009). The agricultural soil (Rosemount) was collected from the University of Minnesota’s Research and Outreach Station in Rosemount, MN. The Waukegan silt loam soil was collected near Morris, MN and the Becker sand was collected near Becker, MN (Fig. 2.1). Soil texture and TOC were determined with the hydrometer method (Gee and Bauder 1986) and the loss on ignition method (Nelson and Sommers 1996), respectively. The concrete was purchased from a local hardware store. Commercially available nitrate and phosphate removers (Rolf C. Hagen Corp, MA) were utilized as positive controls.
Page 20 of 99

Table 2.2. Soil physical and drainage water chemistry properties Soil Location Soil Type Sand Silt Clay TOC Moisture
Capacity (%) (%) (%) (%) -33kPa (%w/w) Becker Hayward 46.00 ° N; Vials loamy sand
(sandy, 84 9 7 1.1 12
91.30° W; Mixed, frigid, Entic Haplorthod) Morris Rosemount 44.75 ° N; Wauken silt loam
(fine-silty 22 55 23 2.6 14.8
93.07 ° W; over skeletal mixed super Active, mesic typic Hapludoll)
ICP testing for natural drainage waters from Granite Falls and Grand Meadow
Sample ID Al Ca Fe K Mg Mn Na P S Zn Granite Falls
Rep 1 0 215.1 0 0 99.6 0 63.0 0 290.9 0 Rep 2 0 196.3 0 0.4 84.8 0 50.3 0 239.5 0
Grand Meadows Rep 1 0 74.1 0 0.3 16.1 0 4.3 0 4.2 0 Rep 2 0 86.6 0 0.4 19.1 0 5.9 0 4.0 0
Page 21 of 99

Table 2.3. Ultimate and Proximate Analysis of the materials used in this experiment Material pH H2O Ash C O N H S
Mix Wood 1 9.08 6.49 13.26 71.87 12.16 0.6 2.08 0.03 Mix Wood 2 7.04 15.54 14.29 51.7 29.95 0.25 3.77 0.04 Mix Wood 3 9.42 3.67 1.86 91.88 5.3 0.4 0.54 0.02 Mix Wood 4 10.18 6.79 10.78 82.94 4.13 0.42 1.7 0.03 Mac. Nut 6.2 9.54 1.92 93.15 1.68 0.67 2.56 0.02 Wheat Midds 8.86 3.62 12.53 81.83 4.75 0.52 0.32 0.05 DDGs 9 4.92 17.35 73.08 1.2 6.69 1.05 0.63 Corn:DDGs 9.5 3.27 24.56 70 1.54 2.81 0.68 0.41 Mix Pine 550 9.54 11.27 25.2 64.33 6.16 3.11 1.16 0.04 Mix Pine 650 6.6 6.08 5.19 73.94 17.31 0.24 3.3 0.02 Soy Res. 350 8.28 4.11 17.8 57.4 18.95 1.43 4.4 0.02 Soy Res. 500 8.89 3.87 37.51 48 11.07 1.26 2.12 0.03 Soy Res. 700 10.74 4.59 33.42 56.24 8.1 1.17 1.01 0.06 Coconut 350 8.41 4.68 11.12 64.13 20.51 0.47 3.74 0.02 Coconut 700 9.47 4.35 13.95 71.75 12.72 0.52 0.98 0.07 Urban 350 8.08 4.2 13.89 59.07 20.23 2 4.81 0 Urban 500 9.16 5.56 17.5 63.07 14.53 2.12 2.74 0.03 Pine Pell. 400 8.84 4.19 2.72 75.6 17.27 0.1 4.33 0 Pine Pell. 550 8.49 2.42 3.59 77.15 16.22 0.18 2.86 0 Unk. Biochar 9.6 56.55 55.47 32.75 0 0.16 0 0 Activated Coal 9.4 3.21 10.24 83 5.47 0.43 0.52 0.35
Soils
Rosemount 5.23 2.19 92.5 3.72 3.35 0.26 0.13 0.03 Morris 6.84 0.12 89.45 4.1 5.64 0.27 0.32 0 Hayward 4.78 0.14 96.5 2.08 1.26 0.11 0 0 Becker 6.02 0.11 96.49 2.01 1.38 0 0 0
Reference Materials Concrete 10.16 1.7 95.03 3.6 0.98 0.1 0.39 0 Phosphate Remover 7.31 3.87 88.01 1.71 8.79 0.1 1.48 0 Nitrate Remover 2.84 54.55 0 70.54 15.79 4 9.59 0.08 Note: All values are percent dry weight except pH.
Page 22 of 99

Figure 2-1 Locations where soil was sampled for this study are shown in the blue outlined symbols: ( )
Rosemount, ( ) Becker, ( ) Morris, and ( ) Hayward, Wi. The filled in symbols in green represent
the two drainage water sampling locations: ( ) Grand Meadows and ( ) Granite Falls.
Page 23 of 99

Ultimate, Proximate and pH Analysis All materials used in the experiment were characterized by ultimate (ASTM D5373/D3176) and proximate analysis (ASTM D121/D5142/D7582), performed by Hazen Research (Golden, CO). The pH values were determined in a 1:5 (1g sample to 5 mL distilled water) slurry. Batch Equilibrium Incubation and Analysis Precisely 0.7634 g of ammonium chloride and 1.444 g of potassium nitrate were dissolved in 1 L of 0.2 M phosphate buffer at pH 6.5 to produce a standard analyte solution of both 200 mg·L-1 N(NH4
+) and 200 mg N(NO3
-) per liter. Approximately 1 g of sample was placed into a 50 mL polypropylene centrifuge tube. The standard nitrogen solution and 0.2 M phosphate buffer were added at ratios of 0:30, 0.5:29.5, 1:29, 2:28, 4:26, and 6:24 to produce 0, 3.3, 6.6, 13.3, 26.6, and 40 mg N·L-1, respectively. The samples were shaken for 24 (±2) hours then were centrifuged for 5 min at 5000 rpm (Sorval RC-90). The samples were filtered (Whatman #2 filter paper) into polyethylene bottles and immediately frozen (-5 C°). The remaining solid sample was discarded. At the time of analysis, the frozen samples were thawed, shaken and analyzed for nitrogen (N) in the forms of ammonium (NH4
+) and nitrate (NO3-)
concentrations using a colorimetric injection-flow analyzer (Latchat QuickChem 8000 FIA Analyzer). Latchat QuickChem methods 12-107-06-2-A and 12-107-04-1-B were used for N-(NH4
+) and N-(NO3-)
analyses, respectively. Standards were run intermittently throughout the run and were used to correct for any observed instrument base line drift. The amount of N adsorbed was calculated using the following equation,
𝑞𝑞𝑒𝑒𝑒𝑒 =𝐶𝐶𝑖𝑖 − 𝐶𝐶𝑒𝑒𝑀𝑀𝑠𝑠
∗ 𝑉𝑉
where 𝑞𝑞𝑒𝑒𝑒𝑒 is the amount of nitrogen adsorbed per unit mass of adsorbent at equilibrium (mg·g-1), 𝐶𝐶𝑖𝑖 is the initial nitrogen concentration (mg·L-1), 𝐶𝐶𝑒𝑒 is the equilibrium concentration (mg·L-1), 𝑉𝑉 is the volume of the solution (L) and 𝑀𝑀𝑠𝑠 is the mass of the sorbent (g). In this experiment, the analyte is nitrogen either in the form of NH4
+ or NO3-. The material substrate is
one of either a biochar, soil, or a soil – biochar mixture. A primary assumption of the batch-equilibrium incubations was that the analyte existed within only one of two phases, either mobile aqueous phase or an immobile sorbed phase. In order to verify this assumption, the experimental results must confirm that nitrogen was statistically removed from solution. In the customized adsorption-analysis Python modules, this is accomplished by fitting the data to a linear isotherm, represented as:
𝑞𝑞𝑒𝑒𝑒𝑒 = 𝐾𝐾𝑒𝑒 ∗ 𝐶𝐶𝑒𝑒 , where 𝐾𝐾𝑒𝑒 is the Linear isotherm constant, 𝐶𝐶𝑒𝑒 is the liquid equilibrium concentration, and 𝑞𝑞𝑒𝑒𝑒𝑒 is the equilibrium sorbed concentration. For these incubations, it is assumed that the sorbed material was estimated by the difference between the initial material present and the observed liquid concentration. The best fit linear isotherm is statistically (α= 0.05) examined by the following hypothesis set:
𝐻𝐻0:𝐾𝐾𝑒𝑒 ≤ 0 𝐻𝐻𝑎𝑎:𝐾𝐾𝑒𝑒 > 0
where 𝐻𝐻0 and 𝐻𝐻𝑎𝑎 are the null and alternative hypotheses. In the case that a material’s 𝐾𝐾𝑒𝑒 value is not greater than zero, then the material does not statistically remove N from solution, and theoretically
Page 24 of 99
cannot sorb N either. If the material's 𝐾𝐾𝑒𝑒 value is statistically greater than zero, then other isotherms were fit against the data set and a best fit isotherm selected by minimization of the sum of squared residuals [Akaike Index Criterion (AIC) or Bayesian Index Criterion (BIC)] to describe the adsorption behavior. In this study, AIC was used to select the best fitting adsorption isotherm. A best fit linear isotherm indicates nitrogen removal occurs but not that the mechanism of removal is adsorption. If adsorption has occurred, the linear isotherm describes a constant behavior, where for any given concentration of an analyte in the mobile phase there will always be a constant offset amount in the immobile phase. However, other processes such as microbial N-uptake, atmospheric equilibration can conceivably remove N from solution and bias this statistical assessment. Therefore, two other adsorption isotherms are used to determine adsorption occurrence beyond N removal. One of the isotherms used to express adsorption behavior is the Freundlich isotherm, represented as,
𝑞𝑞𝑒𝑒𝑒𝑒 = 𝐾𝐾𝑓𝑓 ∗ 𝐶𝐶𝑒𝑒1 𝑛𝑛�
where 𝐾𝐾𝑓𝑓 is the Freundlich isotherm constant related to the adsorption capacity and 𝑛𝑛 is the adsorption intensity (Foo and Hameed 2010). The Freundlich adsorption model is one of the earliest model used to explain non-ideal and reversible adsorption of an analyte onto a material (Freundlich 1906). This model is often applied to multi-layered adsorption process over a heterogeneous surface, and describes an adsorption process where binding sites on the material substrate’s surface are occupied in order from strong to weak sorption energy in a pattern of exponential decay. Nonetheless, where the Freundlich isotherm describes a material’s adsorption behavior well within the stated conditions of an experiment, it should not be used to extrapolate adsorption behavior beyond the range of concentrations used in this study. The Freundlich model is empirical by nature and does not approach Henry’s law for vanishing concentrations, which means it lacks a fundamental thermodynamic basis (Foo and Hameed 2010). Therefore, in this study a best-fit Freundlich isotherm suggests that adsorption is a prominent nitrogen removal mechanism within the constraints of the experimental design, but it does not indicate that adsorption is the only removal mechanism or quantifies the limit (or capacity) of adsorption. The other isotherm used to determine whether a material adsorbs nitrogen is the Langmuir isotherm, represented as:
𝑞𝑞𝑒𝑒𝑒𝑒 = 𝑄𝑄𝑜𝑜 ∗ 𝐾𝐾𝑙𝑙 ∗ 𝐶𝐶𝑒𝑒
1 + 𝐾𝐾𝑙𝑙
where 𝐾𝐾𝑙𝑙 is the Langmuir isotherm constant and 𝑄𝑄𝑜𝑜 is the material’s maximum mono-layer coverage capacity (mg · g-1). Data that best fits to a Langmuir isotherm suggests that adsorption is the primary removal mechanism of nitrogen, where 𝑄𝑄𝑜𝑜 is the equilibrium saturation point between 𝐶𝐶𝑒𝑒 and 𝑞𝑞𝑒𝑒𝑒𝑒. Often the Langmuir isotherm is used to characterize a homogeneous mono-layer adsorption process, where all adsorption sites express an equal affinity for adsorption (Foo and Hameed 2010). Although complex chemical systems do not meet the stringent requirements of all adsorption sites expressing equal affinities for adsorption, if a complex material (such as a biochar or soil) expresses an equilibrium saturation point, then the equilibrium mono-layer may be described as the layer of all available adsorption sites within the material. Therefore, in this study a best fit Langmuir isotherm model is not only used to state that adsorption occurs, but also determines the maximum adsorption capacity (𝑄𝑄𝑜𝑜).
Page 25 of 99

P-Adsorbing Materials Four materials were tested for this experiment: 1) activated charcoal, 2) crushed concrete, 3) fibrous coconut coir biochar, and 4) modified fibrous coconut coir. Modification of coconut coir biochar is based on the chemical amination reaction as described by Jansen and van Bekkum (1994); amination is a reaction with ammonia gas of materials pre-oxidized with nitric acid. It is expected to result in additional carboxylic acid sites formed by nitric acid oxidation of side groups as well as the ring system. Natural Drainage Water Source of natural drainage water was from two Minnesota locations: Grand Meadow (Southern Minnesota) and Granite Falls (Western Minnesota). Those drainage waters were distinct mostly by their pH values: Granite Falls water tend to have a slightly basic property (average pH: 7.46) while Grand Meadow water was on the neutral side (average pH: 6.97) (see Figure 2.1 for locations).
Page 26 of 99

P-Adsorption Runs with Three Contact Time in Natural Drainage Water (NDW):
1. Prepare 27ea 250 mL-beakers, stirring plates, and 9 stirring bars. 2. Prepare a 0.5 mg-P/L from a 100 mg-P/L mother solution1
a. In a 1L volumetric flask, add 5.0 mL of stock 100 mg P-PO4/L; DI: 666.67 mL b. Dilute to mark with Natural Drainage Water and invert to mix (NDW: 333.33
mL). 3. Weigh 1g of BC material in 250 mL-beaker. BCs available are: # 26, 168, 175, and 175
modified. 3 BCs x 3 (triplicate) x 3 contact time = 27 samples. 4. Add 100 mL of P-solution at 0.5 mg/L into 250 mL-beaker. No buffer solution added. 5. Set 250 mL-beaker on stirring plate and cover its mouth with aluminum foil. Add a
stirring bar and put on medium stirring speed (rpm?)2. 6. Record initial and final chemical solution temperature. 7. Open Logger Lite window on laptop and start a new file for each beaker. 8. Lower six sensors into beaker. 9. Stir for 30 min. 10. Filter liquid from 250 mL-beaker. Do not to agitate solution. Pour all the liquid out of
the 250 mL-beaker: a. Use label scintillation vials (liquid sample storage containers) for sample
collection b. Fold 27 Whatman 1 (or equivalent) filter papers c. Collect 27 filter funnels and collect filtrate into scintillation vials d. Store liquid samples in a freezer
11. Repeat procedure with same BCs materials with different stirring/shaking time: 60 min and 120 hours.
Figure 2-2 Triplicate run for pH; biochar is activated biochar No 26.
1 Mass Ratio of P-PO4 to BC: 6x10⁻⁵ for incubation (30 mL at 2mg P-PO4/L) and 5x10⁻⁵ for P-adsorption experiment (100 mL at 0.5mg P-PO4/L) 2 Avoid high speed on stirring as CO2 may diffuse more rapidly into solution mix
Page 27 of 99

Long-Range Testing for P-Adsorption (24-hour and 48-hour/sample) in Natural Drainage Water (NDW):
1. Prepare 3ea 250 mL-beakers, stirring plates, and 3 stirring bars. 2. Calibrate the following probes: pH (3 points), Nitrate (10 mg/L and 100 mg/L), and
Calcium (100 mg/L and 1000 mg/L), oxido-reduction potential solution (220 mV), conductivity (1000 S/ cm)
3. Prepare a 0.5 mg-P/L from a 100 mg-P/L mother solution3 a. In a 1L volumetric flask, add 5.0 mL of stock 100 mg P-PO4/L. b. Dilute to mark with DI water and invert several times to mix.
4. Weigh 1g of BC material in 250 mL-beaker. Available BCs are: # 26, 168, and 175. 5. Add 66.66 mL of 0.5 mg-P/L solution into a 250 mL-beaker. 6. Drop one stirring bar and lower six probes into beaker. 7. Set data collection rate on Logger-Pro at 5 minutes to obtain 288 data points in a 24-
hour period. 8. Start stirring the solution 9. After 6 hours, add 33.33 mL of natural drainage water (Granite Falls or Grand Meadow)
in the 250 mL-beaker to make it to 100 mL. 10. Weigh 1.444 g of KNO3 and stir in a 50 mL Beaker. Pour into a 100 mL volumetric flask
(6.20 mg/100 mL). Fill flask to volume with DI water and mix. 11. After 6 hours, add 3.10 mL of KNO3 solution into the 250 mL-beaker 12. Weigh 4.154 g of CaCl2 and stir in a 50 mL Beaker. Pour into a 100 mL volumetric flask
(40.078 mg/100 mL). Fill flask to volume with DI water and mix. 13. After 6 hours, add 2.67 mL CaCl2 solution into the 250 mL-beaker 14. End stirring after 6 hours. Save data on Logger-Pro. 15. The entire experiment should last for a 24-hour period (or 48-hour) 16. Filter liquid from 250 mL-beaker. Do not to agitate solution. Pour all the liquid out of
the 250 mL-beaker: a. Use label scintillation vials (liquid sample storage containers) for sample
collection b. Fold Whatman 1 (or equivalent) filter paper c. Collect filter funnel and collect filtrate into 20-mL scintillation vials d. Store liquid samples in a freezer
17. Run the same protocol for BC 26, 168, 175, and 175 modified.
3 Mass Ratio of P-PO4 to BC: 6x10⁻⁵ for incubation (30 mL at 2mg P-PO4/L) and 5x10⁻⁵ for P-adsorption experiment (100 mL at 0.5mg P-PO4/L)
Page 28 of 99

Amination procedure for modified biochar Modified from a procedure in Jansen and van Bekkum, 1994 Definition (taken from Jansen and van Bekkum, 1994):
• Amination: reaction with ammonia gas of materials preoxidized with nitric acid. Expected to take place at carboxylic acid sites formed by nitric acid oxidation of side groups, as well as the ring system.
PPI: nitrile gloves, fume hood Materials:
- Coconut coir (compressed material) - Macadamia nut biochar - Heating plate (Corning, PC-100) - Pyrex beakers (≥600mL) - 10% HNO3 solution - Fume hood - DI water - Baking soda
Procedure: 1) Weigh out material into beaker until beaker is ¾ full. 2) Pour 10% HNO3 solution into beaker. Place beaker on hot plate set to ~90°C in a fume
hood. For coconut coir, pour solution in so it covers about half of the coir. For macadamia nut, pour to cover material.
3) Let beaker heat for at least 4 hours. A color change should take place for the coir. For coir, push down material and add more solution if all of material is not changing.
4) After heating, carefully dump HNO3 into properly labeled waste container. Rinse material in beaker 10 times with DI water.
5) Add more DI water in beaker, and check pH. If pH is close to neutral, continue to step 6. If pH is low, dunk material in a weak solution of baking soda, then rinse in DI water (fizzing will occur). Do this until pH is close to neutral.
6) Oven-dry material overnight at 80°C.
Resources:
Jansen, R. J. J., & van Bekkum, H. (1994). Amination and ammoxidation of activated carbons. Carbon, 32(8), 1507–1516. doi:10.1016/0008-6223(94)90146-5
Page 29 of 99

Vernier Probes A set of probes was used to monitor chemical concentration (nitrate and calcium probes) and solution reactivity such as pH, oxido-reduction potential, electrical conductivity, and solution temperature. The Conductivity Probe determines the ionic content of an aqueous solution by measuring its conductivity. The ORP (Oxidation-Reduction Potential) measures the ability of a solution to act as an oxidizing or reducing agent. Probes for pH measurements and solution temperature were added to the previous sensors and dipped in the 100 mL solutions throughout each run. Nitrate and Phosphorus Tests Nitrate was analyzed using Lachat method 10-107-04-1-A (high range). Nitrate was quantitatively reduced to nitrite by passage of the sample through a copperized cadmium column. The nitrite (reduced nitrate plus original nitrite) was then determined by diazotizing with sulfanilamide followed by coupling with N-(1-naphthyl) ethylene-diamine dihydrochloride. The resulting water soluble dye had a magenta color which was read at 520 nm. Nitrite alone also can be determined by removing the cadmium column. Total Phosphorus was digested using the method of Patton and Kryskalla, USGS, Water Investigations Report 03-4174, 2003 and then run on the Lachat using method 10-115-01-1-A. These methods were intended for determination of phosphorus (all forms) in filtered and whole-water samples by alkaline persulfate digestion. Filtered and whole-water samples were dispensed into glass culture tubes, dosed with alkaline persulfate reagent, capped tightly, and digested in an autoclave at 121ºC and 117.2 kPa for 1 hour. The alkaline persulfate digestion procedure hydrolyzes all forms of inorganic and organic phosphorus to orthophosphate. Orthophosphate in alkaline persulfate digests were determined in parallel with a 2-channel photometric, air-segmented continuous flow analyzer. Orthophosphate was then analyzed by molybdate method and read at 880nm (Standard Methods 4500-P-G). Statistics Adsorption results were analyzed using the Python programming language (Version 3.4). We designed statistical analysis and curve-fitting functions following commonly used statistical methods within the numpy, scipy, and lmfit packages for Python. This customized code is available on the GitHub repository and supplemental project source code. All graphs were produced using matplotlib and all statistical analyses used an alpha of 0.05 (p < 0.05).
2.3 Results and Discussion
Biochar properties Biochar pH values were predominantly alkaline (8.8 ±1.1) ranging from slightly acidic (6.2) to strongly alkaline (10.7). Ash contents (16.6 ±13.1%) and air-dried moisture content (8.0 ± 11.5% w/w) had considerable variation ranging from 1.9% to 55.5% and 2.4% to 56.6%, respectively. The carbon content was generally high (68.7±14.8%w/w) with less variation than other properties. In comparison, oxygen (10.9±8.0 %) and hydrogen (2.12±1.49 %) contents were lower. Biochar’s nitrogen and sulfur fractions were lower than either carbon, oxygen, or hydrogen (Table 3.2). Overall, the pH and elemental composition match previously published ranges for other biochars (Chan and Xu 2009, Atkinson,
Page 30 of 99
Fitzgerald et al. 2010, Singh, Singh et al. 2010, Yargicoglu, Sadasivam et al. 2015). Temperature effect on biochar properties. Pyrolysis temperature do correlate positively with sulfur (r2 = 0.50) and negatively with oxygen (r2 = 0.36) and hydrogen (r2 = 0.58). All other elemental correlations with temperature were non-significant (r2 <0.11). The H:C (r2 = 0.65), O:C (r2 = 0.47), and (O+N):C (r2 = 0.49) ratios correlated negatively with pyrolysis temperature. Others have observed similar results with the exception that generally with increasing pyrolysis temperatures there is an increase in dry ash content (Yao, Gao et al. 2012, Gai, Wang et al. 2014). However, across several feedstock and pyrolysis units, these relationships do not appear to be as strong or universal as often stated. Typically, existing laboratory studies examine biochars immediately after production. However, in the case of this experiment, biochars possessed variable storage times. Remembering that storage conditions can affect biochar properties such as oxygen content, surface moieties, ash content and moisture values, these alterations could affect the overall response of the soil system to biochar additions (Puri, Singh et al. 1958, Puri, Murari et al. 1961, Iida, Amano et al. 2013, LeCroy, Masiello et al. 2013, Spokas 2013, Delaplace, Delory et al. 2015). Soil Properties Soil pH values ranged from slightly acidic (4.8) to neutral (6.84) with a mean of 5.7 (± 0.9), which is common for the Upper Midwest US. The soil ash content (93.7 ±3.4) was consistent for these mineral soils (Table 2.2). The percent soil moisture (0.64 ± 1.0) for the air-dried soils was also rather consistent given the range in textures. The total carbon (3.0 ± 1.1%) and oxygen (2.9 ± 2.1%) fraction of the evaluated soils were low. Laboratory Sorption Experiments
Biochar N sorption incubations. Among the 21 biochars investigated for NH4
+ adsorption, 18 (86%) showed statistically significant NH4+
removal and 11 (52%) expressed NH4+ adsorption behavior by a best fit Freundlich or Langmuir isotherm
(Figure 2-2). The 3 biochars that removed the most NH4+ at the initial concentration of
40 mg N-(NH4+) L-1 were coconut coir 350 ºC, macademia nut shell, and soybean residue 350 ºC. These
biochars also expressed adsorption and were selected for further experimentation as soil amendments. In contrast to the NH4
+ results, 15 (71%) of the black carbons showed statistically significant NO3-
removal and 7 (33%) expressed NO3- adsorption described by a Langmuir isotherm (Figure 2.3). The 4
biochars that removed the most NO3- at the initial concentration of 40 mg N-(NO3
-) L-1 were mixed hardwood # 3, activated bituminous coal, coconut coir 700C, and soybean residue 700C. Mixed hardwood #3, coconut coir 700C, and soybean residue 700C were selected for further experimentation as soil amendments. Biochars exhibited a greater affinity for removing NH4
+ from aqueous solution NO3-, which is consistent
with results from other studies (Yao, Gao et al. 2012, Gai, Wang et al. 2014). The coefficients of the isotherm curve fitting are given in Table 2.4. Upon examining the of the calculated Freundlich and Langmuir coefficients, where NH4
+ is more likely to be removed from solution and adsorbed, NO3- is only
likely to be removed. For both forms of N fewer biochars fit adsorption isotherms than those that removed nitrogen, suggesting the possibility that separate processes compete with adsorption during
Page 31 of 99
nitrogen removal (Haider, Steffens et al. 2016). Importantly, for both types of nitrogen, neither the removal nor adsorption pass the 95% confidence limit needed to state that biochars as a class of materials, remove or adsorb N from aqueous solution. Interestingly, no physical nor chemical biochar property correlated with the maximum removal of NH4
+ (r2 < 0.15). Similarly, no biochar property was strongly associated with the maximum removal rate of NO3
-; however, ash content (r2 = 0.22), % air-dried moisture content (r2 = 0.36), C content (r2 = 0.22), and H content (r2 = 0.24) do seem to be weakly correlated. This suggests that these physical and chemical biochar properties play a minor role in NO3
- removal mechanisms, with no single property explaining over 50% of the variability. It is curious that the air-dried moisture content possesses the highest connection across all the biochars (explaining 36% of the variability).
Page 32 of 99
Figure 2-3. Isotherms across the 21 different materials from the laboratory incubations for the sorption of ammonium (NH4+).
Page 33 of 99

Figure 2-4. Isotherms across the 21 different materials from the laboratory incubations for the sorption of nitrate (NO3
-).
Page 34 of 99

Table 2.4. Isotherm fitting coefficients Materials Best Fit
(AIC) Maximum Removal
Linear Constant
Freundlich Constants
Langmuir Constants
Kd Kf n Kl Qo Biochars Mix Wood 1 Linear 57.33 0.72 na na na na Mix Wood 2 Langmuir 64.6 2.48 33.69 4.31 0.77 73.83 Mix Wood 3 Langmuir 7.17 0.37 4.23 3.34 0.23 13.77 Mix Wood 4 Langmuir 169.22 6.52 105 5.62 1.64 192.48 Mac. Nut Langmuir 400.35 16.24 181.01 4.16 0.86 408.55 Wheat Midds Linear 93.99 1.87 na na na na DDGs Langmuir 167.27 5.25 79.1 5.42 1.3 144.9 Corn:DDGs Linear 45.04 0.77 6.33 2.63 0.2 26.71 Mix Pine 550 Linear 63.27 0.92 na na na na Mix Pine 650 Langmuir 226.98 8.99 71.04 2.72 0.25 270.46 Soy Res. 350 Freundlich 355.67 15.83 105.44 2.62 0.17 441.1 Soy Res. 500 Langmuir 97.13 2.98 17.7 2.11 0.1 120.2 Soy Res. 700 Linear 64.72 1.84 6.58 1.6 0.04 105.87 Coconut 350 Langmuir 417.13 18.27 127.48 2.75 0.52 404.06 Coconut 700 Linear 72.92 1.62 1.01 1.03 na na Urban 350 Linear 101.1 2.63 23.88 3.03 0.3 76.28 Urban 500 Langmuir 100.52 2.88 31.16 3.47 0.43 85.35 Pine Pell. 400 Langmuir 135.13 4.04 38.51 3.13 0.4 116.66 Pine Pell. 550 No Fit 0 na na na na na Unk. Biochar No Fit 0 na na na na na Activated Coal No Fit 0 na na na na na Soils Rosemount Linear 43.65 0.73 na na na na Morris Linear 72.91 1.49 na na na na Hayward No Fit 0 na na na na na Becker No Fit 0 na na na na na
Reference Materials Concrete Linear 16.84 1.18 na na na na Phosphate Remover
Linear 102.42 2.14 na na na na
Nitrate Remover
No Fit 0 na na na na na
Page 35 of 99

Table 2.4 (Continued)
Materials Best Fit (AIC)
Maximum Removal
Linear Constant
Freundlich Constants
Langmuir Constants
Materials
Kd Kf n Kl BC-Soils Mixtures Rose. & Mix Wd. 3
Linear 22.11 0.49 na na na na
Rose. & Mac. Nut
Linear 64.02 1.78 na na na na
Rose. & Soy 350
Langmuir 62.92 2.09 18.54 2.79 0.23 69.76
Rose. & Soy 700
Linear 65.81 1.54 na na na na
Rose. & Coc. 350
Linear 124.14 3.27 na na na na
Rose. & Coc. 700
Linear 18.11 0.51 na na na na
Morris & Mix Wd. 3
Linear 22.31 0.57 na na na na
Morris & Mac. Nut
Langmuir 54.87 1.85 10.52 2.04 0.08 78.29
Morris & Soy 350
Langmuir 132.45 4.46 31.39 2.4 0.15 155.7
Morris & Soy 700
Linear 27.11 0.73 0.77 1.01 na na
Morris & Coc. 350
Linear 71.32 2.1 na na na na
Morris & Coc. 700
Linear 33.26 0.95 na na na na
Page 36 of 99
Among the pyrolysis-temperature-gradient sets of biochars, temperature negatively correlated with NH4
+ removal (r2 = 0.29). In contrast, temperature strongly correlated in a positive manner with NO3-
removal (r2 = 0.70). These results indicate that within sets of biochars produced from the same starting material, pyrolysis temperatures play a trivial and significant role for NH4
+ and NO3- removal,
respectively. Both Yao, Gao et al. (2012) and Mizuta, Matsumoto et al. (2004), observed similar results for NO3
- removal among pyrolysis-temperature-gradient biochars produced from the same starting materials. Previous studies suggest that acid functional groups (Asada, Ishihara et al. 2002, Kastner, Miller et al. 2009) specifically carboxylic oxygen groups (Spokas, Novak et al. 2012) are responsible for gaseous NH3 removal. However, within this study and others pertaining to aqueous solutions (Yao, Gao et al. 2012), biochar pH values do not correlate with NH4
+ removal/adsorption. This potentially suggests that in aqueous solutions different mechanisms are responsible for NH4
+ removal than for NO3- removal.
Proposed mechanisms for NH4+ removal in aqueous solution by biochars include electrostatic attraction
with other cationic species on the biochar surface (Mukherjee, Zimmerman et al. 2011), NH4+ capture
within biochar pores (Jansen and van Bekkum 1994, Vinke, van der Eijk et al. 1994, Haider, Steffens et al. 2016), and the intercalation of NH4
+ between graphitic sheets (Seredych, Tamashausky et al. 2010). The removal of NO3
- from aqueous solution is a well-studied phenomenon, especially since the USEPA dictates that NO3
- levels must meet drinking water standards [<10 ppm] (Reilly, Horne et al. 1999). Activated black carbons and activated biochars have been shown to adsorb nitrate from aqueous solution (Mizuta, Matsumoto et al. 2004, Namasivayam and Sangeetha 2005, Iida, Amano et al. 2013). Two primary mechanisms have been proposed for nitrate adsorption by black carbon species, chemisorption and anion exchange (Namasivayam and Sangeetha 2005). In both mechanisms, nitrate is captured by the black carbon surface functional groups, however, only the anion exchange mechanisms allow for subsequent recharging of the biochar adsorption properties. Black carbon surface area, porosity, and pore volume positively correlate with nitrate adsorption tendencies (Namasivayam and Sangeetha 2005, Zanella, Tessaro et al. 2015), and when observed provides further mechanistic evidence for adsorption's occurrence. Furthermore, previous studies have shown that increasing pyrolysis temperatures activate the black carbon, i.e. increase the surface area and pore volume. In the present study, among biochars produced from the same parent material along a temperature sequence, temperature correlated with increased nitrate removal. However, nitrate adsorption was not significant in all cases across all biochars. Although not all biochars are chemically activated, some may exhibit similar properties to activated carbons. Clearly, in regards to the present study, nitrate adsorption by biochars are not dictated by elemental and chemical properties alone. An objective of this study was to determine whether biochars as a class of materials adsorb nitrate. With only 33% of biochars in this study exhibiting nitrate adsorption behavior, clearly, biochars as a class of materials do not adsorb nitrate. However, some biochars do possess nitrate sorbing properties, although have a very limited sorption capacity. Future research would benefit from focusing on the physicals and chemical mechanisms of favorable nitrate adsorbing biochars. Multiple studies have investigated whether biochars can be used in biological denitrification systems (Christianson, Hedley et al. 2011) (Bock, Smith et al. 2015). Denitrification is generally understood to follow the microbial driven chemical reactions. (Firestone, Smith et al. 1979) However, the quality of the residue added controls the availability of microbial mineralization (Broder and Wagner 1988, Qin, Jiao et al. 2015). Nonetheless, studies show that non-aromatic carbon provides the least complicated (lowest
Page 37 of 99

activation energy) form of carbon utilization in biological processes (Qin, Jiao et al. 2015). Questions remain on whether the graphitic carbon back structure of biochars is utilizable by microbes or not (Zimmerman, Gao et al. 2011). The present study is not broad enough in scope to determine whether biologically driven denitrification occurred during the experiments. Kinetic investigations can provide insight into the mechanisms and fundamental pathways of reactions in a system and thereby are useful for determining the potential mechanisms involved in the observed sorption processes. Future nitrate-biochar adsorption experiments would benefit from measurements of either microbiological activity and/or N2 outgassing (the byproduct of denitrification), which could direct conclusions on whether biological denitrification occurs during biochar NO3
- removal. Soil N incubations Among the 4 soils, only 2 showed statistically significant, but slight amounts of NH4
+ removal (Figure.2-4A), while none of the soils alone expressed NH4
+ adsorption. Additionally, none of the soils alone expressed NO3
- removal or adsorption (Figure 2-4B). Reference materials N incubations Among the commercial sorbents, the phosphate remover showed statistically significant NH4
+ removal, but did not express adsorption isotherm (Figure 2.5A). Concrete and the nitrate remover did not show NH4
+ removal behavior. In contrast to the NH4+ results, the nitrate remover removed most NO3
- from solution (Figure 2.5B), as expected. Neither the phosphate remover nor concrete showed statistically significant NO3
- removal (Figure 2.5D).
Page 38 of 99
(A)
Figure 2-5. Sorption isotherms for the four soils used in this experiment for A) ammonium and B) nitrate.
(B)
Page 39 of 99

Figure 2-6. Sorption isotherms for the three reference materials (concrete, phosphorus remover, and nitrate remover) that were evaluated in this experiment for A) ammoniuim and B) nitrate sorption.
(A)
(B)
Page 40 of 99
Biochar amended soil N incubations Of the 12 soil and black carbon materials, all (12 of 12) showed significant NH4
+ removal. However, only 3 (25%) expressing NH4
+ adsorption by a best fit Langmuir isotherm. Surprisingly, none of the soil – biochar mixtures possessed statistically significant NO3
- removal capacities. Recalling that the selection criteria for biochars to be amended to soils was the 3 best at removing NH4
+ and NO3-, there was a
reduction in the observed sorption from the biochar alone (Biochar 100%). For the NH4
+ results, only 2 (Rosemount with Coconut Coir 350, and Morris with Soybean Combine Residue 350) out of 12 soil and biochar combinations showed an increase in nitrogen removal over the soil results without biochar amendments (Figure 2.6A). No biochar amended soil was observed to alter removal of NO3
-. Many studies have investigated how biochar soil amendments affect nitrogen leaching. Studies on the Amazonian Terra Preta soils, showed that these sites had reduced N leaching when compared to the surrounding Oxisols (Glaser, Haumaier et al. 2001, Glaser, Lehmann et al. 2002). Later studies suggested that the reduced leaching was a result of the increased black carbon concentrations. For example, Midwestern USA soils Laird, Fleming et al. (2010) showed that biochar amended soil columns decreased N leaching by 11% over control columns after fertilization with equal swine manure applications. Additionally, biochar amendments totally eliminated N and other nutrient leaching spikes, which at the time insinuated that biochar amendments increase soil N retention. Laird et al.’s (2010) study provides the best comparison to the present study, since biochar N adsorption studies have not previously investigated biochar amended soils, and Laird et al.’s (2010) study was conducted on geographically similar soils as the current study. Nonetheless, from the present study it seems that biochar amendments exhibit a capacity to reduce NH4
+ leaching while unable to modify NO3- leaching values.
Page 41 of 99

Figure 2-7. Amended soil incubations for the sorption of ammonium across Morris and Rosemount soils.
Figure 2-8. Amended soil incubations for nitrate sorption across Morris and Rosemount. soils
Page 42 of 99
Longer term continuous monitoring experiments The temporal change in these longer term laboratory experiments are shown as percent reduction versus time in Figure 2-8. From the ANOVA analysis, there was a significant impact of the material type (p=8.42x10⁻¹⁴) and sample time (p<2x10-16). However, there was no major difference in the source of drainage water. The kinetic analysis is shown in Figure 2-9 and 2-10 for the two different drainage waters. The lack of significant differences in the drainage water can be seen in the similarity of the rate constants determined for the P-removal (Table 2-5), which confirms the similarities in the behaviors across the different drainage waters.
The concrete was the material with the fastest removal rate (𝑡𝑡1
2= 0.025 𝑑𝑑𝑑𝑑𝑑𝑑𝑑𝑑). The modification of the
coconut biochar did increase the rate of P removal by a factor of 2, although the exact cause of this is unknown. There is a significant variability in the kinetics of phosphorus removal (half-lives from 0.03 to 1.2 days). This is in stark contrast to the kinetics observed in nitrate removal (Figure 2.11), where the materials illustrated similar kinetic behavior in the different drainage waters (Table 2-6). As seen in Figure 2-11, there are significant differences in how the materials removed nitrate in each of the two drainage waters (p<0.05). The GM site appeared to delay the disappearance as seen in three of the four materials by a factor of 2. The modified coconut biochar was the only material to have approximately the same removal rate in both drainage water samples. The exact cause of this is unknown, but it does suggest similar removal mechanisms for nitrate removal across all 4 materials. This supports the conclusion that the removal is not driven by the material type.
Page 43 of 99

Figure 2-9. Percentage of phosphorus removed from a known initial concentration as a function of contact time for the four materials (activated charcoal, concrete, coconut biochar, and modified coconut biochar).
0%
10%
20%
30%
40%
50%
60%
70%
80%
90%
100%
0 500 1000 1500 2000 2500 3000 3500
Phos
p-Re
duct
ion
Contact Time, min
Materials: BC-26 (Activated Charcoal)
BC-26 @ GRF
BC-26 @ GMD
0%
10%
20%
30%
40%
50%
60%
70%
80%
90%
100%
0 500 1000 1500 2000 2500 3000 3500
Phos
p-Re
duct
ion
Contact Time, min
Materials: BC-168 (Crushed Concrete)
BC-168 @ GRF
BC-168 @ GMD
0%
10%
20%
30%
40%
50%
60%
70%
80%
90%
100%
0 500 1000 1500 2000 2500 3000 3500
Phos
p-Re
duct
ion
Contact Time, min
Materials: BC-175 (Coconut Coir)
BC-175 @ GRF
BC-175 @ GMD
0%
10%
20%
30%
40%
50%
60%
70%
80%
90%
100%
0 500 1000 1500 2000 2500 3000 3500
Phos
p-Re
duct
ion
Contact Time, min
Materials: BC-175mo (Coconut Coir Modified)
BC-175mo @ GRF
BC-175mo @ GMD
Page 44 of 99
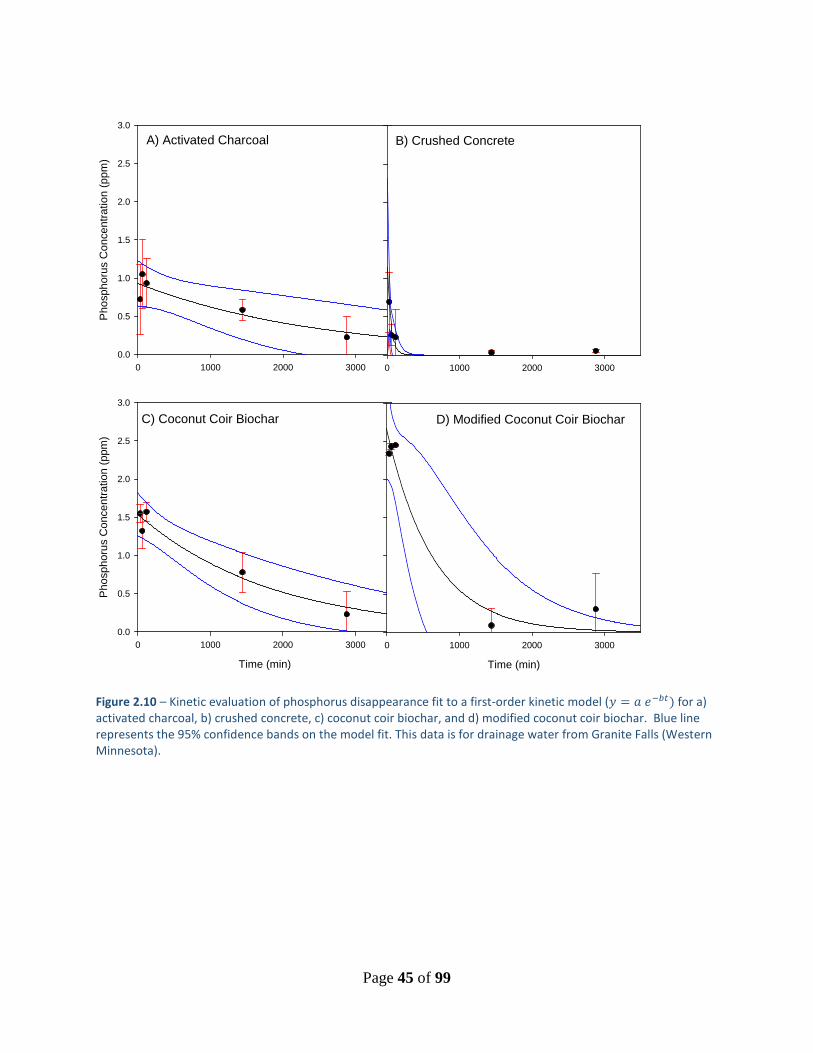
Figure 2.10 – Kinetic evaluation of phosphorus disappearance fit to a first-order kinetic model (𝑑𝑑 = 𝑑𝑑 𝑒𝑒−𝑏𝑏𝑏𝑏) for a) activated charcoal, b) crushed concrete, c) coconut coir biochar, and d) modified coconut coir biochar. Blue line represents the 95% confidence bands on the model fit. This data is for drainage water from Granite Falls (Western Minnesota).
A) Activated Charcoal
0 1000 2000 3000
Pho
spho
rus
Con
cent
ratio
n (p
pm)
0.0
0.5
1.0
1.5
2.0
2.5
3.0
B) Crushed Concrete
0 1000 2000 3000
C) Coconut Coir Biochar
Time (min)
0 1000 2000 3000
Pho
spho
rus
Con
cent
ratio
n (p
pm)
0.0
0.5
1.0
1.5
2.0
2.5
3.0
D) Modified Coconut Coir Biochar
Time (min)
0 1000 2000 3000
Page 45 of 99

Figure 2.11 – Kinetic evaluation of phosphorus disappearance fit to a first-order kinetic model (𝑑𝑑 = 𝑑𝑑 𝑒𝑒−𝑏𝑏𝑏𝑏) for a) activated charcoal, b) crushed concrete, c) coconut coir biochar, and d) modified coconut coir biochar. Blue line represents the 95% confidence bands on the model fit. This data is for drainage water from Grand Meadow (Southern Minnesota).
Activated Charcoal
Time (min)
0 1000 2000 3000
Con
cent
ratio
n P
(ppm
)
0.0
0.2
0.4
0.6
0.8
1.0
1.2
1.4
1.6
1.8Concrete
Time (min)
0 1000 2000 30000.0
0.2
0.4
0.6
0.8
1.0
1.2
1.4
1.6
1.8
2.0
Coconut Biochar
Time (min)
0 1000 2000 3000
Con
cent
ratio
n P
(ppm
)
0.0
0.5
1.0
1.5
2.0
2.5
Modified Coconut Biochar
Time (min)
0 1000 2000 30000.0
0.5
1.0
1.5
2.0
2.5
3.0
3.5
Page 46 of 99
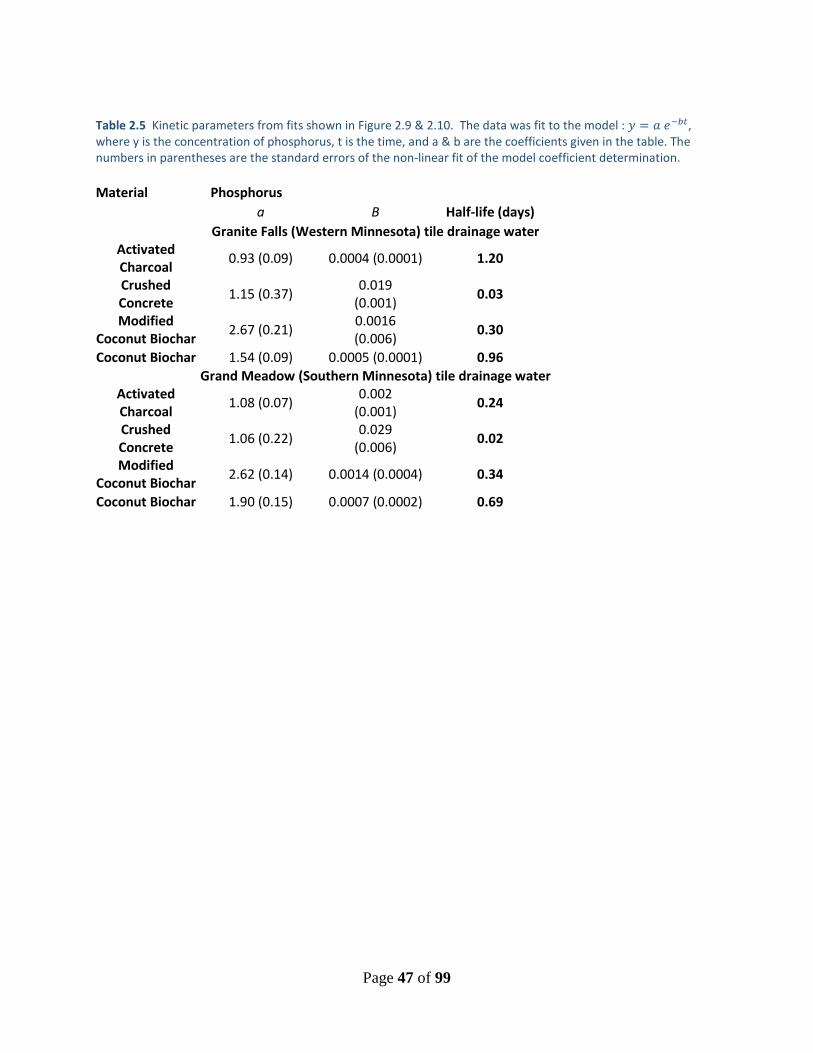
Table 2.5 Kinetic parameters from fits shown in Figure 2.9 & 2.10. The data was fit to the model : 𝑑𝑑 = 𝑑𝑑 𝑒𝑒−𝑏𝑏𝑏𝑏, where y is the concentration of phosphorus, t is the time, and a & b are the coefficients given in the table. The numbers in parentheses are the standard errors of the non-linear fit of the model coefficient determination. Material Phosphorus a B Half-life (days)
Granite Falls (Western Minnesota) tile drainage water Activated Charcoal 0.93 (0.09) 0.0004 (0.0001) 1.20
Crushed Concrete 1.15 (0.37) 0.019
(0.001) 0.03
Modified Coconut Biochar 2.67 (0.21) 0.0016
(0.006) 0.30
Coconut Biochar 1.54 (0.09) 0.0005 (0.0001) 0.96 Grand Meadow (Southern Minnesota) tile drainage water
Activated Charcoal 1.08 (0.07) 0.002
(0.001) 0.24
Crushed Concrete 1.06 (0.22) 0.029
(0.006) 0.02
Modified Coconut Biochar 2.62 (0.14) 0.0014 (0.0004) 0.34
Coconut Biochar 1.90 (0.15) 0.0007 (0.0002) 0.69
Page 47 of 99
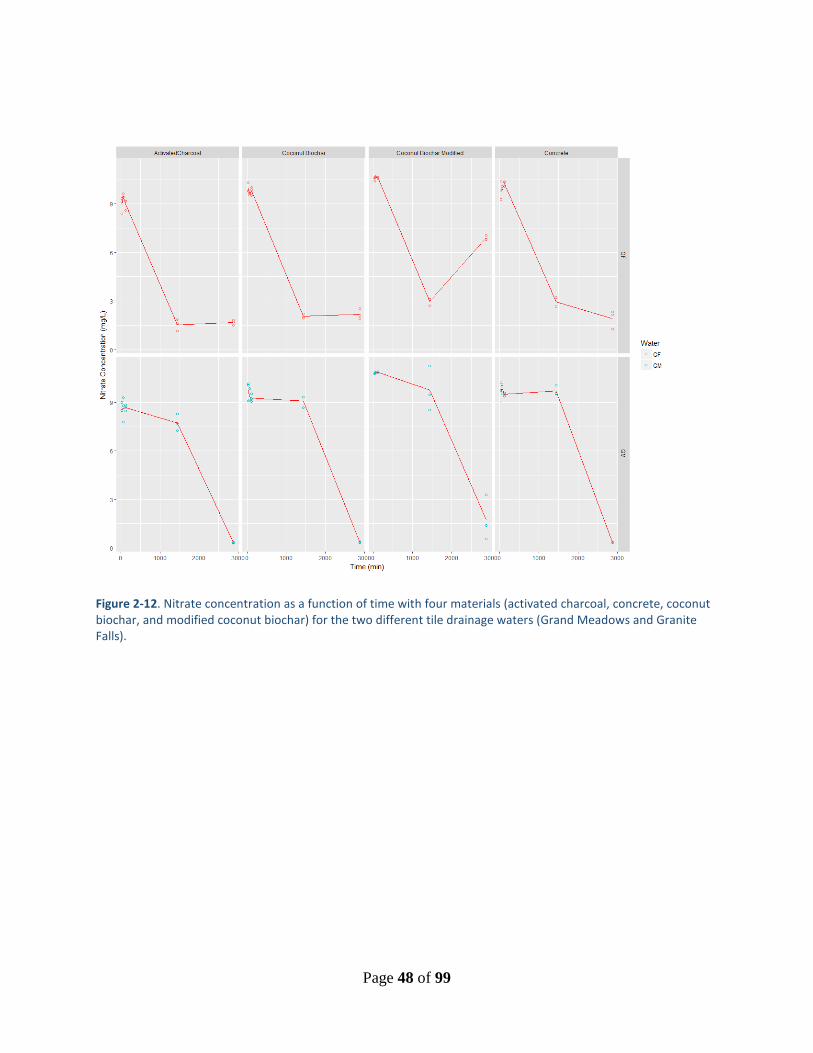
Figure 2-12. Nitrate concentration as a function of time with four materials (activated charcoal, concrete, coconut biochar, and modified coconut biochar) for the two different tile drainage waters (Grand Meadows and Granite Falls).
Page 48 of 99
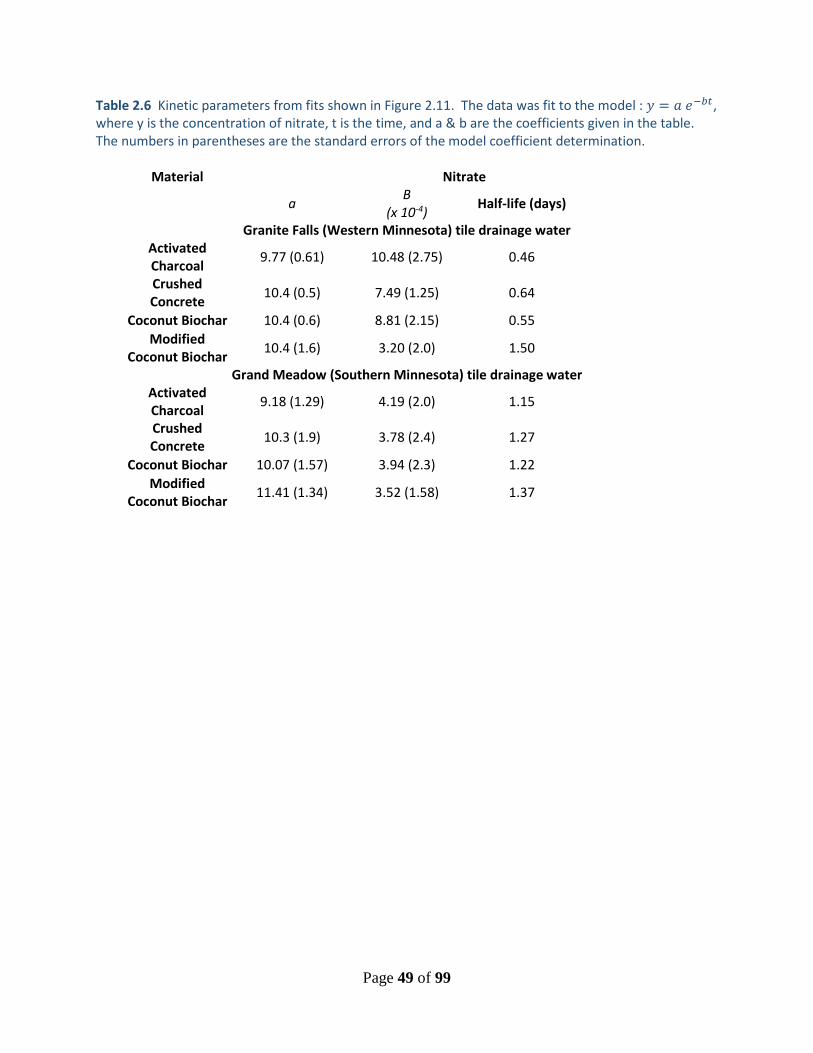
Table 2.6 Kinetic parameters from fits shown in Figure 2.11. The data was fit to the model : 𝑑𝑑 = 𝑑𝑑 𝑒𝑒−𝑏𝑏𝑏𝑏, where y is the concentration of nitrate, t is the time, and a & b are the coefficients given in the table. The numbers in parentheses are the standard errors of the model coefficient determination.
Material Nitrate
a B (x 10-4) Half-life (days)
Granite Falls (Western Minnesota) tile drainage water Activated Charcoal 9.77 (0.61) 10.48 (2.75) 0.46
Crushed Concrete 10.4 (0.5) 7.49 (1.25) 0.64
Coconut Biochar 10.4 (0.6) 8.81 (2.15) 0.55 Modified
Coconut Biochar 10.4 (1.6) 3.20 (2.0) 1.50
Grand Meadow (Southern Minnesota) tile drainage water Activated Charcoal 9.18 (1.29) 4.19 (2.0) 1.15
Crushed Concrete 10.3 (1.9) 3.78 (2.4) 1.27
Coconut Biochar 10.07 (1.57) 3.94 (2.3) 1.22 Modified
Coconut Biochar 11.41 (1.34) 3.52 (1.58) 1.37
Page 49 of 99
Electrical Conductivity, pH and ORP alterations with time For electrical conductivity (Figure 2.12), the activated charcoal addition increased conductivity an average of 5 µS/cm/hour, whereas the crushed concrete increased the conductivity by 8 µS/cm/hr, coconut biochar increased the electrical conductivity by 18 µS/cm/hr and the modified coconut biochar biochar was reduced to 5 µS/cm/hr.
There was minimal impact on solution pH with the activated charcoal (Fig 2.12a), whereas the concrete and coconut biochar increased the pH and then the impact was decreasing with time. The modified biochar slightly acidified the drainage water initially, and this decrease was maintained through the 24 hours evaluated (Figure 2.12d).
For oxidation-reduction potential, there was a decrease for all amendments. The activated charcoal then remained steady for the 24 hours (180 meV) (Figure 2.13a). The concrete and coconut biochar decreased the ORP initially, and then a gradual increase in the value was recorded during the experiment (~150 meV) (Figure 2.13b & c). The modified biochar reduced the ORP to the lowest observed values (< 100 mV) and maintained this low ORP level for the 24 hours (Figure 2.13d). This is surprising, since the experiment was conducted in a well aerated beaker while being stirred on a magnetic stir plate (see Materials and Methods).
Page 50 of 99

Activated Charcoal Concrete
Coconut Biochar Modified Coconut Biochar
Figure 2.13 Trends in pH and electrical conductivity for 24 hours following addition of the materials to Granite Falls drainage water: a) activated charcoal, b) concrete, c) coconut biochar, and d) modified coconut biochar.
7.50
7.60
7.70
7.80
7.90
8.00
8.10
8.20
8.30
8.40
8.50
0
50
100
150
200
250
300
350
400
450
0 2 4 6 8 10 12 14 16 18 20 22 24 26
pH
Cond
uctiv
ity, µ
S/cm
Cond. Bk 13 Cond Bk 14 Cond Bk 15
pH Bk 13 pH Bk 14 pH Bk 15
8.0
8.3
8.5
8.8
9.0
9.3
9.5
9.8
10.0
0
100
200
300
400
500
600
700
800
900
1000
0.00 2.00 4.00 6.00 8.00 10.00 12.00 14.00 16.00 18.00 20.00 22.00 24.00 26.00
pH
Cond
uctiv
ity, µ
S/cm
Hour
Cond Bk 04 Cond Bk 05 Cond Bk 06
pH Bk 06 pH Bk 04 pH Bk 05
8.4
8.6
8.8
9.0
9.2
9.4
9.6
9.8
10.0
0
200
400
600
800
1,000
1,200
1,400
0 2 4 6 8 10 12 14 16 18 20 22 24 26
pH
Cond
uctiv
ity, µ
S/cm
Hour
Cond Bk 08 Cond Bk 09 pH Bk 07pH Bk 08 pH Bk 09
6.0
6.1
6.2
6.3
6.4
6.5
6.6
6.7
6.8
6.9
7.0
200
300
400
500
600
700
800
900
1000
0 2 4 6 8 10 12 14 16 18 20 22 24 26
pH
Cond
uctiv
ity, µ
S/cm
Hour
Cond Bk 11 Cond Bk 12 pH Bk 10
pH Bk 11 pH Bk12
Page 51 of 99

Figure 2.14 Oxidation-Reduction Potential (ORP) changes in the first 24 hours for a) activated charcoal, b) concrete, c) coconut biochar, and d) modified coconut biochar.
100
120
140
160
180
200
220
240
260
280
300
0 2 4 6 8 10 12 14 16 18 20 22 24 26
Oxi
do-R
educ
tion
Pote
ntia
l, m
Volt
s
ORP Bk 01 ORP Bk 02 ORP Bk 03
0
20
40
60
80
100
120
140
160
180
200
220
0.00 2.00 4.00 6.00 8.00 10.00 12.00 14.00 16.00 18.00 20.00 22.00 24.00 26.00
Oxi
do-R
educ
tion
Pote
ntia
l, m
Volts
Hour
ORP Bk 04 ORP Bk 05 ORP Bk 06
0
50
100
150
200
250
0 2 4 6 8 10 12 14 16 18 20 22 24 26
Oxi
o-Re
duct
ion
Pote
ntia
l, m
Volts
Hour
ORP Bk 07 ORP Bk 08 ORP Bk 09
0
50
100
150
200
250
0 2 4 6 8 10 12 14 16 18 20 22 24 26
Oxi
do-R
educ
tion
Pote
ntia
l, m
Volts
Hour
ORP Bk 10 ORP Bk 11 ORP Bk 12
Page 52 of 99
2.4 Conclusions
Nitrate/Ammonium: The materials investigated here included 21 biochars, four Minnesota top soils, 12 biochar and soil (1:10, w/w) mixtures, and 3 other produced materials (i.e., concrete, nitrate and P removal resins). The results of this study show that approximately 86% of biochars statistically removed NH4
+ and 77% removed NO3-
from aqueous solution. Despite these apparent high percentages, only 52% and 33% possessed statistically significant sorption isotherms for NH4
+ and NO3-, respectively. On the other hand, once
mixed with soils, only 18% of biochars possessed increased NH4+ adsorption over unamended soil.
Therefore, suggests competitive sorption with other compounds or organic matter could be a definite constraining factor. The results seem to point towards biochars having a much greater affinity to remove NH4
+ than NO3-
from aqueous solution. Few biochar physical and chemical values correlate with NH4+ removal rates,
albeit slightly. In comparison, for the biochars that do remove NO3-, pyrolysis temperature correlates
strongly with NO3- removal. In examining biochar effects on biochar-amended soils, biochars have a
reduced effect to remove NH4+ from soil solutions, but approximately ¼ of the biochar additions show
statistically significant increases in NH4+ removal. The same cannot be said for NO3
- removal, whatever effect biochars had on removing NO3
- from aqueous solution, it completely disappeared in biochar soil amendments in this study. It is noteworthy that no biochar addition increased soil NO3
- removal or adsorption capacities. From this study, we hypothesize that biochar alone is likely to remove NH4
+ from aqueous solution, while possessing a slight tendency for nitrate removal. Therefore, despite the overall hype for biochar removal efficiencies, biochars have a limited ability to alter N removal and adsorption upon soil additions at less than 10% (w/w). The kinetic analysis of nitrate removal revealed that the removal mechanisms occurring were similar across all the materials (due to the similarity in curve shape and half-life calculations). This was particularly surprising, since the nitric acid modified biochar was targeted for nitrate removal, based on previous studies (Vinke, van der Eijk et al. 1994, Alvarez, Clemente et al. 2003). Despite not uncovering this mechanism, the fact that all materials were similar with no order of magnitude difference in the kinetics, suggests other factors besides the material evaluated here impacted nitrate’s disappearance rate.
Phosphorus: For phosphorus removal, we did observe significant differences as a function of the material added, both in removal rates and overall capacities for removal. The concrete was the fastest removal agent for P, with a calculated half-life of around 0.025 days (36 minutes). On the other hand, black carbon materials possessed half-lives of 0.3 to 1.3 days. This was to be expected, since the primary removal mechanism would have been hypothesized through chemical precipitation for P [e.g., most likely CaPO4 precipitation; (Morse, Brett et al. 1998)]. The other noteworthy observation was the fact that the kinetics were different for all 4 materials. This confirms that the chemistry of dissolved species following amendment would be critical in determining the capacity and rates of this P removal mechanism. Thereby, this P removal process can be further optimized.
Page 53 of 99

2.5 References
Alvarez, R., C. Clemente and D. Gomez-Limon (2003). "The influence of nitric acid oxidation of low rank coal and its impact on coal structure☆." Fuel 82(15): 2007-2015.
Asada, T., S. Ishihara, T. Yamane, A. Toba, A. Yamada and K. Oikawa (2002). "Science of Bamboo Charcoal: Study on Carbonizing Temperature of Bamboo Charcoal and Removal Capability of Harmful Gases." J. Health Sci. 48(6): 473-479.
Asada, T., T. Ohkubo, K. Kawata and K. Oikawa (2006). "Ammonia Adsorption on Bamboo Charcoal with Acid Treatment." Journal of Health Science 52(5): 585-589.
Aslan, S. and I. K. Kapdan (2006). "Batch kinetics of nitrogen and phosphorus removal from synthetic wastewater by algae." Ecological Engineering 28(1): 64-70.
Atkinson, C. J., J. D. Fitzgerald and N. A. Hipps (2010). "Potential mechanisms for achieving agricultural benefits from biochar application to temperate soils: a review." Plant and Soil 337(1): 1-18.
Atkinson, C. J., J. D. Fitzgerald and N. A. Hipps (2010). "Potential mechanisms for achieving agricultural benefits from biochar application to temperate soils: a review." Plant and soil 337(1-2): 1-18.
Bailey, V. L., S. J. Fansler, J. L. Smith and H. Bolton Jr. (2011). "Reconciling apparent variability in effects of biochar amendment on soil enzyme activities by assay optimization." Soil Biology and Biochemistry 43(2): 296-301.
Barnes, R. T., M. E. Gallagher, C. A. Masiello, Z. Liu and B. Dugan (2014). "Biochar-induced changes in soil hydraulic conductivity and dissolved nutrient fluxes constrained by laboratory experiments." PLoS One 9(9): e108340.
Biederman, L. A. and W. S. Harpole (2013). "Biochar and its effects on plant productivity and nutrient cycling: a meta-analysis." GCB Bioenergy 5(2): 202-214.
Bock, E., N. Smith, M. Rogers, B. Coleman, M. Reiter, B. Benham and Z. M. Easton (2015). "Enhanced Nitrate and Phosphate Removal in a Denitrifying Bioreactor with Biochar." Journal of Environment Quality 44(2): 605.
Broder, M. W. and G. H. Wagner (1988). "Microbial colonization and decomposition of corn, wheat, and soybean residue." Soil Science Society of America Journal 52(1).
Chan, K. Y. and Z. Xu (2009). "Biochar: nutrient properties and their enhancement." Biochar for environmental management: science and technology: 67-84.
Chatterjee, S., D. S. Lee, M. W. Lee and S. H. Woo (2009). "Nitrate removal from aqueous solutions by cross-linked chitosan beads conditioned with sodium bisulfate." Journal of Hazardous Materials 166(1): 508-513.
Christianson, L., M. Hedley, M. Camps, H. Free and S. Saggar (2011). Influence of Biochar Amendment on Dentitrification Bioreactor Performance, Massey University.
Delaplace, P., B. Delory, C. Baudson, M. Mendaluk-Saunier de Cazenave, S. Spaepen, S. Varin, Y. Brostaux and P. du Jardin (2015). "Influence of rhizobacterial volatiles on the root system architecture and the production and allocation of biomass in the model grass Brachypodium distachyon (L.) P. Beauv." BMC Plant Biology 15(1): 1-15.
Della Rocca, C., V. Belgiorno and S. Meriç (2006). "An heterotrophic/autotrophic denitrification (HAD) approach for nitrate removal from drinking water." Process Biochemistry 41(5): 1022-1028.
DeLuca, T. H., M. D. MacKenzie, M. J. Gundale and W. E. Holben (2006). "Wildfire-Produced Charcoal Directly Influences Nitrogen Cycling in Ponderosa Pine Forests." Soil Science Society of America Journal 70(2): 448-453.
Divya Jyothi, M., K. R. Kiran and K. Ravindhranath (2012). "New bio-sorbents in the control of phosphate pollution in waste waters." International Journal of Applied Environmental Sciences 7(2): 127-140.
Page 54 of 99

Durden, E. (1849). "On the application of peat and its products, to manufacturing, agricultural, and sanitary purposes." Proceedings of the Geological and Polytechnic Society of the West Riding of Yorkshire 3: 339-366.
Firestone, M. K., M. S. Smith, R. B. Firestone and J. M. Tiedje (1979). "The influence of nitrate, nitrite, and oxygen on the composition of the gaseous products of denitrification in soil." Soil Science Society of America Journal 43(6): 1140-1144.
Foo, K. Y. and B. H. Hameed (2010). "Insights into the modeling of adsorption isotherm systems." Chemical Engineering Journal 156(1): 2-10.
Freundlich, H. M. F. (1906). "Über die Adsorption in Lösungen." Zeitschrift für Physikalische Chemie 57(A): 385-470.
Furumai, H., H. Tagui and K. Fujita (1996). "Effects of pH and alkalinity on sulfur-denitrification in a biological granular filter." Water Science and Technology 34(1): 355-362.
Furumai, H., H. Tagui and K. Fujita (1996). "Effects of pH and alkalinity on sulfur-denitrification in a biological granular filter." Water Science and Technology 34(1–2): 355-362.
Gai, X., H. Wang, J. Liu, L. Zhai, S. Liu, T. Ren and H. Liu (2014). "Effects of Feedstock and Pyrolysis Temperature on Biochar Adsorption of Ammonium and Nitrate." PLoS ONE 9(12): 1-19.
Gee, G. W. and J. W. Bauder (1986). Particle-size analysis. E. A. Klute. Madison, Wisconsin, USA, American Society of Agronomy and Soil Science Society of America: 383-411.
German, L. A. (2003). "Historical contingencies in the coevolution of environment and livelihood: contributions to the debate on Amazonian Black Earth." Geoderma 111(3–4): 307-331.
Glaser, B., L. Haumaier, G. Guggenberger and W. Zech (2001). "The ’Terra Preta’ phenomenon: a model for sustainable agriculture in the humid tropics." Naturwissenschaften 88(1): 37-41.
Glaser, B., J. Lehmann and W. Zech (2002). "Ameliorating physical and chemical properties of highly weathered soils in the tropics with charcoal – a review." Biology and Fertility of Soils 35(4): 219-230.
Haider, G., D. Steffens, C. Müller and C. I. Kammann (2016). "Standard Extraction Methods May Underestimate Nitrate Stocks Captured by Field-Aged Biochar." Journal of Environmental Quality.
Hansen, H. C. B., C. B. Koch, H. Nancke-Krogh, O. K. Borggaard and J. Sørensen (1996). "Abiotic Nitrate Reduction to Ammonium: Key Role of Green Rust." Environmental Science & Technology 30(6): 2053-2056.
Hansen, H. C. B., C. B. Koch, H. Nancke-Krogh, O. K. Borggaard and J. Sørensen (1996). "Abiotic nitrate reduction to ammonium: Key role of green rust." Environmental Science & Technology 30(6): 2053-2056.
Highwood, E. J. and R. P. Kinnersley (2006). "When smoke gets in our eyes: The multiple impacts of atmospheric black carbon on climate, air quality and health." Environment International 32(4): 560-566.
Huang, Y. H. and T. C. Zhang (2004). "Effects of low pH on nitrate reduction by iron powder." Water Research 38(11): 2631-2642.
Hunter, J. (1863). "LI. On the absorption of gases by charcoal." Philosophical Magazine Series 4 25(169): 364-368.
Iida, T., Y. Amano, M. Machida and F. Imazeki (2013). "Effect of Surface Property of Activated Carbon on Adsorption of Nitrate Ion." CHEMICAL ^|^ PHARMACEUTICAL BULLETIN 61(11): 1173-1177.
Jansen, R. J. J. and H. van Bekkum (1994). "Amination and ammoxidation of activated carbons." Carbon 32(8): 1507-1516.
Jeffery, S., F. G. A. Verheijen, M. van der Velde and A. C. Bastos (2011). "A quantitative review of the effects of biochar application to soils on crop productivity using meta-analysis." Agriculture, Ecosystems & Environment 144(1): 175-187.
Kastner, J. R., J. Miller and K. C. Das (2009). "Pyrolysis conditions and ozone oxidation effects on ammonia adsorption in biomass generated chars." Journal of Hazardous Materials 164(2-3): 1420-1427.
Laird, D., P. Fleming, B. Wang, R. Horton and D. Karlen (2010). "Biochar impact on nutrient leaching from a Midwestern agricultural soil." Geoderma 158(3–4): 436-442.
Page 55 of 99

LeCroy, C., C. A. Masiello, J. A. Rudgers, W. C. Hockaday and J. J. Silberg (2013). "Nitrogen, biochar, and mycorrhizae: alteration of the symbiosis and oxidation of the char surface." Soil Biology and Biochemistry 58: 248-254.
Liang, B., J. Lehmann, D. Solomon, J. Kinyangi, J. Grossman, B. O’Neill, J. O. Skjemstad, J. Thies, F. J. Luizão, J. Petersen and E. G. Neves (2006). "Black Carbon Increases Cation Exchange Capacity in Soils." Soil Science Society of America Journal 70: 1719-1730.
Malanima, P. (2006). "Energy crisis and growth 1650 - 1850: the European deviation in a comparative perspective." Journal of Global History 1(01): 101-121.
Mizuta, K., T. Matsumoto, Y. Hatate, K. Nishihara and T. Nakanishi (2004). "Removal of nitrate-nitrogen from drinking water using bamboo powder charcoal." Bioresource Technology 95(3): 255-257.
Morse, G., S. Brett, J. Guy and J. Lester (1998). "Review: phosphorus removal and recovery technologies." Science of the total environment 212(1): 69-81.
Mukherjee, A., A. R. Zimmerman and W. Harris (2011). "Surface chemistry variations among a series of laboratory-produced biochars." Geoderma 163(3-4): 247-255.
Namasivayam, C. and D. Sangeetha (2005). "Removal and recovery of nitrate from water by ZnCl2 activated carbon from coconut coir pith, an agricultural solid waste." Indian Journal of Chemical Technology 12(5): 513-521.
Nelson, D. C., G. R. Flematti, E. L. Ghisalberti, K. W. Dixon and S. M. Smith (2012). "Regulation of Seed Germination and Seedling Growth by Chemical Signals from Burning Vegetation." Annual Review of Plant Biology 63(1): 107-130.
Nelson, D. W. and L. E. Sommers (1996). Total carbon, organic carbon, and organic matter. D. L. Sparks, Soil Science Society of America: 961-1610.
Otto, J. B., W. K. Blank and D. A. Dahl (1988). "A nitrate precipitation technique for preparing strontium for isotopic analysis." Chemical Geology: Isotope Geoscience section 72(2): 173-179.
Puri, B., D. Singh, J. Nath and L. Sharma (1958). "Chemisorption of oxygen on activated charcoal and sorption of acids and bases." Industrial & Engineering Chemistry 50(7): 1071-1074.
Puri, B. R., K. Murari and D. Singh (1961). "The sorption of water vapor by charcoal as influenced by surface oxygen complexes." The Journal of Physical Chemistry 65(1): 37-39.
Qin, S., K. Jiao, D. Lyu, L. Shi and L. Liu (2015). "Effects of maize residue and cellulose-decomposing bacteria inocula on soil microbial community, functional diversity, organic fractions, and growth of Malus hupehensis Rehd." Archives of Agronomy and Soil Science 61(2): 173-184.
Reilly, J. F., A. J. Horne and C. D. Miller (1999). "Nitrate removal from a drinking water supply with large free-surface constructed wetlands prior to groundwater recharge." Ecological Engineering 14(1): 33-47.
Robertson, W. D., G. I. Ford and P. S. Lombardo (2005). "Wood-based filter for nitrate removal in septic systems." Transactions of the American Society of Agricultural Engineers 48(1): 121-128.
Robertson, W. D., G. I. Ford and P. S. Lombardo (2005). "Wood-Based Filter for Nitrate Removal In Septic Systems." Transactions of the American Society of Agricultural and Biological Engineers 48(1): 121-128.
Seredych, M., A. V. Tamashausky and T. J. Bandosz (2010). "Graphite Oxides Obtained from Porous Graphite: The Role of Surface Chemistry and Texture in Ammonia Retention at Ambient Conditions." Advanced Functional Materials 20(10): 1670-1679.
Singh, B., B. P. Singh and A. L. Cowie (2010). "Characterisation and evaluation of biochars for their application as a soil amendment." Soil Research 48(7): 516-525.
Spears, B. M., S. Meis, A. Anderson and M. Kellou (2013). "Comparison of phosphorus (P) removal properties of materials proposed for the control of sediment p release in UK lakes." Science of The Total Environment 442(0): 103-110.
Spokas, K., J. Novak and R. Venterea (2012). "Biochar’s role as an alternative N-fertilizer: ammonia capture." Plant and Soil 350(1-2): 35-42.
Page 56 of 99

Spokas, K. A. (2013). "Impact of biochar field aging on laboratory greenhouse gas production potentials." GCB Bioenergy 5(2): 165-176.
Spokas, K. A., J. M. Novak, C. E. Stewart, K. B. Cantrell, M. Uchimiya, M. G. DuSaire and K. S. Ro (2011). "Qualitative analysis of volatile organic compounds on biochar." Chemosphere 85(5): 869-882.
Spokas, K. A. and D. C. Reicosky (2009). "Impact of sixteen different biochars on soil greenhouse gas production." Annals of Environmental Science 3: 14.
Su, C. and R. W. Puls (2007). "Removal of added nitrate in the single, binary, and ternary systems of cotton burr compost, zerovalent iron, and sediment: Implications for groundwater nitrate remediation using permeable reactive barriers." Chemosphere 67(8): 1653-1662.
Taghizadeh-Toosi, A., T. J. Clough, R. R. Sherlock and L. M. Condron (2011). "Biochar adsorbed ammonia is bioavailable." Plant and Soil 350(1-2): 57-69.
Tsukagoshi, S., H. Shinoyama, K. Noda and F. Ikegami (2010). "The Effect Of Charcoal Amendment On The Lettuce Growth And NO3-N Discharge From The Soil Medium." Acta Horticulturae 852.
Vinke, P., M. van der Eijk, M. Verbree, A. F. Voskamp and H. van Bekkum (1994). "Modification of the surfaces of a gasactivated carbon and a chemically activated carbon with nitric acid, hypochlorite, and ammonia." Carbon 32(4): 675-686.
Yao, Y., B. Gao, M. Inyang, A. R. Zimmerman, X. Cao, P. Pullammanappallil and L. Yang (2011). "Removal of phosphate from aqueous solution by biochar derived from anaerobically digested sugar beet tailings." Journal of Hazardous Materials 190(1-3): 501-507.
Yao, Y., B. Gao, M. Zhang, M. Inyang and A. R. Zimmerman (2012). "Effect of biochar amendment on sorption and leaching of nitrate, ammonium, and phosphate in a sandy soil." Chemosphere 89(11): 1467-1471.
Yargicoglu, E. N., B. Y. Sadasivam, K. R. Reddy and K. Spokas (2015). "Physical and chemical characterization of waste wood derived biochars." Waste management 36: 256-268.
Zanella, O., I. Tessaro and L. Féris (2015). "Nitrate sorption on activated carbon modified with CaCl2: Equilibrium, isotherms and kinetics." CI CEQ 21(1-1): 23-33.
Zimmerman, A. R., B. Gao and M.-Y. Ahn (2011). "Positive and negative carbon mineralization priming effects among a variety of biochar-amended soils." Soil Biology and Biochemistry 43(6): 1169-1179.
Page 57 of 99

Chapter 3
Column Studies
3.1 Introduction
Preliminary and replicated column studies were conducted at the Univ. of Minnesota – St. Paul campus by an M.S. student funded by this grant, supported by USDA-ARS personnel, to identify candidate materials for increasing the rate of nitrate removal in denitrification bioreactors and for removing phosphorus from agriculture tile drainage effluent. A thorough report of this work has been documented in the student’s M.S. Thesis, “Using unique carbon source combinations to increase nitrate and phosphate removal in bioreactors,” which was accepted by the Univ. of Minnesota Graduate School in 2016 (see Abstract in Appendix 3.8.1). The nitrate removal chapter in the thesis is in the process of being finalized for submission as a peer-reviewed scientific journal article. The phosphorus removal chapter needs to be upgraded for consideration of a similar treatment. A collaborator on the project is developing a third potential manuscript, having found differences in microbial community composition among substrates at colder temperatures. Thus, the research funded by this grant will be well-documented and accessible for future reference and use. The information presented in this chapter has been extracted from the aforementioned M.S. Thesis and has been used with permission.
3.2 Materials and Methods
Eighteen columns of PVC pipe (15.2 cm i.d. X 49.5 cm long) were packed with six unique treatments (n=3) in an upflow laboratory column experiment. The six treatments were: (i) wood chips (WC), (ii) wood chips and woodchip biochar (WC+WBC), (iii) woodchips and sodium acetate (WC+A), (iv) corn cobs (CC), (v) corn cobs and modified coconut coir (CC+MC), and (vi) corn cobs, modified coconut coir, and modified macadamia biochar (CC+MC+MBC). Wood chips were approximately 13 by 25 by 6 mm and were composed of a mixture of hard and soft woods (Mulch Store (Empire, MN)). Corn cobs were typically 5 – 15 cm long and were obtained from the University of Minnesota – Morris’ inventory of corn cobs intended for the campus biomass-fueled boiler. The hardwood biochar (Cowboy Charcoal) was mostly 13 – 25 mm in size, similar to the wood chips, while the macadamia biochar (Biochar Brokers) was mostly < 6 mm in size. Coconut coir was obtained from J. Alderink LLC (Oak Park, MN) and fibers were typically 5 – 15 cm long. Coconut coir and macadamia biochar media were modified using an amination procedure similar to one described in Jansen and van Bekkum (1994). A solution of 10% nitric acid was added to a beaker of material and heated at 90°C for 4 hours. Material was then rinsed 10 times with DI water, or until pH was circumneutral. Baking soda was used to reach neutrality for all batches of materials. Columns were built out of Schedule 40 PVC pipe with corresponding caps for top and bottom of pipe. A PVC plate (1.3 cm thick) with holes drilled in for drainage was screwed onto bottom of pipe, a corresponding cap was glued over pipe end with plate, and then a stainless steel mesh wire circle was placed inside on top of PVC plate. Before packing columns, materials were oven dried at 70°C for 48 hours and then soaked in tap water for 48-72 hours. Materials were allowed to drip dry for 10 minutes and then packed in batches using the following method: batches of 400g of corn cobs or woodchips were packed into columns, with an 1812 g weight being used to tamp down each batch layer. 1g of biological inoculum (BioflocTM Biologicals, Innovative Turf Solutions, Cincinnati, OH) was weighed and
Page 58 of 99

divided between all batch layers before packing to provide denitrifiers for the columns. Single material treatments had ~10 layers. Columns with treatments consisting of several carbon materials were packed in alternating layers. Sub-samples were used to measure moisture content in order to determine dry mass of materials in columns. Percent by weight of different carbon materials was calculated for mixed treatments to determine how much modified coir or biochar was mixed in with the wood chips or corn cobs. Once all layers were packed into columns, a stainless steel mesh was placed on top of the material and another PVC plate was tapped down on top, leveled, and screwed into place. Drainable porosity was found for each column by filling columns with water, topping them off in the morning to make sure media were saturated, and then draining columns for 24h. Columns were capped using silicone caulk and glue and allowed to set for 24 h. Sensors measuring oxidation-reduction potential (ORP) were screwed into the top caps and were connected to a multiplexer controlled by a data logger that took readings every hour. The experiment was conducted for fourteen weeks at 15°C (i.e., “warm run”) and for thirteen weeks at 5°C (i.e., “cold run”) in a controlled temperature chamber. A second 15°C experiment (i.e., “rewarm run”) was conducted for 7 weeks to verify results were not influenced by loss of labile carbon from the warm to the cold run, since media were not changed between temperature experiments. Flow rates were adjusted to approximate the rise and decay of a typical drainage hydrograph using data from Morris, MN. The rise and decay of flow rates were fit to a week regimen and were associated with hydraulic residence times (HRT) of 1.5, 8, 12, and 24 h with durations for 6, 42, 48, and 72 h, respectively. Nitrate-N and dissolved reactive phosphate-P (DRP) influent concentrations were 20 mg N L-1 as potassium nitrate and 0.3 mg P L-1 as potassium phosphate, respectively, in reverse osmosis water. Sodium acetate was pumped into the three WC+A columns at a final concentration of 40 mg C L-1 using a separate pump at 1% of the main pump flow rate. Influent and effluent water was sampled at each of the 4 flow rates and tested for nitrate-N, ammonia-N, DRP, total carbon (TC), total organic carbon (TOC), and pH. Air and water temperatures were taken hourly. Dissolved oxygen (DO) was measured 4 times weekly during water sampling by the following method: The hand-held DO probe (HI 9142 (meter), HI 76407/4 (probe), Hanna Instruments, Woonsocket, RI) was inserted into a syringe body that had been connected via 6-mm diameter tubing to a valve on the top cap of the columns. The column effluent outlet valve was closed and the valve to the syringe body simultaneously opened to permit flow of water into the syringe body. The flow rate was changed to 10 mL min-1 to allow fresh water to flow continuously next to the probe’s membrane. There was minimal space between the wall of the syringe and the probe to reduce the potential for oxygen diffusion. Water samples were collected in 250 mL polyethylene bottles every week at the end of each HRT run and preserved with sulfuric acid (Clesceri et al., 1998) for analysis using colorimetric flow injection analysis (Lachat QuikChem 8500, Hach Co., Loveland, CO) for nitrate-N and ammonia-N (methods 10-107-04-1-B and 10-107-06-2-A, respectively), and DRP (method 10-115-01-1-A). Analyses of TC and TOC were done using EPA Methods 415.1 and 9060A (Tekmar-Dohrmann Phoenix 8000, Teledyne Tekmar, Mason, OH). Unacidified water samples were collected and measured for pH. Between each temperature run, there was a brief shut-down period. During this time, caps were removed and media samples (30-90g wet weight, ~20g dried weight) were taken for carbon analysis from each column and stored at 4°C and -80°C. Columns were then prepared for plumbing and capping, and temperature was changed as needed.
Page 59 of 99
Nitrate removal rate (NRR) was calculated for each water sampling date as the difference between the nitrate-N mass into (Nin) and out of (Nout) the bioreactor. For each column, the Nin mass was determined by multiplying the volume of water that passed through the column by the concentration of nitrate-N at the inlet, and Nout was the volume of water that passed through the column multiplied by the nitrate-N concentration of that column.
[3.1] In equation [3.1], (tn – t(n-1)) is the difference in sampling times and Volmedium is the gross volume occupied by the medium (Schipper et al, 2010). Nitrate-N percent load reduction was calculated for each column by first summing the Nin mass and summing the Nout mass during the entire temperature run, and then taking 1 – (ΣNout/ ΣNin). Load reductions for each column were then averaged by treatment. The DRP inlet and outlet concentration data were used to find DRP concentration reduction and cumulative DRP load reduction. DRP concentration reduction as a percentage was found for each column by dividing the inlet concentration from the outlet concentration. Cumulative DRP load reduction as a percentage was found for each column by using the DRP mass into (Pin) and out of (Pout) the bioreactor. For each column, the Pin mass was determined by calculating the volume of water that passed through the column by the concentration of DRP at the inlet, and Pout was the volume of water that passed through the column multiplied by the DRP concentration of that column. Cumulative DRP load reduction was calculated by first summing the Pin mass and summing the Pout mass during the entire temperature run, and then taking 1 – (ΣPout/ ΣPin). Load reductions for each column were then averaged by treatment. Total carbon (TC) and total organic carbon (TOC) production were both calculated for each column as the difference between the flow weighted grams of carbon in and carbon out of the bioreactor over the entire temperature experiment. Total inorganic carbon (TIC) was calculated for each column as the difference between TC production and TOC production for that column. Percent carbon, percent nitrogen, and C:N were analyzed using original carbon materials and bioreactor material sampled after the rewarm run. Samples were oven dried at 60°C, ground, and analyzed via combustion (vario MAX CN, elementar Americas Inc, Mt. Laurel, NJ).
3.3 Statistical Analysis
Once the experimental runs were complete, data were prepared for statistical analysis. The first two weeks of each temperature experiment were excluded as well as any weeks that had instrumental or experimental error (water pump failure, acetate pump failure, low water level, etc.). In all, this yielded eight weeks of data for both the warm and cold runs, and six weeks for the rewarm run. Nitrate-N concentration, nitrate-N load reduction by percentage, NRR, DRP concentration, DRP concentration reduction, DRP cumulative load reduction, TC, TOC, and TIC were analyzed with a linear mixed-effects
Page 60 of 99
model in R using nlme package (Pinheiro et al, 2014). The linear mixed-effects model was run with and without a correlation argument, and fit criteria AIC and BIC showed that the correlation argument had the higher quality of statistical model in all analyses. Statistical treatment differences were determined by running Tukey multiple comparisons using lsmeans package (Lenth, 2015) at a significance level of P ≤ 0.05. See Appendix 3.8.2 for the R code. Fate of Phosphorus To investigate fate of phosphorus, precipitation, adsorption, or microbial uptake, several analyses were carried out. To investigate biological uptake of phosphorus, bioreactor samples (n=2) were prepared for DAPI (4’,6-diamidino-2-phenylindole) staining through an elutriation method similar to one used in Whitman et al. (2003): Caliber Tween 20 gelatin (1 mL) was added to 1L of phosphate-buffered saline (PBS) solution. This mixture was added to bioreactor samples in centrifuge tubes and shaken at 400 RPM for 20 min on a tabletop shaker (New Brunswick Scientific G-2, Edison, NJ). Tubes were then left to sit for 20 min, and supernatant was transferred to another centrifuge tube and centrifuged at 7000 (5860 x g) for 15 min. Supernatant was then disposed and pellet saved. Pellets were re-suspended and pipetted onto a labeled well place. Ethanol was placed on top of wells, and slide was allowed to dry. Fluorescent stain DAPI (4’,6-diamidino-2-phenylindole) was added to each well, and placed in a hybridization chamber made of a Falcon tube and Kimwipe wetted with distilled water. The hybridization chamber was placed under a box to keep it dark and left there for 30 min. Slide was then dunked in a tube of DI water 10 times using a tweezers. Slide was brusquely shaken to remove excess water per method instructions, and then allowed to dry. To prepare slide for microscopy, a cover slip was adhered to the well plate using Vectashield antifade mounting medium (Vector Laboratories, Burlingame, CA). Procedure was carried out in a room with limited light exposure. At least one well was prepared using a standard known to contain polyphosphate. Slide was then viewed under a microscope for evidence of polyphosphate, and photographs were taken.
3.4 Results
Nitrogen Two important aspects of the work were finding materials or combinations of materials that have the capability to remove nitrate at much shorter hydraulic residence times (HRT) compared to conventional woodchip bioreactors and that provide significant removal at cool springtime temperatures. Of six material combinations tested – CC, CC+MC, CC+MC+MBC, WC+BC, and WC+A – WC+A performed best at warm (15°C) and cold (5°C) temperatures (Table 3.1, Fig. 3.1). Adding acetate as a readily available carbon source increased nitrate removal by significant amounts in every test at the shortest HRT, which was 1.5 hours. For comparison purposes, HRTs for conventional woodchip bioreactors typically range from 6 to 24 hours. The removal rate for WC+A at 1.5-h HRT in the re-warm run, 121 g N m-3 d-1, is the highest that we have seen in the bioreactor scientific literature (Table 3.1). Additionally, WC+A had the highest percent cumulative nitrate load removal for the tests at 15 and 5°C (Fig. 3.1), removing approximately 80 to 96% of the nitrate load. In general, the corn cob treatments outperformed the woodchip treatments, confirming earlier research (Feyereisen et al., 2016). The WC+A removal performance was remarkable and led the team to pursue a combination of materials with acetate addition for the field portion of the project, Objective 3.
Page 61 of 99

Table 3.1†: Mean (standard deviation) of nitrate removal rate (NRR) at each hydraulic residence time (HRT) during the warm, cold, and rewarm runs for the six treatments. Run Temp Treatment 1.5h HRT 8h HRT 12h HRT 24h HRT (°C) --------------------------NRR (g N m-3 d-1)------------------------- Warm 14.6 CC 24.5 (8.3) c‡ 21.4 (3.6) ab 17.4 (2.3) a 9.3 (1.3) a CC+MC 32.1 (11.2) b 22.6 (2.4) ab 17.8 (2.0) a 9.4 (1.0) a CC+MC+MBC 23.2 (10.8) c 17.6 (4.5) b 15.4 (3.1) a 9.1 (1.0) a WC 6.5 (5.6) d 5.8 (2.5) c 6.4 (2.1) b 7.3 (1.3) a WC+BC 2.5 (5.9) d 4.6 (1.3) c 4.9 (1.0) b 6.0 (1.0) a WC+A 43.0 (19.7) a 26.7 (5.4) a 19.6 (3.3) a 10.2 (1.1) a Cold 5.5 CC 10.1 (5.3) b 7.3 (1.4) b 7.4 (1.9) b 7.2 (1.7) b CC+MC 10.3 (5.7) b 6.6 (1.4) b 6.8 (1.6) b 6.9 (1.3) b CC+MC+MBC 7.0 (6.8) b 6.0 (1.2) b 6.4 (1.4) b 6.2 (1.7) b WC 2.2 (5.6) c 0.9 (1.2) c 1.5 (1.6) c 1.6 (0.6) c WC+BC -0.7 (7.5) c 1.0 (0.8) c 0.8 (1.7) c 1.0 (1.0) c WC+A 29.9 (8.8) a 29.8 (2.0) a 21.3 (1.6) a 11.8 (1.3) a Rewarm 14.9 CC 24.3 (8.3) c 22.1 (2.3) b 17.3 (1.1) a 9.8 (1.0) ab CC+MC 29.0 (5.1) b 23.3 (1.8) ab 18.1 (1.2) a 10.6 (0.9) a CC+MC+MBC 28.7 (5.7) bc 22.3 (1.9) ab 18.0 (1.4) a 10.3 (0.8) ab WC 7.1 (3.8) d 7.8 (1.6) c 7.8 (1.5) b 7.1 (0.9) ab WC+BC 4.6 (2.7) d 5.7 (0.7) c 6.0 (0.7) b 6.1 (0.8) b WC+A 120.6 (12.9) a 26.5 (2.7) a 18.4 (1.6) a 10.3 (0.8) ab † From Roser, M. 2016. Using unique carbon source combinations to increase nitrate and phosphate removal in bioreactors. M.S. thesis. Univ. of Minnesota, St. Paul. ‡ Within a column for a run, means followed by the same lowercase letter are not significantly different ( P ≤ 0.05).
Page 62 of 99
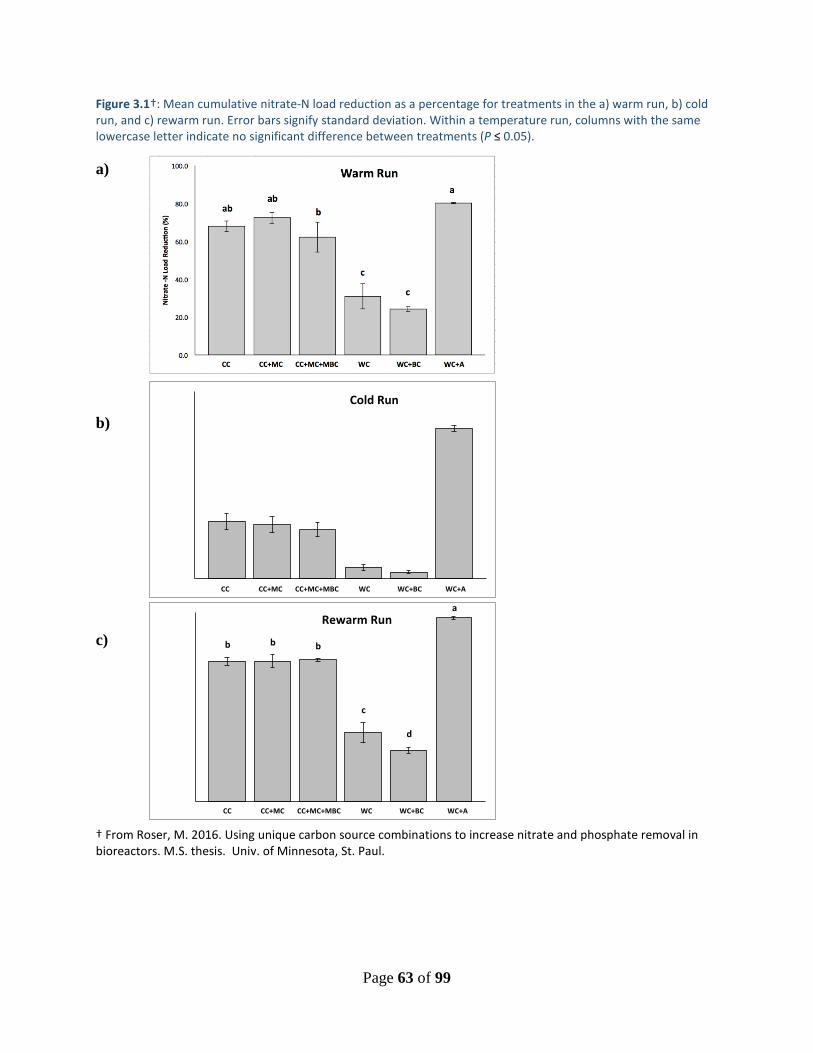
Figure 3.1†: Mean cumulative nitrate-N load reduction as a percentage for treatments in the a) warm run, b) cold run, and c) rewarm run. Error bars signify standard deviation. Within a temperature run, columns with the same lowercase letter indicate no significant difference between treatments (P ≤ 0.05). a) b) c) † From Roser, M. 2016. Using unique carbon source combinations to increase nitrate and phosphate removal in bioreactors. M.S. thesis. Univ. of Minnesota, St. Paul.
Page 63 of 99
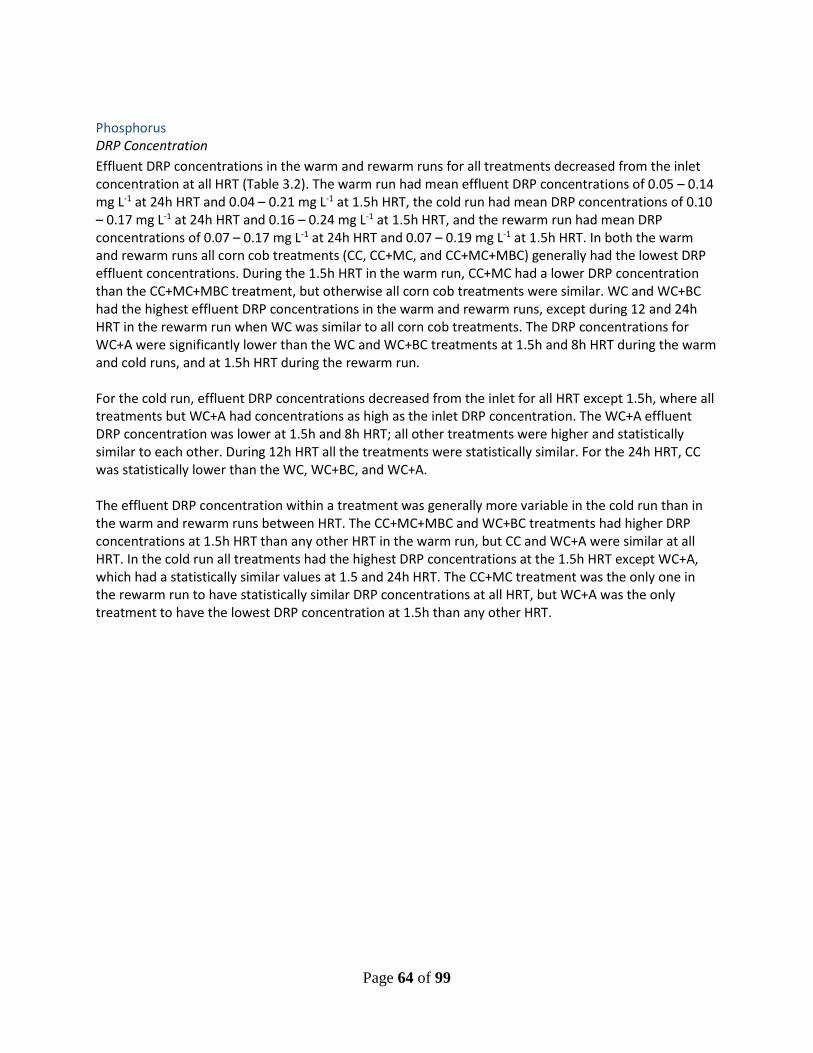
Phosphorus DRP Concentration Effluent DRP concentrations in the warm and rewarm runs for all treatments decreased from the inlet concentration at all HRT (Table 3.2). The warm run had mean effluent DRP concentrations of 0.05 – 0.14 mg L-1 at 24h HRT and 0.04 – 0.21 mg L-1 at 1.5h HRT, the cold run had mean DRP concentrations of 0.10 – 0.17 mg L-1 at 24h HRT and 0.16 – 0.24 mg L-1 at 1.5h HRT, and the rewarm run had mean DRP concentrations of 0.07 – 0.17 mg L-1 at 24h HRT and 0.07 – 0.19 mg L-1 at 1.5h HRT. In both the warm and rewarm runs all corn cob treatments (CC, CC+MC, and CC+MC+MBC) generally had the lowest DRP effluent concentrations. During the 1.5h HRT in the warm run, CC+MC had a lower DRP concentration than the CC+MC+MBC treatment, but otherwise all corn cob treatments were similar. WC and WC+BC had the highest effluent DRP concentrations in the warm and rewarm runs, except during 12 and 24h HRT in the rewarm run when WC was similar to all corn cob treatments. The DRP concentrations for WC+A were significantly lower than the WC and WC+BC treatments at 1.5h and 8h HRT during the warm and cold runs, and at 1.5h HRT during the rewarm run. For the cold run, effluent DRP concentrations decreased from the inlet for all HRT except 1.5h, where all treatments but WC+A had concentrations as high as the inlet DRP concentration. The WC+A effluent DRP concentration was lower at 1.5h and 8h HRT; all other treatments were higher and statistically similar to each other. During 12h HRT all the treatments were statistically similar. For the 24h HRT, CC was statistically lower than the WC, WC+BC, and WC+A. The effluent DRP concentration within a treatment was generally more variable in the cold run than in the warm and rewarm runs between HRT. The CC+MC+MBC and WC+BC treatments had higher DRP concentrations at 1.5h HRT than any other HRT in the warm run, but CC and WC+A were similar at all HRT. In the cold run all treatments had the highest DRP concentrations at the 1.5h HRT except WC+A, which had a statistically similar values at 1.5 and 24h HRT. The CC+MC treatment was the only one in the rewarm run to have statistically similar DRP concentrations at all HRT, but WC+A was the only treatment to have the lowest DRP concentration at 1.5h than any other HRT.
Page 64 of 99

Table 3.2†: Mean (standard deviation) of dissolved reactive phosphorus (DRP) outlet concentrations at each hydraulic residence time (HRT) during the warm, cold, and rewarm runs for the six treatments. Target inlet DRP concentration was 0.3 mg P L-1. Measured mean concentration was 0.23 ± 0.05 mg P L-1.
Run Temp Treatment 1.5h HRT 8h HRT 12h HRT 24h HRT (°C) ---------------------DRP outlet concentration (mg L-1)---------------- Warm 14.6 CC 0.06(0.05) bc‡A§ 0.05 (0.04) cA 0.04 (0.03) bA 0.06 (0.04) bA CC+MC 0.04 (0.03) cAB 0.03 (0.02) cAB 0.03 (0.01) bB 0.05 (0.04) bA CC+MC+MBC 0.09 (0.06) bA 0.07 (0.06) cbB 0.04 (0.04) bB 0.05 (0.04) bB WC 0.17 (0.04) aA 0.16 (0.03) aA 0.15 (0.05) aA 0.11 (0.04) aB WC+BC 0.21 (0.05) aA 0.16 (0.05) aB 0.16 (0.05) aB 0.14 (0.05) aB WC+A 0.10 (0.03) bA 0.11 (0.05) bA 0.12 (0.05) aA 0.13 (0.05) aA Cold 5.5 CC 0.22 (0.07) aA 0.19 (0.04) aB 0.14 (0.04) aC 0.10 (0.04) bD CC+MC 0.23 (0.06) aA 0.17 (0.04) aB 0.15 (0.04) aB 0.11(0.03) abC CC+MC+MBC 0.24 (0.06) aA 0.19 (0.05) aB 0.16(0.05)aBC 0.14(0.04) abC WC 0.23 (0.07) aA 0.18 (0.05) aB 0.15 (0.04) aB 0.16 (0.04) aB WC+BC 0.23 (0.07) aA 0.18 (0.05) aB 0.15 (0.05) aC 0.16(0.05)aBC WC+A 0.16 (0.06) bA 0.10 (0.05) bB 0.12 (0.05) aB 0.17 (0.05) aA Rewarm 14.9 CC 0.11 (0.06) abA 0.06 (0.03) bcB 0.07(0.05)bAB 0.07(0.05)bAB CC+MC 0.09 (0.05) abA 0.05 (0.03) cA 0.05 (0.04) bA 0.08 (0.07) bA CC+MC+MBC 0.14 (0.10) abA 0.06 (0.05) bcB 0.05 (0.03) bB 0.10(0.10) abA WC 0.18 (0.06) aA 0.15 (0.04) aAB 0.13(0.03)abAB 0.12 (0.04)abB WC+BC 0.19 (0.06) aA 0.16 (0.04) aAB 0.18 (0.03) aA 0.14 (0.06)abB WC+A 0.07 (0.04) bB 0.13 (0.04) abA 0.14 (0.04)abA 0.17 (0.06) aA
† From Roser, M. 2016. Using unique carbon source combinations to increase nitrate and phosphate removal in bioreactors. M.S. thesis. Univ. of Minnesota, St. Paul. ‡ Within a column for a temperature run, means followed by the same lowercase letter are not significantly different (P ≤ 0.05). § Within a row for a treatment, means followed by the same uppercase letter are not significantly different (P ≤ 0.05). DRP concentration reduction The DRP concentration reduction as a percentage for all treatments in the warm run was 35.9 – 76.3% at 24h HRT and 0.1 – 78.9% at 1.5h HRT, in the cold run 24.5 – 55.8% at 24h HRT and 2.0 – 36.5% at 1.5h HRT, and in the rewarm run 29.1 – 71.0% at 24h HRT and 17.9 – 67.8% at 1.5h HRT (Table 3.3). In the warm run, all corn cob treatments had the highest DRP concentration reduction for all HRT, except that at 1.5h HRT CC+MC was higher than CC+MC+MBC. All wood chip treatments (WC, WC+BC, and WC+A) were statistically similar to each other at 12h and 24h HRT, but at 1.5h and 8h HRT WC+A concentration reduction values were higher than WC+BC and WC. In the cold run, WC+A had the highest DRP concentration reduction under 1.5h and 8h conditions and all other treatments were lower and statistically similar. CC and CC+MC treatments had the highest reduction under 24h conditions and all wood chip treatments were lower and similar. In the rewarm run, the treatments with the highest DRP concentration reduction during the 1.5h HRT were CC, CC+MC and WC+A. At all other HRT, WC+A was lower than CC and CC+MC treatments and all corn cob treatments had higher concentration reduction for 8h, 12h, and 24h HRT. WC and WC+BC had the lowest DRP concentration reduction at 1.5h but were similar to WC+A for all other HRT.
Page 65 of 99
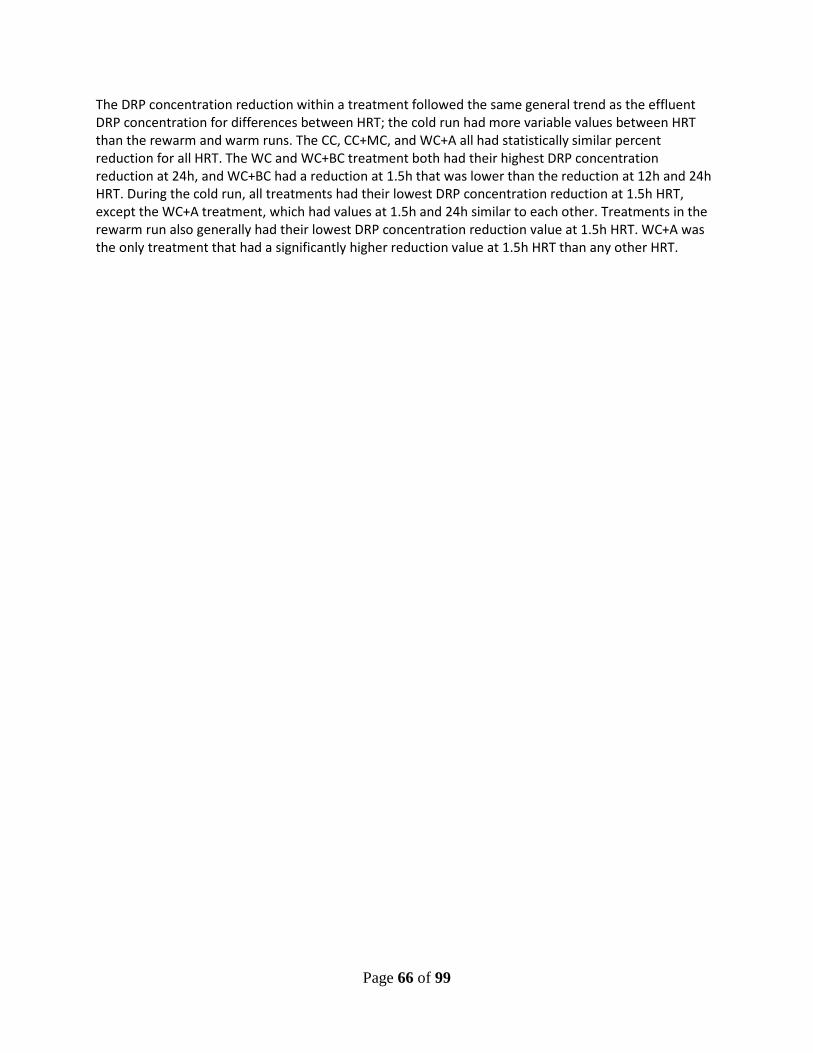
The DRP concentration reduction within a treatment followed the same general trend as the effluent DRP concentration for differences between HRT; the cold run had more variable values between HRT than the rewarm and warm runs. The CC, CC+MC, and WC+A all had statistically similar percent reduction for all HRT. The WC and WC+BC treatment both had their highest DRP concentration reduction at 24h, and WC+BC had a reduction at 1.5h that was lower than the reduction at 12h and 24h HRT. During the cold run, all treatments had their lowest DRP concentration reduction at 1.5h HRT, except the WC+A treatment, which had values at 1.5h and 24h similar to each other. Treatments in the rewarm run also generally had their lowest DRP concentration reduction value at 1.5h HRT. WC+A was the only treatment that had a significantly higher reduction value at 1.5h HRT than any other HRT.
Page 66 of 99

Table 3.3†: Mean (standard deviation) of dissolved reactive phosphorus (DRP) concentration reduction as a percentage at all hydraulic residence times (HRT) during the warm, cold, and rewarm runs for the six treatments.
† From Roser, M. 2016. Using unique carbon source combinations to increase nitrate and phosphate removal in bioreactors. M.S. thesis. Univ. of Minnesota, St. Paul. ‡ Within a column for a temperature run, means followed by the same lowercase letter are not significantly different (P ≤ 0.05). § Within a row for a treatment, means followed by the same uppercase letter are not significantly different (P ≤ 0.05).
Run Temp Treatment 1.5h HRT 8h HRT 12h HRT 24h HRT (°C) ------------------------DRP concentration reduction (%)------------------------ Warm 14.6 CC 72.4 (19.0) ab‡A§ 75.6 (15.0) aA 80.3 (11.7)aA 72.5 (15.5)aA CC+MC 78.9 (12.9) aA 84.5 (9.0) aA 85.1(7.5)aA 76.3(17.0) aA CC+MC+MBC 57.9 (22.1) bcB 64.7(30.9)aAB 77.0(16.8)aA 75.5 (16.4) aA WC 15.8 (23.5) dB 15.9 (20.1) cB 20.7 (24.4)bB 51.6 (17.1) bA WC+BC 0.1 (27.4) dC 12.7(25.6)cBC 18.3 (25.4)bB 35.9(22.2)bA WC+A 48.6 (18.3) cA 40.2 (30.3) bA 36.4 (25.4)bA 41.1 (22.2) bA Cold 5.5 CC 12.2 (21.9) bD 25.1 (14.3) bC 40.8(16.7)abB 55.8 (14.7) aA CC+MC 6.9 (18.2) bC 30.2 (13.3) bB 39.8(15.4)abAB 50.0 (10.9)aA CC+MC+MBC 2.0 (20.5) bC 24.7 (20.0) bB 33.1 (20.3)bAB 39.5 (15.1)abA WC 8.0 (19.5) bB 28.9 (20.0) bA 37.5(24.2)abA 31.0 (14.3) bA WC+BC 17.8 (23.3) bC 38.9 (20.0) bB 41.3(19.5)abA 29.8(25.6)bAB WC+A 36.5 (20.2) aB 60.2 (16.2) aA 53.2 (18.1)aA 24.5 (20.8) bB Rewarm 14.9 CC 56.8 (25.3) aB 75.0 (15.4)abA 73.0(18.6)abAB 71.0(16.3)aAB CC+MC 61.3 (19.8) aB 78.8 (10.8) aA 78.9 (14.3)aA 66.0(26.5)aAB CC+MC+MBC 41.7 (37.4) abB 77.3 (20.1)abA 80.7 (12.7)aA 58.9 (34.4) aB WC 25.2 (24.1) bB 41.1 (18.2) cA 48.3(16.9)bcA 51.6 (14.1)abA WC+BC 17.9 (26.8) bB 38.4 (17.0) cA 31.5(13.6)cAB 43.1 (22.0)abA WC+A 67.8 (17.4) aA 48.8 (17.0)bcB 45.1(14.7)bcB 29.1 (24.0) bC
Page 67 of 99
Cumulative DRP Load Reduction Cumulative DRP load reduction for all treatments was 17.8 – 81.3 % in the warm run, 24.4 – 45.1 % in the cold run, and 34.0 – 72.5 % in the rewarm run (Figure 3.2). CC, CC+MC, and CC+MC+MBC had the highest cumulative load reduction in the warm run, with WC+A being the second highest and WC and WC+BC being the lowest. In the cold run, WC+A had the highest load reduction and all other treatments were statistically similar. The rewarm run was similar to the warm run, except that CC and CC+MC+MBC were statistically similar to WC, WC+BC, and WC+A; CC and CC+MC+MBC were elevated compared to other treatments but not statistically different because of high standard deviation seen in CC+MC+MBC and WC+A treatments. Polyphosphate Evidence of polyphosphate being stored inside microorganisms was observed in all treatment and control samples. Examples of microscopy from CC+MC and WC+A samples after the cold run are given in Figure 3.3. No quantification was done to determine number of cells that had evidence of polyphosphate accumulation versus number of cells that did not.
Page 68 of 99
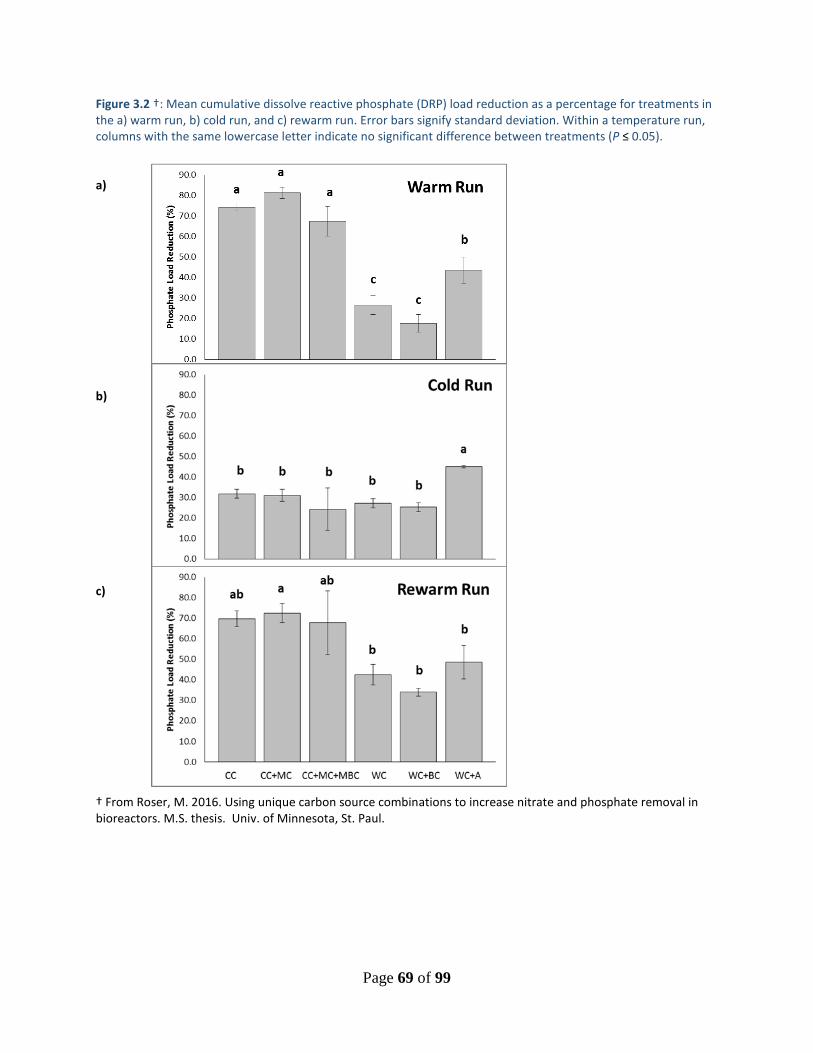
Figure 3.2 †: Mean cumulative dissolve reactive phosphate (DRP) load reduction as a percentage for treatments in the a) warm run, b) cold run, and c) rewarm run. Error bars signify standard deviation. Within a temperature run, columns with the same lowercase letter indicate no significant difference between treatments (P ≤ 0.05). a) b) c) † From Roser, M. 2016. Using unique carbon source combinations to increase nitrate and phosphate removal in bioreactors. M.S. thesis. Univ. of Minnesota, St. Paul.
Page 69 of 99
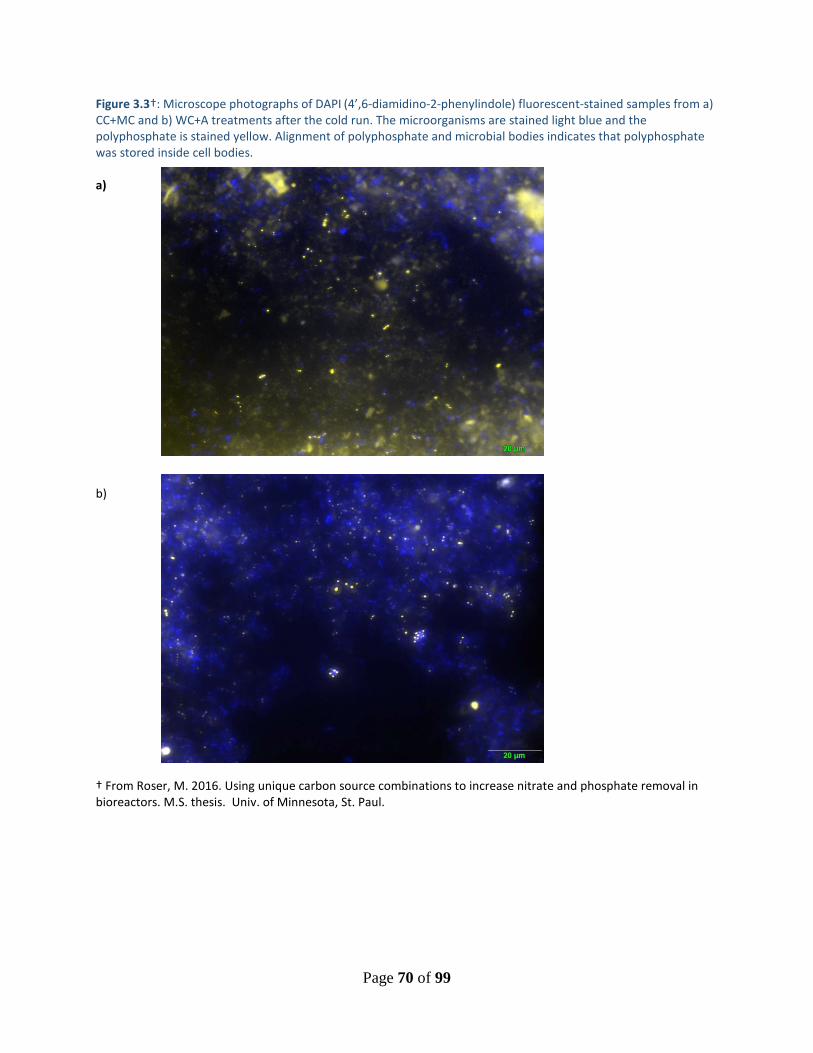
Figure 3.3†: Microscope photographs of DAPI (4’,6-diamidino-2-phenylindole) fluorescent-stained samples from a) CC+MC and b) WC+A treatments after the cold run. The microorganisms are stained light blue and the polyphosphate is stained yellow. Alignment of polyphosphate and microbial bodies indicates that polyphosphate was stored inside cell bodies. a) b) † From Roser, M. 2016. Using unique carbon source combinations to increase nitrate and phosphate removal in bioreactors. M.S. thesis. Univ. of Minnesota, St. Paul.
Page 70 of 99
3.5 Discussion
Nitrate Removal Performance The data support our hypothesis that additions of sodium acetate to woodchips increases NRR compared to wood chips alone; NRR for the WC+A treatment was higher than for the WC treatment in all HRT in the cold run, and for 1.5h, 8h, and 12h HRT in the warm and rewarm runs. The highest mean NRR was 120.6 ± 12.9 g N m-3 d-1 at 1.5h HRT during the rewarm run, and to our knowledge this is higher than any existing study. Fewer differences between treatments were seen at 24h HRT, with lower NRR being observed for WC+A, but this could be due to nitrate limiting conditions. Nitrate-N concentrations less than 1 mg N L-1 in effluent can limit NRR (Elgood et al., 2010), which occurred in this experiment. One reason could be the initial concentration in this experiment was 20 mg N L-1 versus the 50 mg N L-1 that has been used in other laboratory column experiments (Greenan et al., 2009; Feyereisen et al., 2016). The addition of biochar to a wood chip bioreactor did not increase NRR. During all HRT and temperature runs, there were no significant differences between WC and WC+BC NRR. This is in direct contradiction to what has been found by other researchers. Bock et al. (2014) found that a bioreactor with a mixture of hardwood biochar and wood chips exhibited nitrate-N reductions of 86% after 18h versus a wood chip-only bioreactor with a reduction of only 13%. When added to soil, biochar has been found to have nitrate-N reductions of 79-97% (Beck et al., 2011). Our column study only showed nitrate-N load reductions of 4-27% in the WC+BC treatment, and in fact it was the worst performing treatment in this regard. With a negative average NRR at 1.5h HRT in the warm run, the WC+BC may have even desorbed or leached nitrate-N. It is unclear why biochar has performed so differently in other laboratory experiments. Our hardwood biochar pieces were larger than that in Bock et al. (2014), but they found that particle size did not cause significant differences in NRR, so the size of the biochar should not have affected the WC+BC performance. The WC treatment exhibited NRR values of 5.8 – 7.3 g N m-3 d-1 in the warm run, 0.9 – 2.2 g N m-3 d-1 in the cold run, and 7.1 – 7.8 g N m-3 d-1 in the rewarm run. The ranges for all runs fall within reported removal rates for both field and laboratory-scale experiments for wood chip medium at variable temperatures (Feyereisen et al., 2016; Christianson et al., 2012a; Schipper et al. 2010). As for the corn cob treatments, our hypothesis that that amine-modified coconut coir would improve NRR of a corn cob bioreactor is partially supported. Under 1.5h HRT conditions in both warm and rewarm runs, the CC+MC treatment had a significantly higher NRR than the CC treatment. It could be that the anion exchange capacity in the amine-modified coconut coir sorbed nitrate-N at this high flow rate in comparison, or that the coconut coir itself generated more surface area for microbes to create biofilms and uptake nutrients. CC+MC did not have a higher NRR than CC in the cold run, however, so this treatment seems to be temperature dependent. Amine-modified macadamia biochar, on the other hand, did not improve corn cob NRR performance. There were no significant differences between NRR for CC+MC+MBC and CC treatments at any HRT during any temperature run. As for the differences between CC+MC+MC and CC+MC treatments, CC+MC had a higher NRR at 1.5h HRT in the warm run but were otherwise similar in performance. The CC treatment NRR ranged from 9.3 to 24.5 g N m-3 d-1 in the warm run, 7.2 to 10.1 g N m-3 d-1 in the cold run, and 9.8 to 24.3 g N m-3 d-1 in the rewarm run for the 1.5 to 24h HRT. This range is similar to results from other corn cob bioreactor column experiments. Cameron and Schipper (2010) found mean NRR of 34.6 and 19.8 g N m-3 d-1 in 1 – 10 and 10 – 23 month experiments, respectively, at 14°C with a
Page 71 of 99

HRT of 44h. Feyereisen et al. (2016) had mean NRR of 34.9 g N m-3 d-1 in a 15°C experiment and 7.4 g N m-3 d-1 in a 1.5°C experiment with a HRT of 12h. The CC treatment NRR in this experiment falls at the lower end of other observed corn cob NRR, but both of these other experiments used higher nitrate-N concentrations (159 mg L-1, Cameron and Schipper, 2010; 50 mg L-1, Feyereisen et al., 2016), and it is possible that the lower initial nitrate-N concentration in our study influenced NRRs (Elgood et al., 2010). Nitrate-N load reduction data exhibits a similar pattern to NRR data; WC+A performed better than WC. In fact, in the cold and rewarm runs the WC+A outperformed all other treatments with load reduction means of 80.0% and 96.8%, respectively. The nitrate-N load reduction data also mirrors the NRR data in that the biochar additions to both corn cobs and wood chips did not improve bioreactor performance. In the rewarm run, WC+BC actually had a lower load reduction than WC; the WC+BC treatment had a 27% nitrate-N load reduction while the WC treatment had almost 40%. Factors Influencing Denitrification Treatments that had high NRR generally had ORP ranges that fell within the range for denitrification. The ORP range that promotes denitrification in wastewater is -50 to +50 mV (Gerardi, 2007). All treatments in the warm and rewarm runs were generally in this range except for WC and WC+BC, which corresponds with high NRR in corn cob and WC+A treatments versus low NRR in the WC and WC+BC treatments. In the cold run, the only treatment for which ORP readings were in this range for all flow rates was WC+A. In fact, it is the only treatment with negative ORP values in the cold run, which lines up with its comparatively high NRR during the cold run. Dissolved oxygen values indicated that all treatments contained a suitable oxygen environment for denitrification. In both the warm and rewarm runs, DO values for all treatments were <1.0 mg O2 L-1, which indicates conditions appropriate for denitrification (Elgood et al., 2010). During the cold run, DO values were higher for all treatments (2.0 – 2.6 mg O2 L-1) except the WC+A treatment had values <1.0 mg O2 L-1. This corresponds with WC+A having NRR significantly higher than all other treatments in the cold run. Treatments with higher NRR and nitrate load reduction had higher TC and TOC production loads. In the warm run, the corn cob treatments and WC+A had the highest TC and TOC values, while WC and WC+BC had significantly lower values. During the cold run, both TC and TOC were significantly higher in the WC+A treatment when compared to all other treatments. This could explain why this treatment had such high NRR and nitrate-N load reduction in the cold run; if the denitrifying bacteria were able to get access to carbon, they could potentially be able to continue denitrification in colder temperatures. The fact that the other treatments had such low TC and TOC values in the cold run could indicate that they were carbon limited compared to the WC+A treatment, and organic carbon is necessary for the conversion of nitrate-N to di-nitrogen gas (Elgood et al, 2010). Warneke et al. (2011b) and Feyereisen et al. (2016)) both found that differences between treatments in nitrate-N removal could be linked to carbon bioavailability. Both warm and cold runs had higher TIC in treatments that had higher NRR; corn cob treatments and WC+A treatment have the highest TIC in the warm run, and WC+A has the highest in the cold run. TIC can be an indirect measure of microbial respiration of CO2 during the denitrification process (Elgood et al., 2010). WC+A is the only treatment to have a significantly similar TIC value in both the warm and cold run, which could indicate that denitrification was occurring at similar efficiencies.
Page 72 of 99

Potential for Adverse Effects Acetate addition to the wood chip bioreactor improved nitrate-N removal to the point that caution needs to be taken to ensure that complete nitrate-N removal conditions would not persist in the bioreactor. Nitrate-N concentrations dropping below 0.5 to 1 mg L-1 nitrate-N can result in adverse side effects including emission of methane and methylation of mercury (Robertson and Merkley, 2008). If most of the nitrate-N is converted to di-nitrogen and the bioreactor remains anaerobic, then microorganisms will instead use sulfate and then carbon dioxide as electron acceptors, producing hydrogen sulfide and methane (Healy et al., 2012; Warneke et al. 2011a). Sulfate-reducing conditions can indicate potential for methylation of mercury in a bioreactor. Hydrogen sulfide and methane production occur at ORP values of -50 to -250mV and -175 to -400mV, respectively (Gerardi, 2007). We measured ORP values for WC+A that fell within this range. However, field studies of bioreactors have found relatively low levels of methyl mercury (Natarajan, 2015) and methane (Warneke et al., 2011a). Since we did not sample dissolved gases or methyl mercury concentrations in our laboratory column experiment we do not know if this would be an area of concern for the WC+A treatment, but when this treatment moves to a field-scale study it should be monitored for pollutants and greenhouse gas emissions. Another potential concern about the WC+A treatment would be the introduction of soluble carbon into the aquatic environment of nearby streams. If TOC production load is examined at 1.5h and 24h HRT during the warm and rewarm runs for the WC+A treatment, the load is much higher during 24h than during 1.5h HRT. To prevent harm to ecosystems in waterways, sodium acetate could be pumped in at a lower concentration during low flow events to prevent dumping excess carbon into waterways. Dissolved reactive phosphate data The data support our hypothesis that DRP concentration reduction for wood chips could be improved by the addition of sodium acetate. During the warm and rewarm runs the WC+A treatment removed over twice as much DRP as the WC treatment at the 1.5h HRT, and during the cold run the WC+A had higher reductions than WC at 1.5, 8, and 12h HRT. Cumulative DRP load reduction for WC+A was greater than WC in both the warm and cold runs, but WC+A and WC values were statistically similar in the rewarm run. This could be due to the fact that the WC treatment had greater DRP load reduction in the rewarm run, or that WC+A had a high standard deviation for DRP load reduction. However, the biochar addition to the wood chips did not improve DRP concentration reduction performance when compared to the wood chip only bioreactor. No differences were revealed between WC and WC+BC treatments in cumulative DRP load reduction either. The addition of amine modified coconut coir and biochar did not improve the DRP concentration reduction in corn cob bioreactors. For the corn cob treatments, CC+MC concentration reduction was statistically similar to that of CC at all HRT in all temperature treatments. The same is true for CC+MC+MBC except in the warm run when the DRP concentration reduction at 1.5h HRT was statistically lower than the CC+MC treatment. At 1.5h HRT in the rewarm run, the CC+MC+MBC and CC treatments were similar. This could be due to the concentration reduction data from CC+MC+MBC having a high standard deviation (Table 3.3). The cumulative DRP load reduction data showed a similar trend; the CC+MC and CC+MC+MBC treatments were statistically similar to the CC treatment values. It could be that there was not enough modified material added to the corn cobs to increase anion exchange capacity appreciably, and this is why there was no observed increase relative to the other materials. Baes et al. (1997) found that anion
Page 73 of 99

contaminants could be mitigated using amine modified coconut coir, but they used coconut coir dust, which would not work well in a high-flow, high-volume drainage ditch scenario. The biochar media used in our experiment performed differently than other biochar materials used in other bioreactor experiments. Bock et al. (2014) found 65% phosphorus removal from hardwood biochar at 18h HRT, and Zhang (2015) reported an average of 80% phosphorus reduction at 24h HRT. Beck et al. (2011) found that soil amended with biochar had a 42% reduction of total phosphorus. The highest mean DRP concentration reduction seen in the WC+BC treatment was 43% at 24h HRT in the rewarm run, and cumulative DRP load reduction means were 17.8%, 25.4% and 34.0% in the warm, cold, and rewarm runs, respectively. The corn cob treatments and WC+A had the highest DRP concentration reduction and cumulative load reduction values among treatments. In the warm run CC, CC+MC, and CC+MC+MBC all had higher load reductions than any wood chip treatment. In the rewarm run, CC+MC was the only corn cob treatment that had a higher load reduction than the wood chip treatments. WC+A had the highest load reduction of all treatments in the cold run. Both corn cob treatments and WC+A would potentially work well at removing DRP in a drainage ditch denitrifying bioreactor, but corn cob treatments have higher DRP load reduction than WC+A in the warm and rewarm runs so could be the better option. However, greater phosphorus loading of water bodies occurs under high flow and cold temperatures (Macrae et al., 2007) and WC+A had the highest DRP load reduction during the cold run and was the only treatment to have a higher DRP concentration reduction at 1.5h HRT than any other HRT. Our laboratory experiment wasn’t able to perfectly mimic field conditions; we did not increase DRP concentrations with lower HRT. However, these results suggest that WC+A would be the ideal candidate for testing in a drainage ditch setting. Mechanism for phosphate-P removal The DAPI and EDS results indicate that a major mechanism of phosphate-P removal in these laboratory columns could be microbial uptake via denitrifying phosphorus-accumulating organisms PAOs. There is evidence from the DAPI staining of polyphosphate storage in microbial bodies in all treatments, and the EDS point analysis found no phosphorus on the materials. Microbial uptake as the mechanism is supported by the nitrogen results presented in Chapter 1: WC+A had both the highest cumulative nitrate-N and DRP load reduction in the cold run, and corn cob treatments had comparable load reduction percentages for both nitrate-N and DRP. Also, the fact that the DRP load reduction values for the WC and WC+BC treatments were lower for corn cob treatments in the warm run and CC+MC in the rewarm run could point to the presence of denitrifying PAOs. Wood chip bioreactors have a smaller abundance of denitrifying microorganisms and lower rates of nitrate removal when compared to corn cob bioreactors at 15.5°C and 1.5°C (Feyereisen et al., 2016). Other systems with PAOs are usually exposed to alternating anaerobic and aerobic conditions (Kuba et al., 1993; Kerrn-Jespersen et al., 1994; Soejima et al., 2006), while our bioreactors operated continuously in an anaerobic state during the temperature runs. Further microbial studies should be done to look at community structure and confirm presence of PAOs. Also, if the mechanism for phosphorus removal is in fact microbial uptake, it is unknown what will happen to this stored polyphosphate if the bioreactors should freeze or dry out. Further study should be done with wetting and drying cycles to determine if there is a flush in phosphorus from the bioreactors.
3.6 Conclusions
Page 74 of 99

The addition of biochar to wood chips did not improve the NRR of wood chip bioreactors, and the addition of amine-modified coconut coir and biochar did not improve the overall NRR of corn cob bioreactors. A higher proportion of modified coconut coir or biochar material perhaps would be needed to increase NRR in a wood chip or corn cob bioreactor. However, the addition of sodium acetate to wood chips greatly increased the NRR of a wood chip bioreactor; the WC+A treatment had the highest NRR of any treatment at 5°C and the highest nitrate-N load reduction in all temperature runs. Sodium acetate could be used to improve denitrification in bioreactors under the cold conditions of spring drainage when bioreactors can be carbon-limited. Further research on the use of soluble carbon should be conducted in field-scale bioreactors. The data supported our hypothesis that sodium acetate additions could improve phosphorus removal in a wood chip denitrifying bioreactor. However, the addition of biochar or amine modified material at the levels used in this experiment did not improve DRP load reduction in corn cob or wood chip bioreactors. WC+A would be the best treatment option for a ditch bioreactor; the corn cob treatments had higher DRP load reduction in 15°C conditions, but WC+A had the highest DRP reduction in the 5°C conditions and high flow rates, which is when the phosphorus load of surface waters is of most concern. Microscopy and EDS point analysis indicate that the mechanism for phosphorus removal was likely microbial uptake, but further microbial work is needed to confirm this. Further research should also be done to determine if DRP is susceptible to biological release from these bioreactors.
3.7 References
Baes, A.U., T. Okuda, W. Nishijima, E. Shoto, and M. Okada. 1997. Adsorption and ion exchange of some groundwater anion contaminants in an amine modified coconut coir. Water Science and Technology 35 (7): 89–95. Beck, D.A., G.R. Johnson, and G.A. Spolek. 2011. Amending greenroof soil with biochar to affect runoff water quantity and quality. Environmental Pollution 159: 2111-2118. Bock, E., N. Smith, M. Rogers, B. Coleman, M. Reiter, B. Benham, and Z.M. Easton. 2014. Enhanced nitrate and phosphate removal in a denitrifying bioreactor with biochar. Journal of Environment Quality. 44 (2): 605-613. Cameron, S.G., and L.A. Schipper. 2010. Nitrate removal and hydraulic performance of organic carbon for use in denitrification beds. Ecological Engineering 36 (11): 1588-1595. Christianson, L.E., A. Bhandari, and M.J. Helmers. 2012a. A practice-oriented review of woodchip bioreactors for subsurface agricultural drainage. ASABE 28 (6): 861–74. Christianson, L.E., A. Bhandari, M.J. Helmers, K. Kult, T. Sutphin, and R. Wolf. 2012b. Performance evaluation of four field-scale agricultural drainage denitrification bioreactors in Iowa.” ASABE 55 (6): 2163-2174. Clesceri, L.S., A.E. Greenburg, and D.A. Eaton, editors. 1998. Standard methods for the examination of water and wastewater. 20th ed. Am. Public Health Assoc., Washington, DC. Elgood, Z., W.D. Robertson, S.L. Schiff, and R. Elgood. 2010. Nitrate removal and greenhouse gas production in a stream-bed denitrifying bioreactor. Ecological Engineering. 36 (11): 1575-1580.
Page 75 of 99

Feyereisen, G., T. Moorman, L. Christianson, R. Venterea, J. Coulter, and U. Tschirner. 2016. Performance of agricultural residue media in laboratory denitrifying biroeactors at low temperatures. Journal of Environmental Quality. 45 (3): 779 - 787. Gerardi, Michael H. 2007. ORP management in wastewater as an indicator of process efficiency. NEIWPCC. www.neiwpcc.org/iwr/reductionpotential.asp. Accessed 29 July 2015. Greenan, C.M., T.B. Moorman, T.B. Parkin, T.C. Kaspar, and D.B. Jaynes. 2009. Denitrification in wood chip bioreactors at different water flows. Journal of Environmental Quality. 38 (4): 1664-1671. Healy, M.G., T.G. Ibrahim, G.J. Lanigan, A.J. Serrenho, and O. Fenton. 2012. Nitrate removal rate, efficiency and pollution swapping potential of different organic carbon media in laboratory denitrification bioreactors. Ecological Engineering. 40: 198 - 209. Jansen, R.J.J., and H. van Bekkum. 1994. Amination and ammoxidation of activated carbons. Carbon 32 (8): 1507-1516. Kerrn-Jespersen, J.P., M. Henze, and R. Strube. 1994. Biological phosphorus release and uptake under alternating anaerobic and anoxic conditions in a fixed-film reactor. Water Resources. 28 (5): 1253-1255. Kuba, T., G. Smolders, M.C.M. van Loosdrecht, and J.J. Heijnen. 1993. Biological phosphorus removal from wastewater by anaerobic-anoxic sequencing batch reactor. Water Science and Technology. 27(5): 241-252. Lenth, R.V. 2015. Lsmeans: least-squares means. R package version 2.19. http://cran.r-project.org/package=lsmeans. Macrae, M.L., M.C. English, S.L. Schiff, and M. Stone. 2007. Intra-annual variability in the contribution of tile drains to basin discharge and phosphorus export in a first-order agricultural catchment. Agricultural Water Management. 92 (3): 171-182. Natarajan, M.A. 2015. Mercury methylation in denitrifying bioreactors: an investigation in pollution swapping. Thesis, 89 p. Pinheiro, J., D. Bates, S. DebRoy, D. Sarkar, and R Core Team. 2014. Linear and nonlinear mixed effects models. R package version 3.1-117. http://cran.r-project.org/package=nlme. Robertson, W.D., and L.C. Merkley. 2008. In-stream bioreactor for agricultural nitrate treatment. Journal of Environmental Quality 38 (1): 230-237. Roser, M. 2016. Using unique carbon source combinations to increase nitrate and phosphate removal in bioreactors. M.S. thesis. University of Minnesota, St. Paul. Schipper, L.A., W.D. Robertson, A.J. Gold, D.B. Jaynes, and S.C. Cameron. 2010. Denitrifying bioreactors - an approach for reducing nitrate loads to receiving waters. Ecological Engineering 36 (11): 1532-1543.
Page 76 of 99
Soejima, K., K. Oki, A. Terada, S. Tsuneda, and A. Hirata. 2006. Effects of acetate and nitrite addition on fraction of denitrifying phosphate-accumulating organisms and nutrient removal efficiency in anaerobic/aerobic/anoxic process. Bioprocess and Biosystems Engineering. 29: 305-313. Warneke, S., L.A. Schipper, D.A. Bruesewitz, I. McDonald, and S. Cameron. 2011a. Rates, controls and potential adverse effects of nitrate removal in a denitrification bed. Ecological Engineering 37 (3): 511-522. Warneke, S. L.A. Schipper, M.G. Matiasek, K.M. Scow, S. Cameron, D.A. Bruesewitz, and I.R. McDonald. 2011b. Nitrate removal, communities of denitrifiers and adverse effects in different carbon substrates for use in denitrifiation beds. Water Research. 45 (17): 5463-5475. Whitman, R.L., D.A. Shively, H. Pawlik, M.B. Nevers, and M.N. Byappanahalli. 2003. Occurrence of Escherichia coli and Enterococci in Cladophora (Chlorophyta) in nearshore water and beach sand of Lake Michigan. Applied and Environmental Microbiology. 69 (8): 4714-4719. Zhang, L. 2015. Exploring N and P reduction in bioreactors. M.S. thesis. University of Minnesota, St. Paul.
Page 77 of 99

3.8 Chapter 3 Appendices
Appendix 3.8.1 Abstract from Marta Roser’s M.S. Thesis, “Using unique carbon source combinations to increase nitrate and phosphate removal in bioreactors.” Marta’s work was supported by this grant proposal and addressed Objective 2. Nitrogen (N) and phosphorus (P) losses from croplands contribute to impairment of water bodies. This study was conducted to test candidate denitrifying bioreactor media for nitrate-N and dissolved reactive P (DRP) removal from agricultural effluent in drainage ditches. The nitrate-N and DRP removal performance of carbon materials widely available in the Midwest, woodchips (WC) and corn cobs (CC), were compared to treatments of mixed materials: woodchips and hardwood biochar (WC+BC), woodchips and sodium acetate (WC+A), corn cobs and modified coconut coir (CC+MC), and corn cobs, modified coconut coir, and modified macadamia biochar (CC+MC+MBC). Water with a nitrate-N concentration of 20 mg N L-1 and a DRP concentration of 0.3 mg P L-1 was pumped through PVC columns packed with treatment media. The flow rate was adjusted to match the rise and decay of a typical drainage hydrograph. Effluent was sampled after hydraulic residence times (HRT) of 1.5, 8, 12, and 24 h. The laboratory experiment was conducted at 15°C for 14 weeks, 5°C for 13 weeks, and 15°C again for 7 weeks in a temperature controlled chamber, designated the warm run, cold run and rewarm run, respectively. Nitrate-N load reductions ranged from 24% to 96% in the warm and rewarm runs and from 4% to 80% in the cold run. Nitrate-N load reduction performance at all temperatures was in the order of: WC+A > CC+MC > CC > CC+MC+MBC > WC > WC+BC. The nitrate removal rate (NRR) was highest at the 1.5h HRT for the WC+A treatment at all temperatures. Cumulative DRP load reductions in the warm and rewarm runs were statistically higher in the CC, CC+MC, and CC+MC+MBC treatments, with DRP load reductions of 74%, 81%, and 67%, respectively. The WC+A treatment had the highest DRP load reduction in the cold run, with a 45% reduction. The CC, CC+MC, and CC+MC+MBC treatments had both high NRR and high DRP percent concentration removal in the warm and rewarm runs, but the WC+A treatment had higher removal of both nutrients in the cold run and specifically at lower HRTs. For both nitrate-N and DRP load reductions during high flows and cold temperatures, WC+A would be the recommended treatment. Future work should focus on the addition of carbon such as sodium acetate to enhance bioreactor performance during high drainage and cold temperature conditions. Roser, M. 2016. Using unique carbon source combinations to increase nitrate and phosphate removal in bioreactors. M.S. thesis. Univ. of Minnesota, St. Paul. Appendix 3.8.2 R Code from Marta Roser’s M.S. Thesis, “Using unique carbon source combinations to increase nitrate and phosphate removal in bioreactors.” ###R code is from Felipe in Statistics Help Center and Dr. Jessica Gutknecht #Import data to R Studio #Set up R library
Page 78 of 99

library(nlme) library(ape) library (car) library(multcomp) library(effects) library(lsmeans) #Make sure certain items are factors: HRT_pred (predicted HRT), Treatment, Cycle, and ColNo (column number). Marta_rewarm$HRT_pred <- factor(Marta_rewarm$HRT_pred) Marta_rewarm$Treatment <- factor (Marta_rewarm$Treatment) Marta_rewarm$Cycle <- factor(Marta_rewarm$Cycle) Marta_rewarm$ColNo <- factor(Marta_rewarm$ColNo) ######Linear mixed-effects model: nitrate concentration (NO3_Conc) example ##Cycle is nested within columns as random factors, also with a correlation matrix for the repeated measures covariation NO3lmeW <-lme(fixed = NO3_Conc ~ Treatment*HRT_pred,random = ~1|ColNo/Cycle, correlation=corAR1(),na.action = "na.omit", data=Marta_rewarmrun, method="ML") ##One concern is the correlation argument within the lme (linear mixed-effects model) because of non-sequential weeks. The above model is using the correlation structure class “corAR1”, which is autoregressive process of order 1 ##Can run model with and without correlation and compare the fit of both models NO3lmeW2 <-lme(fixed = NO3_Conc ~ Treatment*HRT_pred,random = ~1|ColNo/Cycle, na.action = "na.omit", data=Marta_rewarmrun, method = "ML") anova(NO3lmeW, NO3lmeW2) Model df AIC BIC logLik Test L.Ratio p-value NO3lmeAR 1 28 2054.695 2176.568 -999.3473 NO3lmeAR2 2 27 2074.247 2191.768 -1010.1233 1 vs 2 21.55198 <.0001 #Want to choose the model with the lowest AIC and/or BIC – in this case the correlation argument does not matter summary(NO3lmeW) Anova(NO3lmeW) ##Tukey multiple comparisons using the lsmeans package W1 <- lsmeans(NO3lmeW, ~ Treatment | HRT_pred)
Page 79 of 99

summary(W1) pairs(W1) W2 <- lsmeans(NO3lmeW, ~ HRT_pred | Treatment) summary(W2) pairs(W2)
Page 80 of 99

Chapter 4
Novel design and field performance of phosphorus sorbing and denitrifying bioreactors
4.1 Introduction
While laboratory-scale experiments provide opportunity for relative comparison of the NO3− removal
potential and hydraulic performance of different P sorbing and dentrifying substrates, these studies may not be a reliable indication of removal rates or hydraulic performance achievable in larger-scale field installations. This is due in part to the effect of dissolved O2 (DO) content of the influent water on removal rates in small scale trials. Laboratory trials tend to be of short duration, typically less than 6 months and NO3
− removal rates tend to decline with time as labile carbon is reduced. The results of short-term experiments may not be reliable for assessing longer term sustainability of removal rates. Finally, mimicking actual environmental conditions experienced in the field is nearly impossible to accomplish in the lab. Contemporary end-of-tile bioreactors consist of a water level control structure used to route water into the bioreactor. The typical bioreactor consists of a narrow (<1 m wide) trench, 1 to 1.5 m deep and 10’s of meters long. Bioreactors may be lined to prevent seepage or unlined. The bioreactors are then filled with sources of carbon which may include saw dust, wood chips or corn cobs. These bioreactors are solely designed to reduce NO3
− loading to surface water by denitrification. Treatment of agricultural tile drain water through current designs of bioreactors is mainly through horizontal flow through the bioreactor media. It is difficult to know how much of the reactive area of the bioreactor is involved when water flows horizontally as preferential flow patterns may by-pass zones within the bioreactor. The longevity and maintenance of bioreactors is not fully known because there are very few long-term bioreactors sites in existence. This is the first known bioreactor designed specifically to remove N and P from agricultural drainage water. For two-phase bioreactors designed to remove N and P there are three factors that will affect longevity – the availability of exchange sites for P sorption, the supply of carbon to denitrifying organisms, and the saturated hydraulic conductivity of the bioreactor. We designed a novel bioreactor capable of removing both N and P and also which would be accessible to easy maintenance. The prototype design consists of a reinforced tank, porous lava rock, a sheet of Brotex, a honeycomb shaped geotextile cellular containment material (EnviroGrid; Geo Products, LLC, Houston, TX), a layer of wood chips and a layer of corn cobs (Figure 4.1). These layers encompass the hydraulic filtering media and the denitrification media. Three materials were selected for the P removal media including sieved steel slag, sieved crushed recycled concrete or limestone. The concept for the bioreactor system is a modular system that can be installed in the field for drainage water treatment, removed when necessary for maintenance and replaced. Once removed from the field the N and P materials could be recycled. The system is designed for installation adjacent to individual tile outlets along a drainage ditch in order to remediate dissolved nitrogen and phosphorus. The number of modules installed at a particular location would be in part determined by the size of the outlet pipe and the desired treatment efficiency (hydraulic residence time and/or nutrient reduction).
Page 81 of 99
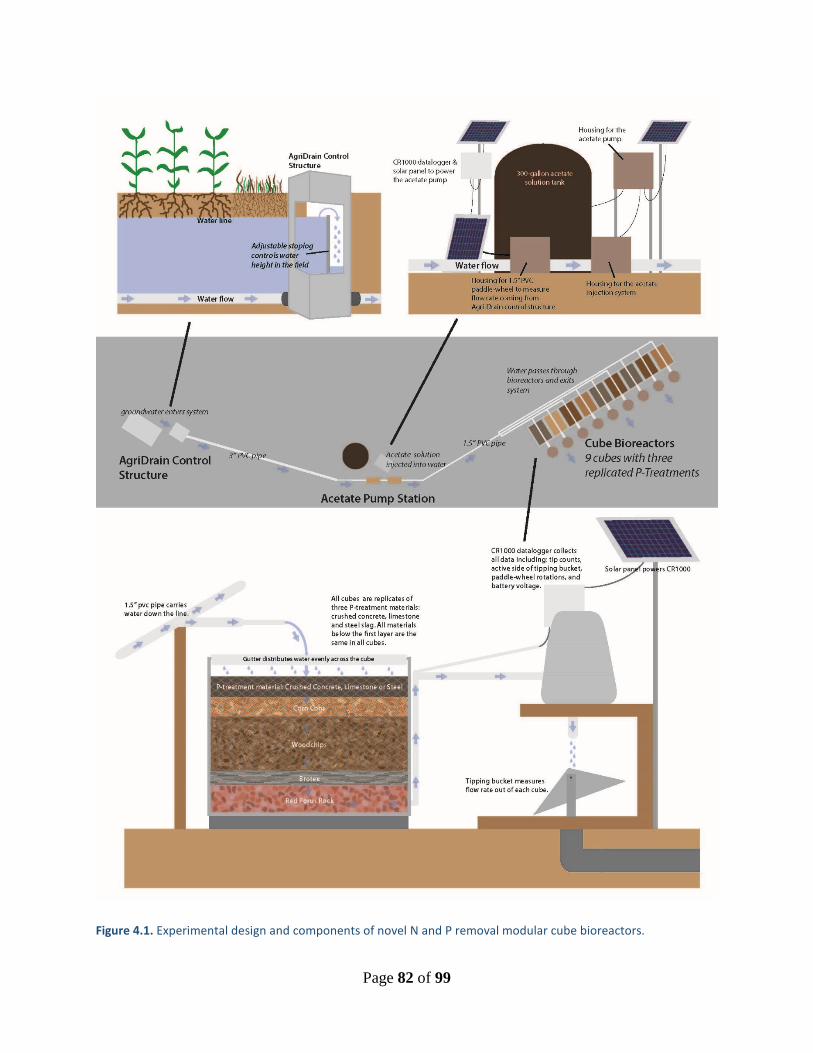
Figure 4.1. Experimental design and components of novel N and P removal modular cube bioreactors.
Page 82 of 99
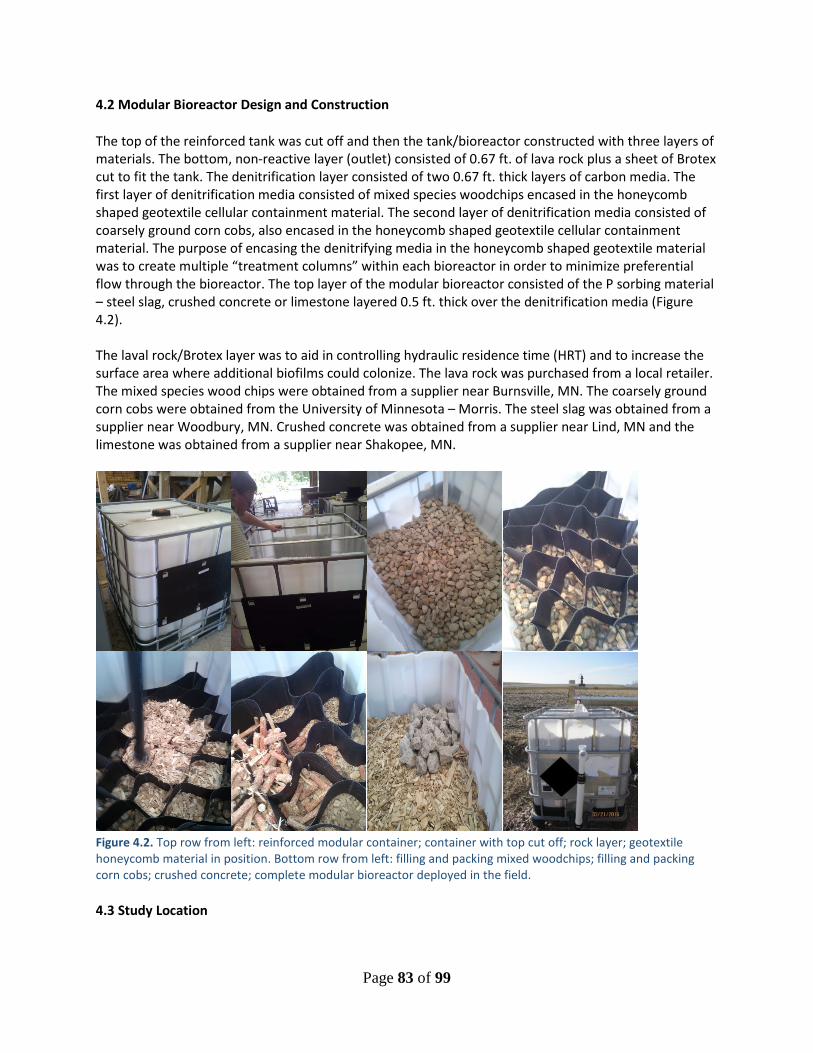
4.2 Modular Bioreactor Design and Construction
The top of the reinforced tank was cut off and then the tank/bioreactor constructed with three layers of materials. The bottom, non-reactive layer (outlet) consisted of 0.67 ft. of lava rock plus a sheet of Brotex cut to fit the tank. The denitrification layer consisted of two 0.67 ft. thick layers of carbon media. The first layer of denitrification media consisted of mixed species woodchips encased in the honeycomb shaped geotextile cellular containment material. The second layer of denitrification media consisted of coarsely ground corn cobs, also encased in the honeycomb shaped geotextile cellular containment material. The purpose of encasing the denitrifying media in the honeycomb shaped geotextile material was to create multiple “treatment columns” within each bioreactor in order to minimize preferential flow through the bioreactor. The top layer of the modular bioreactor consisted of the P sorbing material – steel slag, crushed concrete or limestone layered 0.5 ft. thick over the denitrification media (Figure 4.2). The laval rock/Brotex layer was to aid in controlling hydraulic residence time (HRT) and to increase the surface area where additional biofilms could colonize. The lava rock was purchased from a local retailer. The mixed species wood chips were obtained from a supplier near Burnsville, MN. The coarsely ground corn cobs were obtained from the University of Minnesota – Morris. The steel slag was obtained from a supplier near Woodbury, MN. Crushed concrete was obtained from a supplier near Lind, MN and the limestone was obtained from a supplier near Shakopee, MN.
Figure 4.2. Top row from left: reinforced modular container; container with top cut off; rock layer; geotextile honeycomb material in position. Bottom row from left: filling and packing mixed woodchips; filling and packing corn cobs; crushed concrete; complete modular bioreactor deployed in the field.
4.3 Study Location
Page 83 of 99
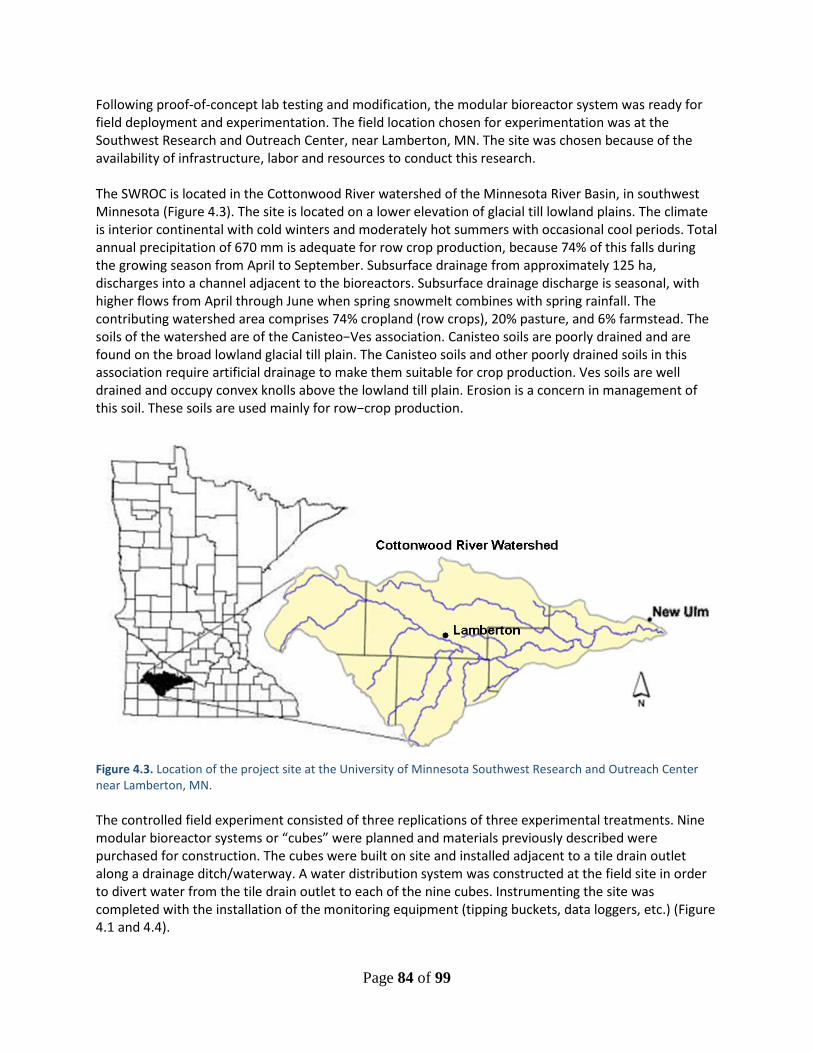
Following proof-of-concept lab testing and modification, the modular bioreactor system was ready for field deployment and experimentation. The field location chosen for experimentation was at the Southwest Research and Outreach Center, near Lamberton, MN. The site was chosen because of the availability of infrastructure, labor and resources to conduct this research. The SWROC is located in the Cottonwood River watershed of the Minnesota River Basin, in southwest Minnesota (Figure 4.3). The site is located on a lower elevation of glacial till lowland plains. The climate is interior continental with cold winters and moderately hot summers with occasional cool periods. Total annual precipitation of 670 mm is adequate for row crop production, because 74% of this falls during the growing season from April to September. Subsurface drainage from approximately 125 ha, discharges into a channel adjacent to the bioreactors. Subsurface drainage discharge is seasonal, with higher flows from April through June when spring snowmelt combines with spring rainfall. The contributing watershed area comprises 74% cropland (row crops), 20% pasture, and 6% farmstead. The soils of the watershed are of the Canisteo−Ves association. Canisteo soils are poorly drained and are found on the broad lowland glacial till plain. The Canisteo soils and other poorly drained soils in this association require artificial drainage to make them suitable for crop production. Ves soils are well drained and occupy convex knolls above the lowland till plain. Erosion is a concern in management of this soil. These soils are used mainly for row−crop production.
Figure 4.3. Location of the project site at the University of Minnesota Southwest Research and Outreach Center near Lamberton, MN. The controlled field experiment consisted of three replications of three experimental treatments. Nine modular bioreactor systems or “cubes” were planned and materials previously described were purchased for construction. The cubes were built on site and installed adjacent to a tile drain outlet along a drainage ditch/waterway. A water distribution system was constructed at the field site in order to divert water from the tile drain outlet to each of the nine cubes. Instrumenting the site was completed with the installation of the monitoring equipment (tipping buckets, data loggers, etc.) (Figure 4.1 and 4.4).
Page 84 of 99

Figure 4.4. From the left: three-way subsurface drain flow splitter to distribute water from the subsurface drain outlet to the bioreactors; block of three bioreactors with a set of three solar panels, one paddle wheel, and a datalogger in the white enclosure; portable samplers for collecting bioreactor discharge for water quality component analysis.
4.4 Research design
Flow measuring devices and water sampling equipment were installed at the experimental site in order to characterize flow rate and volume and to obtain water samples for chemical characterization. Subsurface drainage was measured in a flow control structure using a pressure transducer connected to a datalogger. The flow control structure was also used to divert water to the modular bioreactors. The outlet elevation of the flow control structure was managed at the highest level possible which created a column of water on the upstream side of the flow control structure. A single 5 cm dia. PVC pipe was installed in the bottom, up-stream side of the flow control structure which then diverted subsurface drainage water through an in-line PVC debris Y-filter to the modular bioreactors. The single PVC pipe from the flow control structure was split into three separate distribution pipes each fitted with a paddlewheel flowmeter which was connected to a datalogger. Each of the three distribution pipes routed water to a block of three modular bioreactors. Flow to a block of three bioreactors was split again into three separate distribution pipes and routed to individual bioreactors in which flow was controlled with a small, PVC ball valve. Flow into the top of the bioreactor was delivered through a section of plastic gutter with holes drilled into the bottom in order to attempt to distribute water as evenly as possible across the surface of the bioreactor. The outlet of the bioreactor consisted of an adjustable standpipe which was used to raise or lower the elevation of water in the bioreactor. The stand pipe was also used to divert bioreactor effluent to a flow gauge and to collect water samples for chemical characterization. A tipping bucket flow gauge with approximately 4 L capacity per tip was used to measure bioreactor discharge volume and rate. Tipping buckets were made from stainless steel. The volume of each tip was calibrated in the laboratory at a series of known flow rates, ranging from 1.2 to 18.9 liters per minute. The calibration process involved applying water to the tipping bucket at a known flow rate for a period of at least 105 tips. During this period, a datalogger was used to record the time when the calibration started and stopped as well as the exact time for each tip. Tips were counted using magnetic switches located on the tipping bucket. Each modular bioreactor had its own dedicated tipping bucket. Fixed-time interval samples were collected with automatic water samplers (ISCO, Lincoln, NE). Carbon source augmentation Denitrification is mainly accomplished by heterotrophic bacteria and is strongly dependent on the availability of organic carbon, which serves as an energy source and electron donor of the denitrification
Page 85 of 99
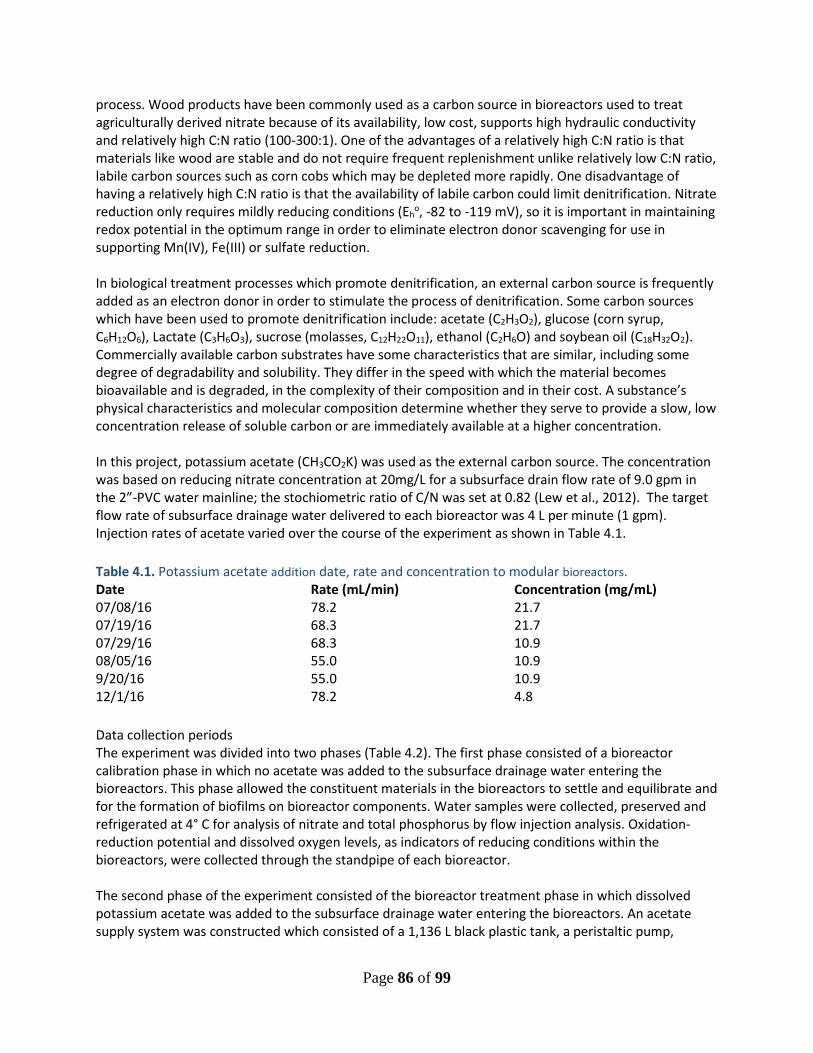
process. Wood products have been commonly used as a carbon source in bioreactors used to treat agriculturally derived nitrate because of its availability, low cost, supports high hydraulic conductivity and relatively high C:N ratio (100-300:1). One of the advantages of a relatively high C:N ratio is that materials like wood are stable and do not require frequent replenishment unlike relatively low C:N ratio, labile carbon sources such as corn cobs which may be depleted more rapidly. One disadvantage of having a relatively high C:N ratio is that the availability of labile carbon could limit denitrification. Nitrate reduction only requires mildly reducing conditions (Eh
o, -82 to -119 mV), so it is important in maintaining redox potential in the optimum range in order to eliminate electron donor scavenging for use in supporting Mn(IV), Fe(III) or sulfate reduction. In biological treatment processes which promote denitrification, an external carbon source is frequently added as an electron donor in order to stimulate the process of denitrification. Some carbon sources which have been used to promote denitrification include: acetate (C2H3O2), glucose (corn syrup, C6H12O6), Lactate (C3H6O3), sucrose (molasses, C12H22O11), ethanol (C2H6O) and soybean oil (C18H32O2). Commercially available carbon substrates have some characteristics that are similar, including some degree of degradability and solubility. They differ in the speed with which the material becomes bioavailable and is degraded, in the complexity of their composition and in their cost. A substance’s physical characteristics and molecular composition determine whether they serve to provide a slow, low concentration release of soluble carbon or are immediately available at a higher concentration. In this project, potassium acetate (CH3CO2K) was used as the external carbon source. The concentration was based on reducing nitrate concentration at 20mg/L for a subsurface drain flow rate of 9.0 gpm in the 2”-PVC water mainline; the stochiometric ratio of C/N was set at 0.82 (Lew et al., 2012). The target flow rate of subsurface drainage water delivered to each bioreactor was 4 L per minute (1 gpm). Injection rates of acetate varied over the course of the experiment as shown in Table 4.1. Table 4.1. Potassium acetate addition date, rate and concentration to modular bioreactors. Date Rate (mL/min) Concentration (mg/mL) 07/08/16 78.2 21.7 07/19/16 68.3 21.7 07/29/16 68.3 10.9 08/05/16 55.0 10.9 9/20/16 55.0 10.9 12/1/16 78.2 4.8 Data collection periods The experiment was divided into two phases (Table 4.2). The first phase consisted of a bioreactor calibration phase in which no acetate was added to the subsurface drainage water entering the bioreactors. This phase allowed the constituent materials in the bioreactors to settle and equilibrate and for the formation of biofilms on bioreactor components. Water samples were collected, preserved and refrigerated at 4° C for analysis of nitrate and total phosphorus by flow injection analysis. Oxidation-reduction potential and dissolved oxygen levels, as indicators of reducing conditions within the bioreactors, were collected through the standpipe of each bioreactor. The second phase of the experiment consisted of the bioreactor treatment phase in which dissolved potassium acetate was added to the subsurface drainage water entering the bioreactors. An acetate supply system was constructed which consisted of a 1,136 L black plastic tank, a peristaltic pump,
Page 86 of 99

datalogger and solar panel. Potassium acetate was dissolved in water at a predetermined concentration and then injected into the PVC pipe carrying subsurface drainage water to the bioreactors. The subsurface drain flow rate was used to determine the pumping rate at which acetate was added to the bioreactors. Acetate was added during three distinct time periods (Table 4.2). Table 4.2. Experiment phases of no acetate and acetate addition to modular bioreactors Phase Time period Calibration (No Acetate) Period 1 5/10/16 to 6/20/16 Period 2 10/25/16 to 11/18/16 Treatment (Acetate) Period 1 7/8/16 to 7/23/16 Period 2 7/30/16 to 8/8/16 Period 3 9/20/16 to 10/13/16 …..Period 4 12/1/16 to 12/5/16 During Acetate Period 1 the subsurface drainage water distribution pipe system was frequently clogged with algae that forced the temporary interruption of the experiment. The PVC pipes and connectors were purged and/or replaced before starting Acetate Period 2. It was determined that a combination of readily available dissolved nutrients in the drainage water, coupled with sufficient distance between the acetate injection point and the bioreactors allowed sunlight to penetrate the PVC distribution pipe which resulted in the algae growth. No algae were found in the black storage tank. Consequently, in the future, black pipe and fittings will be recommended for these types of systems to minimize algal growth in undesirable areas. The solution for 2017 experimentation to remedy this problem will be to spray paint all of the pipe and fittings between the acetate tank and the bioreactors blank in order to minimize light penetration and algal growth. In addition, the injection point for the acetate will be moved closer to the water distribution split in order to minimize the distance over which algae could form. One of the original goals of this project was to evaluate the performance of the bioreactors under contrasting temperature conditions (i.e. cool versus warm). It was expected that relatively cold water and air temperatures during the early part of the season, between March and May, may reduce the rate of denitrification in the bioreactors and thus affect the efficiency of nitrate removal from the subsurface drainage water. In contrast, it was expected that relatively warm conditions during the middle to late part of the growing season would have little to no effect on denitrification. Due to unexpected delays in deploying the bioreactors in the field, data collection during the early season when conditions are relatively cool and drain flow is relatively high, limited data was collected. Fortunately, due to uncharacteristically wet conditions and nearly continuous subsurface drain flow during 2016, Acetate Period 3 allowed for the evaluation of bioreactor performance for removal and N and P under cold conditions.
4.5 Statistical analysis
This analysis model is based on a linear model using block (3 units) and P-treatment (3 replications) as main factors without interaction. ANOVA was run with the linear model outputs that give the p-values at 0.10 level for each factor (block, treatment). Results were presented in standard ANOVA tables showing each factor and residuals.
Page 87 of 99

4.6 Results and Discussion
Precipitation The weather conditions during 2016 would be considered abnormal. Annual precipitation at the SWROC was 41% above average, 960 mm compared to the 30-year average 679 mm. Mean growing season precipitation, April through September, is 435 mm whereas during 2016 a total of 646 mm was observed. The frequency and distribution of precipitation was relatively even from month to month. One short dry period, about 10 days long, occurred in early August. Drain flow Subsurface drain flow normally begins in mid-March when snowmelt begins and soils begin to thaw and ends in mid- to late-July when crop evapotranspiration exceeds precipitation. During 2016, drain flow was relatively constant beginning in April through November. Drainage system and bioreactor outflow and water analysis operations were terminated in mid-November when air temperatures dropped to at or below freezing for an extended period of time. Further monitoring of subsurface drain flow or bioreactor effluent could have resulted in irreversible damage to flow monitoring and water sampling equipment. Bioreactor hydrology Statistical analysis did not reveal any significant differences (p=0.359) for cumulative discharge volume among bioreactors during 2016. The period from No Acetate Period 1 through Acetate Period 2 occurred during late spring and early summer. Late spring to early summer cumulative discharge volume from the bioreactors varied among periods and among the P treatments (Table 4.3). The greatest discharge volume was observed during No Acetate Period 1 and then gradually declined during Acetate Period 1 and 2. Cumulative bioreactor discharge volume increased from Acetate Period 2 to Acetate Period 3. One plausible explanation for the reduction in cumulative discharge volume between the No Acetate Period 1 and Acetate Period 1 was due to the decrease in supply of subsurface drain flow. This was expected as crop demand increased during the growing season, which effectively reduced drain flow. In addition, some flow reduction could be attributed to a buildup of algae in the PVC supply lines. Algae was observed in the inline sediment traps and flow meters of the pipe delivering water to the bioreactors and was abated on a daily basis to ensure optimal flow. We hypothesized that a combination of dissolved N, P, K and C in the drainage water coupled with light transmission through the white PVC supply line and the relatively long distance between the point of injection of Acetate and the modular bioreactors contributed to the algae growth. Acetate Period 2 occurred during mid to late summer when crop growth, nutrient uptake and water uptake are high, which could partially explain the decrease in cumulative bioreactor discharge volume between Acetate Period 1 and Acetate Period 2. Acetate Period 3 occurred during late summer and early autumn when plant water uptake declined due to plant senescence. One other possible explanation for the changes in drain flow volume over time was the observation that the Limestone and in particular the Steel Slag began to conglomerate. These P treatment materials appeared to have change characteristics from small individual aggregates into cohesive masses which may have reduced bioreactor discharge volume. The cause of this conglomeration is unknown at this time but warrants further investigation. One hypothesis is that dissolved minerals are precipitating onto the Steel Slag and effectively “cementing” the individual particles together. Two changes will be made before the second experimental season in order to minimize algal growth in the future. First, the Acetate injection point will be moved closer to the modular bioreactors. Second, the PVC supply lines from the injection point to the modular bioreactors will be sprayed black or replaced with black pipe. We believe that by taking both of these steps, the
Page 88 of 99
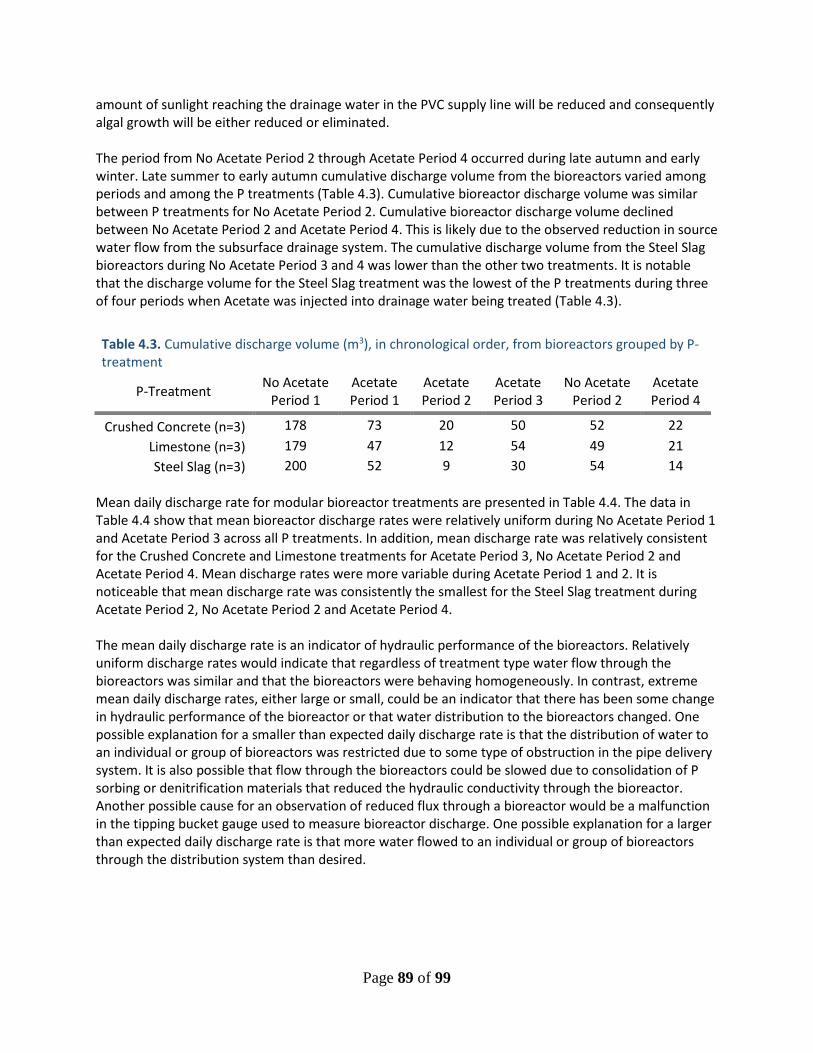
amount of sunlight reaching the drainage water in the PVC supply line will be reduced and consequently algal growth will be either reduced or eliminated. The period from No Acetate Period 2 through Acetate Period 4 occurred during late autumn and early winter. Late summer to early autumn cumulative discharge volume from the bioreactors varied among periods and among the P treatments (Table 4.3). Cumulative bioreactor discharge volume was similar between P treatments for No Acetate Period 2. Cumulative bioreactor discharge volume declined between No Acetate Period 2 and Acetate Period 4. This is likely due to the observed reduction in source water flow from the subsurface drainage system. The cumulative discharge volume from the Steel Slag bioreactors during No Acetate Period 3 and 4 was lower than the other two treatments. It is notable that the discharge volume for the Steel Slag treatment was the lowest of the P treatments during three of four periods when Acetate was injected into drainage water being treated (Table 4.3).
Mean daily discharge rate for modular bioreactor treatments are presented in Table 4.4. The data in Table 4.4 show that mean bioreactor discharge rates were relatively uniform during No Acetate Period 1 and Acetate Period 3 across all P treatments. In addition, mean discharge rate was relatively consistent for the Crushed Concrete and Limestone treatments for Acetate Period 3, No Acetate Period 2 and Acetate Period 4. Mean discharge rates were more variable during Acetate Period 1 and 2. It is noticeable that mean discharge rate was consistently the smallest for the Steel Slag treatment during Acetate Period 2, No Acetate Period 2 and Acetate Period 4. The mean daily discharge rate is an indicator of hydraulic performance of the bioreactors. Relatively uniform discharge rates would indicate that regardless of treatment type water flow through the bioreactors was similar and that the bioreactors were behaving homogeneously. In contrast, extreme mean daily discharge rates, either large or small, could be an indicator that there has been some change in hydraulic performance of the bioreactor or that water distribution to the bioreactors changed. One possible explanation for a smaller than expected daily discharge rate is that the distribution of water to an individual or group of bioreactors was restricted due to some type of obstruction in the pipe delivery system. It is also possible that flow through the bioreactors could be slowed due to consolidation of P sorbing or denitrification materials that reduced the hydraulic conductivity through the bioreactor. Another possible cause for an observation of reduced flux through a bioreactor would be a malfunction in the tipping bucket gauge used to measure bioreactor discharge. One possible explanation for a larger than expected daily discharge rate is that more water flowed to an individual or group of bioreactors through the distribution system than desired.
Table 4.3. Cumulative discharge volume (m3), in chronological order, from bioreactors grouped by P-treatment
P-Treatment No Acetate Period 1
Acetate Period 1
Acetate Period 2
Acetate Period 3
No Acetate Period 2
Acetate Period 4
Crushed Concrete (n=3) 178 73 20 50 52 22 Limestone (n=3) 179 47 12 54 49 21 Steel Slag (n=3) 200 52 9 30 54 14
Page 89 of 99
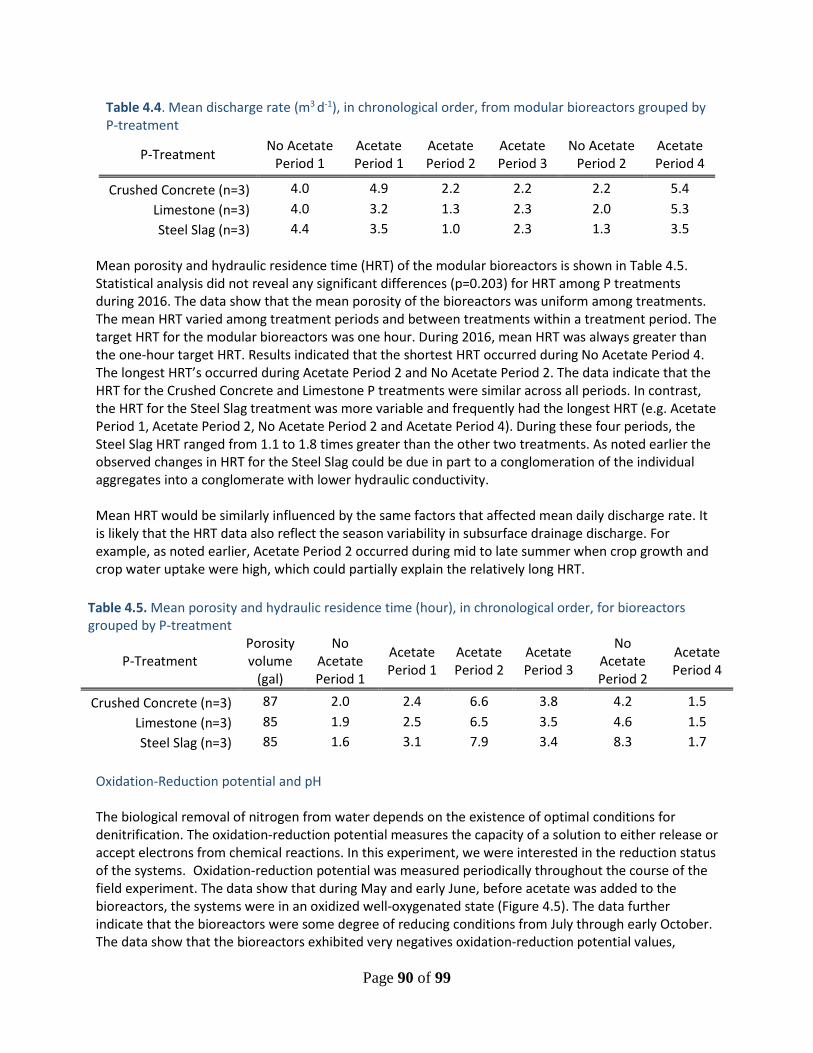
Table 4.4. Mean discharge rate (m3 d-1), in chronological order, from modular bioreactors grouped by P-treatment
P-Treatment No Acetate Period 1
Acetate Period 1
Acetate Period 2
Acetate Period 3
No Acetate Period 2
Acetate Period 4
Crushed Concrete (n=3) 4.0 4.9 2.2 2.2 2.2 5.4 Limestone (n=3) 4.0 3.2 1.3 2.3 2.0 5.3 Steel Slag (n=3) 4.4 3.5 1.0 2.3 1.3 3.5
Mean porosity and hydraulic residence time (HRT) of the modular bioreactors is shown in Table 4.5. Statistical analysis did not reveal any significant differences (p=0.203) for HRT among P treatments during 2016. The data show that the mean porosity of the bioreactors was uniform among treatments. The mean HRT varied among treatment periods and between treatments within a treatment period. The target HRT for the modular bioreactors was one hour. During 2016, mean HRT was always greater than the one-hour target HRT. Results indicated that the shortest HRT occurred during No Acetate Period 4. The longest HRT’s occurred during Acetate Period 2 and No Acetate Period 2. The data indicate that the HRT for the Crushed Concrete and Limestone P treatments were similar across all periods. In contrast, the HRT for the Steel Slag treatment was more variable and frequently had the longest HRT (e.g. Acetate Period 1, Acetate Period 2, No Acetate Period 2 and Acetate Period 4). During these four periods, the Steel Slag HRT ranged from 1.1 to 1.8 times greater than the other two treatments. As noted earlier the observed changes in HRT for the Steel Slag could be due in part to a conglomeration of the individual aggregates into a conglomerate with lower hydraulic conductivity. Mean HRT would be similarly influenced by the same factors that affected mean daily discharge rate. It is likely that the HRT data also reflect the season variability in subsurface drainage discharge. For example, as noted earlier, Acetate Period 2 occurred during mid to late summer when crop growth and crop water uptake were high, which could partially explain the relatively long HRT.
Table 4.5. Mean porosity and hydraulic residence time (hour), in chronological order, for bioreactors grouped by P-treatment
P-Treatment Porosity volume
(gal)
No Acetate Period 1
Acetate Period 1
Acetate Period 2
Acetate Period 3
No Acetate Period 2
Acetate Period 4
Crushed Concrete (n=3) 87 2.0 2.4 6.6 3.8 4.2 1.5 Limestone (n=3) 85 1.9 2.5 6.5 3.5 4.6 1.5 Steel Slag (n=3) 85 1.6 3.1 7.9 3.4 8.3 1.7
Oxidation-Reduction potential and pH The biological removal of nitrogen from water depends on the existence of optimal conditions for denitrification. The oxidation-reduction potential measures the capacity of a solution to either release or accept electrons from chemical reactions. In this experiment, we were interested in the reduction status of the systems. Oxidation-reduction potential was measured periodically throughout the course of the field experiment. The data show that during May and early June, before acetate was added to the bioreactors, the systems were in an oxidized well-oxygenated state (Figure 4.5). The data further indicate that the bioreactors were some degree of reducing conditions from July through early October. The data show that the bioreactors exhibited very negatives oxidation-reduction potential values,
Page 90 of 99
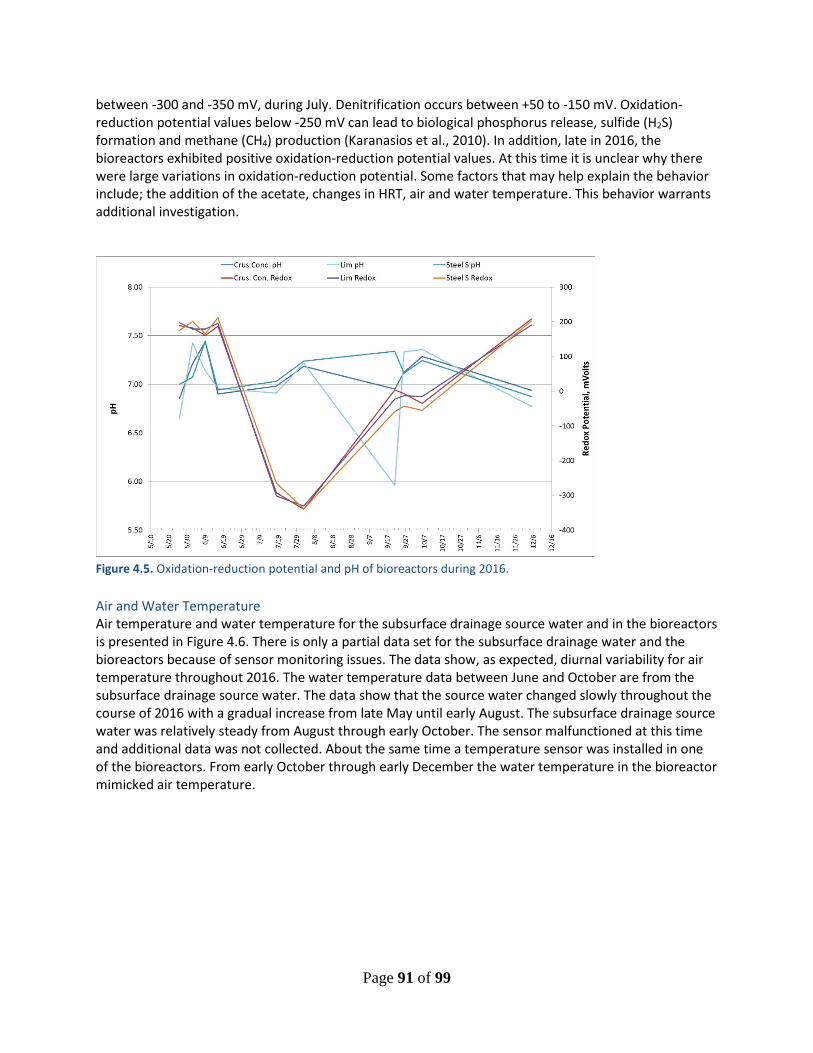
between -300 and -350 mV, during July. Denitrification occurs between +50 to -150 mV. Oxidation-reduction potential values below -250 mV can lead to biological phosphorus release, sulfide (H2S) formation and methane (CH4) production (Karanasios et al., 2010). In addition, late in 2016, the bioreactors exhibited positive oxidation-reduction potential values. At this time it is unclear why there were large variations in oxidation-reduction potential. Some factors that may help explain the behavior include; the addition of the acetate, changes in HRT, air and water temperature. This behavior warrants additional investigation.
Figure 4.5. Oxidation-reduction potential and pH of bioreactors during 2016. Air and Water Temperature Air temperature and water temperature for the subsurface drainage source water and in the bioreactors is presented in Figure 4.6. There is only a partial data set for the subsurface drainage water and the bioreactors because of sensor monitoring issues. The data show, as expected, diurnal variability for air temperature throughout 2016. The water temperature data between June and October are from the subsurface drainage source water. The data show that the source water changed slowly throughout the course of 2016 with a gradual increase from late May until early August. The subsurface drainage source water was relatively steady from August through early October. The sensor malfunctioned at this time and additional data was not collected. About the same time a temperature sensor was installed in one of the bioreactors. From early October through early December the water temperature in the bioreactor mimicked air temperature.
Page 91 of 99

Figure 4.6. Oxidation-reduction potential and pH of bioreactors during 2016. Nitrogen Results in Table 4.6 show the mean NO3-N concentration for the experiment. Statistical analysis did not reveal any significant differences (p=0.186) for NO3-N concentration among P treatments during 2016. The subsurface drainage source water NO3-N concentration was greater than 20 mg/L during No Acetate Period 1 and Acetate Period 1 that coincided with late spring/early summer. This NO3-N concentration was likely the result of a combination of residual soil nitrate from the previous growing season and contributions from nitrogen fertilizer applied during the autumn of 2015 for the 2016 corn crop. The subsurface drainage NO3-N concentration declined to 12.1 mg/L during Acetate Period 2, which coincided with mid-summer. During Acetate Period 3 and No Acetate Period 2, which coincided with early to mid-autumn, the subsurface drainage NO3-N concentration increased again to nearly 20 mg/L (Table 4.6). Finally, during Acetate Period 4, late autumn/early winter, the NO3-N concentration declined slightly to 17.4 mg/L. All of the modular bioreactors were constructed from the same denitrification constituents regardless of P treatment material. There were two no acetate periods during 2016. The initial no acetate period, No Acetate Period 1, occurred during late spring/early summer and lasted 42 days. The goals of the initial no acetate period were to establish anaerobic conditions in the bioreactors and for the colonization of microorganisms within the bioreactors. According to the data, there was almost no change in NO3-N concentration leaving the bioreactors during No Acetate Period 1. The apparent lack of denitrification activity during No Acetate Period 1 could be due to the absence of or insufficient populations of denitrifying organisms. The second no acetate period, No Acetate Period 2, lasted 25 days and took place during early to mid-autumn. During No Acetate Period 2, there was a slight reduction in NO3-N concentration from the bioreactors compared to the subsurface drainage source water. The apparent denitrification activity during No Acetate Period 2 could be due carry over effects from the previous acetate additions coupled with the presence of sufficient populations of denitrifying organisms in the bioreactors. The addition of acetate during Acetate Period 1, 2 and 3 resulted in reductions of NO3-N concentration from bioreactors for all P treatments. The magnitude of the NO3-N concentration reduction during
Page 92 of 99

Acetate Period 3, which occurred during early to mid-autumn, was smaller than Acetate Period 1 and 2. This could be due to changes in air temperature as daytime air temperature was decreasing during this period. Water temperature could also have had in impact as mean water temperature decreased over time from 18.0 oC in August to 6.8 oC by November. Results from No Acetate Period 4, which only lasted five days, indicated that bioreactors acted as a source of NO3-N as evidenced by the increase in NO3-N concentration from the bioreactors compared to the subsurface drainage source water (Table 4.6).
Table 4.6. Mean NO3-N concentration (mg/L), in chronological order, from bioreactors grouped by P-treatment
P-Treatment No Acetate Period 1
Acetate Period 1
Acetate Period 2
Acetate Period 3
No Acetate Period 2
Acetate Period 4
Crushed Concrete (n=3) 22.9 9.6 0.4 13.5 17.9 18.0 Limestone (n=3) 22.9 9.0 0.6 14.4 17.7 18.0 Steel Slag (n=3) 22.9 8.0 0.3 12.8 16.6 18.1
†Source water (n=1) 23.6 22.9 12.1 19.7 19.2 17.4 †Source water is subsurface drainage water
During the initial period, No Acetate Period 1, the percent NO3-N concentration reduction from the bioreactors was about 3% (Table 4.7). During the second no acetate period, No Acetate Period 2, the percent NO3-N concentration reduction ranged between 7 and 14%. The largest percent NO3-N concentration reduction from the bioreactors occurred during Acetate Period 2 and the smallest NO3-N reduction occurred during Acetate Period 4. During Acetate Period 4, there was 0% reduction in NO3-N concentration (Table 4.7). A combination of warm air temperatures coupled with relatively long HRT contributed to near complete denitrification of the subsurface drainage water during Acetate Period 2. In contrast, cold air temperature was the major contributing factor to the lack of denitrification during Acetate Period 4. The data showed that the NO3-N concentration reduction was greater than 50% and 95% for Acetate period 1 and Acetate period 2, respectively. Reduction in NO3-N concentration was greater than 80% and 98% for period 1 and period 2, respectively. It is notable that the greatest percent NO3-N concentration reduction occurred for the Steel Slag P treatment for all periods except Acetate Period 4.
Table 4.7. Percent NO3-N concentration reduction, in chronological order, compared to subsurface drainage source water NO3-N concentration from bioreactors grouped by P-treatment
P-Treatment No Acetate Period 1
Acetate Period 1
Acetate Period 2
Acetate Period 3
No Acetate Period 2
Acetate Period 4
Crushed Concrete (n=3) 2.8 57.9 96.5 31.6 6.6 0.0 Limestone (n=3) 2.7 60.8 95.1 27.0 7.9 0.0 Steel Slag (n=3) 2.9 65.1 97.3 35.1 13.7 0.0
Statistical analysis did not reveal any significant differences (p=0.710) for cumulative NO3-N load among P treatments during 2016. Figure 4.5 shows cumulative bioreactor discharge and cumulative NO3-N load during 2016. The data indicate gradual season long increases in bioreactor discharge for all P treatments. The mean cumulative discharge for bioreactors, regardless of P treatment, was about 375 m3. The data for cumulative NO3-N load showed a similar response to bioreactor discharge during the May through July period. This suggests that the NO3-N load reduction during the warm months was
Page 93 of 99

proportional to discharge. In contrast, during that later part of the year, between September and December, when air temperatures were declining the rate of increase in cumulative NO3-N load was reduced relative to the rate of increase in cumulative discharge. (Figure 4.7).
Figure 4.7. Cumulative bioreactor discharge and cumulative bioreactor NO3-N load for Crushed Concrete (CC), Limestone (LM) and Steel Slag (SS) during 2016. Table 4.8 shows mean bioreactor NO3-N load during 2016. The largest mean bioreactor NO3-N loads observed occurred during No Acetate Period 1 and the smallest during Acetate Period 2. The data also exhibit a gradual decline in mean bioreactor NO3-N load from No Acetate Period 1 to Acetate Period 2. Mean bioreactor NO3-N load increased from Acetate Period 2 to Acetate Period 3. Mean bioreactor NO3-N load was generally uniform regardless of P treatment from Acetate Period 3 to Acetate Period 4 with the exception of the Steel Slag treatment during No Acetate Period 2. In the case of these modular bioreactors, mean bioreactor NO3-N load for the different periods was attributed to a combination of differences in mean bioreactor NO3-N concentration and HRT. For example, Acetate Period 2 had the smallest NO3-N concentration and the longest HRT of any period during 2016. Consequently, the NO3-N load during Acetate Period 2 was also small. The mean bioreactor NO3-N loads observed during No Acetate Period 2 and Acetate Period 4, early autumn through late autumn/early winter, respectively, exhibited an increase in mean bioreactor NO3-N load for the Crushed Concrete and Limestone P treatments. This result suggests that the modular bioreactors were acting as a source of NO3-N rather than a sink.
Table 4.8. Mean NO3-N load (kg), in chronological order, from bioreactors grouped by P-treatment
P-Treatment No Acetate Period 1
Acetate Period 1
Acetate Period 2
Acetate Period 3
No Acetate Period 2
Acetate Period 4
Crushed Concrete (n=3) 3.7 0.7 0.004 0.7 0.8 0.4 Limestone (n=3) 4.2 0.6 0.001 0.8 0.7 0.4 Steel Slag (n=3) 4.6 0.5 0.005 0.8 0.4 0.3
†Source water (n=1) 5.6 1.3 0.2 1.1 0.7 0.3 †Source water is subsurface drainage water
Page 94 of 99

During the initial period, No Acetate Period 1, the percent NO3-N load reduction from the bioreactors ranged between 19 and 23% (Table 4.9). During No Acetate Period 2, the percent NO3-N load reduction ranged between 0 and 14%. The largest percent NO3-N load reduction from the bioreactors occurred during Acetate Period 2 and the smallest NO3-N load reduction occurred during Acetate Period 4. During Acetate Period 4, there was 0% load reduction in NO3-N concentration (Table 4.9). The data showed that the NO3-N load reductions were greatest during Acetate Period 1, 2 and 3. These periods coincided with late spring through early autumn. Reduction in NO3-N load was small or zero during the late autumn/early winter, No Acetate Period 2 and Acetate Period 4.
Table 4.9. Percent NO3-N load reduction, in chronological order, from bioreactors grouped by P-treatment
P-Treatment No Acetate Period 1
Acetate Period 1
Acetate Period 2
Acetate Period 3
No Acetate Period 2
Acetate Period 4
Crushed Concrete (n=3) 19 43 97 27 0 0 Limestone (n=3) 23 56 94 31 0 0 Steel Slag (n=3) 22 60 97 28 14 0
Phosphorus Statistical analysis did not reveal any significant differences (p=0.259) for total phosphorus (TP) concentration among P treatments during 2016. The largest concentration of TP was observed during Acetate Period 2, which occurred during late spring and early summer. The smallest concentration of TP was observed during Acetate Period 2, which occurred during late autumn/early winter. Despite no significant difference among P treatments, the data showed reductions in TP for some treatments during all periods except Acetate Period 4 compared to subsurface drainage source water (Table 4.10). According to the data, the P treatments reduced TP during No Acetate Period 1, Acetate Period 1 and 2 compared to the subsurface drainage source water. The largest reductions occurred during Acetate Period 2. During Acetate Period 3, there were modest reductions in TP concentration for the Limestone and Steel Slag treatments. In contrast, the Crushed Concrete treatment exhibited an increase in TP concentration from the bioreactors. Total phosphorus concentration was reduced for the Steel Slag and Limestone treatments during No Acetate Period 2 whereas there was no difference in TP concentration for the Crushed Concrete compared to the subsurface drainage source water. From the data, it did not appear that Acetate had any impact on TP concentration. During Acetate Period 4, all the treatments behaved as a source of TP compared to the subsurface drainage source water. This suggests that there was dissolution of phosphorus when the TP concentration in the subsurface drainage source water was lowest.
Table 4.10. Mean total phosphorus concentration (ug/L) from bioreactors grouped by P-treatment
P-Treatment No Acetate Period 1
Acetate Period 1
Acetate Period 2
Acetate Period 3
No Acetate Period 2
Acetate Period 4
Crushed Concrete (n=3) 91 46 139 133 64 206 Limestone (n=3) 96 52 107 90 52 79 Steel Slag (n=3) 109 100 128 90 29 62
†Source water (n=1) 121 260 764 110 64 52 †Source water is subsurface drainage water
Page 95 of 99

According to the data, the largest percent reduction in TP concentration from the bioreactors occurred during Acetate Period 2 and the smallest TP reduction occurred during Acetate Period 4. During Acetate Period 4, there was 0% reduction in TP concentration (Table 4.11). During the initial period, No Acetate Period 1, the percent TP concentration reduction from the bioreactors ranged between 10 and 25% compared to the subsurface drainage source water. During the second no acetate period, No Acetate Period 2, the percent TP concentration reduction ranged between 0 and 54%. After initially a 25% reduction in TP, the Crushed Concrete treatment exhibited large reductions, 82 and 83%, in TP concentration following the addition of Acetate. Beginning with Acetate Period 3 through the end of the experiment in 2016 the percent TP concentration reduction dropped to zero. It is unclear at this time whether all of the phosphorus exchange sites were occupied beginning with Acetate Period 3 or if another mechanism or process was affecting percent TP concentration reduction. The Limestone TP removal treatment exhibited similar behavior as Crushed Concrete during the experiment. The main difference between Crushed Concrete and the Limestone was that the Limestone treatment was still somewhat effective during Acetate Period 3 and No Acetate Period 2. For the Steel Slag treatment, percent TP concentration reduction began at 10% during No Acetate Period 1 and gradually increased to 83% reduction during Acetate Period 2. Percent TP concentration reduction dropped to 18% during Acetate Period 3 and continued to increase to 54% TP concentration reduction during No Acetate Period 2.
Table 4.11. Percent total phosphorus concentration reduction, in chronological order, from bioreactors grouped by P-treatment
P-Treatment No Acetate Period 1
Acetate Period 1
Acetate Period 2
Acetate Period 3
No Acetate Period 2
Acetate Period 4
Crushed Concrete (n=3) 25 83 82 0 0 0 Limestone (n=3) 21 80 86 18 19 0 Steel Slag (n=3) 10 62 83 18 54 0
Figure 4.8 shows cumulative bioreactor discharge and cumulative TP load during 2016. The Steel Slag treatment resulted in the largest load of TP, 35 g, followed by the Limestone, 33 g and Crushed Concrete 30 g. The mean cumulative discharge for bioreactors, regardless of P treatment, was about 375 m3. The data for cumulative TP load showed a similar response to bioreactor discharge during the May through July period. This suggests that the TP load reduction during the warm months was proportional to discharge. In contrast, during that later part of the year, between September and December, when air temperatures were declining the rate of increase in cumulative TP load was reduced relative to the rate of increase in cumulative discharge. (Figure 4.8). The cumulative TP load between June and August for the Steel Slag treatment was larger, 28 g, than the cumulative TP load for either Crushed Concrete or Limestone, 18 and 21 g, respectively. The data from Figure 4.8 shows a spike in the TP load at the end of the season.
Page 96 of 99
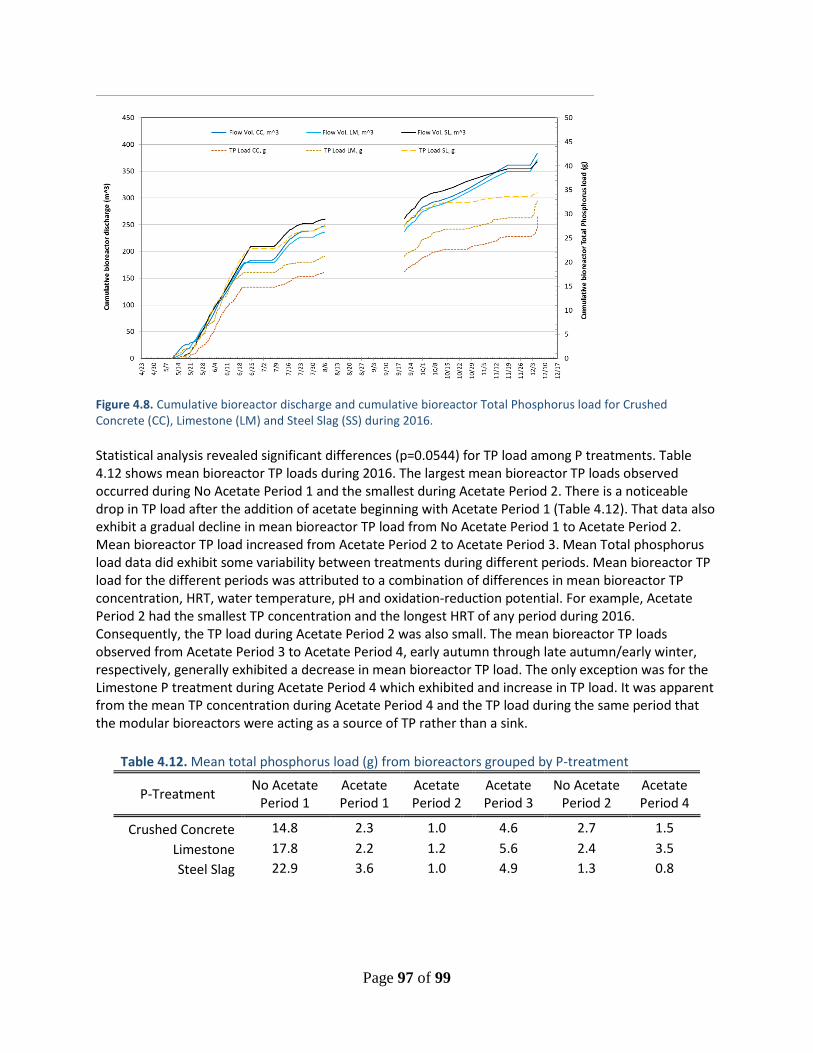
Figure 4.8. Cumulative bioreactor discharge and cumulative bioreactor Total Phosphorus load for Crushed Concrete (CC), Limestone (LM) and Steel Slag (SS) during 2016. Statistical analysis revealed significant differences (p=0.0544) for TP load among P treatments. Table 4.12 shows mean bioreactor TP loads during 2016. The largest mean bioreactor TP loads observed occurred during No Acetate Period 1 and the smallest during Acetate Period 2. There is a noticeable drop in TP load after the addition of acetate beginning with Acetate Period 1 (Table 4.12). That data also exhibit a gradual decline in mean bioreactor TP load from No Acetate Period 1 to Acetate Period 2. Mean bioreactor TP load increased from Acetate Period 2 to Acetate Period 3. Mean Total phosphorus load data did exhibit some variability between treatments during different periods. Mean bioreactor TP load for the different periods was attributed to a combination of differences in mean bioreactor TP concentration, HRT, water temperature, pH and oxidation-reduction potential. For example, Acetate Period 2 had the smallest TP concentration and the longest HRT of any period during 2016. Consequently, the TP load during Acetate Period 2 was also small. The mean bioreactor TP loads observed from Acetate Period 3 to Acetate Period 4, early autumn through late autumn/early winter, respectively, generally exhibited a decrease in mean bioreactor TP load. The only exception was for the Limestone P treatment during Acetate Period 4 which exhibited and increase in TP load. It was apparent from the mean TP concentration during Acetate Period 4 and the TP load during the same period that the modular bioreactors were acting as a source of TP rather than a sink.
Table 4.12. Mean total phosphorus load (g) from bioreactors grouped by P-treatment
P-Treatment No Acetate Period 1
Acetate Period 1
Acetate Period 2
Acetate Period 3
No Acetate Period 2
Acetate Period 4
Crushed Concrete 14.8 2.3 1.0 4.6 2.7 1.5 Limestone 17.8 2.2 1.2 5.6 2.4 3.5 Steel Slag 22.9 3.6 1.0 4.9 1.3 0.8
Page 97 of 99
4.7 Conclusions
Field experiments were conducted at the University of Minnesota Southwest Research and Outreach Center (SWROC) in Lamberton, Minnesota to experimentally assess the impact of a novel two phase bioreactor design for removing N and P from agricultural subsurface drainage water. Modular bioreactors were constructed using mixed woodchips plus corn cobs for facilitating denitrification plus either crushed concrete, steel slag or limestone fragments for P sorption. Experimental bioreactors were installed adjacent to an existing drainage ditch/waterway. Flows from the bioreactors were directed to flow gauges and water sampling equipment. The response of the different bioreactors was assessed using a calibration and a treatment period. During the calibration period only subsurface drainage water was delivered to the bioreactors. During the treatment period subsurface drainage water spiked with potassium acetate was delivered to the bioreactors. Data were collected and analyzed to determined the performance and efficiency of the modular bioreactors under various temperature regimes. Nitrate removal was tied to the retention time in the bioreactor coupled with the addition of acetate. Longer retention time resulted in a greater removal of nutrients however, acetate improved nitrogen removal efficiency. Results also indicate that reduced conditions within the bioreactors but only consistently when acetate was added to the subsurface drainage water. All three P sorbing materials performed adequately for removing P from drainage water. Toward the end of the field experiment, as temperatures decreased, the P removal efficiency of the materials declined. During this time some of the materials acted as a source of P rather than a sink for P removal. Additional research is necessary to determine the longevity of the N and P removal materials.
Page 98 of 99

4.8 References
Jaynes, D.B., T.C. Kaspar, T.B. Mooreman, and T.B. Parkin. 2008. In situ bioreactors and deep drain-pipe installation to reduce nitrate losses in artificially drained fields. J. Environ. Qual. 37:429–436. Karanasios, K.A., I.A. Vasiliadou, S. Pavlou, and D.V. Vayenas. 2010. Hydrogenotrophic denitrification of potable water: a review. J. Hazardous Materials. 180: 20-37. Lew, B., P. Stief, M. Beliavski, A. Ashkenazi, O. Svitlica, A. Khan, S. Tarre, D. de Beer and M. Green. 2012. Characterization of denitrifying granular sludge with and without the addition of external carbon source. Bioresource Technol. 124:413-420. Robertson, W.D. and L.C. Merkley. 2009. In-stream bioreactor for agricultural nitrate treatment. J. Environ. Qual. 38:230-237. van Drial, P.W., W.D. Robertson and L.C. Merkley. 2006. Deitrification of agricultural drainage using wood-based reactors. Trans. ASAE 48:121-128. Woli, K.P., M.B. David, R.A. Cooke, G.F. McIsaac, and C.A. Mitchell 2010. Nitrogen balance in and export from agricultural fields associated with controlled drainage systems and denitrifying bioreactors. Ecological Engineering, 36:1558-1566.
Page 99 of 99