Blue Line Engineering SBIRs NAS8-99081 Fully Active Subscale Telescope (FAST) NAS8- 01034

GRI-CR-95-7110
FINAL REPORT
CONTRACT NAS8-39075
21 August 1991 through 30 June 1994
RADAR INVESTIGATIONS OF BARIUM
RELEASES OVER ARECIBO OBSERVATORY,
PUERTO RICO
Geospace Research, Inc.550 N. Continental Blvd., Suite 110
El Segundo, CA 90245
Report Date: 7 July 1995
Institutional Authorization Principal Investigator
Frank T. Djuth, President Dr. Frank T. DjuthGeospace Research, Inc. (310) 322-1160
(310) 322-1160 FAX: (310) 322-2596E-Mail: [email protected]
(NASA-CR-199197) RADAR N96-12150INVESTIGATION OF BARIUM RELEASESOVER ARECIBO OBSERVATORY, PUERTORICO Final Report, 12 Aug. 1991 - Unelas30 Jun. 1994 (Geospace Research)162 p
G3/46 0071244
https://ntrs.nasa.gov/search.jsp?R=19960002142 2018-05-14T16:12:00+00:00Z

TABLE OF CONTENTS
Project Summary iii1. Overview of Results Obtained during the CRRES El Coqui Campaign 1-1
1.1 Campaign Diagnostics 1-1
1.2 AA-3a Experiment 1-2
1.3 AA-4 Experiment 1-2
1.4 AA-3b Experiment 1-3
1.5 NC-1 Experiment 1-4
1.6 NC-2 Experiment 1-4
1.7 AA-1 and AA-7 Experiments 1-41.8 AA-2 Experiment 1-6
2. The CRRES AA-2 Release: HF Wave-Plasma Interactions in a Dense Ba+
Cloud 2-1Abstract ...: 2-2
2.1 Introduction 2-3
2.2 Experiment Design 2-4
2.3 Observations 2-6
2.4 Discussion 2-182.5 Conclusions 2-26
3. AA-4: The Ionospheric Focussed Heating (IFH) Experiment 3-1
Abstract 3-1
3.1 Introduction 3-23.2 Experiment Concept - Chemically Produced Cavity 3-5
3.3 In Situ Measurements 3-9
3.4 Incoherent Scatter Radar Measurements 3-15
3.5 Ground-Based Optical and Radio Observations 3-18
3.6 Conclusions 3-21
4. Incoherent Scatter Observations during Releases AA-l/AA-7 and AA-3b 4-1
4.1 Arecibo Radar Measurements in Support of AA-1 and AA-7 4-1
4.1.1 Description of the AA-l/AA-7 Releases 4-1
4.1.2 Arecibo Radar Operations.. 4-3
4.1.3 Radar Results 4-4
4.1.4 Discussion and Conclusions 4-7

4.2 Arecibo Radar Measurements in Support of AA-3b 4-8
4.2.1 Description of the AA-3b Releases 4-8
4.2.2 Arecibo Radar Operations 4-9
4.2.3 Radar Results 4-9
4.2.4 Discussion and Conclusions 4-11
5. Spin-off Science Fostered by the El Coqui Campaign 5-1
Abstract 5-2
5.1 Introduction 5-3
5.2 Data-Taking Methodology 5-4
5.3 Aeronomic Observations 5-6
5.4 Conclusions 5-8
11

PROJECT SUMMARY
The NASA Combined Release and Radiation Effects Satellite (CRRES) El Coqui
rocket campaign was successfully carried out in Puerto Rico during the period 18 May
through 12 July 1992. This campaign was the last component of the larger CRRES
program, which consisted of a primary CRRES spacecraft launched with an
Atlas/Centaur vehicle, a Pagasus-bome small satellite, and two rocket campaigns
performed from Kwajalein Atoll and Puerto Rico. The El Coqui campaign was
conducted from Puerto Rico to take advantage of the large incoherent scatter radar at
Arecibo Observatory, Puerto Rico and the Arecibo high-power, high-frequency (HF)
facility. A total of eight rockets were launched into the ionosphere above Arecibo
Observatory. Six of the rockets carried chemical release payloads that were used to
actively modify the ionosphere and to examine physical processes in the laboratory-
without-walls environment of space. The remaining two rockets were used to probe
natural sporadic-E instabilities and to make in situ measurements of ionospheric
modifications produced by the Arecibo HF facility.
This report describes five chemical release experiments supported by Geospace
Research, Inc. (GRI) during the El Coqui campaign. These releases are designated as
AA-1 (rocket 36-082), AA-2 (rocket 36-081), AA-3b (rocket 36-064), AA-4 (rocket
36-065), and AA-7 (rocket 36-083). CRT's efforts included the deployment of a new
high-speed radar processor system at Arecibo Observatory, Puerto Rico. The special
purpose processor allowed the full information content of the incoherent scatter radar
data at Arecibo to be captured for the first time. This proved to be an important
diagnostic tool for many of the studies related to the release experiments. In addition, a
VHP (49.92 MHz) radar-interferometer was positioned on the island of Antigua to
monitor the development of geomagnetic field-aligned striations in several of the release
clouds (AA-1, AA-2, and AA-7). F. T. Djuth of GRI served as principal investigator on
the AA-2 experiment; this release provided the focus for much of the analysis effort
The AA-2 experiment produced a variety of new and extraordinarily interesting results.
The first detailed examination of these results has been completed, and the principal
findings are described in a comprehensive journal article [Djuth et ai,J. Geophys. Res.,
in press, 1995]. In addition, close collaborations between personnel from the Naval
Research Laboratory (NRL) and GRI yielded an extensive publication dealing with the
AA-4 results [Bernhardt et al, J. Geophys. Res., in press, 1995], Radar data gathered by
GRI in support of experiments AA-3b, AA-1, and AA-7 have also been fully analyzed.
Journal publications on these three releases are pending; they will be submitted to
111

J. Geophys. Res. following the completion of data analyses by the respective principal
investigators. Finally, radar tests performed by GRI and Arecibo Observatory in support
of the El Coqid campaign yielded a powerful new diagnostic technique for studies ofnaturally occurring processes in the upper atmosphere [Djuth et aL, 1994], This spin-off
of the CRRES program is likely to have a significant and enduring impact on future
studies of the earth's atmosphere and near-space environment.
REFERENCES
Bernhardt, P. A., C. L. Siefring, P. Rodriguez, D. G. Haas, M. M. Baumback, H. A.Romero, D. A. Sollin, F. T. Djuth, L. M. Duncan, D. E. Hunton, C. J. Pollock,M. P. Sulzer, C. A. Tepley, L. S. Wagner, and J. A. Goldstein, The ionosphericfocussed heating (IFH) experiment,/. Geophys. Res., in press, 1995.
Djuth, F. T., M. P. Sulzer, and J. H. Elder, Application of the Coded Long-PulseTechnique to Plasma Line Studies of the Ionosphere, Geophys. Res. Lett., 21,2725-2728,1994.
Djuth, F. T., M. P. Sulzer, J. H. Elder, and K. M. Groves, The CRRES AA-2 release: HFwave-plasma interactions in a dense Ba+ cloud,/. Geophys. Res., in press, 1995.
IV

1. Overview of Results Obtained during the CRRES El Coqui Campaign
A general description of key results from all experiments conducted during the
El Coqui campaign is provided below. This is intended to be a concise summary of
campaign results. Particular attention is paid to experiments in which Geospace
Research, Inc. (GRI) had active participation. These include five of the original CRRES
investigations designated AA-4, AA-3b, AA-1, AA-7, and AA-2. The AA-2 barium
release was of primary interest to GRI. Detailed studies of data acquired during the
AA-2 and AA-4 experiments are presented in Sections 2 and 3, respectively. In
Section 4, Arecibo radar results from experiments AA-3b, AA-1 and AA-7 are described
and interpreted. Finally, an improved radar methodology was developed at Arecibo in
anticipation of the CRRES program. This yielded a great deal of "spin-off research in
the atmospheric sciences. The new radar technique and its applications are described in
Section 5
During the El Coqui campaign, GRI furnished a high-speed radar processor for
use with the Arecibo incoherent scatter radar and deployed a VHP radar interferometer
on the island of Antigua. All Arecibo radar data presented in this report were acquired
by GRI in collaboration with M. P. Sulzer of Arecibo Observatory. K. M. Groves
(Phillips Laboratory, Hanscom Air Force Base) also assisted in the collection of the
Arecibo radar data and in the deployment of a VHP radar system on Antigua. Essential
field support for the Antigua radar measurements was provided by J. W. Brosnahan
(LaSalle Research Corporation), who worked closely with GRI personnel.
1.1 Campaign Diagnostics
Arecibo Observatory in Puerto Rico hosted many of the experimenters and served
as a control center for most of the El Coqui chemical releases. Numerous groups
established field sites throughout the Caribbean basin to support various aspects of the El
Coqui project. Optical diagnostics were contributed by Arecibo Observatory, Los
Alamos National Laboratory (LANL), the Naval Research Laboratory (NRL), and the
Air Force Phillips Laboratory (PL). PL also supplied a KC-135 aircraft that was manned
with personnel from PL and SRI, International (SRII). The airplane was used to map out
irregularities in chemical release clouds with the aid of signals from satellite beacons. In
addition, the PL aircraft served as a platform for optics and radio wave sounding of the
ionosphere. Radars operating from HF to VHP were deployed and operated by Cornell
University, Geospace Research, Inc. (GRI), LANL, PL, and SRII. Finally, supplemental
radar processors were supplied by GRI and SRII to capture the full information content
1-1

of the Arecibo incoherent scatter radar and to furnish real-time data during several of the
chemical releases. Summary charts identifying the primary El Coqui diagnostics, the
principal investigators, chemical release payloads, and scientific objectives are presented
in Tables 1-3. Brief descriptions of the principal results of each experiment are presented
below.
1.2 AA-3a Experiment
The first launch of the campaign (rocket 18-224, L. M. Duncan/University of
Tulsa, P.I.) occurred at dusk on May 25. Two small canisters of Ba were explosively
released within the beam of the Arecibo HF facility at 251 and 271 km altitude. Each
canister contained 1.1 kg of Ba. The two Ba clouds were viewed optically, and the lower
of the two ion clouds was examined with the Arecibo incoherent scatter radar. This
experiment was designed to map out large-scale ionospheric structures produced by the
HF beam and provided the first glimpse of HF-induced Langmuir turbulence in a Ba+
plasma. The studies of induced plasma turbulence proved to be rather intriguing.
Initially very strong Langmuir and ion oscillations were detected in the Ba+ cloud.
However, after a short period of time (~15 s) these waves disappeared and the Ba+ cloud
effectively blocked the excitation of all HF-induced turbulence in the volume viewed by
the radar. After several minutes, a normal pattern of HF-excited waves was established
in the ionosphere. The total disappearance of the turbulence was completely unexpected
and is currently the subject of a highly focused study.
1.3 AA-4 Experiment
On May 30, the second rocket of the campaign was launched (rocket 36-065, P.
A. Bernhardt/NRL, P.I.). The payload consisted of a chemical canister and diagnostic
instrumentation used to measure the properties of the modified ionospheric plasma.
Approximately 30 kg of gaseous CF3Br were vented at 284 km altitude near the center of
the Arecibo HF beam. The purpose of the CF3Br was to generate an electron density
cavity in the ionosphere through dissociative attachment of free electrons. Once formed,
the ionospheric cavity was used as a refractive lens to focus the HF beam. This greatly
increased the power density of the beam near the point of HF reflection.
In Figure 1, backscatter power measured at 430 MHz with the Arecibo incoherent
scatter radar during the CF3Br release is displayed. The figure shows radar backscatter
power (color scale) versus altitude and time relative to the launch at 04:11:00 AST.
Radar power is expressed as a signal-to-noise ratio and plotted in dB; the ionospheric
backscatter power is directly proportional to the density of free electrons. The tilted
1-2

streak between 150 and 190 s is the rocket as detected through a high order sidelobe of
the radar beam. The chemical release occurred 170 s after launch. This figure illustrates
the development of the ionospheric hole immediately after the release. The radar beam
was pointed at the nominal release location for the first 312 s after launch; subsequently
the beam was scanned in azimuth to map out the perimeter of the hole. The small trail
extending from the rocket echo into the hole is thought to be backscatter from a piece of
rocket debris.
Other observations made with the incoherent scatter radar clearly showed the
subsequent intensification of HF-induced turbulence as the HF beam was focused. Radar
backscatter from the turbulence increased by two orders of magnitude once the hole
developed. An additional unanticipated discovery was made when in situ measurements
of electron density were examined. Shortly after the release, small-scale (~2 m) electron
density depletions developed in the plasma. The depth of some of the depletions relative
to the background was very large (>90%). The source of these irregularities is currently
unknown, but the mystery is likely to unravel as more data are examined.
A detailed discussion of the AA-4 experimental results is provided in Section 3.
1.4 AA3b Experiment
On June 6, rocket 36-064 (E. P. Szuszczewicz/SAIC, P. I.) was launched under
dawn moon-down conditions to study multi-ion expansion processes and their coupling
to the background ionosphere. Expanding clouds of Ba+ and Li+ with a mass ratio
similar to that found in the high-latitude polar wind were diagnosed by a suite of in situ»
particle and field detectors and supporting radar/optical systems on the ground. Four
canisters of chemicals were ejected from the mother payload, two parallel to the
geomagnetic field and two perpendicular to the field. In the first release event, 712 gm<
of Ba and 38 gm of Li were discharged in the middle of the Arecibo radar beam at 290
km altitude. This release provided cross-field diagnostics of ion expansion along the
geomagnetic field and surprisingly produced a decrease in radar backscatter rather than
an increase expected because of the rapid ionization of neutral Ba. The second release
occurred near ~350 km altitude where ion expansion parallel to the geomagnetic field
could be viewed along field lines; the chemical mixture was the same as the first. The
third release occurred on the downleg of the flight and involved the simultaneous
discharge of two canisters, each containing 1.5 kg of Ba and 19 gm of Sr. The
instrument package viewed the ionizing cloud as it expanded across the geomagnetic
field. Preliminary examinations of the in situ data indicate that "snowplowing" of O+
ions and forerunning Li+ ions may have been detected. In addition, there is clear
1-3

evidence of gyro-kinetic effects on a Saha-like ionization source (i.e., an "instantaneous"
ionization process that operates at the very earliest phases in the cloud's evolution).
The first release event occurred 180 s after launch. Approximately 712 gm of Ba
and 38 gm of Li were explosively released in the middle of the radar beam at 290 km
altitude. Surprisingly, this release produced a decrease in radar backscatter rather than an
increase expected because of the rapid ionization of neutral Ba. This result is described
in greater detail in Section 4.
1.5 NC-1 Experiment
Rocket 36-071 (M. C. Kelley/Comell University, P.I.) was launched on June 9 at
01:39 AST. The payload contained a group of sensors specially designed to diagnose
modifications to the natural ionosphere by the Arecibo high-power HF beam. The focus
of the observations was on Langmuir turbulence excited near the reflection point of the
HF radio wave. The rocket instrumentation detected packets of HF-induced ionospheric
irregularities both below and above the nominal height of HF wave reflection. Individual
irregularities had scale sizes in the range 20-30 m. Such medium-scale irregularities are
not readily measured with ground-based radar systems. The newly detected irregularities
are believed to play a central role in the evolution of HF-induced Langmuir turbulence,
and the experiment as a whole is expected to provide much needed guidance for ongoing
theoretical studies.
1.6 NC-2 Experiment
Rocket 21-105, (R. F. Pfaff/Goddard Space Flight Center, P.I.) was launched on
the evening of June 22. It contained a heavily instrumented payload that was used to
investigate sporadic-E plasma instabilities near 110 km altitude. Key in situ detectors
included electron density and electric field sensors and an ion mass spectrometer. In
addition to providing a detailed view of sporadic-E processes, the rocket payload also
measured an intriguing wave structure at higher altitudes near 130 km. Continuing
studies of this kilometer-size structure are likely to shed light on electrodynamic
processes in the midlatitude ionosphere.
1.7 AA-1 and AA-7 Experiments
The chemical canisters onboard rockets 36-082 and 36-083 (E. J. Weber/PL, P.I.)
were discharged at dawn near 255 km altitude on July 2 and 4. Optical observations
made from the Space Shuttle on July 4 yielded the first space-based images of a high-
1-4

altitude chemical release. Each release consisted of -22 kg of Ba and 276 gm of Sr with
the Sr serving as a dopant for diagnostic purposes.
Backscatter power measured with the Arecibo incoherent scatter radar during the
AA-1 Ba release is shown in Figure 2. Radar power (color scale) is displayed versus
altitude and time relative to 05:01:15 AST. The actual launch time was 3 s earlier. The
ionospheric backscatter power is directly proportional to electron density and inversely
proportional to the quantity [1 + Te/Tj], where Te and Tj are the electron and ion
temperatures, respectively. The radar beam was initially positioned at a zenith angle of
15° and at the azimuth of the nominal release location. The faint, tilted streak seen near
120 s relative time is the rocket as seen through a high order sidelobe of the radar beam.
The chemical release occurred at 138 s relative time at a point -10 km outside of the
radar beam. As expected, the Ba release produced a cloud of enhanced electron density
shortly after the release (red/yellow region on left). The dark shadowing seen to the left
and below the cloud is caused by a release-induced enhancement in the bulk temperature
of background electrons. The electron temperature enhancement is approximately
1400 K above the ambient electron and ion temperature (-750 K). The dark regions of
reduced radar cross section are dominated by background O+ ions; no evidence of Ba+ is
found in these regions.
At 212 s relative time, beam scans in azimuth were initiated to map out the Ba+
cloud. The radar beam is scanned out of the cloud and then back through it
(enhancement seen at right). The slight darkening of the blue background above the
cloud at right is caused by a reduction in electron density and an associated enhancement
in electron temperature. The reduction in electron density is believe to occur along
magnetic flux tubes behind the Ba+ cloud. The origin of the early time bulk electron
heating is not known. The late time density reductions may be related to electrodynamic
processes occurring in the plasma.
Results from the AA-7 release are shown in Figure 3. Radar backscatter power
(color scale) is displayed versus altitude and time relative to the launch at 04:58:00 AST.
The radar beam was initially pointed at a zenith angle of 15° and at an azimuth near the
actual release location. The release event occurred 141 s after launch. The tilted streak
seen between 130 and 160 s is the rocket as it passes near the main lobe of the radar
beam. Because of its proximity to the beam, the Ba release produced a cloud of
enhanced electron density that was immediately detected as the rocket moved to altitudes
above the release (red region on left). At 240 s, beam scans in azimuth were initiated to
map out the Ba+ cloud. The radar beam is scanned out of the cloud and then back
through it (enhancement seen at right). The slight darkening of the blue background
1-5

above the cloud at left and the more pronounced darkening above the cloud at right is the
same effect identified in Figure 2 (a reduction in electron density and an associated
enhancement in electron temperature). More detailed discussions focusing on the
depletions in radar cross section detected during AA-1 and AA-7 are provided in
Section 4.
1.8 AA-2 Experiment
The final release of the El Coqui campaign (rocket 36-081, F. T. Djuth/GRI, P.I.)
occurred at dawn (05:02 local time) on July 12. The purpose of the AA-2 experiment
was to study the interaction between a powerful radio wave and a high ion mass (137
amu), "collisionless" plasma. Approximately 35 kg of Ba doped with 148 gm of Sr,
260 gm of Eu, and 24 gm of Li were released near 252 km altitude. The expected yield
in Ba vapor was approximately 14 kg. This release was the largest of the CRRES
program. It occurred near the center of the Arecibo HF beam, which was tilted
northward over the Atlantic Ocean. AA-2 produced a distinctive ionospheric layer
having a maximum plasma frequency of -11 MHz. An extremely rich data set was
obtained with the Arecibo incoherent scatter radar. The primary results of this release
deal with microinstabilities excited in plasmas; these observations are discussed and
interpreted by Djuth et al. [1994],
Figure 4 shows electron density measurements made with the Arecibo incoherent
scatter radar during the AA-2 release. Electron density (color scale) is displayed as a
function of altitude and time relative to the launch at 05:02:00 AST. The radar beam was
initially positioned at the nominal release location at the center of the Arecibo high-
power, high-frequency (HF) beam. The light vertical streak seen near 150 s is the rocket
as viewed through a high order sidelobe of the radar beam. Light vertical streaks evident
near 100 km altitude are caused by echoes from meteor trails. The release event occurred
152 s after launch. The position of the radar beam remained fixed until 229 s after
launch; thereafter numerous azimuth and zenith angle scans were performed. Most of the
temporal structure seen over time scales of 100 s or less is caused by beam movements
across the cloud. Radar backscatter measured during the AA-2 experiment is shown on
an expanded altitudinal scale in Figure 5. The gradual descent of the cloud over time
scales of -500 s is the result of gravitational forces.
An extremely rich data set was obtained with the Arecibo incoherent scatter radar.
During the first two minutes after the release, the strongest ionospheric Langmuir
turbulence ever measured at Arecibo was detected in the Ba+ cloud. Moreover, the
underlying symmetry of the basic wave-plasma interaction disappeared. Asymmetries
1-6

between upgoing and downcoming plasma waves greater than 105 in power were
encountered in a process that theoretically should be symmetric. With the appearance of
short-scale field-aligned irregularities monitored with a mobile VHP radar, wave
symmetry was once again restored to the instability process. This experiment is expected
to foster new theoretical efforts in an area that was once considered to be well-
understood.
An in-depth discussion of the AA-2 results focusing on microinstabilities excited
in the plasma is provided in Section 2.
REFERENCES
Djuth, F. T., M. P. Sulzer, J. H. Elder, and K. M. Groves, The CRRES AA-2 release: HFwave-plasma interactions in a dense Ba+ cloud, J. Geophys. Res., in press, 1995.
1-7

NASA/CRRES El Coqui Radar/Radio Diagnostics
Organization
AO/NSF/Cornell University
Geospace Research, Inc.SRI, International
Los Alamos
NRL
Phillips Laboratory
Phillips Lab/SRII
Cornell University
Geospace Research, Inc.
SRI, International
Diagnostics
430 MHz Incoherent Scatter Radar(Line Feed and Horn Feed)
Supplemental Radar Processors, Arecibo
Bistatic HF Radar, TX:GuadeloupeRec: Providenciales and Grand Turk
Bistatic HF Radar (Channel Probe)TX: Guadeloupe, Ramay, Puerto RicoRec: Grand Turk, Sabana Seca, Puerto Rico
Digisonde, Ramay, Puerto Rico
KC-135 Aircraft, FLTSAT Downlinks, lonosonde
VHP Radar-Interferometer (CUPRI), St. Croix
VHF Radar-Interferometer, Antigua
HF Radar (FAR), Los Canos, Puerto Rico
Table 1
NASA/CRRES £/ Coqui Rocket Campaign
Launch Site: Tortuguero, Puerto Rico
Eight Rockets Launched in the Window May 18 - July 13,1992
Rocket Designation
AA-3a
AA-4
AA-3b
NC-1
NC-2
AA-1
AA-7
AA-2
Principal Investigator Launch Date/Time
L.M.Duncan/University of Tulsa May 25 Dusk
P. A. Bernhardt/NRL May 30 Before Dawn
E. P. Szuszczewicz/SAIC June 6 Dawn
M. C. Kelley/Cornell University June 9
R. F. Pfaff/GSFC June 22
E. J. Weber/Phillips Lab July 2
E. J. Weber/Phillips Lab July 4
F. T. Djuth/Geospace Research July 12
Post Midnight
Evening
Dawn
Dawn .
Dawn
Table 2

NASA/CRRES El Coqui Experiments
Experiment
AA-3a
AA-4
AA-3b
NC-1
NC-2
AA-1
AA-7
AA-2
Chemical Release
2 x 1.1 kg Ba
CF3Br, 30 kg
2 x (712 gm Ba, 38 gm Li)2x(1.5kgBa, 19gmSr)
None
None
22 kg Ba, 276 gm Sr
22 kg Ba, 276 gm Sr
35 kg Ba, 148 gm Sr260 gm Eu, 24 gm Li
Objectives
Tracer of HF-Induced IrregularitesExcitation of Langmuir Turbulence
Ionospheric Focussed Heating
Single- and Multi-ion ExpansionsParallel and Perpendicular to B
Diagnostics of HF ModificationsLangmuir Turbulence, Cavitons
Sporadic-E Instabilities
Early-Time Phenomena, Cloud Structuring
Early Time Phenomena, Cloud Structuring
HF Modifcation of a High Ion Mass,"Collisionless" Plasma
Table 3

Figure 1

Figure 2

4 July 1992, 84:58:80
SNR(dfi)
108.668 212.500 325.000
Tine (sec)
437.500 558.000
Figure 3

Figure 4

Figure 5

2. The CRRES AA-2 Release: HF Wave-Plasma Interactionsin a Dense Ba+ Plasma
The primary experiment conducted by Geospace Research, Inc. (GRI) during the
El Coqui campaign involved radar observations in support of the AA-2 release. This
release occurred on the last day of the campaign and yielded an extremely interesting
data set The principal diagnostics were the Arecibo incoherent scatter radar and a
mobile VHP radar-interferometer positioned on the island of Antigua by GRI. A detailed
description of the scientific results is provided in the article below. This paper is
currently in press in ihe Journal of Geophysical Research.
The CRRES AA-2 Release: HF Wave-Plasma Interactionsin a Dense Ba+ Cloud
F. T. DjutbJ, M. P. Sulzer2, J. H. Elderland K. M. Groves3
1 Geospace Research, Inc., 550 N. Continental Boulevard,El Segundo, CA 90245
2 Arecibo Observatory, Arecibo, Puerto Rico 00613
3 Phillips Laboratory, Hanscom Air Force Base, MA 01731
2-1
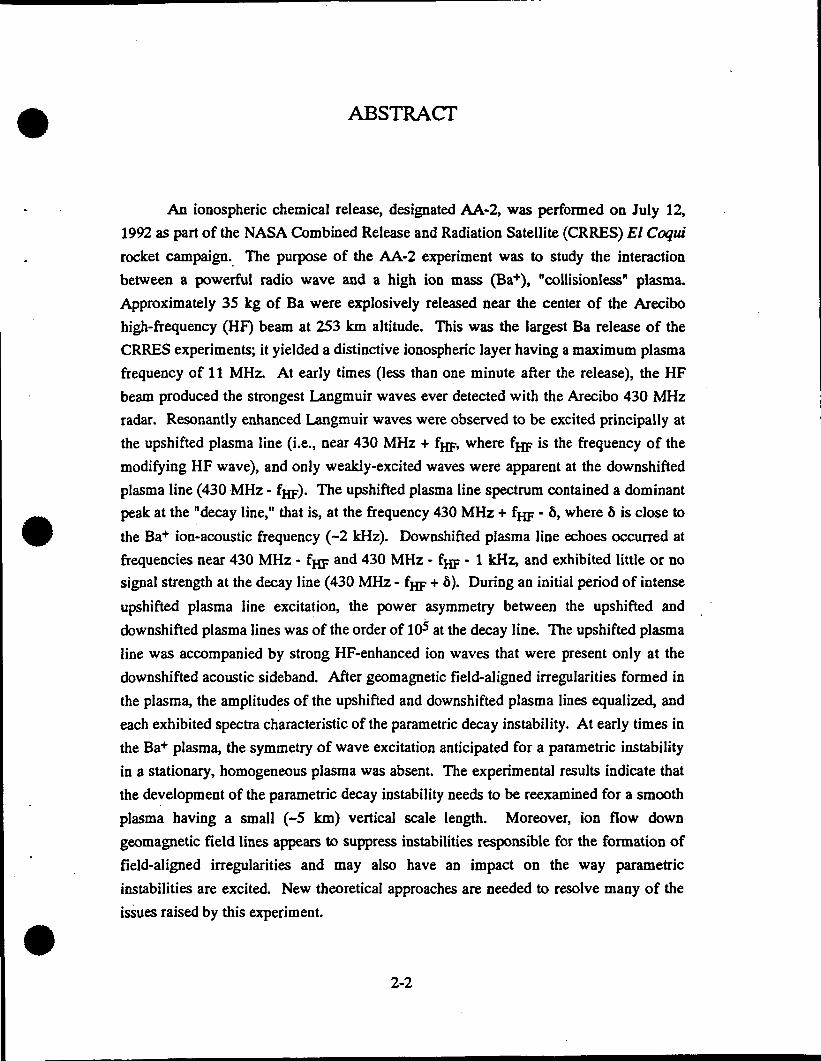
ABSTRACT
An ionospheric chemical release, designated AA-2, was performed on July 12,1992 as part of the NASA Combined Release and Radiation Satellite (CRRES) El Coqui
rocket campaign. The purpose of the AA-2 experiment was to study the interactionbetween a powerful radio wave and a high ion mass (Ba+), "collisionless" plasma.
Approximately 35 kg of Ba were explosively released near the center of the Arecibo
high-frequency (HF) beam at 253 km altitude. This was the largest Ba release of the
CRRES experiments; it yielded a distinctive ionospheric layer having a maximum plasmafrequency of 11 MHz. At early times (less than one minute after the release), the HF
beam produced the strongest Langmuir waves ever detected with the Arecibo 430 MHz
radar. Resonantly enhanced Langmuir waves were observed to be excited principally at
the upshifted plasma line (i.e., near 430 MHz + fjjp, where fjjp is the frequency of the
modifying HF wave), and only weakly-excited waves were apparent at the downshifted
plasma line (430 MHz - f^p)- The upshifted plasma line spectrum contained a dominantpeak at the "decay line," that is, at the frequency 430 MHz + fjjp - 6, where 6 is close to
the Ba+ ion-acoustic frequency (~2 kHz). Downshifted plasma line echoes occurred atfrequencies near 430 MHz - f^p and 430 MHz - fjjp - 1 kHz, and exhibited little or nosignal strength at the decay line (430 MHz - fjjp + 5). During an initial period of intense
upshifted plasma line excitation, the power asymmetry between the upshifted and
downshifted plasma lines was of the order of 105 at the decay line. The upshifted plasma
line was accompanied by strong HF-enhanced ion waves that were present only at the
downshifted acoustic sideband. After geomagnetic field-aligned irregularities formed in
the plasma, the amplitudes of the upshifted and downshifted plasma lines equalized, and
each exhibited spectra characteristic of the parametric decay instability. At early times in
the Ba+ plasma, the symmetry of wave excitation anticipated for a parametric instability
in a stationary, homogeneous plasma was absent. The experimental results indicate that
the development of the parametric decay instability needs to be reexamined for a smooth
plasma having a small (-5 km) vertical scale length. Moreover, ion flow down
geomagnetic field lines appears to suppress instabilities responsible for the formation of
field-aligned irregularities and may also have an impact on the way parametric
instabilities are excited. New theoretical approaches are needed to resolve many of the
issues raised by this experiment.
2-2

1. Introduction
The NASA Combined Release and Radiation Effects Satellite (CRRES) program
consisted of a Pegasus-borne small satellite launched in April 1990, the principal
spacecraft launched on an Atlas Centaur vehicle in July 1990, and two rocket campaigns:
one from Kwajalein Atoll, Marshall Islands (August, 1990) and one from Puerto Rico
(summer, 1992). All of the launch vehicles contained chemical payloads that were
released in the ionosphere or magnetosphere. Results from the high-altitude releases are
described in a review by Bernhardt [1992]. The Puerto Rico, or El Coqui, rocket
campaign consisted of eight rocket experiments launched from Tortuguero, Puerto Rico
during the period May 18 through July 13,1992. Six of the rocket launches involved the
release of chemicals in the ionosphere north of Arecibo Observatory, Puerto Rico. Of
these, two entailed the modification of a Ba+ plasma by transmissions from the Arecibo
high-power, high-frequency (HF) facility, located 17 km northeast of Arecibo
Observatory. Initial results from the largest of these two chemical releases, designated
AA-2, are presented below.
The objective of the AA-2 experiment was to explore the interaction between a
high-power HF beam and a high ion mass (Ba+, 137 amu) plasma under conditions of
low electron collisions. In addition, a moderate plasma scale length H* n0/[dne(z)/dz]
was highly desirable, where ne(z) is electron density as a function of altitude z and r^ is
the electron density at the point of reflection of the HF wave. Scale lengths of the order
of 2 - 20 km were anticipated on the bottomside of the B+ plasma cloud. The experiment
design focused principally on the development of microinstabilities in the plasma.
Originally, it was believed that it might be possible to suppress the parametric decay
instability [e.g., Fejer, 1979] in a Ba+ plasma and permit preferential growth of the
oscillating two-stream instability. Such conjectures were made prior to the application of
the strong Langmuir turbulence theory [DuBois et al., 1990; DuBois et al., 1991;
Hanssen et al., 1992] to HF ionospheric modification experiments in the natural
ionosphere at Arecibo. Subsequent experiments at Arecibo confirmed certain elements
of the strong turbulence approximation [e.g., Fejer et al., 1991]. In light of a rapidly
changing understanding of the HF modification process, the predicted outcome of the
Ba+ modification experiment became far less certain.
Prior to the AA-2 release, HF modification experiments had been performed in
natural sporadic E regions [Gordon and Carlson, 1976; Djuth, 1984; Schlegel et al.,
1987; Djuth and Gonzales, 1988]. In midlatitude sporadic E, Fe+ ions having relatively
2-3

high mass (56 amu) often dominate the plasma. However, unlike the AA-2 experiment,
electron collision frequencies are quite high (10-30 kHz), and vertical and horizontal
electron density scale lengths are extremely small (H= 100 - 500 m). Indeed, the plasma
parameters of sporadic E give rise to HF wave-plasma processes that are significantly
different than those encountered at higher F-region altitudes [Djuth and Gonzales, 1988].
In general, the AA-2 experiment has no real analog in the natural environment; it
provides a unique view of wave-plasma interactions in a previously unexplored plasma
medium.
2. Experiment Description
Throughout this paper, time is referenced either to the launch of the AA-2 rocket
at 05:02:00 AST on July 12,1992 or to the time of the AA-2 chemical release. Both the
HF facility operations and the data acquisition activities were closely tied to the launch
time, whereas many of the experiment events were linked to the release time. When an L
or an R is appended to a time, it designates the temporal reference (launch or release,
respectively). For consistency, the times displayed in all figures are referenced to the
launch time.
The AA-2 chemical release occurred approximately 152 s after launch at
05:04:32 AST. At this time, the solar depression angle was 12.2° at the release altitude
(253 km); this permitted rapid ionization of the neutral barium cloud while preserving
dark viewing conditions at ground level for optical observations. AA-2 entailed the
explosive release of approximately 35 kg of Ba, doped with 148 gm of Sr, 260 gm of Eu,
and 24 gm of Li to facilitate ground-based diagnostic measurements. This was the
largest chemical release of the CRRES program. The chemicals were carried in six,
rocket-borne canisters which were simultaneously discharged within the 3-dB power
contour of the Arecibo high-power HF beam. All HF transmissions made during the
AA-2 experiment were at an effective radiated power (ERP) of 60 MW with O-mode
polarization. An overview of the release geometry and the locations of several essential
ground sites is provided in Figure 1. The Arecibo HF beam was tilted 12° from vertical
in the direction of geographic north to accommodate restrictions placed on rocket flight
trajectories. The tilt was achieved through time-delay phasing with fixed delay lines. A
frequency of 5.1 MHz was selected for El Coqui HF experiments because it satisfied all
program requirements and yielded a favorable impedance match between the HF
transmitter and antenna. The AA-2 release occurred approximately 14km south-
southeast of the center of the HF beam.
2-4

The AA-2 release point, like many of the El Coqui campaign chemical releases,
was positioned well inside the viewing limits of the Arecibo radar beam (i.e. within 20°
of the zenith). The 430 MHz radar was the principal diagnostic for AA-2 studies of
plasma turbulence. Additional measurements were made with a wide variety of optical
instrumentation, HF bistatic links that penetrated the release volume, and with a VHP
radar-interferometer positioned on the island of Antigua. The VHP radar was tuned to
49.92 MHz, and was used to detect HP-induced geomagnetic field-aligned irregularities.
The current work focuses primarily on results obtained with the 430 MHz radar.
In support of AA-2, special efforts were made to fully exploit the information
available with the Arecibo incoherent scatter radar. The observing program was
designed to provide wideband spectral information without compromising altitude
resolution or system sensitivity. Three types of phase-coded radar pulses were
employed. These included a 13-baud Barker-coded pulse (BKR) having a baud length of
4 (is; a three-baud Barker-coded pulse (l-(is bauds), referred to as a coded short pulse
(CSP); and a 512-baud, pseudo-random phase-coded pulse (l-(ts bauds), genetically
termed a coded long-pulse (CLP). The three pulses were cyclically transmitted within a
"frame time" of 30 ms. A frame consisted of three 10 ms interpulse periods (IPPs), one
for each type of pulse. Throughout the experiment period, ionospheric backscatter from
each radar pulse was simultaneously sampled at the radar center frequency (430 MHz)
and across both "plasma line" sidebands (430 MHz ± fjjp), where f^p is the frequency
of the HF transmissions (5.1 MHz). The plasma line bandpasses were centered near 430
MHz ±5.1 MHz. Appropriate filters were selected to optimize measurements made with
a particular type of pulse. The spectral bandwidths of the data channels ranged from
250 kHz on the BKR ion line to 2 MHz at the downshifted CLP plasma line. The three
pulse types were used to extract different kinds of information about the processes
occurring in the Ba+ plasma. Power profile (i.e. power versus range) measurements
made with the BKR pulse had the best detection sensitivity with moderately good altitude
resolution (600 m). Better altitude resolution (150 m) and wideband spectral information
were obtained with the CLP with some loss of sensitivity when signals were strong. The
CSP yielded power profile measurements with good range and temporal resolution when
strong HF-enhanced plasma lines/ion lines were present.
An important feature of the AA-2 radar data-taking program was that raw,
unintegrated voltage samples were preserved on all data channels throughout the
experiment period (~ 45 min). This made it possible to optimize temporal integration
periods after the fact, change digital processing techniques as desired, and examine radar
returns on a pulse-by-pulse basis to explore interesting events.
2-5

3. Observations
The background F-region just prior to the AA-2 release had a peak plasma
frequency of ~8 MHz at a height of 345 km. As noted earlier, the release occurred at
~253 km altitude at 05:04:32 AST on July 12, 1992. The Arecibo HF facility made
continuous transmissions for 30 min prior to the release; it was operated at an effective
radiated power (ERP) of -60 MW and tuned to a frequency (f^p) of 5.1 MHz. The
height of the HF-excited Langmuir waves and ion waves provided a convenient and
continuous calibration of the electron concentration profile. HF-enhanced backscatter
detected with the Arecibo 430 MHz radar occurs relatively close to the so-called critical
altitude, that is, near the altitude at which fep = f^p. where fep is the electron plasma
frequency. With fjjp = 5.1 MHz, the critical layer has an electron concentration of
32 x 105 cm'3. One of the go/no-go launch criteria required that the critical layer in the
natural ionosphere be located above the projected release altitude. This was done to
ensure that the HF beam would undergo total reflection in a predominantly Ba+ plasma.
At the time of release, the background electron concentration at the discharge height was
1.6 x 10s cm-3.
Ba Ion Cloud Formation
At 151.9 s into the AA-2 flight, six chemical canisters were simultaneously
ignited producing a spherically expanding neutral cloud centered on the rocket. The
thermite consisted of a Ti/B mixture successfully used in other CRRES releases. At the
time of release the rocket was at 252.5 km altitude, and its speed was 1.486 km/s. The
westward, northward and vertical components of the rocket velocity were 0.182 km/s,
0.313 km/s, and 1.441 km/s, respectively. A thermite release of this type produces shells
of neutral gas that expand radially relative to the rocket velocity. During prior CRRES
releases involving the Ba/Ti/B mixture [e.g., Bernhardt et ai, 1993], the mean radial
expansion speed was found to be -1.4 km/s with a thermal spread of roughly ± 03 km/s
relative to the mean. The AA-2 release canisters contained a total of 35.3 kg Ba, 148 g
Sr, 260 g Eu, and 24 gm Li. The vaporization efficiency is estimated to be -40%, based
on test measurements from rocket-borne Ba/Ti/B releases at Wallops Island, VA. For the
AA-2 experiment, the predicted yield is ~6 x 1025 atoms of Ba vapor. Under full solar
illumination of the cloud at UV wavelengths between 310 and 200 nm, the Ba ionization
time constant is 28 s [e.g., Carlsten, 1975]. Because the neutral Ba cloud becomes
optically thin within a few seconds of the release, one expects the cloud as a whole to
ionize with an e-fold time of about 30 s.
2-6

During the AA-2 release period, optical viewing conditions from many ground-
based sites were poor because of the passage of a tropical wave across the Caribbean.
This prevented accurate inventories of Ba+ ion production from being performed, as had
been done in many of the prior CRRES releases. Additionally, cloud cover hampered
efforts aimed at determining the expansion velocity of the neutral cloud experimentally.
Optical measurements at Arecibo Observatory were made under hazy observing
conditions, with cloud cover occasionally obscuring the release. This notwithstanding,
the optical data showed that the Ba cloud development was not unlike that observed in
the past for a release of this type. The spherically expanding neutral cloud became
almost completely ionized over a time scale of ~1 min, and, as expected, the resulting
Ba+ cloud was aligned with the geomagnetic field. The fully-developed ion cloud
appeared to be smooth with no evidence of field-aligned irregularities. At the release
altitude, the ion-neutral collision frequency and the background neutral wind speed
(~50 m/s) were low. Under these conditions, the gradient drift instability is expected to
give rise to, at most, very weak striations in the cloud over long time scales (tens of
minutes).In Figure 2, the AA-2 release event recorded with the Arecibo 430 MHz radar is
illustrated with BKR data acquired at the ion line. The range-corrected ion-line power is
proportional to ne/[l + Te/Tj], where ne is electron density, and Te and Tj are electron
temperature and ion temperature, respectively. Photoelectron-enhanced plasma lines
similar to those in the natural daytime ionosphere [e.g., Djuth el aL, 1994] were not
detected in the Ba+ cloud with the CLP technique. During AA2, the photoelectron phase
energies (i.e., E^ = V£ mev^2, where v^ = Vi fr X, fr is plasma wave frequency, and X is
radar wavelength) monitored with the 430 MHz radar ranged from 5.8 to 12.9 eV.
However, determinations of absolute electron density before and after the release were
aided by the presence of strong HF-enhanced ion waves and Langmuir waves. The
height of these enhancements is close to the 3.2 x 105 cm'3 point in the plasma. Errors
associated with this calibration technique are dictated primarily by the detailed
microphysics of the excitation process. In general, HF-enhanced backscatter observed at
Arecibo occurs between the critical altitude, where t^, = fj^?, and the so-called "matching
altitude," where the Langmuir wave frequency (determined by the linear dispersion
relation) is approximately equal to fjjp [e.g., Fejer el aL, 1991]. For the electron
temperatures measured during the AA-2 experiment, the electron density at the matching
altitude is calculated to be -4-5% less than the density at the critical layer. This type of
calibration is available in the natural ionosphere prior to the release and in the Ba+ cloud
for approximately 300 s after the release.
2-7

The critical layer observations are augmented by measurements of Te/Tj obtained
in the natural F region and in the Ba+ plasma. These measurements allow the electron
density profile to be calculated at altitudes far away from the critical layer and at times
when no HF-enhanced waves are present. In the Ba+ cloud, it is extremely difficult to
make an accurate determination of Te/Tj because of the potential presence of two ions
(O+, Ba+) of dissimilar mass, and because of significant vertical gradients in electron
concentration. To obtain Te/Tj in this environment, we must rely on the CLP ion line
observations, which are severely clutter-limited. The clutter is generated by the Ba+
cloud itself and the overlying F layer. Our approach to this problem is to measure Te/Tj
near the peak of the Ba layer, where the signal-to-clutter ratio is greatest We then
assume that this ratio does not vary markedly at other altitudes within the cloud because
of the importance of electron heat conduction along the magnetic field. The necessary
temperature data were obtained by integrating the ion line spectrum across a 7.2 km
altitude interval (48 consecutive range gates) for a time period of 6 s (200 radar pulses).
Precautions were taken to avoid HF-enhanced ion lines on the bottomside of the Ba+
cloud. Our studies indicate that Te/Tj was -1.1 prior to the release at 253 km altitude but
increased to 1.8 at 173 s L (21 s R) and 2.2 at 225 s L (73 s R). Incoherent scatter
spectra from the release cloud were analyzed assuming 100% Ba4 ions. Electron
concentration values obtained from measurements of the critical altitude were found to
be consistent with values calculated under the assumption of constant Te/Tj ratio
throughout the Ba+ cloud.
In Figure 2, the light vertical streak/speckles seen near 150 s L is the rocket as
viewed through a high order sidelobe of the radar beam. Temporal changes in the
structure of the Ba cloud are caused mostly by changes in the pointing direction of the
radar beam. For the first 228 s after launch, and at all times prior to launch, the 430
MHz beam was pointed at the center of the HFbeam at a nominal altitude of 250 km (see
Figure 1). The radar beam was then moved across the Ba cloud in an effort to adjust for
the ~14 km horizontal displacement between the projected release point and the actual
one. Concurrent efforts were made to spatially map out the locations of resonantly-
excited Langmuir and ion waves. In addition, continuous pointing adjustments were
made to keep the radar beam on a critical surface in the Ba cloud as the cloud drifted
toward the perimeter of the HF beam. Optical data indicated that the cloud drifted
toward the northwest at an average speed of -50 ± 5 m/s. A similar value was obtained
from incoherent scatter radar measurements of F-region ion drifts made 45 min before
the release. Moreover, VHP radar observations of the drift speed of HF-induced
F-region irregularities were made from Antigua throughout the experiment period. This
2-8

radar had a line-of-sight directed towards the northwest Just prior to the release, the
radial drift speed of irregularities near 270 km altitude was measured to be 47 m/s
± 3 m/s.
The location of the radar beam versus time after launch is shown in Figure 3. An
altitude of 240 km was selected for the horizontal projection of position because the
majority of the resonantly enhanced Langmuir/ion waves were detected near this height
The only exception comes during a ~60-s period following the release. Resonant waves
are first detected in the Ba+ plasma near 250 km altitude but then rapidly move
downward to the 240-km level. Once the beam motion is initiated, beam locations are
indicated with the symbol (+) at 12-s intervals. Temporal integrations (12 s in duration)
centered on these times were used to construct the temporal evolution of the electron
density profile shown in Figure 4. Forty profiles are shown beginning with the launch of
the rocket. In this data display, strong HF-enhanced ion lines are apparent near 272 km
prior to the release. An echo from the rocket is also evident in the integration period just
before the release. The Ba plasma initially expands over a 30-km altitude interval. Once
the cloud is fully formed, it slowly sinks in altitude at the rate of -25 m/s.
The BKR ion line data of Figure 4 can be combined with CLP observations of the
HF-enhanced plasma line and ion line to determine the temporal history of the critical
altitude. As noted above, the critical altitude can be accurately established using resonant
ion line enhancements and/or enhancements measured at either of the two plasma lines.
Enhanced plasma lines generally provide signals having the greatest strength, whereas
the weaker ion line enhancements offer the convenience of having the enhancements
embedded in the power profile used to determine electron concentration versus height.
Throughout the AA-2 experiment period, the power at the upshifted plasma line
was either comparable to or much greater than the power measured at the downshifted
line. This made the upshifted plasma line preferable in determining critical layer height.
Figure 5 shows backscatter power at the upshifted plasma line versus altitude and time
after launch. The altitude resolution of the measurements is 150 m. Notice that the echo
detected in the natural F region prior to the release at 152 s is structured and spread in
altitude. This is caused by HF-induced electron density irregularities that form in the
plasma [e.g. Djuth et al., 1990]. From the time of the rocket launch to the release 152 s
later, the HF-enhanced waves are detected over the altitude range of -272 km ± 1.8 km.
Enhancements are observed near altitudes where critical points exist in the plasma (i.e.,
the altitude at which fep = f^p, where fep is the electron plasma frequency). In this
irregular environment, it is difficult to determine whether the observed enhancements
occur exactly at the critical point or at locations where the frequency matching condition
2-9

is satisfied for weakly-driven parametric instabilities. The matching condition can be
expressed as
co?-a>2p + smVc+^^-4p (1)
where o>r is Langmuir wave frequency, u>ep and coec are the electron plasma frequency
and electron cyclotron frequency, respectively, 6 is the angle between the radar line-of-
sight and the geomagnetic field, k is radar wavenumber, Te is electron temperature, me
is electron mass, and Boltzmann's constant is represented as K. This situation is
complicated by the fact that Langmuir waves propagating in geomagnetic field-aligned
irregularities can satisfy (1) at multiple locations along a single irregularity [e.g.,
Muldrew, 1978a]. As noted above, electron density at the matching height is -4-5% less
than that at the critical altitude.
The presence of HF-induced irregularities within the Arecibo radar beam
(-800 m diameter at 272 km altitude) gives rise to most of the altitude spread in the
observed enhancements. Additionally, the 15° tilt of the radar beam from zenith
generates a small amount of false altitude spread. The radar wavefront subtends an
altitude interval of -200 m because of its finite beamwidth. Given the measured scale
length H=40 km near the critical point, perturbations with a maximum variation of 8%
relative to the background profile would produce the observed 3.6 km spread in the
enhanced plasma line.
Following the Ba release at 152 s L, a discontinuous step downward in plasma
line altitude is evident in Figure 5. This corresponds to the formation of a critical layer
within the Ba cloud. The plasma line altitude rapidly decreases during the first minute
after the release. During this period the size of the Ba+ cloud is increasing in all
directions as the neutral Ba gas becomes fully ionized. At times greater than about 240 s
L the plasma line echo is observed to fade in and out several times. This is primarily the
result of the HF pulsing program employed during the AA-2 experiment (discussed
below). Changes in the plasma line height after 228 s L arise because of the movement
of the radar beam across the Ba+ cloud (see Figure 3).
Prior to the Ba release, enhanced ion lines were readily detected in the natural F
region with BKR pulses (Figure 4). Detectable BKR enhancements were also evident in
the Ba cloud during the first 120 s after the release. The altitude and temporal scales of
the data presented in Figure 2 are greatly expanded in the display of Figure 6. In
Figure 6, HF-enhanced ion lines are clearly evident on the bottomside of the Ba+ cloud.
The ion line enhancements are generally confined to a single 600-m range cell at any
2-10

given time. These echoes are not evident in Figure 4 because of the long (12-s) temporal
integrations used for that presentation. During a 12-s period, the enhanced ion line
backscatter is distributed across many range cells, and as a result, sharp peaks cannot be
discerned in the profiles.
The temporal history of the critical altitude, its vertical velocity, and the
ionosphere scale length H at the critical altitude is plotted in Figure 7. The critical
heights were determined from both the 430 MHz ion line observations (Figures 4 and 6)
and resonant enhancements at the upshifted plasma line (Figure 5). In the former case,
HF-enhanced ion lines were used to define the critical layer prior to the release at
152 s L. After the release, the combination of HF-enhanced ion lines and election
concentration profiles were used. Each profile was least-squares-fit to a cubic so that the
critical height could be accurately determined. As expected, the ion line and plasma line
observations yielded similar results. However, the upshifted plasma line data provided
the best measure of the critical altitude and its rate of change in the Ba+ cloud because of
the strong echoes and better range resolution of the plasma line observations.
It is presumed that the vertical velocity of the critical layer is equal to the rate of
change in the ion/plasma line altitude. Because the radar beam was pointed at 15° zenith
angle, this entails an implicit assumption that the vertical gradient is dominant in the Ba+
plasma. In Figure 7, vertical velocity in the Ba+ plasma is shown only at times when the
430 MHz beam is stationary. During beam scans, erroneous values are generated by
even mild gradients across the Ba+ cloud.
The scale length H plotted in Figure 7 was determined from the first derivative of
the fitted electron density profile at the critical height. In the Ba+ cloud, the scale length
at the critical layer ranges between 4 and 6 km throughout the period of observations.
This contrasts markedly with the scale length encountered in the natural ionosphere prior
to the release (~40 km).
HF-Induced Plasma Turbulence
The temporal history of the HF-induced backscatter at the plasma lines is
presented in Figure 8 beginning 100 s after launch. CLP measurements were chosen for
this display because they have good sensitivity in the time domain. The total power
received at the upshifted plasma line, PL+ (430 MHz + fj^?), and the downshifted plasma
line, PL- (430 MHz - fjjp), is plotted in the figure as a signal-to-noise ratio. Because the
CLP bandwidths of the PL- and PL+ channels were 2 MHz and 1 MHz, respectively, the
total noise power in the PL- channel was roughly twice that of the PL-*-. The PL- results
presented in Figure 8 have been compensated for this disparity in plasma line noise level
2-11

and for differences in the gain of the Arecibo line feed system at 430 MHz - fjjp and
430 MHz + fjip- Thus, the relative strength of PL+/PLr backscatter from Langmuir
oscillations is accurately represented in the figure. Prior to the release at 152 s L, the
PL+ and PL- power levels in the natural ionosphere are approximately the same.
Following the release, it is clear that a large asymmetry develops between the two plasma
lines.
Modes of HF facility operation are indicated at the bottom of Figure 8. They
include continuous wave transmissions (CW), high duty cycle pulsing (HD), low duty
cycle pulsing (LD), and 2-s periods of no transmissions. All transmissions were at a
level of 60 MW ERP. The HD mode consisted of the repetitive transmission of 1.595-ms
pulses within an interpulse period of 1.995 s. The unusual period (1.995 s) was chosen
so that the Arecibo 430 MHz radar (restricted to a 30 ms frame time) could probe the
Ba+ plasma over a range of times (separated by 5 ms) relative to HF turn-on.
Transmissions designated LD employed 195-ms pulses followed by HF-off periods of
1800 ms. In the current study, only plasma line data acquired under CW conditions are
presented.
Extremely strong HF-enhanced plasma lines were detected at the upshifted
plasma frequency (430 MHz + fjjp) during the AA-2 release. The largest echoes
occurred during two periods: 175-230 s L (23 - 78 s R, period PI) and 278 - 291 s L (126
-139 s R, period P2). Indeed, in terms of absolute signal strength in the spectral domain,
these periods include the strongest enhanced plasma line echoes ever recorded at
Arecibo. The largest signals measured at the decay line are approximately 10 times
greater than those detected at the peak of the plasma line "overshoot" in the natural
F region with 80 MW HF ERP [e.g. Djuth et aL, 1986]. During PI, echoes at the
downshifted plasma line (430 MHz -fjjp) are not visible in the time domain display of
Figure 8. However, spectral analyses reveal very weak echoes at the downshifted plasma
line throughout this time interval. During P2, significant enhancements at the
downshifted plasma line are observed for the first time. At this stage in the experiment,
the power levels of the downshifted plasma line enhancements are approximately 20
times less than those at the upshifted line. Strongly enhanced ion lines are present
throughout PI and P2; the strength of the ion-line enhancements is closely correlated
with PL+ amplitude.
The appearance of the downshifted plasma line enhancements at 283 s L
coincided with the first detection of HF-induced, geomagnetic field-aligned irregularities
in the Ba+ cloud. A VHF radar-interferometer sensitive to irregularities having a spatial
scale of 3-m across geomagnetic field lines (discussed in Section 2) was used to make
2-12

this measurement The VHP radar was deployed on the island of Antigua, where it had
an optimum viewing geometry for detection of field-aligned irregularities at -250 km
altitude in the Ba+ cloud. The formation of such irregularities may in fact be responsible
for the equalization of the upshifted and downshifted plasma line power after 340 s L
(188 s R). This situation is not unlike that encountered in the natural F region at
Arecibo. Indeed, prior to the release at 152 s L, strong echoes from HF-induced field-
aligned irregularities were detected in the natural ionosphere near 272 km altitude.
As noted in Section 2, the principal purpose of the CLP observing program was to
provide wideband spectral coverage with good altitude resolution (150 m). Throughout
the experiment period, simultaneous CLP measurements were made at the PL-, PL+, and
ion line across spectral bandwidths of 2 MHz, 1 MHz and 1 MHz, respectively. All
spectral observations displayed in the present work have been corrected for the
frequency-dependent response of the Arecibo line feed. Correction factors relative to
PL- have been applied to signals at PL+ and the ion line. The intrinsic frequency
resolution of the spectral measurements as determined by pulse width (512 (is) is 1.95
kHz. However, the Fast Fourier Transforms (FFTs) used to compute spectra displayed
below have been zero-padded to fill a 1024-us window. This yields a point separation of
0.98 kHz, which allows the positions of very sharp spectral peaks to be more easily
located. However, only points separated by 1.95 kHz are statistically independent.
During period PI, the altitude band of plasma wave and ion wave enhancements
quickly decreased with time. At any given moment, the strongest echoes in all three
frequency bands generally occurred in the same 150-m altitude cell. An example of the
plasma line/ion line enhancements typically observed in the Ba+ cloud during PI is
presented in Figure 9. The spectra shown in the figure have been truncated in frequency
for display purposes. No other spectral features were present in the PL+, PL-, and ion-
line bands. The peaks of the signals are represented as signal-to-noise ratios, where the
noise power is the sum of contributions from the sky and the radar receiver system. If
this were the only contribution to the random fluctuation level, one would expect the
mean spectral baselines to lie close to a signal-to-noise ratio (S/N) of 0 dB. However, a
"noise-like" clutter contribution is generated by the CLP technique [Sulzer, 1986]
because of the presence of signals at other radar ranges. This technique randomizes
signals at unwanted ranges and thereby converts them into "white noise" at the decoded
radar range. The resulting signal-to-clutter ratio is not indicative of absolute signal
strength. At the ion line, signal-to-clutter ratios may be quite small, depending on the
relative amplitudes of signals at other ranges. For weak signals having signal-to-clutter
ratios less than unity, the statistics are governed by the clutter fluctuations. A pedestal
2-13

near 20-dB signal-to-noise ratio is evident at the PL+ in Figure 9. This is the combined
effect of the spectral windowing function and CLP clutter from other radar altitudes. At
the ion line, the "noise" baseline is elevated above 0 dB S/N. This is due to clutter
produced by incoherent scatter returns from the Ba+ cloud and overlying F region. The
downshifted plasma line is very weak and has no clutter contributions from other radar
ranges; its baseline lies at 0 dB S/N.
The spectral observations shown in Figure 9 were taken from the 242.34 km
altitude cell containing the strongest signals at 188.5 s L. In general, the upshifted
plasma line exhibits a large spectral peak offset from (430 MHz + ffjp) by -2.0 ±
03 kHz. This corresponds to the expected location of the "decay line" [e.g. Showen and
Kim, 1978] in the barium plasma. If excited, decay lines appear at 430 MHz ± (f^p - 6),
where 5 is approximately equal to the ion-acoustic frequency. The enhanced ion line
exhibits a single peak displaced from 430 MHz by -1.4 ± 0.4 kHz. At the downshifted
plasma line, a very weak peak is often present exactly at 430 MHz - f^p However, this
weak feature may also be found at 430 MHz - fjjp -1 kHz. At the frequency offset of the
decay line (6~2 kHz), the power asymmetry between the signals at PL+ and PL- is -105.
In the past, power asymmetries of this magnitude have not been encountered during any
HF modification experiments conducted in the natural ionosphere at Arecibo. This
includes observations made in the F region, the E region and sporadic £ [e.g., Djuth et
al, 1986; Djuth, 1984; Djuth, 1979],
Altitude-resolved spectra at 188.5 s L are presented in Figure 10. At this point in
the experiment, the PL+ was confined to a total of four range cells, whereas the PL- and
ion line scatter were restricted to one or two cells at most. The 430 MHz radar beam was
stationary and pointed 15° from vertical. The altitude extent of the PL- and ion line
scatter must therefore be very small because the 15° tilt of the radar wavefront, in itself,
introduces an altitude smearing of -180 m at 242 km altitude. A short data integration
period (300 ms) was chosen for Figure 10 because the echoes were rapidly descending in
altitude. For presentation purposes, we selected a data segment where the strongest PL+
echo was centered on single range cell. The strength of all signals vary somewhat (a
factor of ~3 in power) from one 300-ms integration period to the next. In part, this is a
product of the scattering statistics and the occasional sharing of signal between two range
cells. However, slow variations in mean signal strength over time scales of 1-2 s account
for about half of the power fluctuation.
The result of efforts to improve the signal statistics at the ion line by lengthening
the integration time to 3 s (100 pulses) is shown in Figure 11. For the purpose of
comparison, the integration period was centered on the time of the observations in
2-14

Figure 10. It is clear that the random fluctuations from the clutter are reduced, but the
enhanced ion line has now crossed three range cells. This limits the signal integration
time at any given range cell to about 300 ms. The weak scatter centered near zero
frequency displacement at the highest and lowest ranges is caused by incoherent scatter
from the unmodified Ba+ cloud
An example of spectra obtained during period P2 (278 - 291 s L) is presented in
Figure 12. At this juncture of the experiment, the rapid altitude decline of the
enhancements has halted, and therefore longer integration periods could be employed.
Moreover, data were selected from a time interval centered on 285.0 s L when the radar
beam was stationary. This avoids range smearing of signals as the beam scans across
spatial gradients in electron concentration. Moderate to large echoes are present at both
the PL- and the PL+ in Figure 12. As in Figure 10, the plasma line enhancements are
confined to 4-5 altitude cells. Convincing ion line enhancements are present in only two
altitude cells (239.79 km and 239.94 km); the weak signals at other altitudes are caused
by incoherent scatter from the Ba+ plasma. The PL+/PL- power asymmetry noted earlier
is still present at a somewhat reduced level. Decay line peaks at -2 kHz offset from 430
MHz + fur are prevalent in the PL+ spectra, but the PL- spectra exhibit peaks at larger
offsets (3-5 kHz) from 430 MHz - f^-
In Figure 13, altitude-resolved spectra are shown at a later stage in the experiment
(340.8 s L) when the resonant backscatter at PL+ was comparable to that of the PL-. At
340.8 s L, weak ion-line signals may be present in a few ranges, but these detections are
far less convincing than those shown earlier. Because the radar beam was steered toward
the center of the Ba+ cloud, the CLP clutter level at the critical altitude increased
markedly. This made it difficult to detect features such as the unmodified Ba+ ion line
spectrum with 100 pulses of integration. The echo returns at the plasma lines generally
exhibit peaks near the decay line offset in the Ba+ plasma (-2 kHz), although slightly
greater offsets of ~3 kHz are present in a few ranges.
The altitude extent of the PL- echoes in Figure 13a is 135 km, whereas the PL+
signals span an altitude interval of 1.05 km (Figure 13c). The difference in the two
altitude intervals arises because of the presence of weak signals in the two lowest altitude
cells of the PL- display and the absence of these signals in the PL+ panel. This disparity
may be the result of the greater sensitivity of the radar line feed at PL- than at PLf. (The
larger S/N value indicated for the PL+ includes a factor of -2 increase to compensate for
the line feed response of the radar.) The altitude spread of the plasma line echoes in
Figure 13 is greater than that shown in previous figures of this type. In part, this is due
to the fact that the radar beam was quickly scanned in azimuth during the 3-s integration
2-15

period of the data. By studying changes in the altitude of the largest signal with shorter
(300 ms) temporal averages, we conclude that 300 m is the upper limit of the altitude
spread contributed by changes in the critical height across large-scale spatial gradients
scanned by the radar beam. With this correction factor, the PL- altitude expanse is 1.05
km, which is still significantly greater than that recorded at earlier times (i.e. 600 m and
750 m, respectively, in Figures 10 and 12). Thus, there is evidence that a wider altitude
interval of excitation accompanies the equalization of the PL+/PL- amplitudes.
An overview of the locations of the HF-enhanced spectral peaks versus time after
launch is provided in Figure 14. Data from CLP range cells containing the strongest
spectral peaks were selected for this display. The range cell containing the largest
spectral peak is generally the same for the PL+, PL-, and ion-line enhancements. At latetimes (i 280 s L) differences in ranges are occasionally found, but even under these
circumstances the peaks are confined to an interval of two range cells (300 m). To avoid
spurious noise spikes and ion-line echoes from the unmodified barium cloud, we imposed
a requirement that the maximum spectral peak be at least 3.3 a above the mean (noise +
clutter) level. Data interpolation between 0.98-kHz FFT points was performed using
model fits to the (sinx/x)2 spectral windowing function under the assumption that the
bandwidth of the actual signal was infinitely narrow. The "quantized" frequency bands
evident at 0.98 kHz increments in Figure 14 indicate that this narrow-bandwidth model is
not completely correct. Other modeling efforts made with signals of finite bandwidth
produced additional ambiguities and uncertainties that are difficult to resolve without a
firm theoretical description of peak width versus time. For simplicity, the narrow-
bandwidth (monochromatic) model was adopted for the present analysis.
As expected, the best temporal coverage in Figure 14 is provided by the PL+ echo
(upper panel). Between -163 s and 170 s L, the frequency of the PL+ signal has a
positive frequency offset, 6, from 430 MHz + fjjp, but with increasing time the peak
migrates to 6 = -2.0 ± 0.5 kHz. This behavior is discussed in Section 4; in part, it is the
result of a Doppler shift caused by the downward motion of the Ba+ plasma. In the
current work, spectra recorded prior to -188 s L are not emphasized because plasma
dynamics are thought to play an important role in determining the frequency of the peak.
This greatly complicates the interpretation of the observations and is beyond the scope of
the current work. The ion line observations of Figure 14 indicate that the strongest
enhancements consistently occur at a negative frequency offset from 430 MHz (6 = -1.4
± 0.4 kHz). In addition, the PL- measurements made between 180 s and 210 s L reveal
that the weak echo shown in Figures 9 and 10, can occur near 5 = -1 kHz (referenced to
430 MHz - fin?) as well as at 6 = 0 kHz. At 280 s L and later, the PL- spectral peaks
2-16

occupy a band extending from approximately 6 = -1.5 kHz to 6 = -6.0 kHz. This band
includes the decay line and the first cascade line of the parametric decay instability
[Perkins et al., 1974; Fejer, 1979].
Data acquired with the Antigua 49.92 MHz radar indicate that some of the plasma
line events may be linked to the formation of HF-induced field-aligned irregularities in
the Ba+ cloud The first detection of 3-m field-aligned irregularities (FAIs) occurred at
283 s L. Backscatter from the HF-induced irregularities was initially very weak, but
moderate signal strengths were evident at later times during the period 296 - 309 s L.
The initial detection of FAIs occurred very close to the time when moderate PL-
enhancements appeared in the Arecibo data base (e.g., Figure 8). Moderate to strong
FAI scatter was observed between 339 and 370 s L when the HF facility was operating
CW. During this interval, the amplitudes of the PL+ and PL- were first observed to
equalize. At later times (404 - 493 s L), only weak FAI backscatter was detected.
During this period the PL+/PL- signals also became weaker, but their relative strengths
remained comparable.
Summary
The observations presented in this section provide an overview of the most
prominent features of the Arecibo radar data acquired during the AA-2 release. Many
aspects of the experiment, such as the temporal development of the enhanced Langmuir
oscillations/ion waves, are not addressed in the current study. Moreover, measurements
from several of the supporting diagnostics (e.g., the Antigua 49.92 MHz radar) will be
described in greater detail in a future publication. The principal results reported here
may be summarized as follows. During the first 150 s after the Ba release, a large power
asymmetry exists between PL+ and PL-, with most of the backscatter return residing at
the PL+. Peaks at the decay line are commonly observed in the PL+ spectrum. The
enhanced ion line spectrum contains a single peak at a sideband downshifted from
430 MHz by 1.0 to 1.5 kHz. For the first 120 s following the release, the PL- spectrum
contains a very weak peak located either exactly at 430 MHz - f^p or in the vicinity of
430 MHz - fjjp -1 kHz. Beginning -131 s after the release, significant enhancements are
evident at the PL-. Initially, the PL- spectra contain strong peaks at frequency offsets of
3-5 kHz from 430 MHz - fjjp with some signs of unresolved structure near the decay
line. At later times, peaks at the decay line dominate the PL- spectrum. The altitude
interval of the PL+/PL- enhancements is smallest at early times, but increases markedly
at -186 s after the release. Within this same time frame, the PL+ and PL- amplitudes
2-17

equalize. Both effects appear to be related to the formation of 3-m field-aligned
irregularities in the plasma.
4. Discussion
HF modification studies conducted in the natural F region at Arecibo provide an
important frame of reference from which to view the results of the AA-2 release. In the
past, experiments have always been performed at Arecibo using a vertically directed HF
beam. However, with the CRRES experiments, the HF beam was tilted 12° from the
vertical in the direction of geographic north to accommodate the rocket launch
requirements. The 12° tilt is well within the Spitze angle (15.7°) calculated for
fftp=5.1 MHz and the geomagnetic field geometry of Arecibo. During the AA-2
release, the 430 MHz radar beam was initially pointed towards the center of the HF beam
in the ionosphere but later moved to various locations south of that point Consequently,
it is reasonable to assume that the microphysics near the critical layer remains intact with
the tilted HF beam, provided that the plasma is for the most part horizontally stratified.
To within reasonable limits, this applies to the AA-2 Ba+ cloud.
Throughout the period of AA-2 observations, the 430 MHz radar viewing angle,
A, relative to the geomagnetic field ranged from 53.0° to 55.1°. This is not greatly
unlike the value A « 44° used in many of the past investigations of HF-induced
Langmuir oscillations in the natural F region. For AA-2 studies, the value A=55.1°
applies to all observations made prior to 228 s L. Thereafter, values between 55.1° and
53.0° are appropriate, depending on the specific pointing direction of the 430 MHz radar
beam.
Because the scale length H is shorter in the Ba+ cloud (H ~ 5 km) than in the
typical F-region environment (H = 30 - 70 km), vertical distances to reference points in
the plasma are greatly compressed in the AA-2 experiment compared to the natural
ionosphere. For example, the altitude of the upper hybrid resonance (fjjp =
[fep2 + fee2]1'2, where fep is the local electron plasma frequency at the resonance, and fec
is the electron cyclotron frequency) and the so-called "matching height" [Fejer et ai,
1991] (where one would expect to detect Langmuir waves with the 430 MHz radar based
on frequency-matching of the Langmuir wave dispersion relation to f^p) are both located
in a zone 200-250 m below the critical height.
Experimentally, if the 430 MHz radar were pointed vertically, 1-2 altitude cells
(150 - 300 m) would cover most of the resonance region thought to be responsible for
HF-enhanced plasma lines/ion lines at Arecibo. However, because the 430 MHz radar
2-18

beam was positioned at zenith angles between 15° and 13° during the CRRES
observations, the altitude interval spanned by a single 150-m range cell is greater than
150 m. This situation arises because of the finite beamwidth of the tilted radar beam. At
240 km altitude the half-power beamwidth of the 430 MHz radar is approximately
700 m. At 15° zenith angle, the radar wavefront at the half-power point occupies an
altitude interval of 181 m. If strongly excited waves were confined to an infinitely
narrow altitude interval, and these waves were detected only out to the half-power points
of the radar beam, one would expect to find signals in 2-3 consecutive range cells. If the
strongest echo is centered on a range cell (e.g., Figure 10, PL+ echo at 24234 km), one
would expect to find weaker echoes of comparable strength in range cells above and
below the cell containing the strongest signal. Moreover, if a range cell contains an
extremely strong signal, contributions from signals beyond the 3-dB power points of the
radar beam may become important. A strong enough signal could readily penetrate into
4 or more range cells. In Figure 10, PL+ backscatter is detected in two range cells above
the range of strongest scatter and in one range cell below it. The asymmetry in the
altitude span is consistently observed at early times (175-230 sL) when the PL+ is
particularly strong. We believe that this occurs because the shape of the radar beam is
asymmetric relative to the pointing direction at large (~15°) zenith angles. For the AA-2
observations, the effective beamwidth is wider to the north of the beam axis than to the
south. The distortion is caused by "spillover" in the illumination of the reflector dish.
Weak signals, such as those at the ion line and PL- in Figure 10, are observed in only one
range cell because the signal contributions near the perimeter of the radar beam are
below the clutter/noise floor of the measurement.
On the basis of the above arguments, the altitude-resolved spectral measurements
of Figure 10 are consistent with the excitation of PL+, PL-, and ion line enhancements in
a single, very narrow (« 150 m) altitude interval. In Figure 12, the altitude interval may
be slightly broader. However, in Figure 13 the significant increase in the range spread of
the echoes is probably caused by appreciable irregularities in the critical surface viewed
by radar. Corroborative results obtained with the 49.92 MHz radar on Antigua indicate
that these irregularities are most likely HF-induced.
As noted in Section 3, the Ba+ cloud is formed from neutral Ba vapor expanding
radially relative to the rocket velocity at the moment of release. The travel time of the
Ba/Ba+ cloud to the radar viewing location was roughly lls, which yields a travel speed
of -13 km/s. This speed is somewhat greater than the estimate of ~0.9 km/s based on
the velocity distribution function of Ba measured during the high-altitude CRRES
releases [Bernhardt et al, 1993]. If the initial Ba+ ions have a horizontal speed of
2-19
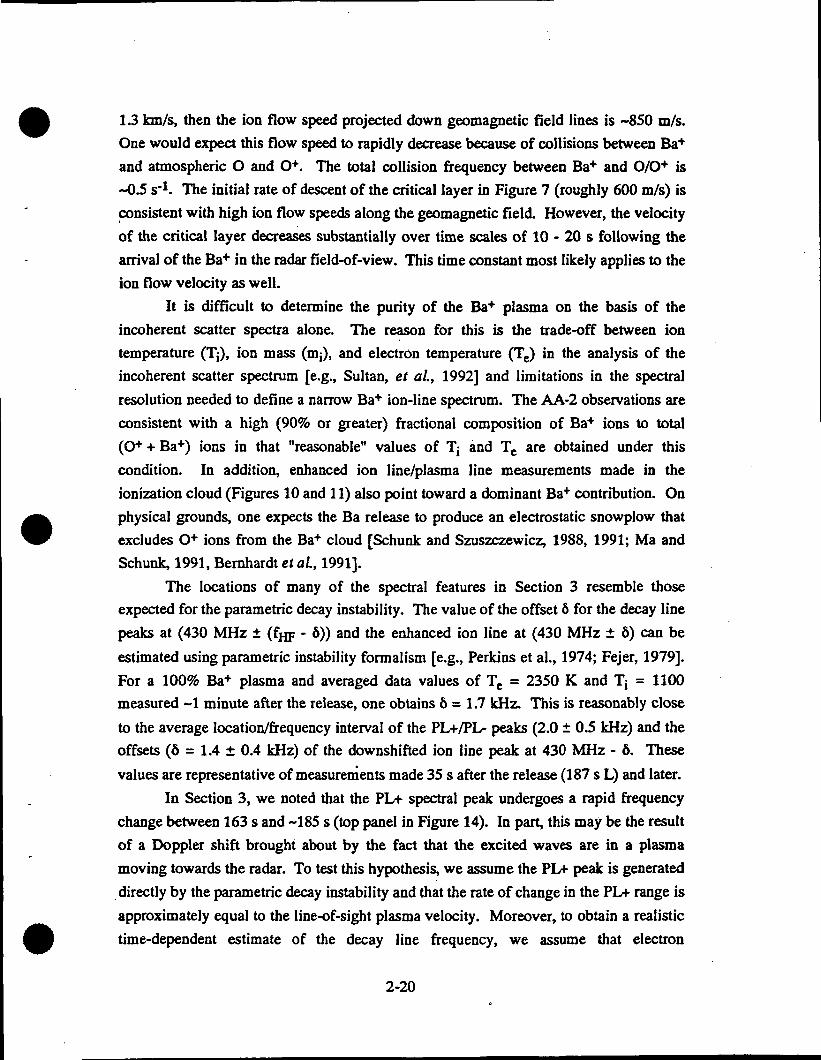
1.3 km/s, then the ion flow speed projected down geomagnetic field lines is -850 m/s.
One would expect this flow speed to rapidly decrease because of collisions between Ba*
and atmospheric O and O+. The total collision frequency between Ba+ and O/O+ is
~0.5 s"1. The initial rate of descent of the critical layer in Figure 7 (roughly 600 m/s) is
consistent with high ion flow speeds along the geomagnetic field. However, the velocity
of the critical layer decreases substantially over time scales of 10 - 20 s following the
arrival of the Ba+ in the radar field-of-view. This time constant most likely applies to the
ion flow velocity as well.
It is difficult to determine the purity of the Ba+ plasma on the basis of the
incoherent scatter spectra alone. The reason for this is the trade-off between ion
temperature (Tj), ion mass (mj), and electron temperature (Te) in the analysis of the
incoherent scatter spectrum [e.g., Sultan, et al., 1992] and limitations in the spectral
resolution needed to define a narrow Ba+ ion-line spectrum. The AA-2 observations are
consistent with a high (90% or greater) fractional composition of Ba4 ions to total
(O+ + Ba+) ions in that "reasonable" values of Tj and Te are obtained under this
condition. In addition, enhanced ion line/plasma line measurements made in the
ionization cloud (Figures 10 and 11) also point toward a dominant Ba+ contribution. On
physical grounds, one expects the Ba release to produce an electrostatic snowplow that
excludes O+ ions from the Ba+ cloud [Schunk and Szuszczewicz, 1988, 1991; Ma and
Schunk, 1991, Bernhardt etaL, 1991].
The locations of many of the spectral features in Section 3 resemble those
expected for the parametric decay instability. The value of the offset 5 for the decay line
peaks at (430 MHz ± (fjjp - 6)) and the enhanced ion line at (430 MHz ± 5) can be
estimated using parametric instability formalism [e.g., Perkins et al., 1974; Fejer, 1979].
For a 100% Ba+ plasma and averaged data values of Te = 2350 K and Tj = 1100
measured ~1 minute after the release, one obtains 6 = 1.7 kHz. This is reasonably close
to the average location/frequency interval of the PL+/PL- peaks (2.0 ± 0.5 kHz) and the
offsets (6 = 1.4 ± 0.4 kHz) of the downshifted ion line peak at 430 MHz - 6. These
values are representative of measurements made 35 s after the release (187 s L) and later.
In Section 3, we noted that the PL+ spectral peak undergoes a rapid frequency
change between 163 s and -185 s (top panel in Figure 14). In part, this may be the result
of a Doppler shift brought about by the fact that the excited waves are in a plasma
moving towards the radar. To test this hypothesis, we assume the PL+ peak is generated
directly by the parametric decay instability and that the rate of change in the PLf range is
approximately equal to the line-of-sight plasma velocity. Moreover, to obtain a realistic
time-dependent estimate of the decay line frequency, we assume that electron
2-20

temperature can be approximated as Te = 987 K 4 1363 x [1 - exp(t/30 s)], where t is
time referenced to the release, and the time constant (30 s) is a rough estimate based on
the AA-2 release results. This formula yields the measured background electron
temperature at the time of the release (987 K) and reproduces the late-time temperature
Te=2350 K used above. Ion temperature is initially set equal to 910 K but allowed to
increase to 1100 K as Te increases. The result of this calculation is shown as a
continuous line in the upper panel of Figure 14. The calculation reproduces the general
downward trend of peak frequency at times between 163 s and 185 s L, but the
theoretical estimate does not agree with the data in detail. This indicates that either the
line-of-sight ion flow speed is significantly greater than the rate of change of the PL+
range or that the excitation of the decay mode proceeds somewhat differently in a rapidly
moving plasma. At times after 200 s L, the calculated location of the decay line lies near
the upper boundary of the measured range of peak frequencies. In this case, the
interpolated frequency locations may have been influenced by the presence of unresolved
spectral structure in FFT cells adjacent to, and on the 430 MHz side of, the peak (see
e.g., Figure 13c). This effect could readily move the interpolated frequency of the peak
by -0.5 kHz. A correction factor of this magnitude would bring the observations in line
with the calculated decay mode frequency.
Before a threshold for the parametric decay instability can be determined, an
accurate estimate of the Langmuir wave damping decrement in the Ba+ plasma is needed.
The usual assumption is that the damping is controlled by collisions between electrons
and ions. Near the critical layer in the AA-2 plasma, the electron-ion collision
frequency, vej, is -150 s"1, assuming Te = 2350 K. However, because many
photoelectrons are created by the ionization of the neutral cloud, questions arise
concerning the contribution of electron Landau damping to the overall damping
decrement To address this issue, we have examined PL- data during the period
155-280 s L for evidence of enhancements by suprathermal electrons. This method is
similar to that used to detect photoelectrons in the daytime ionosphere [Carlson et al,
1977, Djuth et al, 1994]. During the period selected for analysis, only a weakly
enhanced plasma line was present at 430 MHz - fjjp (Figure 10). Measurements in the
presence of strong PL+ enhancements are not feasible because of poor system sensitivity.
(The clutter from the CLP technique greatly elevates the level of random fluctuations at
ranges of interest to the study.) Our investigation yielded no detections of photoelectron-
enhanced plasma lines over a 2-MHz band centered on 430 MHz - f^p. This frequency
band corresponds to radar phase energies (electron energies) between 5.8 and 12.9 eV.
In general the PL- is used to detect electrons moving up geomagnetic field lines (away
2-21

from the radar). However, even though most Ba photoelectrons are initially directed
downwards along geomagnetic field lines through the bottom of the cloud, about one-
third of the flux is expected to be scattered back up field lines because of elastic and
inelastic collisions with the neutral atmosphere [e.g., Carlson et al., 1982]. On the basis
of our study, we can set an upper limit on the upgoing flux of 2 x 10⁵ electrons cm'2 s'1
eV'1 at phase velocities comparable to those of the HF-enhanced plasma lines. This is
more than two orders of magnitude less than the daytime photoelectron flux, and the
corresponding Landau damping decrement is very small for any comparable electron
energy distribution. We conclude that the appropriate damping decrement for Langmuir
waves is specified by vej.
The parametric decay threshold calculated for a homogeneous plasma using the
Ba+ plasma parameters is E0~0.2 V/m, where E0 is the amplitude of the pump electric
field. This can be compared with estimates of the HF electric field in the plasma. Under
the assumption that a standing wave pattern is generated near radio wave reflection, the
predicted HF electric field at the first standing wave maximum is 1.7 V/m. At lower
heights near the upper hybrid resonance/430-MHz-radar matching height (~250 m below
the critical layer), the standing wave maximum has a value of 12 V/m. Thus, the
estimated HF electric field strengths in the resonance region are well above the threshold
for the parametric decay instability in a homogeneous plasma. However, in the present
case where the ionospheric scale length is rather small (~5 km), the homogeneous plasma
approximation may be inappropriate. In a horizontally-stratified medium, excited
Langmuir waves decouple from the HF pump wave as they propagate down the plasma
gradient [Perkins and Flick, 1971; Fejer and Leer, 1972]. This can lead to a substantial
increase in the instability threshold. Unfortunately, the assumptions implicit in the work
of Perkins and Flick [1971] and Fejer and Leer [1972] are not appropriate for AA-2
experimental conditions. Further theoretical studies are needed to address the role played
by plasma inhomogeneity in the AA-2 experiment.
In general, the spectra presented in this paper are intended to show typical
behavior during the AA-2 experiment, Displays of unique and/or transient features have
been avoided. Most of the enhanced plasma line/ion line measurements appear to contain
elements of the parametric decay instability, but some major inconsistencies are also
evident in the data. Figure 10 shows a very strong decay line in the PL+ spectrum and
the expected enhancement at the downshifted sideband of the ion line. Indeed, the
concept of oppositely propagating ion waves and Langmuir waves is central to the
parametric decay process. However, one would also expect the strong PL+ decay waves
in Figure 10 to saturate by generating oppositely propagating Langmuir waves though the
2-22

ion nonlinear Landau damping process [Perkins et ai, 1974]. No such cascade line is
present in the PL- spectrum. Instead, one finds a weak spike located at frequencies
between 430 MHz - f^p and 430 MHz - f^? - 1 kHz (Figure 14). The feature at
430 MHz - fjjp may be the result of linear mode conversion [Morales and Lee, 1977]
along the steep vertical gradient in the Ba+ cloud. The echoes offset by -1 kHz are
harder to explain, but could be produced by Langmuir waves scattered off the strongly
enhanced ion waves traveling away from the radar.
The spectra of Figure 10 are characteristic of the initial period of strong PL+
enhancements between 170 s and 235 s L. These observations suggest that strongly
excited Langmuir waves with radar wavevectors k (|kj = 18 nr1) directed toward the
radar are coupled to ion-acoustic waves having oppositely directed wavevectors. Absent
in the data are decay line/cascade line waves with wavevectors directed away from the
radar and ion-acoustic waves with k directed toward the radar. The observations seem to
indicate that only half of the oppositely propagating waves expected for a parametric
decay instability [e.g., Fejer, 1979] are present in the plasma with no signs of wave
saturation. In Figure 12, the PL+ is weaker than in Figure 10, but the anticipated
cascade line in the PL- spectrum (offset by 3-5 kHz) appears in the data. Moreover, the
expected enhancement of the downshifted sideband in the ion line spectrum is readily
discernible. In Figure 13, the plasma lines have only moderate amplitudes, and, at most,
weak ion-line enhancements are present. Nevertheless, when the PL- decay line is strong
(altitude 240.69 km), an unresolved cascade line appears to be present in the PL+
spectrum. Similarly, an unresolved cascade line is present in the PL- spectrum when a
strong decay line appears in the PL+ spectrum (range 240.54 km). Figure 14 shows that
the first PL- cascade line can exceed the amplitude of the decay line, but that this is
usually not the case at the PL+. The results of Figures 12-14 support the idea that
parametric decay processes are operative in the plasma.
Clearly, the most curious feature of the observations is the large power
asymmetry in the backscatter from radar wavevectors directed toward the radar (PL+)
versus those directed away from the radar (PL-). This asymmetry is most evident at
early times following the release (18 s - 83 s R, 170 - 235 L), but it doesn't completely
disappear until about 145 R (297 s L). The observed power ratio between PL+ and PL-
is greater than 105 at the decay line. Moreover, the absolute strength of the PL+ decay
line is greater than any plasma line signal seen in previous ionospheric modification
experiments at Arecibo. Observations made in the past in the natural ionosphere at
Arecibo have yielded no large, systematic asymmetries between the power at the
2-23

upshifted and downshifted plasma lines. At F-region altitudes, the time-averaged power
is roughly comparable at the upshifted and downshifted plasma lines. In sporadic E,
either the PL+ or the PL- may be dominant The ratio of PLf power to PL- power
ranges from 10'1 to 102, but very few cases are encountered near the extrema of this
range pjuth, 1979].
During part of the time when a large asymmetry in plasma line power was
observed, substantial Ba+ flow velocities existed along geomagnetic field lines. This is
mirrored by the rapid decrease of the critical layer in Figure 7. Initially, the estimated
ion flow velocity projected along the geomagnetic field (-850 m/s) exceeded the ion-
acoustic velocity in the Ba+ plasma (~550 m/s). As noted above, this ion flow velocity is
not determined from incoherent scatter observations, but is calculated from the initial
expansion rate of the neutral Ba cloud. If the ion flow velocity parallel to the
geomagnetic field is scaled according to the rate of change in the critical altitude, one
finds that the flow becomes subsonic at ~12 s after release (164 s L). Under these
assumptions, all of the observations of the plasma line power asymmetry discussed
herein were made under conditions of subsonic ion flow. Moreover, there does not
appear to be any correlation between the rate of descent of the critical layer and the
magnitude of the asymmetry.
The strongest plasma line asymmetries were observed at times when the Antigua
49.92 MHz radar detected no 3-m field aligned irregularities in the Ba+ cloud. At later
times (339 s - 370 s L) when moderate/strong backscatter from 3-m irregularities was
detected, the amplitudes of PL+ and PL- were roughly equal. This situation is not unlike
that observed in the natural F region. The data presented in Figure 8 between 100 s L
and 150 s L were, in fact, acquired in the natural F region in the presence of strong
scatter from 3-m irregularities. The plasma line asymmetry encountered during AA-2
may be associated with the smoothness of the Ba+ plasma at early times following the
release. In the natural F-region at Arecibo, this situation never exists for long periods of
time because HF-induced field-aligned irregularities (FAIs) quickly develop in the
plasma [e.g., Coster et aL, 1985].
The suppression of instabilities responsible for the production of HF-excited FAIs
may be related to the plasma flow down geomagnetic field lines during AA-2. At
Arecibo, short-scale FAIs are believed to be excited by instability processes occurring
near the upper hybrid resonance [Noble and Djuth, 1990], At early times following the
AA-2 release, the altitude of the upper hybrid resonance moves rapidly downwards in
altitude because of the build-up of Ba+ ions along geomagnetic field lines. However,
unlike the case of a slowly descending ionization layer in thermal equilibrium, the
2-24

plasma in the upper hybrid resonance zone does not simply move down in altitude while
maintaining the frequency matching conditions necessary for instability growth. In the
AA-2 experiment, the altitude zone of the upper hybrid resonance is continuously formed
and then reformed by arrival of fresh plasma from greater heights. This situation arises
because of the broad distribution of ion velocities parallel to the geomagnetic field. In
effect, the resonance region is continuously recreated by the downward ion flow. This
limits the residence time of the HF wave in the region of instability growth. If the HF
wave is not present in the resonance region over time scales of the instability growth
period, then the production of short-scale irregularities will be inhibited. Moreover, the
effect of the rather short scale length H ~ 5 km in the Ba+ plasma is to increase the
instability threshold for the short-scale irregularities and to decrease their growth rate
[Grach et ai, 1977; Das and Fejer, 1979]. Assuming a nominal instability growth time
of ~1 s and a 50-m resonance zone, one finds that even a relatively slow (70 m/s) field-
aligned ion flow may interfere with the production of field-aligned irregularities. In light
of this, it is not surprising that AFAIs are detected only at late times during the AA-2
experiment when the vertical velocity of the critical layer is small.
No specific explanation for the plasma line power asymmetry is offered here.
The plasma line asymmetry may be caused by processes sensitive to the downward ion
flow, the smoothness of the Ba+ plasma and/or the shortness of plasma scale length. A
reexamination of the development of the parametric decay instability in this type of
environment is needed. In addition, it is important to recognize that Langmuir wave
propagation in an inhomogeneous medium can greatly influence observations made from
a limited range of viewing angles with the Arecibo 430 MHz [Muldrew, 1978a, b].
Throughout the experiment, the radar viewed the excited plasma/ion waves at 53.0° to
55.1° relative to the geomagnetic field. Additional studies are required to determine
whether propagational geometries exist that can exclude PL- scatter at the 50 dB level
while maintaining strong PL+ and ion line enhancements.
2-25

5. Conclusions
During the AA-2 experiment, the Arecibo 430 MHz radar detected some of the
strongest HF-enhanced plasma lines ever recorded at Arecibo Observatory. At early
times, within 83 s of the Ba release, extremely strong plasma lines were observed near
430 MHz + fjjp - 6, where 6 = 2.0 ± 0.5 kHz. These echoes are caused by HF-excited
Langmuir oscillations with wavevectors k (|k| = 18 nr1) pointed toward the radar. The
observed value of 6 is close to the frequency offset calculated for the parametric decay
instability in a Ba+ plasma; the spectral peak is commonly referred to as the decay line
[Showen and Kim, 1978]. The upshifted plasma line was accompanied by strong HF-
enhanced ion waves that were present only at the downshifted acoustic sideband, that is,
at 430 MHz - 6, where 6 = 1.4 ± 0.4 kHz. Only very weak echoes were detected at the
downshifted plasma line. The spectral peaks were either centered exactly at 430 MHz -
fjIF or located near 430 MHz - f^p - 1 kHz. The power asymmetry between the
upshifted and downshifted plasma line enhancements was greater than 105 at the decay
line. No explanation for this remarkable asymmetry is provided in the present work.
However, the current results indicate that the development of the parametric decay
instability needs to be reexamined in a smooth Ba+ plasma having a short scale length
(5 km). An assessment of the impact of ion flow along geomagnetic field lines may be
essential to understanding the AA-2 plasma line observations. Finally, propagation of
Langmuir oscillations into the field-of-view of the 430 MHz radar cannot be ruled out as
a source of the power asymmetry. However, a propagational model must also account
for the presence of a strongly-enhanced downshifted sideband in the ion line spectrum.
In support of the AA-2 experiment, a mobile VHP radar was deployed on the
island of Antigua to monitor the formation of HF-induced irregularities in the Ba+ cloud.
The radar was sensitive to field-aligned irregularities (FAIs) having a spatial scale of 3 m
across the geomagnetic field. In the early time release environment, no HF-induced
scatter was detected. It is suggested that ion flow down geomagnetic field lines initially
suppressed thermally-driven instabilities responsible for the formation of short-scale
field-aligned irregularities. At later times (131-341 s after the Ba release), HF-induced
field-aligned irregularities were detected in the Ba+ cloud. The appearance of moderate
enhancements at the downshifted plasma line coincided with the arrival of HF-induced
FAIs. At this point, the enhanced plasma line/ion line spectra began to more closely
resemble a parametric decay spectrum. As the FAIs intensified, the amplitudes of the
upshifted and downshifted plasma lines equalized, and the power asymmetry
2-26

disappeared At most, only weak ion-lioe enhancements were evident at this point, but
the corresponding plasma line spectra were indicative of the parametric decay instability.
Overall, once HF-induced FAIs formed in the Ba+ plasma, the instability physics
appeared to be similar to that encountered in the natural F region after FAIs form.
The data presented here are restricted to observations made during continuous
wave (CW) transmissions with the Arecibo HF facility. In this mode of operation, the
wideband (-100 kHz) spectral signatures of strong turbulence seen in the natural
ionosphere at Arecibo [DuBois et al, 1990; Fejer et al, 1991; Cheung et al, 1992;
DuBois et al, 1993; Sulzer and Fejer, 1993] are absent Additional AA-2 studies are
planned that focus on the temporal development of Langmuir oscillations and ion waves
in the Ba+ plasma. Special attention will be paid to short (tens of ms) time scales
following the transmission of an HF pulse. In previous experiments, data acquired
within ~50 ms of HF turn-on has yielded the best evidence for strong turbulence in the
Arecibo F region.
Acknowledgments. Two of the authors (F.T.D. and J.H.E.) acknowledge
support from NASA under contracts NAS8-39075 and from the Phillips Laboratory,
Hanscom Air Force Base under contracts F19628-92-C-0168 and NAS8-39238. The
efforts of K.M.G. were supported by the Air Force Office of Scientific Research under
task 2310BP. We gratefully acknowledge the outstanding efforts of K. L. Williams and
C. L. Younger (Geospace Research, Inc.), and J. W. Brosnahan (LaSalle Research
Corporation) in the deployment and operation of the VHF radar on Antigua. We thank
P. A. Bernhardt for making optical measurements in support of the AA-2 experiment and
for helpful discussions concerning the results. L. M. Duncan, J. F. Vickrey, and C. J.
Heinselman provided much needed organizational and logistical assistance in support of
the AA-2 launch operation. We are especially grateful for the help of A. Crespo, H.
Monroig, V. Iguina, and E. Castro in maintaining the Arecibo HF facility and the 430
MHz radar at a high performance level throughout the El Coqui rocket campaign. The
Arecibo Observatory is part of the National Astronomy and Ionosphere Center, which is
operated by Cornell University under cooperative agreement with the National Science
Foundation.
2-27
REFERENCES
Bernhardt, P. A., Probing the magnetosphere using chemical releases from the Combined
Release and Radiation Effects Satellite, Phys. Fluids, 4,2249,1992.
Bernhardt, P. A., P. Rodriguez, C. L. Siefring, and C. S. Lin, Field-aligned dynamics of
chemically induced perturbations to the ionosphere, 7. Ceophys. Res., 96, 13887,
1991.
Bernhardt, P. A., J. D. Huba, M. B. Pongratz, D. J. Simons, and J. H. Wolcott, Plasma
irregularities caused by cycloid bunching of the CRRES G-2 Barium release, 7.
Geophys. Res., 98,1613,1993.
Carlson, H. C., V. B. Wickwar, and G. P. Mantas, The plasma line revisited as an
aeronomical diagnostic: Suprathermal electrons, solar EUV, electron-gas thermal
balance, Geophys. Res. Lett., 4, 565,1977.
Carlson, H. C., V. B. Wickwar, and G. P. Mantas, Observations effluxes of suprathermal
electrons accelerated by HF excited instabilities, J. Atmos. Terr. Phys., 44, 1089,
1982.
Carlsten, J. L., Photoionization of barium via the 3D metastable levels, Planet. Space
Set., 23, 53,1975.
Cheung, P. Y., D. F. DuBois, T. Fukuchi, K. Kawan, H. A. Rose, D. Russell, T.
Tanikawa, and A. Y. Wong, Investigation of strong Langmuir turbulence in
ionospheric modification, J. Geophys. Res., 97,10575,1992.
Coster, A. J., F. T. Djuth, R. J. lost, and W. E. Gordon, The temporal evolution of 3-m
striations in the modified ionsphere, 7. Geophys. Res., 90,2807,1985.
Das, A. C., and J. A. Fejer, Resonance instability of small-scale field aligned
irregularities, 7. Geophys. Res., 84, 6701,1979.
Djuth, F. T., HF-induced plasma waves in ionospheric sporadic E, Ph.D. thesis, Rice
Univ., Houston, Texas, 1979.
2-28

Djuth, F. T., HF-enhanced plasma Hoes in the lower ionosphere, Radio Sci., 19, 383,
1984.
Djuth, F. T., and C. A. Gonzales, Temporal evolution of the HF-enhanced plasma line in
Sporadic E, J. Geosphys. Res., 93,196,1988.
Djuth, F. T., C. A. Gonzales, and H. M. lerkic, Temporal evolution of the HF-enhanced
plasma line in the Arecibo F region,/. Geophys. Res., 91,12089,1986.
Djuth, F. T., M. P. Sulzer, and J. H. Elder, High resolution observations of HF-induced
plasma waves in the ionosphere, Geosphys. Res. Lett., 17,1893,1990.
Djuth, F. T., M. P. Sulzer, and J. H. Elder, Application of the coded long-pulse technique
to plasma line studies of the ionosphere, Geophys. Res. Lett., in press, 1994.
DuBois, D. F., H. A. Rose, and D. Russell, Excitation of strong Langmuir turbulence in
plasmas near critical density: Application to HF heating of the ionosphere, J.
Geosphys. Res., 95, 21221,1990.
DuBois, D. F., H. A. Rose, and D. Russell, Coexistence of parametric decay cascades and
caviton collapse at subcritical densities, Phys. Rev. Lett., 66,1970,1991.
DuBois, D. F., A. Hanssen, H. A. Rose, and D. Russell, Space and time distribution of
HF excited Langmuir turbulence in the ionosphere: Comparison of theory and
experiment,/. Geophys. Res., 98,17543,1993.
Fejer, J. A., Ionospheric modification and parametric instabilities, Rev. Geophys. Space
Phys., 17,135,1979.
Fejer, J. A., and E. Leer, Purely growing parametric instability in an inhomogeneous
plasma,/. Geophys. Res., 77,700,1972.
Fejer, J. A., M. P. Sulzer, and F. T. Djuth, Height dependence of the observed spectrum
of radar backscatter from HF-induced ionospheric Langmuir turbulence, /.
Geosphys. Res., 96,15,985,1991.
2-29

Orach, S. M., A. N. Karashtin, N. A. Mityakov, V. O. Rapoport, and V. Yu.
Trakhtengerts, Parametric interaction between electromagnetic radiation and
ionospheric plasma, Radiophys. Quantum Electron,, Engl. Transl., 20, 1254,
1977.
Gordon, W. E., and H. C. Carlson, The excitation of plasma lines in blanketing sporadic
E,J. Geophys. Res., 81,4016,1976.
Gordon, W. E., and J. A. Dobelman, Comparison of measured and calculated antenna
patterns for the Islote heater, Rice University Report, Houston, Texas, 13 July
1982.
Hanssen, A., E. Mjolhus, D. F. DuBois, and H. A. Rose, Numerical test of the weak
turbulence approximation to ionospheric Langmuir turbulence, J. Geophys. Res.,
97,12073,1992.
Ma, T.-Z., and R. W. Schunk, Plasma cloud expansion in the ionosphere: Three-
dimensional simulation, J. Geophys. Res., 96, 5793,1991.
Morales, G. J., and Y. C. Lee, Generation of density cavities and localized electric fields
in a nonuniform plasma, Phys. Fluids, 20,1135,1977.
Muldrew, D. B., The role of field-aligned ionization irregularities in the generation of the
HF-induced plasma line at Arecibo, /. Geophys. Res., 83,2552,1978a.
Muldrew, D. B., Langmuir wave propagation and the enhanced plasma line in sporadic
E,J. Geophys. Res., 83, 5207,1978b.
Noble, S. T., and F. T. Djuth, Simultaneous measurements of HF-enhanced plasma
waves and artificial field-aligned irregularities at Arecibo, J. Geophys. Res., 95,
15195,1990.
Perkins, F. W., and J. Flick, Parametric instabilities in inhomogeneous plasmas, Phys.
Fluids, 14,2012,1971.
2-30

Perkins, F. W., C. Oberman, and E. J. Valeo, Parametric instabilities and ionospheric
modification,/. Geophys.Res., 79,1478,1974.
Schlegel, K., M. Rietveld, and A Maul, A modification event of the auroral £ region as
studied with EISCAT and other diagnostics, Radio ScL, 22,1063,1987.
Schunk, R. W., and E. P. Szuszczewicz, Early time plasma expansion characteristic of
ionized clouds in the ionosphere, 7. Geophys. Res., 93,12901,1988.
Schunk, R. W., and E. P. Szuszczewicz, Plasma expansion characteristics of ionized
clouds in the ionosphere: Macroscopic formulation, /. Geophys. Res., 96, 1337,
1991.
Showen, R. L., and D. M. Kim, Time variations of HF-induced plasma waves, J.
Geophys. Res., 83, 623,1978.
Sultan, P. J., M. Mendillo, and W. L. Oliver, Detection of artificially created negative
ion clouds with incoherent scatter radar, J. Geophys. Res., 97, 4085,1992.
Sulzer, M. P., A radar technique for high range resolution incoherent scatter
autocorrelation function measurements utilizing the full average power of
klystron radars, Radio ScL, 21,10330,1986.
Sulzer, M. P., and J. A. Fejer, Radar spectral observations of HF-induced ionospheric
Langmuir turbulence with improved range and time resolution, J. Geophys. Res.,
in press, 1994.
2-31

FIGURE CAPTIONS
Figure 1. Overview of the AA-2 release geometry. The locations of Arecibo
Observatory (AO), the Arecibo HF facility (HF), a digisonde/optical
observing site at Ramey (RA), and the launch site at Tortuguero, Puerto
Rico (TO) are shown in the figure. For the El Coqui campaign the
Arecibo HF beam was tilted 12° from vertical in the direction of
geographic north. The 3-dB contour of the HF beam at 250 km altitude is
shown as a dotted ellipse. A distance scale along the geomagnetic
meridian crossing Arecibo Observatory is provided as a reference.
Figure 2. Electron density versus altitude and time beginning 100 s after launch of
AA-2. Prior to the release at 152 s, the F-region peak in the background
ionosphere was at 345 km altitude. An upward tilted streak seen just
before the release is the rocket body as viewed through a high order
sidelobe of the radar. Preceding the rocket echo, small, faint pink dots are
evident near 272 km; this is enhanced scatter from HF-excited ion waves.
The short-lived transient signals visible near 100 km are echoes from the
"heads" of meteor ionization trails. The position of the radar beam was
stationary until 228 s; thereafter the beam was moved across the Ba+
cloud revealing spatial structure.
Figure 3. Horizontal location of 430 MHz radar beam at 240 km altitude relative to
Arecibo Observatory (AO). The locations designated by (+) are
referenced to time (in seconds) after launch. The release location at
253 km is displayed at bottom right. For the first 228 s after launch the
beam is stationary; thereafter positions are shown at 12-s intervals. Also
illustrated are the estimated -3 dB and -10 dB contours of the HF beam
based on studies conducted by Gordon and Dobelman [1982].
Figure 4. Forty consecutive electron density profiles are shown beginning with the
launch of the AA-2 rocket. Each profile is integrated for 12 s; the
integration intervals are centered on times corresponding to the "+"
locations in Figure 3. The time of each profile is shown at the top. Times
in seconds are read top to bottom. For presentation purposes, each profile
2-32

is displaced from the preceding one by 0.4 x 106 cm'3. Error bars for
electron concentrations are -5% of the values shown. Enhanced ion lines
are evident near 272 km altitude prior to the release at 152 s. Immediately
before the release, an echo from the rocket is visible at ~250 km.
FigureS. Upshifted plasma line power expressed as the ratio of signal-to-noise
(SNR) versus altitude and time after launch. The noise value includes
contributions from the sky noise and radar-receiver noise. Wideband
spectra obtained with the coded long-pulse technique were processed to
produce this plot. Power spectra were calculated at 150-m intervals and
then integrated over the frequency interval 430 MHz + fjjp + 1 kHz
through 430 MHz + fjjp - 45 kHz to yield signal power versus altitude.
The bands of "noise" are artifacts of the coded long-pulse technique. The
mean clutter power has been subtracted from each altitude profile, but
random fluctuations in the residual give rise to "noise" bands. Stronger
signals create more clutter, resulting in greater "noise" levels.
Figure 6. Barker power profiles (600 m range resolution) versus time after launch.
Data obtained on the bottomside of the Ba+ cloud is greatly expanded in
altitude to highlight the induced ion line enhancements (pink outline near
the perimeter of cloud). These enhancements are generally confined to a
single 600-m cell. The altitude descent of the enhanced ion line closely
matches that of the enhanced plasma line (Figure 5). The vertical streak at
left is caused by backscatter from the rocket.
Figure?. A) Critical altitude deduced from the upshifted plasma line data of
Figure5 (dots) and ion line data of Figure 6 (continuous line).
B) Vertical velocity (negative velocity = motion downwards) of the
critical layer in the Ba+ cloud as determined from the measurements of
A). Data are plotted only during periods when the radar beam is
stationary. Velocity deduced from ion line observations are shown as (+);
the error bar at left denotes ±lo errors for these measurements. The
continuous line is a least-squares fit to the upshifted plasma line data. In
this case, the ±lo fitting errors are approximately equal to the width of the
line displayed, and no error bars are plotted. C) Scale length determined
at the critical altitude using ion line measurements of electron
2-33

concentration. The scale length is -40 km in the background F-region
prior to the release, but ranges between 4 and 6 km in the Ba+ plasma.
The measurements of scale length have one-sigma error bars of
approximately ±390 m.
Figure 8. Total, altitude-integrated, power received at the upshifted and downshifted
plasma lines versus time after launch. Signal strength is expressed as a
signal-to-noise ratio (SNR). The noise power received through the
2-MHz bandpass at the downshifted plasma line is used as the noise
reference. Power measurements made at the upshifted plasma line have
been corrected for the narrower (1-MHz) bandpass employed for these
observations and for differences in the gain of the 430 MHz line feed at
the upshifted and downshifted plasma lines. The schedule of HF
transmissions during the AA-2 release is depicted at the bottom. These
include continuous wave (CW) operations, high duty cycle pulsing (HD),
and low duty cycle pulsing (LD). See text for details.
Figure 9. Typical enhanced backscatter spectrum observed in the Ba+ cloud during
periods of strong excitation at the upshifted plasma line. Observations are
made simultaneously across all bands using the coded long-pulse
technique. Measurements are shown for a single 150-m range gate
containing maximum scatter. The signal at the upshifted plasma line
exhibits a pedestal near 20 dB signal-to-noise ratio; this is the combined
effect of the spectral windowing function and wideband clutter from
signals at other ranges. The elevated baseline at the ion line is also caused
by clutter. An average of 40 consecutive radar pulses is employed for the
weaker signals near 430 MHz - f^p and 430 MHz, but an average of only
ten pulses is used for the measurement at 430 MHz + fyp. Error bars are
16% of the mean values shown at the downshifted plasma line and ion
line, and 32% of the values at the upshifted plasma line.u
Figure 10. Power spectra simultaneously measured at the downshifted and upshifted
plasma lines and ion line (columns) versus altitude (rows) at 188.5 s after
launch. The altitude of each row is listed in the upper right hand comer of
the ion line spectrum. Measurements from ten consecutive radar pulses
(300-ms time interval) were integrated for this display. The downshifted
2-34

plasma line and ion line observations are plotted on a linear ordinate scale;
the upshifted plasma line data are shown on a logarithmic scale because of
their larger amplitudes. The signal-to-noise ratio (S/N) of the strongest
spectral peak in each column is listed at the top of the column. The mean
noise level is determined by sky plus radar-receiver noise and does not
include contributions from clutter. The baseline levels at the ion line and
upshifted plasma line are primarily the result of clutter from signals at
other ranges; the baseline at the downshifted plasma line is mostly caused
by noise from the sky and receiver. Error bars are 32% of the averaged
values shown.
Figure 11. Ion line power spectra versus altitude at 188.5 s after launch. Altitudes
are listed in the upper right hand corner of the spectral boxes.
Measurements from 100 consecutive radar pulses (3-s time interval) were
integrated for this display. The integration period is centered on the time
of the observations of Figure 10. The maximum signal-to-noise ratio
(after clutter subtraction) is 6.4 at 242.34 km altitude. During the 3-s
period of integration, the height of the enhanced ion line descended from
242.49 to 242.19 km altitude. The weak echoes centered near 0 kHz in
the lowest and highest altitude cells are incoherent scatter returns from the
Ba+ cloud. Error bars are 10% of the averaged values shown.
Figure 12. Power spectra simultaneously measured at the downshifted and upshifted
plasma lines and ion line (columns) versus altitude (rows) at 285.0 s after
launch. The altitude of each row is listed in the upper right hand corner of
the ion line spectrum. Measurements from 100 consecutive radar pulses
(3-s time interval) were integrated for this display. The display format is
similar to that of Figure 10, except that the upshifted plasma line is now
shown on a linear scale. Error bars are 10% of the mean values shown.
Figure 13a. Power spectra at the downshifted plasma line measured 340.8 s after
launch. Altitudes are listed above each spectral box. Measurements from
100 consecutive radar pulses (3-s time interval) were integrated for this
display. The signal-to-noise ratio (S/N) of the strongest spectral peak in
the panel is listed at top. Error bars are 10% of the mean values shown.
2-35
Figure 13b. Power spectra at the ion line measured 340.8 s after launch. The data
format is identical to that of Figure 13a.
Figure 13c. Power spectra at the upshifted plasma line measured 340.8 s after launch.
The data format is identical to that of Figure 13a.
Figure 14. Frequency locations of HF-enhanced spectral peaks versus time after
launch. Simultaneous measurements at the upshifted plasma line, the ion
line, and the downshifted plasma line are shown in the top three panels.
The continuous line in the uppermost panel is a theoretical curve
discussed in the text. For reference, the altitude of the strongest spectral
peak at the upshifted plasma line is displayed at the bottom. The temporal
resolution of the measurements is 300 ms.
2-36

20C
Q
18C
ccO
16C
68C
N HF BEAM250km ALT
100 KM
100 KM
66°
WEST LONGITUDE
ST. CROIX
64C
Figure 1
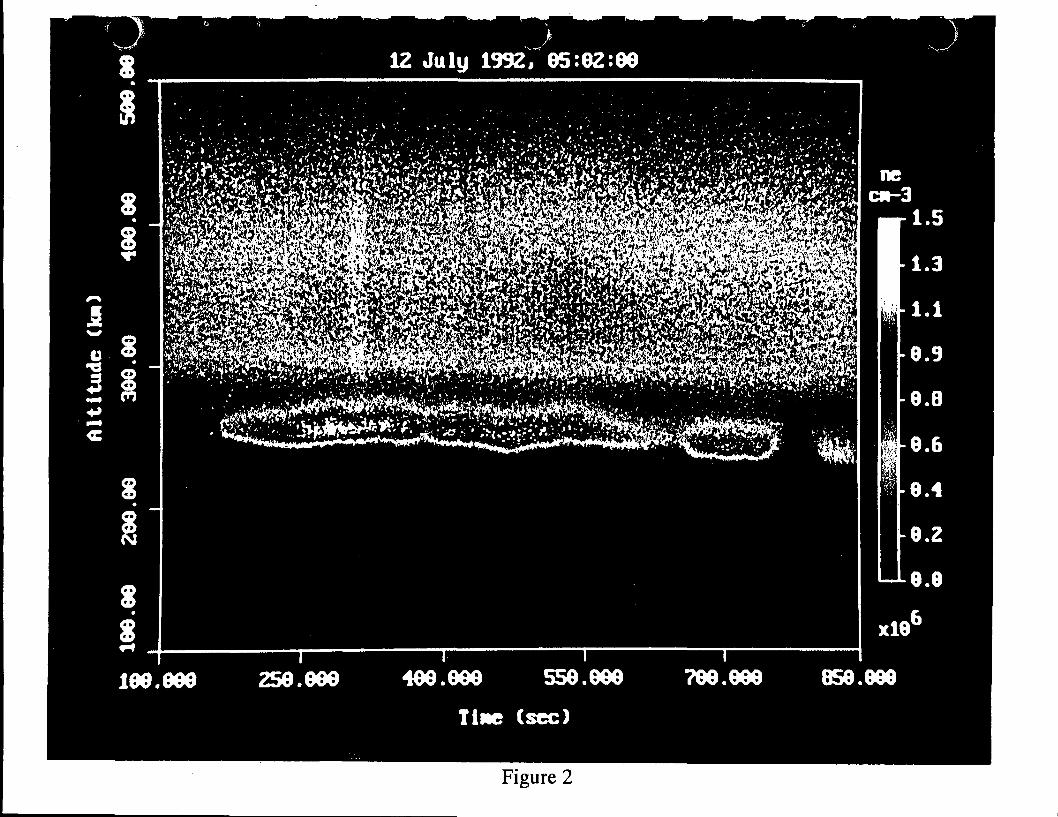
12 July 1992/05:62:86
166.666 256.666 556.969
Tine (sec)
766.666 859.666
Figure 2

Location of 430 MHz Beam at 240 km AltitudeOH-
62
i M*S 58o
£3oo 56gojto
5 54
52
<;n
j ' ' t 0-228
•f 234
f
HF BEAM HF BEAM f 246
(-10 DB) i(-3DB) ;
! \ i 258'.i < ;
t •i
S ' 4- 270
1 \ r -' A^ + 282; 462 \ 4- 288-312« 4- ', :\
t74 * v \ / //^\\ > 450 \ f 318 (((©)))
\ M \ • ~\ ,,, + 330 RELEASE
\ •|-^flr.-^.-.-.-."--¥-< +\ + ^ 152 S AFTER3/o .--f .'.'.'-'j-K •^••< ^ ^Af) LAUNCH•...v^'^^*"^ « \ J^£* i t I t 1 1
-10 -5 0 10
Distance East-West from AO (km)Figure 3

1 1 1 1 1TIME1 1 1
TO LAUNCH2 2 2 2 2 3 3 3 3 3 3 3 3 4 4 4 4 4 4 4
LUoD
P
s s s s s s s s s s
2300 4 6 8 1 0 1 2 1 4
ELECTRON CONCENTRATION (106 cm-3)
16
Figure 4

Figure 5

12 July 1992, 85:02:66
"̂%il'»
lee.eee 157.eee zH.eee 271.eeeTine (sec)
328.eee 385.eee
Figure 6

Critical Altitude280
J260<D
TD3§240
22050 100 150 200 250 300 350 400 450 500
Time after Launch (s)
(0
£-200
8-400
-600
-800
Vertical Velocity of Critical Layer
Ion Line
B
50 100 150 200 250 300 350 400 450 500Time after Launch (s)
60
§40
®20Coo
CO
Scale Length, H, at Critical Altitude
50 100 150 200 250 300 350 400 450 500Time after Launch (s)
Figure 7

AA2: rTasma Lines
CO
1VJ"
101
100
10-11(
'."'«'!/•; vii
- •
_
ji * V
cw
••. iIMI •
I'
111
i
HO
CW
FFF
)0 150
HD
200
\i\\\\
\ \i
' i!-*^- ̂ ' •
*
ii
|!
— Uivyj
D<
s
i i
3shifted Plasma Line I
9wnshifted Plasma Line _
i/i A n
-
_
•-
HF FACILITY OPERATIONS :
cw LD
250
CW
300
LD cw
1
350
LD cw
1-c
CW
IF)FF
400
HD
450
cw-
500
Time (s)
Figure 8

CDTJ
o>CO'o
CO
50
40
30
2 2013
10
0
-20 0 20Frequency Displacementfrom 430 MHz - IMF (kHz)
-20 0 20Frequency Displacement
from 430 MHz (kHz)
-20 0 20Frequency Displacement
from 430 MHz + fHF (kHz)
Flmire

S/N = 5.4 S/N = 17.1 S/N = 1.2x10⁵
-50 0 50
Frequency Displacementfrom 430 MHz-fHF (kHz)
20
Frequency Displacementfrom 430 MHz (kHz)
-50 0 50
Frequency Displacementfrom 430 MHz + fHF (kHz)
Figure 10

0.5
O1—L-
1
0.5
JD 0
8to 1(00>
0)0.5
O0."toC, Q
CO .
0.5
O1—L-
1
0.5
S/N = 6.4
242.64 km
242.49 km
242.34 km
242.19km
242.04 km
-20 0 20
Frequency Displacementfrom 430 MHz (kHz)
Figure 11

S/N = 684 S/N = 7.1 S/N = 2.6x10⁴
0.5
0
1
0.5
JO 0
8V) 1
Ifc 0.5
O
g>CO.
0.5
0
1
0.5
A
051
-50 0 50
Frequency Displacementfrom 430 MHz-fHF (kHz)
Frequency Displacementfrom 430 MHz (kHz)
Figure 12
A
A.
50
Frequency Displacementfrom 430 MHz + fHp (kHz)

S/N = 391240,99km 241.14 tan
1
0.5
_«
1
0.5
0>"^ 4<D '-CO0V)
(5 io
0 0.5
1g 1O)
CO
1
0.5
0-5
1
0.5
-5
:
__Jv__• 0 0 5
240.69 km
1_JL_iO 0 5
24039km
__Jl_0 0 5
240.09km•
-
0 0 5
239.79km-
-
. >v _ _ .
0 0 5
1
0,
00 -!
1
0.5
0 -!
1
0 -J
1
0,
0 -J
1
OJ
0 ?5
•
•
iO 0 5(
240.84 km'
_JL_iO 0 5
240^4 km
__JL_0 0 5(
240.24 km
•
____A__0 0 5(
239.94 km
1
\
. - Jl
0 0 5(
Frequency Displacement from 430 MHz - IMF (kHz)
Figure 13a

0.5
O1—L
-20
S/N = 3.4240.99 tan 241.14 km"
20O1—•-
-20 20
1
0.5
240.69 km
240.09km
20
20
1 •
0.5
0"—'--20
0.5
0.5
O1—•--20
240.84 km
240.54 km
240.24km
20
20
20
239.79km
1 •
0.5
239.94 km
-20 0 20 -20 0 20
Frequency Displacement from 430 MHz (kHz)
Figure 13b

S/N = 728240.99km 241.14km
1
0.5
-5
1
0.5
0*m '*03UW
c5 i<D
0) 0.5
1D_
:
-
A0 0 5>
240.69km
!'
" i0 0 5
24039km
I
JlC -50 0 5
1
0.5
0
1
0^
0
1
0.5
00 -5
I
i
0 0 5(
240.84km
!ji •0 0 5(
240^4 km
1'
J[>0 0 5(
O)CO
1
0.5
_«
1
0.5
.<
240.09km•
.
7V_
1
0.5
240.24 km
:
i
. . A50 0 50 "50 0 5
239.79kmi
•
50 0 5
1
00 -i
239.94 km
i
! •
>0 0 5(
Frequency Displacement from 430 MHz + IHF (kHz)
Figure 13c

c N
i &0) LLO X(0 •»—Q. +
s£o
O Cc Q -5
it 2-10
<D 5O £,
CO
O
2
IIo u-
"5. T.12 NQ I
f §II ^s
0
r
-J- 245T3
240
160 180 200 220 240 260 280 300 320 340 360
Time (s)Figure 14

3. AA-4: The Ionospheric Focussed Heating (IFH) Experiment
The AA-4 experiment involved a collaborative effort between F. T. Djuth of GeospaceResearch, Inc. (GRI) and P. A. Bernhardt (and others) of the Naval Research Laboratory (NRL).GRI's principal contributions involved the acquisition of the Arecibo incoherent scatter radardata, detailed analyses of the experimental results, and an interpretive study conducted incollaboration with investigators from NRL. This resulted in the scientific publication presentedbelow, which is currently in press in the Journal of Geophysical Research.
The Ionospheric Focussed Heating (IFH) ExperimentP. A. Bernhardt, C. L. Siefring, P. Rodriguez, D. G. Haas, M. M. Baumback,
H. A. Romero, D. A. SollinPlasma Physics Division, Naval Research Laboratory, Washington, DC 20375
F. T. DjuthGeospace Research, Inc. El Segundo, CA 90245
L. M. DuncanUniversity of Tulsa,Tulsa, OK 74104
D. E. HuntonPhillips Laboratory, GPID, Hanscom Air Force Base, MA 01731
C. J. PollockNASA/Marshall Space Flight Center Code ES53, Huntsville, AL 35812
M. P. Sulzer and C. A. TepleyArecibo Observatory, Arecibo, PR 00613
L. S. Wagner and J. A. GoldsteinInformation Technology Division, Naval Research Laboratory, Washington, DC 20375
ABSTRACT
The Ionospheric Focussed Heating (IFH) rocket vas launched on 30 Hay
1992. The sounding rocket carried an instrument and chemical payload along
a trajectory that crossed the intersection of the beans from the 430 MHz
incoherent scatter radar and the 5.1 MHz high-pover radio-wave facility
near Arecibo. The release of 30 kg of CF3&r into the F-region at 285 km
altitude produced an ionospheric hole that acted like a convergent lens to
focus the HF transmissions. The pover density inside the radio beam vas
raised by 12 dB immediately after the release. A vide range of new
processes vere recorded by in situ and ground based instruments.
Measurements by instruments flying through the modified ionosphere show
3-1

small-scale micro-cavities (< 1 meter) and downshifted electron-plasma
(Langmuir) waves inside the artificial cavity, electron density spikes at
the edge of the cavity, and Langmuir waves coincident with ion-gyro-radius
(4 meter) cavities near the radio wave reflection altitude. The Arecibo
incoherent scatter radar showed 20 dB or greater enhancements ion acoustic
and Langmuir wave turbulence after the 5.1 MHz radio beam was focussed by
the artificial lens. Enhancements in airglow from chemical reactions and,
possibly, electron acceleration were recorded with optical instruments.
The Ionospheric Focussed Heating experiment verified some of the preflight
predictions and demonstrated the value of active experiments that combine
high power radio waves with chemical releases.
I. Introduction
The Ionospheric Focussed Heating (IFH) experiment was designed to
demonstrate the use of chemical releases to enhance the effective radiated
power of high-power HF facilities and to measure in situ the turbulence in
the heated and chemically modified plasma. The rocket payload for the IFH
experiment consisted of a chemical canister and a set of diagnostic
instruments. The IFH payload was launched on 30 May 1992 during the
Combined Release and Radiation Effects Satellite (CRRES) program. All of
the CRRES Caribbean rockets took off from the north coast of Puerto Rico.
The CRRES rocket campaign, called "El Coqui" was organized to take
advantage of the ionospheric heating facility, incoherent scatter radar,
and other ground support diagnostics located near the Arecibo Observatory
in Puerto Rico [Djuth, 1993; Kelley et al., 1994; Djuth et al., 1994].
The term "Ionospheric Heating" refers to ionospheric modification by
high power radio waves. The transmitted high frequency (HF)
3-2

electromagnetic wave is called the pump. The effective radiated power
(ERF) of the pump is calculated as the product of the transmitter power and
the antenna gain for the facility. The ERF of the Arecibo HP facility was
about 50 MV at the 5.1 MHz frequency used during the El Coqui campaign.
The ERF was about 10 MV lower than usual because of reduced transmitter
antenna gain resulting from tilting the normally vertical beam. The HP
beam was tilted 12 degrees to the north to allow penetration by the rockets
without endangering populated areas.
The Arecibo incoherent scatter radar (ISR) is a primary diagnostic
for the heated plasma. The transmitted wave (f*p = 430 MHz) from the radar
is scattered from plasma waves (fp) yielding scattered electromagnetic
waves (fs) that are received with the 305 meter dish antenna located at
Arecibo. The scattering conditions require that the scattering wavelength
is equal to one-half the transmitted wavelength (X = c/f«p = 0.698 m) of the
radar.
When the powerful HP transmitter is turned on, enhanced ion lines may
be produced by scatter from HP induced ion acoustic waves [Showen and Kim,
1978]. All ion line spectra reside within a 20 kHz band centered on the
radar frequency. Plasma line spectra are produced by electron plasma waves
scattering the radar signal. The frequencies of these lines fall near f<p ±
fHF where fgp is the pump frequency.
The electromagnetic pump may be scattered by plasma waves to yield
stimulated electromagnetic emissions (SEE) [Thide et al., 1989]. SEE is
often characterized by a downshifted maximum (DM) located about 15 kHz
below the pump frequency. During the IFH experiment, SEE observations were
conducted with a radio frequency spectrum analyzer connected to a broad
band receiving antenna.
3-3

The process for conversion of high power radio waves into plasma
waves has been explained in terms of parametric instabilities [Fejer, 1979]
or Langmuir turbulence [Dubois et al. [1990]. The pump electromagnetic
wave can decay into two plasma waves, an electron plasma wave and an ion
acoustic wave propagating in opposite directions. The frequency of the
electron plasma waves is offset from the pump frequency by the frequency of
the ion acoustic wave.
High power radio waves simultaneously produce large scale (>10 km)
cavities, ion gyro radius structures (~ 10 m), medium scale irregularities
(~ 1 km), and small scale Langmuir turbulence (~ 1 m). Often, these
irregularities are located in the same region of heated plasma. At
Arecibo, during special conditions found at winter and solar minimum, large
scale cavities produced by thermal expansion of the plasma have been
observed near the reflection point of the BF beam [Duncan et al., 1988;
Hansen et al., 1990]. Inside these cavities the ISR often detects enhanced
ion lines from ion acoustic waves [Duncan et al., 1988; Bernhardt et al.,
1989].
The effects of electron acceleration are seen as airglow clouds
attached by magnetic field lines to the HF wave reflection region
[Bernhardt et al., 1988, 1989, 1991b]. Suprathermal electrons produced by
electron plasma waves acting on the thermal population in the F-layer
stream down magnetic field lines to collide with and excite atomic oxygen
in the neutral atmosphere. Fluxes of energetic electrons can excite the
red-line (630.0 nm) and green-line (557.7 nm) emissions from atomic oxygen
in the upper atmosphere. The electron energies required to excite
measurable intensities for the two lines are 3.5 and 6.0 eV, respectively.
The intensities of 630.0 and 557.7 emissions have been analyzed to yield
3-4

estimates of the suprathermal electron energy spectra [Bernhardt et al.,
1989].
All of the phenomena mention above (i.e., enhanced ion-lines, SEE,
parametric instabilities, electron acceleration, enhanced airglov) occur if
the power density from the HP pump wave exceeds a threshold. One way of
exceeding existing thresholds is to focus the beam vith an artificial
ionospheric lens. The purpose of the IFH experiment was to (1) use a
chemical release to form an artificial lens that focuses the radio beam of
the Arecibo HF facility and (2) measure the effects of the resulting
increase in ERF on the ionospheric heating processes. This paper presents
an overview of the observations that were affected by the focussing. The
next section describes the rocket payload that formed the artificial lens
and measured the effects of the chemical release in situ. Section III
outlines the observations made by the Langmuir probe, plasma wave receiver
and electric field instruments on the rocket. The data from the Arecibo
incoherent scatter radar are described in Section IV. Airglow enhancements
following the chemical release are discussed in Section V. Conclusions
regarding the IFH experiment are given in Section VI.
II. Experiment Concept - Chemically Produced Cavity
At Arecibo, large-scale cavities and enhanced ion-acoustic waves have
been found to be coincident with electron acceleration that produces
airglow [Bernhardt et al, 1989]. Self action of the HF wave generates the
large-scale density structures that "self-focus" the HF wave [Hansen et
al., 1990; Hansen, Morales, and Maggs, 1992]. The processes that couple
the HP-induced cavities to enhanced ion-acoustic waves are not understood
so an experiment was devised to control the cavity formation and then see
3-5

the response of the enhanced ion lines and the optical emissions. The
active experiment used a chemical to form a large electron scale cavity in
the HP beam. The effects of the artificial cavity on the heated ionosphere
vere recorded vith in situ and ground based instruments. This experiment
vas called "Ionospheric Focussed Beating" (IFH) because it vas thought that
the chemically produced cavity vould focus the HP yielding substantially
larger field strengths for the HP waves [Bernhardt and Duncan, 1987].
The ionospheric hole produced by the release of CF3Br removed
electrons by dissociative attachment. The effectiveness of this chemical
vas demonstrated in the F-region during the NASA-sponsored NICARE 1
experiment [Bernhardt et al., 1991]. The dissociative attachment reaction
is
+ e~ -» Br~ + CF rate coefficient: k^ ~ 10~ cm̂ /s. (1)
Vith a 30 kg release of this material, the electron population vas depleted
vithin 10 km of the release point [Bernhardt et al., 1991]. The negative
and positive ions are mutually neutralized by the reaction
Br~ -• + 0+ -» Br* + 0* rate coefficient: k£ ~ 10~8 cm3/s. (2)
Care must be taken to distinguish betveen airglov from 0* excited by
surpra thermal electron fluxes and by chemical reactions in the negative ion
plasma.
The plasma vaves measured in situ during the IFH experiment vere
expected to be strongly influenced by the presence of the negative ions.
During the NICARE 1 and 2 experiments, new vave modes vere excited inside
3-6

the negative ion cloud even without the presence of a high power radio wave
[Ganguli et al., 1993]. Enhanced electric field fluctuations come from
lower hybrid waves, ion plasma waves, and ion cyclotron waves excited by
the presence of Br~ and 0+ in the chemically modified plasma [Scales et
al., 1993]. With the IFH experiment, the addition of an electromagnetic
pump field added to the complexity of the plasma wave structures in the
negative ion cloud.
The magnitude of the focussing by the chemically produced cavity was
estimated to be 20 dB in the theoretical paper by Bernhardt and Duncan
11987]. The heating at the focus yielded channeling of the HF beam.
The IFH experiment was designated as the CRRES AA-4 rocket in March
of 1988. In situ instruments were delivered by Naval Research Laboratory,
Phillips Lab, and Marshall Space Flight Center for integration into the
pay load in 1990. The launch of AA-4 occurred on 30 May 1992 at 0411
Atlantic Standard Time (0811 Universal Time) from the launcher located near
Vega Baja in Puerto Rico. The chemical payload consisted of 30 kg of CF3Br
inside a pressurized tank heated to 340 K. The release occurred at
08:13:49.3 UT within 5 km of the center of the Arecibo HF beam. The radar
track of the IFH rocket trajectory established the release location was
18.97 °N -latitude, 66.60 °tf longitude, and 283 km altitude. Using real
time trajectory information, the chemical tank valve was opened with a
command signal so that the release was deposited 20 km below the reflection
altitude of the 5.1 MHz HF transmissions. The gas expansion and inertial
motion caused the electron depletion to pass through the reflection
altitude.
Figure 1 illustrates the locations of the flight trajectory, heater
beam, and ISR scan projected onto the ground plane containing the island of
3-7

Puerto Rico. The CF3Br release occurred slightly to the east of the HF
beam center. Data at 630.0 nm from the Arecibo Fabry-Perot interferometer
were analyzed to yield a thermospheric wind velocity of 40 m/s westward.
The ionospheric hole created by the release drifted with this velocity into
the center of the heater beam. By using post launch extrapolations for the
rocket trajectory and commanded release, the ISR beam was positioned at the
release point. After the ionospheric hole was well developed, the ISR was
scanned in azimuth to keep track of the westward convection of the
ionospheric hole.
The IFH rocket was fully instrumented to measure the plasma
densities, electric fields, plasma waves, and suprathermal electrons
expected to be detected in the modified plasma (Table I). The placement of
the sensors is shown in Figure 2. All of the booms were located 1 meter or
more ahead of the two chemical release valves. Upon release the
instruments were surrounded by the CF3Br cloud. The cloud initially
expanded with a mean thermal speed (2kT/m)̂ 2 = 200 m/s keeping the rocket
payload as its center of mass. After electron attachment, the negative
ions became tied by gyro orbits to the magnetic field lines and the rocket
passed through the top edge of the electron depletion.
Both electron and ion densities were measured using probes on the IFH
rocket. The Naval Research Laboratory provided a double Langmuir probe
that was biased at a fixed voltage (+6 V) to collect electrons. The
separation between the two probes was 1.26 meters. Two disk probes biased
to collect positive ions were mounted on the payload skin just aft of the
E-Field Booms. The disk probes, one small (1.5") and one large (3"), were
provided by the Phillips Laboratory.
Multiple electric field and plasma wave receivers were provided by
3-8

the Naval Research Laboratory covering the 0 to 12 MHz frequency range.
The electric fields were detected with booms deployed from the payload
after launch. The spacings between sensors on the booms varied from 0.3 to
3.4 meters. Plasma waves near the HP pump frequency of 5.1 MHz were
detected with two radio frequency sensors with spacings of 5.5 and 11 cm.
The radio frequencies are downconverted to a 150 kHz band and digitized
with 12-bit words. Details of the downconverter are given by Haas et al.
[1993].
The energy spectrum of suprathermal electrons between 0.5 and 50 eV
was to be detected with the Thermal Electron Capped Hemispherical
Spectrometer (TECHS) instrument provided by Marshall Space Flight Center.
The TECHS was mounted on the opposite side of the EF-5 and EF-6 booms.
Unfortunately, after launch the voltage sweep was lost on the instrument
and the energies of the detected electrons have not been determined.
III. In Situ Measurements
The data from the flight instruments can be divided into 5 phases
(Figure 3). In Phase 0, before the release, the electron density
measurements showed both 3.4 s spin modulation and fine scale
irregularities (Figure 3a). At this time, the 5.1 MHz reflection altitude
was 305 km. The irregularities were probably generated by the heater
because their amplitude grew as the rocket moved closer to the HF
reflection height. The normalized fluctuations (An/n) increased from 3% at
270 km altitude to 7% to 283 km just before release. The low frequency
electric field data also show enhanced fluctuations during this period.
These fluctuations may provide evidence for field aligned irregularities
extending down from the reflection altitude. These irregularities could
3-9

10
be the result of the constant ionospheric heating for more than one hour
prior to launch. The An/n fluctuation level vas less than 1% on the
dovnleg of trajectory in the same altitude range when the rocket vas veil
avay from the heated volume. During another launch from Puerto Rico,
Kelley et al. [1994] reported in situ measurements of small scale
irregularities dovn to 18 km belov the 5.1 MHz reflection altitude.
Before the rocket could cross the ambient reflection level for the
5.1 MHz HP waves, the electron attachment chemical vas expelled from a
heated tank. For the first 9 seconds (Phase 1) after the C?$Br release,
the depressed electron plasma is pitted vith narrov micro cavities vith
sizes of less than 1 meter (see Figure 3b) vhere size is assumed to be the
rocket velocity times the measurement time. Since the rocket vas moving at
an oblique angle (123 degrees) vith respect to the magnetic field, the
sizes of stationary, field aligned structures vould be smaller by a factor
of Sin(123°) = 0.839 than the scales given in Figure 3 and 4. A high
resolution sample of this data is plotted versus distance along the
trajectory in Figure 4a. The micro cavities vere recorded by both Langmuir
probes. Usually the features smaller than the distance between the tvo
probes vere detected only at one of the probes. The micro cavities larger
than the 2 meter probe separation vere usually measured vith both probes
simultaneously. Strong electric fields saturated the E-field instrument
during this early time.
During Phase 2, the IFH payload entered the negative-ion cloud
boundary layer vhere the electron density vas 1 to 10 % of ambient (Figures
3b and c). The density fluctuations (An/n - 17%) vere dominated by spikes
vith vidths of about seven meters. A detailed spatial sample of these
micro spikes is illustrated in Figure 4b. In situ measurements shoved
3-10

11
electric field reversals simultaneous with the micro spikes and cavities.
The transition between electron micro-cavities in phase 1 to electron
micro-spikes in phase 2 has been explained by Scales et al.[1994a and b]
using electrostatic simulations of the three component plasma. A shear in
the electron velocity at the negative-ion/electron boundary layer seems to
drive the instability that produces the irregularities. At early times in
the center of the electron depletion, the negative ions form density spikes
that are neutralized by electron density cavities. The background positive
ion plasma remains relatively uniform. At later times, in the boundary
layer, the electron spikes form as the negative-ion and positive-ion plasma
evolves into density cavities. Unfortunately, the frequency response of
the positive-ion disk probe measurements was too low to.verify the computed
variations in positive ion density.
The amplitude of density fluctuations was at a minimum (An/n < 7%)
when the payload was between the negative ion boundary layer and the HF
wave reflection altitude. During Phase 3 the rocket payload approached the
new 5.1 MHz reflection region (between 311 and 316 km altitude at times 21
through 30 seconds after release). As with phase 0, the irregularity
fluctuation level increased as the rocket approached the critical density
of 3.23 x- 10^ cm~3. High resolution spatial plots of selected data are
illustrated in Figure 4. The time, rocket speed, and altitude for the
start of each data sample is given. The deepest cavities between 197 and
198 seconds in Figure 3d show internal structures in greater detail in
Figure 4c where the distance along the trajectory is used as the horizontal
axis. The two 40% cavities near 1.1 km distance (317.4 km altitude) at the
right side of Figure 4d have radii of about 4 meters.
The chemical release at 283 km expanded over the altitude (290 km)
3-11

12
where the HF wave reflected before the release. Consequently, any
irregularities at that level are overwhelmed by the dissociative attachment
of electrons. When the rocket passed through the new reflection level at
the top of the electron density hole, the observed irregularities must have
been newly formed because the HF wave did not penetrate to this level
before the release - ten seconds earlier. The average radius of the
cavities in this region were on the order of an 0+ ion cyclotron radius (4
meters). Irregularities of this size have been detected with radio
backscatter by [Minkoff et al., 1974; Belenov et al., 1977; Coster et al.f
1985]. In situ measurements of similar size structures have been reported
by M.C. Kelley et al. [1994] during a rocket flight through the Arecibo
heater beam on 9 June 1992.
After passing through the reflection level, the rocket entered the
unheated plasma labeled phase 4 in figure 3d. Here, the electron density
fluctuations decreased to values of An/n less than one-percent.
The chemical release and subsequent electron depletion modified the
HF wave electric field. Figure 5 shows the changes in the 5.1 MHz electric
field measured in situ between 169.0 and 169.5 seconds after launch. At
this time the rocket velocity was 1411 m/s with an angle of 17° with the
vertical. The electric field measurements shows successive minima as the
rocket passes through the nulls in the standing wave (or Airy) pattern of
the reflected 5.1 MHz transmission. The minimum distance between the nulls
is expected to be X̂ /2 where X̂ =c/(n̂ f̂ ), c is the speed of light, nj is
the refractive index in the magneto-plasma, and fj = 5.1 MHz is the
transmitter frequency. The plasma density just below release is ne = 2.6 x
1011 m~3, the gyro frequency in the ionosphere over Arecibo is fce = 1.07
MHz, and the propagation angle between a vertical wave vector and the
3-12

13
magnetic field is 6 = 40°. With these parameters, the refractive index for
the 5.1 MHz wave is n^ = 0.530 and the wavelength in the plasma is X} = 111
meter. Dividing Xj/2 by the rocket velocity gives the scale length shown
in Figure 5a. During the upleg of the flight, the nulls in the 5.1 MHz
wave measurements are greater than Xj/2 (Figure 5a,b, and c).
After the release at 169.29 seconds, the free electrons vanish and a
horizontally-stratified standing-wave would have nulls spaced by X0/2 where•>
XQ = c/fi = 58.82 meters in free space. Also, the electric field amplitude
should drop by a factor of (n})"2 ... 0.73 to maintain that same power
density as the in the unmodified plasma. This effect is illustrated by the
one-dimensional computation of the standing wave at 5.1 MHz reflecting
above an electron density depletion in a horizontally stratified layer
(Figure 6). The ionospheric profile represents a vertical cut through the
ionosphere 3 seconds after the CFjBr release. The one-dimensional
calculations for these fields do not account for the limited horizontal
extent of the ionospheric hole and the bending of the HF wave fronts.
The in situ measurements of the electric fields for the 5.1 MHz wave
(Figure 5) differ from the calculated fields (Figure 6) in several ways.
The electric field amplitude increases by a factor of 3 after the release
and the nulls have spacings both greater and less than XQ/2. The power
density immediately after release increases by a factor of 16 or 12 dB.
This enhancement is attributed to focussing by the ionospheric hole. The
erratic variations in the wave nulls result from the rocket passing through
a time-varying interference pattern established in the electron density
cavity. A multi-dimensional model of these fields is being constructed to
study these fields.
The frequency spectrum from the 5.1 MHz downconverter on the IFH
3-13

14
rocket is shown in Figure 7. While the rocket payload was inside the
ionospheric hole, the 5.1 MHz pump was broadened into a downshifted
spectrum with a width of 1.3 kHz. This broadening started at the time of
the release (169.3 seconds after launch). The intensities of the0
downshifted waves were greater than 10 dB above the prerelease level. The
source of the broadening may have been scatter of electromagnetic waves by
the small scale irregularities at the edge of the negative ion cloud
[Scales et al., 1994a and b].
The width and intensity of the waves returned to the prerelease level
26 seconds after release when the rocket had passed through the Phase 2
irregularities. A localized burst of broad band HF noise (Af < 8 kHz) was
next recorded when the payload transited the critical region of the
ionosphere during Phase 3. Accurate determination of the HF reflection
point is not possible from the electron density data because of modulation
from the spin and precession of the payload. Based on the disappearance of
the 5.1 MHz signals from the plasma wave receiver (Figure 8), the critical
level.was penetrated between 199 and 200 seconds after launch.
A plot of the electron density irregularities, the spectral
deviations from 5.1 MHz, and low frequency electric fields show evidence of
Langmuir and ion acoustic waves coincident with the density cavities near
the reflection level (Figure 8). These data are consistent with formation
of field aligned irregularities that guide Langmuir generated by parametric
decay of the pump electromagnetic wave. The measured irregularities seem
to be field-aligned ducts described by Muldrew [1978 and 1988] that guide
Langmuir waves.
The width of the high frequency spectral broadening near the
reflection level is about 2 kHz. As will be shown later in Figure 12, the
3-14

15
broaden in Langmuir wave scatter of the 430 MHz radar is on the order of 10
or 20 kHz. The apparently narrow in situ spectral measurements may be due
to the presence of negative ions at the top of the ionospheric hole. The
narrowness of the spectrum is not due to instrument instrumental which had
a ± 75 kHz bandwidth capability (Table I). A more detailed discussion of
the in situ wave measurements near the HF reflection region are given by
Rodriguez et al. [1994].
IV. Incoherent Scatter Radar Measurements
Even though the 5.1 MHz HF transmitter was in operation continuously,
no enhanced ion lines were recorded up to 450 seconds after the launch of
the IFH rocket. The trajectory of the rocket was measured by the sidelobes
of the Arecibo radar. Backseatter by the thermal ion line showed the
reduction in electron density following the chemical release. Both of
these effects are shown by the left half of Figure 9. The azimuth of the
radar was fixed at 13 degrees until 300 seconds after launch. During this
period, no enhanced scatter from ion-acoustic waves was measured even
though strong low-frequency electric fields were measured in situ (Figure
8). This may have been because the Arecibo radar beam was not aligned with
the turbulent area inside the rapidly evolving ionospheric hole. After
this time, the azimuth was scanned from one edge of the ionospheric hole to
the other.
The right half of Figure 9 shows the effects of focussing through the
artificial hole. Because of a 40 m/s westward drift, the hole center moved
to an azimuth of -5 degrees, 500 seconds after release. Around this time,
a strongly enhanced ion line (EIL) was observed where the HF wave reflected
at the critical density region. This region occurred where the pump
3-15

16
frequency equaled the electron plasma frequency across the top of the
artificial hole. The intensity of this EIL was the largest recorded during
the May-July period of the El Coqui rocket campaign. This unusual
intensification of the EIL vas most likely the result of focussing by the
chemically-produced hole in the F-region.
The radar downshifted plasma line (PL) vent through a number a
changes during the IFH experiment (Figure 10). Before the chemical
release, a weak PL vas recorded near the HF reflection height of 290 km in
the F-region. During the first ten seconds following the release, the
plasma line vas recorded at multiple altitudes betveen 285 and 300 km. The
intensity increased by 10 dB in a path aligned with the rocket trajectory
between 295 and 300 km. After this initial enhancement, the PL vanished
only to reappear at the top of the chemically-produced cavity with an
intensity comparable to the prerelease value, the absence of plasma-lines
when the instruments on the rocket were recording strong Langmuir waves
(Figure 8) is again attributed to the misalignment of the radar beam inside
the active region of the ionospheric hole.
The strongest enhancements in the PL occurred between 280 and 430
seconds after release. The 10 km range spread at this time (Figure 10) may
be the result of sidelobe smearing associated with the coded radar pulse.
The actual range in altitude is probably similar to the 2 km spread shown
from the strongest enhanced ion line in Figure 9. At 480 seconds after
launch (310 seconds after release) the azimuth scan reversed directions.
Both the plasma line and enhanced ion line show spatial symmetry around
this time. This indicates that turbulence was excited at the HF reflection
layer by focussing through a long-lived ionospheric lens.
The plasma line ten seconds after release vas enhanced by 10 dB
3-16

17
(Figure 11). After release at 169.3 seconds, the HF reflection layer
splits into a region along the rocket trajectory near 300 km altitude and a
region near the original 290 km level. The large plasma line enhancement
at 300 km altitude is coincident vith the strong downshifted Langmuir waves
recorded on the rocket (Figure 7). The transient disturbance displayed in
Figure 11 may be associated vith turbulence in the boundary layer of the
negative ion cloud [Scales et al., 1994].
The spectra of the plasma lines and enhanced ion lines were obtained
during the data gaps shown as white vertical bars in Figure 10. A sample
of the spectra during the period of strong enhancements 335 seconds after
release (504 seconds after launch) is illustrated in Figure 12. The plasma
line spectrum in Figure 12a shows all of the characteristic features (i.e.,
decay line, cascade bump) of an un-focussed plasma line at Arecibo. The
enhanced ion line is easily distinguishable from the background (thermal)
ion line (Figure 12b). A typical feature of enhanced ion lines is that the
upshifted and downshifted components are nearly symmetrical. This is the
case for the focussed enhanced ion line (Figure 12b). The only unusual
features of the observed plasma or ion lines were their large intensities.
Besides electromagnetic wave focussing, processes such as linear mode
conversion [Mjdlhus, 1990] could be responsible for enhanced coupling to
Langmuir waves. If linear mode coupling were the source of the enhanced
ion lines, one would expect assymetries in the plasma line and ion line
spectra. This because the upgoing electromagnetic wave would be expected
to mode convert into an upgoing Z-mode which reflects and become a
downgoing Langmuir wave [Mjdlhus, 1990]. With a downgoing Langmuir wave,
the downshifted plasma line and the enhanced ion lines should be absent.
Ve have also ruled direct mode coupling because the wave normals of the of
3-17

18
the rays do not have the critical angle required for linear conversion.
Based on raytracing through a model ionosphere, the source of the
enhanced turbulence has been attributed to focussing by the chemically
produced cavity. Without the chemical release, the pump beam reflects near
300 km independent of ray launch angle (Figure 13a). In the early phase of
the release, the strong electron density gradients form a focal point
inside the ionospheric hole. Using an electron density model that matches
the ISR electron density profile 10 seconds after the Cf̂ Br release, the
focus is 8 km from the center of the hole vhereas the upper reflection
boundary of the hole is 15 km from the center (Figure 13b). The hole
evolves by the action of chemistry and plasma transport. At some point in
the evolution, the HF focal point and the reflection boundary coalesce
yielding a region of large electric fields. This condition occurs at about
300 seconds after release. The large electric fields responsible for the
enhanced radar backseatter occur because (1) the HF waves are focussed onto
a reflection contour of the electron density and (2) the group velocity
goes to zero at the reflection level causing an accumulation of the wave
energy. The focussing processes are limited by diffraction [Bernhardt and
Duncan, 1987] and by irregularities that may scatter the electromagnetic
waves. Figure 13c shows a tube of rays focussed on the upper boundary of
the ionospheric hole 293 seconds after release. This is the time period
when the unusual enhancements of ion acoustic and electron plasma waves
were observed in the ISR data.
V. Ground-Based Optical and Radio Observations
A number optical instruments were operated at the Arecibo Observatory
during the IFH experiment. Photometers with 5 degree fields of view were
3-18

19
pointed at the release location and recorded the 557.7 and 630.0 nm
emissions. A low-light-level CCD camera with a 60 degree field of view
recorded 630 nm emissions from the release and HF focussing regions. A
description of these instruments is given by Bernhardt et al. [1988].
An enhancement of airglow during the IFH experiment occurred
immediately after the C?3Br release. Figure 14 illustrates the 20 Rayleigh
increase in 557.7 nm (green-line) and the 4 Rayleigh increase in the 630.0
nm (red-line) of atomic oxygen. These enhancements probably come from the
excited atomic oxygen that vas a product of mutual neutralization reaction
(2). Bernhardt [1987] predicted that 0(̂ 0) should be the primary excited
oxygen state from Br~ and 0+ mutual neutralization. Based on the
observations that the 557.7 nm intensities were five times larger than the
630.0 nm intensities, ve conclude that 0(̂ S) vas the primary product of the
reaction
Br~ + 0+ -* Br(2P°) + 0(1S) + 6.065 eV (3)
and that green-line and red-line emissions came from
0(1S) -» 0(1D) + hv(557.7 nm) TJ = 0.71 s (4)
O(!D) -» 0(3P) + hv(630.0, 636.4 nm) T2 = 147 s (5)
where T^ and T£ are the radiative lifetimes of the states.
The process described by (3), (4), and (5) is consistent with the
observations. The red-line emission peaked 80 seconds after the maximum
green-line emission. Also, the red-line intensity was 20^ of the green-
3-19

20
line intensity. Both of these effects can be attributed to the relatively
long lifetime of the 0(*D) state which is formed by electronic transition
from the shorter-lived 0(*S) state. The integrated volume emission rate
was reduced by diffusion of the 0(*D) atoms and by collisional quenching
before radiation [Bernhardt, Tepley, and Duncan, 1989].
At the time of the strongly enhanced ion line, between 450 and 570
seconds after launch, a small 1 Rayleigh enhancement is observed in the
630.0 nm (red-line) channel of the photometer. This peak is coincident
with the enhanced ion lines produced by focussing of the HF radio waves.
Its magnitude is surprisingly small. Since HP-induced perturbations in the
green-line are typically 5% of the red-line values [Bernhardt et al.,
1989], a corresponding peak would be too weak to be detectable in the 557.7
nm channel (Figure 14a). The low-light-level CCD camera did not show any
enhancements in red-line airglow.
Previous experiments at Arecibo have indicated that extremely strong
enhanced ion lines are accompanied by larger (~ 50 Rayleigh) increases in
red-line airglow [Bernhardt et al., 1988; 1989]. This was not the case for
the IFH experiment. Ve are currently investigating a number of
explanations for the apparent weakness of heater induced airglow. These
include the effects of residual negative ions in the plasma and tilting of
the HF beam from vertical.
Using ground-based spectrum analyzers attached to wide band HF
antennas, observations of stimulated electromagnetic emissions (SEE) were
attempted at Arecibo, PR and Providenciales, Caicos. No SEE was detected
during the entire El Coqui campaign. This is not totally unexpected
because previous experiments have demonstrated that SEE is more often
observed at higher latitude heating facilities [Thide et al, 1989].
3-20

21
Los Alamos and NRL set up bistatic BF propagation links between
Dominica and Providenciales, Caicos during the IFB release and other CRRES
rocket experiments. Propagation frequencies were chosen to reflect near
the release points for chemicals. The C?3Br release produced a large
Doppler shift in the HP vave passing through the disturbed regions. A
manuscripts describing the results of these experiments are in preparation
[P.E. Argo, private communication, 1994].
VI. Conclusions
The IFH chemical release produced a large (> 30 km diameter) hole in
the F-layer centered within 6 km of the 5.1 MHz HP beam. The reactions
between CFjBr and the ambient electrons yielded a turbulent negative-ion
plasma. The action of the high power radio vave on the negative-ions,
positive-ions, and electrons produced micro-cavities with diameters of less
than 1 meter and factors of 10 or greater reductions in the already
depressed plasma density. In the boundary layer between the negative ion
and electron dominated regions, electron density spikes were recorded with
the in situ Langmuir probes. These spikes may result from cavities in the
negative ions that are filled by electrons to maintain charge neutrality.
The negative-ion, positive-ion and electron simulation models of Scales,
Bernhardt, and Ganguli [1993, 1994] and Scales et al. [1994] are being used
to study this process.
The in situ measurements of the electron density near the HF
reflection region at the top of the ionospheric hole show electron plasma
waves trapped or guided by cavities the size of the positive ion gyro-
radius. The frequency spread of these Langmuir waves is 8 kHz or less.
The structure observed at the reflection region may be associated with
3-21

22
field aligned cavities guiding Langmuir waves generated by the parametric
decay instability (PDI) as described by Muldrew [1978, 1988]. Processes
that can generate field aligned irregularities by the thermal parametric
instability have been summarized by Mjrflhus [1993]. Horizontal structures
may be formed by the ponderomotive force in the peaks in the standing wave
of the HF pump [Leyser and Thide, 1988].
From the in situ and ground based observations, ve deduce that the
artificial ionospheric hole yielded 10 to 20 dB enhancements in the pump
wave intensity by focussing. This degree of focussing is consistent with
the predictions by Bernhardt and Duncan [1987]. The strongest focussing
lasted for 150 seconds after the ionospheric hole had evolved so that the
focal point vas located on the reflection level at the top of the hole.
The amplitudes of the ion acoustic waves and electron plasma oscillations
were increased by more than 20 dB during the period of the strongest
focussing. The weakness of the red-line airglow enhancements during this
time is difficult to explain. Airglow induced by RF heating usually comes
from surprathermal electrons colliding with ambient atomic oxygen. The
negative ions trapped on the magnetic field lines below the HF reflection
level may have scattered the suprathermal electrons before they could
excite the oxygen.
An experiment complementary to IFH used a barium release from a
sounding rocket. This experiment (CRRES AA-2) produced an electron density
enhancement in the powerful radio beam from Arecibo HF facility [Djuth et
al., 1994]. It is instructive to compare the results of the IFH and AA-2
radar measurements. Following the barium release of the AA-2 experiment,
the intensity of the upshifted plasma line increased by about 12 dB and the
downshifted plasma line vanished below the noise floor of the radar
3-22

23
receiver. The downshifted and upshifted enhanced ion lines showed
corresponding assymmetries. The measured assymmetric plasma lines may have
been the result of ion cloud expansion or steep density gradients. Because
an electron density enhancement defocuses an HF beam, focussing does not
explain the AA-2 results. The source of the assymmetric radar spectra is
not understood and should be a subject for future research [Djuth et al.,
1994].
Both the IFH and AA-2 experiments yielded large enhancements in HF
induced Langmuir turbulence. The IFH experiment produced the largest
increase in plasma line strength (20 dB) but AA-2 yielded the largest
absolute plasma line intensity. A quantitative comparison of the two
techniques is difficult because the intensity of the plasma line before the
IFH release was much less than the intensity before the AA-2 release. It
is a open question whether ionospheric holes or electron enhancements
produce the largest effect on ionospheric heating.
The IFH experiment has demonstrated that the release of an electron-
attachment chemical will form an artificial lens in the F-region that may
be used to increase the power density of any HF facility. The effective
radiated power of these facilities can be increased by about 20 dB for
periods of time longer than 2 minutes. Similar IFH experiments should be
attempted in the future to give a temporary boost in the power levels
available for ionospheric heating. This boost may yield phenomena that are
not produced with current heating facilities.
3-23

24
Acknovledgmen t s
The authors gratefully acknowledge the support of the staff of
Arecibo Observatory, and graduate students from the Department of Physics
and Astronomy, Clemson University and the Department of Electrical
Engineering, Cornell University. The Arecibo Observatory is part of the
National Astronomy and Ionosphere Center, operated by Cornell University
under contract with the National Science Foundation. The research at NRL
vas supported by the National Aeronautics and Space Administration and the
Office of Naval Research. One of the authors (F.T.D) acknowledges support
from NASA under contract NAS8-39075 and from the Phillips Laboratory,
Hanscom Air Force Base under contract F19628-92-C-0168.
3-24

25
REFERENCES
Belenov, A.f., et al., Parameters of artificial small-scale ionospheric
irregularities, Radiophys. Quantum electron. Engl. Transl., 20, 1805-
1813, 1977.
Bernhardt, P.A. and L.M. Duncan, "Ionospheric focussed heating - a hybrid
modification experiment," J. Atmos. Terr. Phys., 49, 1107, 1987.
Bernhardt, P.A., L.M. Duncan, and C.A. Tepley, "Artificial Airglov Excited
by High-Power Radio Waves," Science, Volume 242, pp 1022-1027, 18
November 1988.
Bernhardt, P. A., C. A. Tepley, and L. M. Duncan, "Airglov enhancements
associated with plasma cavities formed during ionospheric heating
experiments", J. Geophys. Res., 94, 9071-9092, 1989.
Bernhardt, P.A., P. Rodriguez, C.L. Siefring, and C.S. Lin, Field-aligned
dynamics of chemically induced perturbations to the ionosphere, J._
Geophys. Res., 96, 13887-13900, 1991a.
Bernhardt, P.A., V.A. Scales, S.M. Grach, A.N. Karashtin, D.S. Kotik, S.V.
Polyakov, Excitation of artificial airglow by high power radio waves from
the "SURA" ionospheric heating facility, Geophys. Res. Lett., 18, 1477-
1480, 1991.
Bernhardt, P.A. Field-aligned dynamics of chemically induced perturbations
to the ionosphere, J. Geophys. Res., 96, 13887-13900, 1991.
Coster, A.J., F.T. Djuth, R.J. Jost, and tf.E. Gorden, The temporal
evolution of 3-m striations in the modified ionosphere, J. Geophys.
Res., 90A, 2807-2818, 1985
3-25

26
Derblom, H., B. Thide, T.B. Leyser, J.A. Nordling, A. Hedberg, P. Stubbe,
H. Kopka, and M. Rietveld, Tromsd Heating Experiments: Stimulated
Emission at HF Pump Harmonic and Subharmonic Frequencies, J. Geophys.
Res., 94, 10111-10120, 1989.
Djuth, F.T., El Coqui Active Experiment Explore the Ionosphere, Soundings,
2, 1-3, Winter 1993.
Djuth, F.T., M.P. Sulzer, J.H. Elder, and K.M. Groves, The CRRES AA-2
release: HF vave-plasma interactions in a dense Ba+ cloud, submitted to
J. Geophys. Res., 1994.
Dubois, D.F., H.A. Rose, and D. Russell, Excitation of strong Langmuir
turbulence in plasmas near critical density: Application to HF heating of
the ionosphere, J. Geophys. Res., 94, 10111-10120, 1990.
Duncan, L.M., S.P. Sheerin, and R.A. Behnke, Observations of ionospheric
cavities generated by high-power radio waves, Phys. Rev. Lett., 61, 239-
242, 1988.
Fejer, J.A., Ionospheric modification and parametric instability, Rev.
Geophys. space Phys., 17, 135-157,1979.
Ganguli, G., P.A., Bernhardt, W.A. Scales, P. Rodriguez, C.L. Siefring,
H.A. Romero, Physics of Negative Ion Plasmas Created by Chemical Releases
in Space, SPI Conference Proceedings and Reprint Series, T. Chang Ed.,
Scientific Publishers, Cambridge, Mass., 1993.
Hansen, J.D., G.J. Morales, L.M. Duncan, J.E. Maggs, and G. Dimonte, Large-
scale ionospheric modifications produced by nonlinear refraction of an HF
wave, Phys. Rev. Lett., 65, 3285-3288, 1990.
Hansen, J.D., G.J. Morales, and J.E. Maggs, Large-scale HF-induced
ionospheric modifications: Theory and modeling, J. Geophys. Res., 97,
17019-17032, 1992.
3-26

27
Haas, D.G., C.L. Siefring, M.M. Baumback, P. Rodriguez, D.P. Mcnutt,
Rocket-borne dovnconverter for measuring space plasma turbulence,
submitted to Rev. Sci. Ins., 1993.
Kelley, M.C., T. Arce, J. Saloway, T. Armstrong, M.P. Sulzer, and L.M.
Duncan, "Density depletions at the ion gyro radius scale induced by the
Arecibo heater", submitted to J. Geophys. Res., 1994.
Leyser, T.B., and B. Thide, Effects of pump-induced density depletions on
the spectrum of stimulated electromagnetic emissions, J. Geophys. Res.,
93, 8681-8688, 1988.
Minkoff, J., P. Kugelmenn, and 1. Viessman, Radio frequency scattering from
a heated ionospheric volume, 1, VHF/UHF field-aligned and plasma-line
backseatter measurements, Radio Science, 9, 941-955, 1974.
Mjrflhus, £., On linear conversion in a magnetized plasma, Radio Science,
25, 1312-1339, 1990.
Mjrflhus, E., On the small scale striation effect in ionospheric radio
modification experiments near harmonics of the electron gyro frequency,
J. Atm. Terr. Phys., 55, 907-918, 1993.
Muldrev, D.B., The role of field-aligned ionization irregularities in the
generation of HF-induced plasma line at Arecibo, J. Geophys. Res., 83,
2552-2560, 1978.
Muldrev, D.B., Duct model explanation of the plasma line overshoot observed
at Arecibo, J. Geophys. Res., 93, 7598-7604, 1988.
Scales, V.A., P.A. Bernhardt, and G. Ganguli, Simulations of Negative Ion
Clouds and Electron Density Depletions Produced During Electron
Attachment Chemical Release Experiments, SPI Conference Proceedings and
Reprint Series, T. Chang Ed., Scientific Publishers, Cambridge, Mass.,
1993.
3-27

28
Scales, W.A., P.A. Bernhardt, G. Ganguli, C.L. Siefring, and P. Rodriguez,
Small-scale plasma irregularities produced during electron attachment
chemical releases, Geo. Res. Lett., 21, 605-608, 1994.
Scales, V.A., P.A. Bernhardt, and G. Ganguli, Early time evolution of a
chemically produced electron depletion, submitted to J. Geophys. Res.,
1994.
Shoven, R.L., and D.M. Kim, Time Variations of BF-Induced Plasma Waves, J^
Geophys. Res., 83, 623-628, 1978.
Thide, B., A. Hedberg, J. A. Fejer, and H.P. Sulzer, First Observations of
Stimulated Electromagnetic Emission At Arecibo, Geophys. Res. Le11., 16,
369-372, 1989.
3-28

29
Figures
Figure 1. Ground projection of the IFH rocket trajectory relative to the
island of Puerto Rico. The location of the 5.1 MHz HF heater and the 430
MHz UHF radar beams are also indicated. The CFgBr release occurred along
the trajectory slightly to the east of the center of the HF beam.
Figure 2. Sensors and instruments on the IFH rocket. The chemical
canister was located between the instrument section and the rocket motor.
Figure 3. Electron density measured by the IFH rocket in four ten second
periods. The values are derived assuming that electron density is
proportional to the measured current from the NHL Langmuir probe LP2.
In regions of very low density, such as phase 1 and the early part of
phase 2, the negative ions may provide a substantial portion of the
Langmuir probe current. Density fluctuations are evidence of (a) rocket
spin, (b) micro cavities, (c) spikes, and (d) heater induced cavities.
The rocket speed and altitude at the beginning and end of each period is
indicated along with the range of times after launch.
Figure 4. Electron density details along several portions of the IFH
rocket trajectory. The time, speed, and altitude for the start each
segment is given along the top of each data sample. The discrete density
steps in the data are due to the finite length for the digital word from
the logarithmic amplifiers of the Langmuir probe.
Figure 5. In situ measurements of the electric fields (V/m) near the 5.1
MHz pump wave. A large increase in wave amplitude follows the CF3Br
release.
Figure 6. Computed standing wave in a horizontally stratified ionosphere
with a localized electron depletion.
3-29

30
Figure 7. Spectrogram of the pump fields and associated Langmuir vaves.
The spectra is naturally divided into (1) a prerelease narrow line, (2)
downshifted broadening after release, (3) a burst when passing through
the HP reflection level 196 to 199 second after launch, and (4) a
disappearance of the pump thereafter.
Figure 8. Detail of the electron density, Langmuir vaves around 5.1 MHz,
and low frequency ion acoustic waves near the HF reflection level. The
Langmuir waves and ion acoustic waves seem to be trapped or guided by the
density cavities. Spectra of low frequency electric fields is measured
between sensors EF1 and EF4 of Figure 2.
Figure 9. Incoherent scatter ion line obtained by the Arecibo radar during
the IFH experiment. The radar backscatter is affected by (1) reduction
of electron density in the F-layer, (2) side-lobe scatter from the rocket
body, and (3) enhanced ion acoustic waves at the top of the F-layer hole.
The radar was operated in a spectral mode during the times of data gaps
in the figure.
Figure 10. Incoherent scatter measurement of the plasma line at 430 - 5.1
MHz. The plasma line shows (1) the HF reflection layer before the
release, (2) a brief focussing after release, (3) a new reflection height
at the top of the ionospheric hole, and (4) 20 dB increase in the plasma
line after focussing occurs.
Figure 11. Plasma line splitting during the ten seconds after the release
of CF^Br. The strongest backseatter from Langmuir waves is 10 dB
stronger than the prerelease plasma line. The downshifted Langmuir waves
illustrated by the in situ observations of Figure 6 may be the source of
the scattered radar signal.
3-30

31
Figure 12. Spectrum of the downshifted plasma line (a) and the enhanced
ion line (b) during the time of intense HF focussing.
Figure 13. Rays from the 5.1 MHz HF transmitters propagating through (a)
the unmodified F-layer, (b) the ionospheric hole 10 seconds after
release, and (c) the hole at a later time when the focal point is at the
HF reflection level. The electron density contours are derived from a
spherical release model adjusted to fit density measurements obtained
from the ISR radar.
Figure 14. Green-line (557.7 nm) and red-line (630.0 nm) enhancements
following the CF3Br release during the IFH experiment. The bulk of these
enhancements can be explained by excitation of atomic oxygen after mutual
neutralization of 0+ and Br~ in the chemically modified plasma. A small
red-line increase is observed during the "focussing" period of strong
enhanced ion and plasma lines shown in Figures 9 and 10.
3-31

32
Experiment
Table I
INSTRUMENTATION FOR THE IFH ROCKET
Group Sensor Parameter Specifications Sample Rate
Langmuir Probesj
LP1 NRL 20 cm Probe Electron 26 to 4xl06 cnT3 5.556 ksamp/s
LP2 NRL 20 cm Probe Density 3 to 4xl05 cm"3 5.556 ksamp/s
(&n/n)l NRL 20 cm Probe Relative 0 to 3
(Sn/n)2 NRL 20 cm Probe Density 0 to 3
11 ksamp/s
11 ksamp/s
DPI
DP2
PL 3.0" Disk Ion 10 to 106 cm-3
PL 1.5" Disk Density 10 to 106 cnT3
1.4 ksamp/s
11.2 ksamp/s
Electric Fields
DC,LF,AC 14 NRL
DC,LF,AC 12 NRL
DC,LF,AC 34 NRL
DC,LF,AC 56 NRL
4.3 m Dipole DC and
0.3 m Dipole Low Freq.
0.3 m Dipole E-Fields
0.3 m Dipole
0 to 5.6 kHz
0 to 5.6 kHz
0 to 5.6 kHz
0 to 5.6 kHz
11.2 ksamp/s
11.2 ksamp/s
11.2 ksamp/s
11.2 ksamp/s
Downconv 1
Downconv 2
Downconv 3
Downconv 4
NRL
NRL
NRL
NRL
1.5 m RF
1.5 m RF
5.5 cm RF
11.0 cm RF
Langmuir
and Pump
Waves
2.5 to 12 MHz One 1600 point
2.5 to 12 MHz spectrum/s
5.050 MHz±75 kHz 4 Mbit/s
5.075 MHz+75 kHz 4 Mbit/s
Energy Spectra
TECHS MSFC Cylinder Thermal .5 to 50 eV (32) 320 msec scan
Electrons 45° x 15° (8) 32x8 spectra
3-32

to
O
r
oto
CM<O
O
O
00•HPu
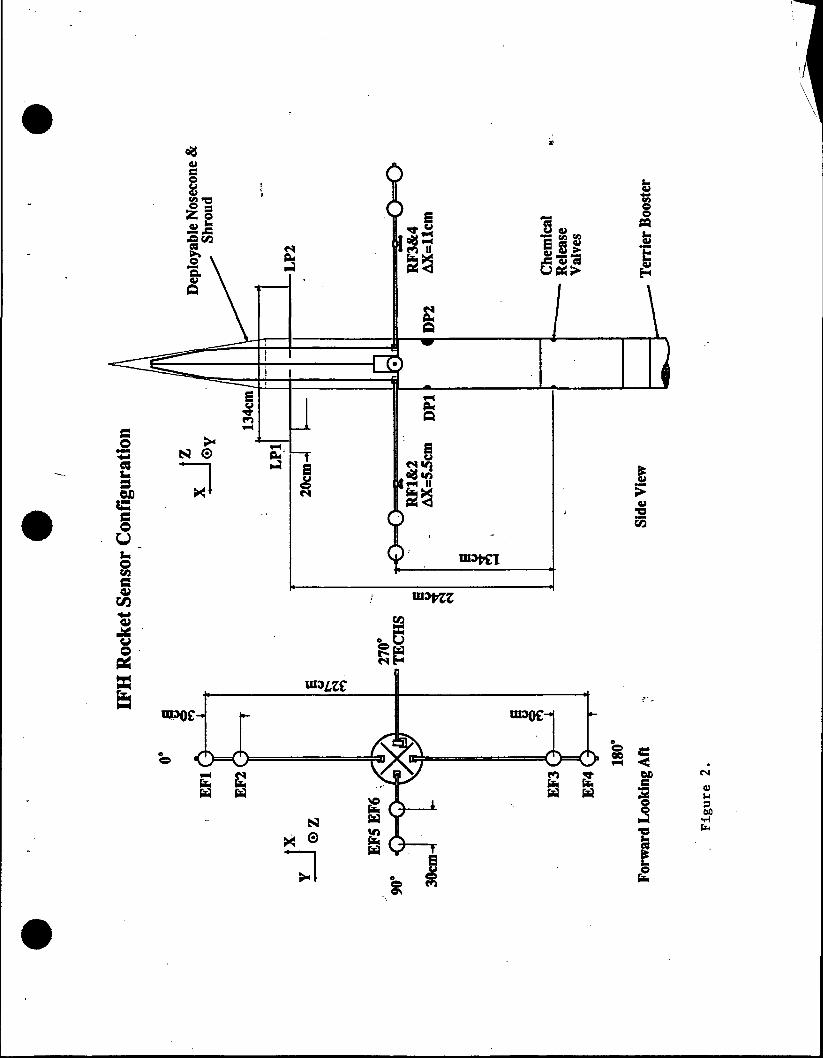
CM
0)VJ
00•H

30 MAY 1992 IFH LANGMUIR PROBE
T|200
^ 160"120>»
80
40
04.0
3-5
3.02.52.0
S 1 ' 0S .5
0160
-140J 120too
V)co>
100806040
Q 200
320IT280<240o 200
80400
160.0-170.0 s, 1486-1400 m/sf 269.37-283.23 km
PHASE 0: HEATED IONOSPHERE
wu.o
(a)
170.0-180.0 s, 1400-1315 m/s, 283.23-296.21 km
PHASE 1: MICRO CAVITIES
See D e f a i I (a)
PHASE 2SPIKES
180.0-190.0 s, 1315-1230 m/s, 296.21-308.31 km
PHASE 2
NEGATIVE-ION CLOUD
BOUNDARY LAYER
SPIKESSee D e t a i l (b)
190.0-200.0 s, 1230-1147 m/s, 308.31-319.53II
PHASE 3 5.1 MHz REFLECTION
See D e t o i I (c)
to•<a:
(d)
0 1 2 3 4 5 6 7 8 9™ - Time (s)Figures. v '

30 MAY 1992 IFH LANGMUIR PROBE1.0 170.2 s 1398 m/s 283.50 km
•o
o
32 ELECTRON MICRO CAVITIES
(a)
.02 ,04 .06 .08Distance (km)
.10 .12
35 182.0 s 1289 m/s 298.70 kmELECTRON MICRO SPIKES
0 .1 .2 .3 .4 .5 .6 .7 .8 .9 1.0 1.1 1.2Distance (km)
320
;r280"l 240
^ 200— 160-^120
c 80a>
40
197.0 s 1164 m/s 316.26 km
HF REFLECTION REGION CAVITIES
(c)
0 .1 .2 .3 .4 .5 .6 .7 .8 .9 1 . 0 1 . 1Distance (km)
Figure A.

WAVE MEASURMENTS NEAR 5.1 MHz
-2169.ei 169.02 169.03 169.04 169.09 169.06 169.07 169.08 169.09 169.10
O 2.5169.11 169.12 169.13 169.14 169.15 169.16 169.17 169.16 169.19 169.20
2.0
1 .5
1 .0
.5
0
>- --
'1
I . I-2.S169.21 169.22 169.23 169.24 169.23 169.26 169.27 169.28 169.29 169.30
-2.5 169.31 169.32 169.33 169.34 169.35 169.36 169.37 169.38 169.39 16<9.40
169.41 169.42 169.43 169.44 169.45 169.46 169.47 169.48 169.49 16<J . SB
T I M E A F T E R LAUNCH (SECONDS)Figure 5.

into
oro
10
oQ_
O
OOSO
O
_L _L
(OO
CM
Oaz.»—o
SO
<0
00
m
t I I
CDCN4
CNCDCVJ
OCD
COCOCM
(OCOCS|
ooCNI
CO
3aniiiiv

0)
CD
cooc
oQN
in
35
sP
QO 00
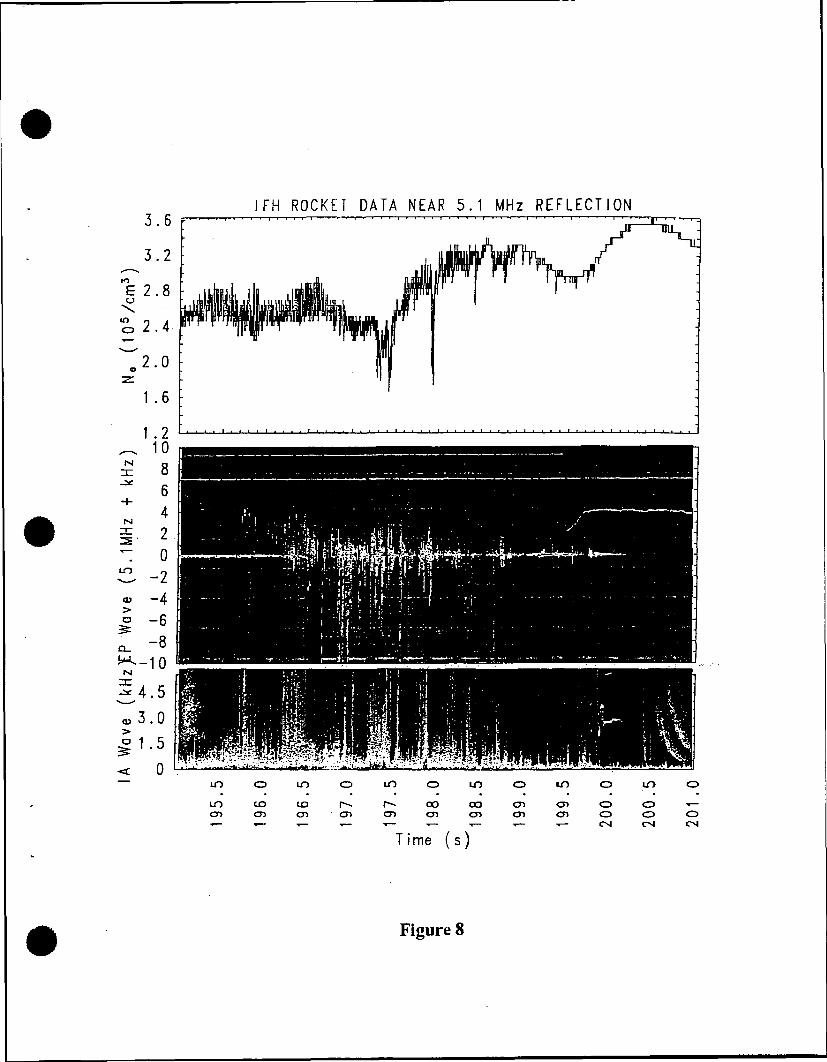
IFH ROCKET DATA NEAR 5.1 MHz REFLECTION
T ime (s)
Figure 8

Plasma L i n e , 30 May 1992, 04:11:00
Z e n i t h A n g l e 15 .9 D e g r e e s
Time (s)
Figure 9.
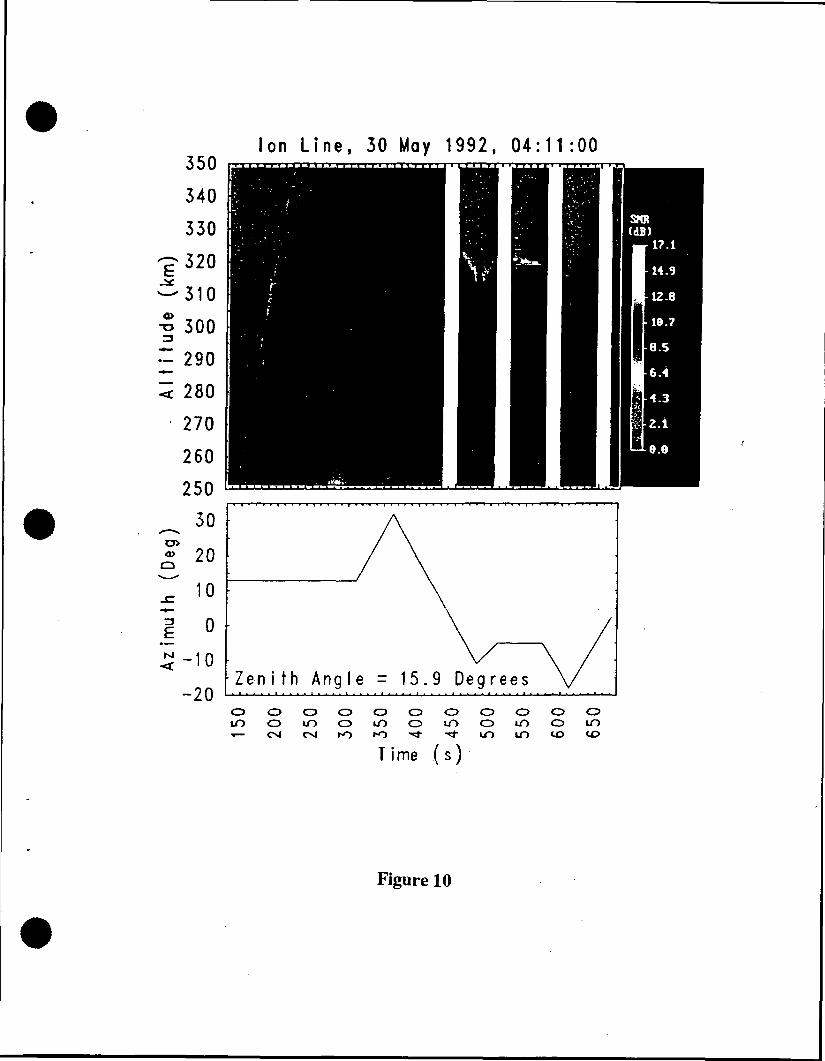
Ion Line, 30 May 1992, 04:11:00
Z e n i t h A n g l e = 15.9 Degrees
o o o o o o o o o o oi n o i n o i n o i n o i o o i n•»— C l̂ Csl t-O *O "^ " t̂" IO lO tO CO
T i me (s)
Figure 10

oo
-3-o
01<r><r>
oN->
O){=
o
CO
O
l O C D l O C D i O O l O O L Oi — . — o c 3 c r > c n o o o o r ^M O r O t O i ^ O C N I C N I C v l C N C v l
e p n j i | \ y
iCO

16
14
12oo
GO
a0
c
delLiJ
O00
a:
£ 2
-20
30 MAY 1 9 9 2 , 0 8 : 1 9 : 2 4 UT
(a)
DOWNSHIFTED PLASMA L I N E
ENHANCED ION L I N E
-15 -10 - 5 0 5
FREQUENCY (kHZ)
10
-10 -5 0 5 10 15 20 25 30
f(kHz.) - (430.0 - 5.1 MHz) l0 3
( b )
THERMAL ION L I N E
15 20
Figure 12.

<u
fc
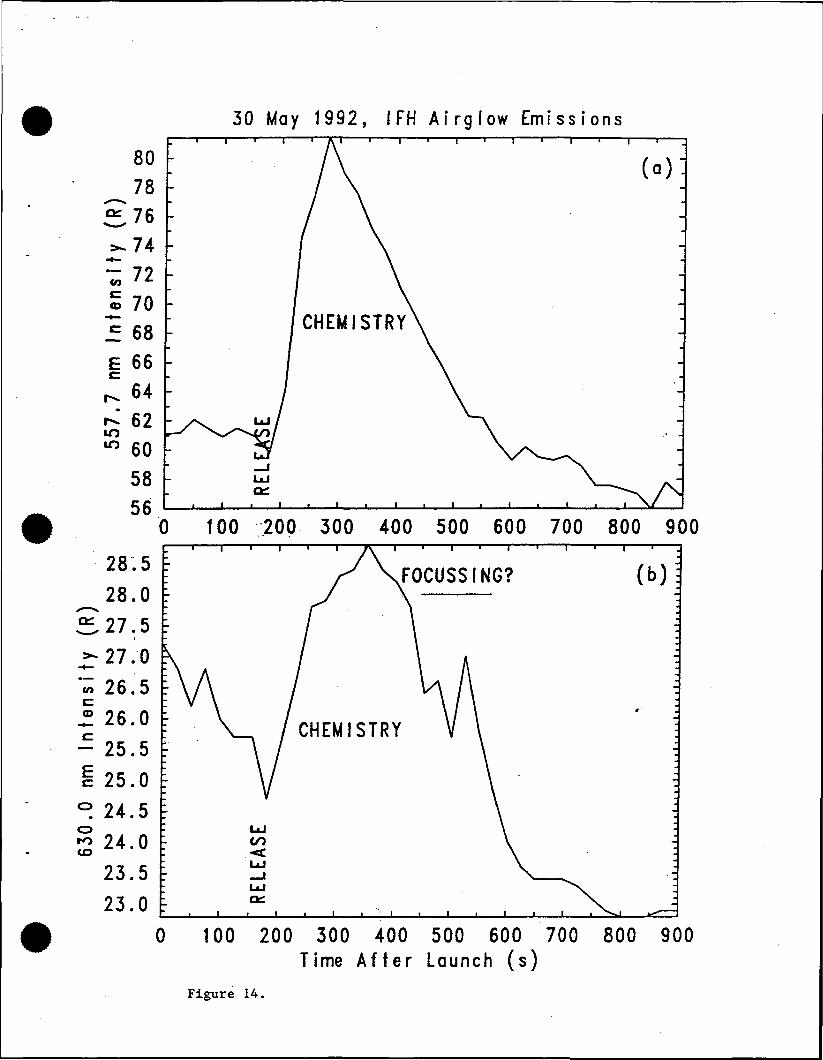
30 May 1992, IFH A i r g l o w Emissions
tnc.<D
|
OroIO
100 200 300 400 500 600 700 800 900
100 200 300 400 500 600 700Time A f t e r Launch (s)
800 900
Figure 14.

4. Incoherent Scatter Observations during Releases AA-l/AA-7 and AA-3b
In this section, the primary results of Arecibo 430 MHz observations are
presented for the AA-l/AA-7 releases and the AA-3b release. During the AA-1 and
AA-7 releases, a 49.92 MHz radar interferometer was also deployed by Geospace
Research, Inc. on the island of Antigua . This radar served as a sensitive diagnostic of
geomagnetic field-aligned irregularities in the Ba+ cloud. Indeed, during the AA-2
release (which entailed use of the Arecibo high-power HF facility) this radar system
played a key role in establishing the linkage between field-aligned irregularity formation
and the nature of Langmuir turbulence excited by the HF beam in the Ba+ cloud (Section
2). AA-1 and AA-7 involved the release of Ba in the ionosphere near 250 km altitude in
the absence of any HF modifications. No echoes from geomagnetic field-aligned
irregularities were detected with the VHP radar during either of these releases. This is
presumably the result of the high release altitudes employed for the two experiments.
However, the explosive Ba release events of AA-1 and AA-7 were detected with the
VHP radar system. The echoes observed at the moment of release have relatively large
amplitudes; they are caused by specular reflections from the Ba+ cloud. Initially, plasma
frequencies within the cloud exceed the operating frequency of the radar (49.92 MHz).
These echoes are transient in nature, lasting only ~2 s, and provide no known data of
scientific interest. As a result, they are not discussed in the work presented below.
4.1 Arecibo Radar Measurements in Support of AA-1 and AA-7
The AA-1 and AA-7 releases occurred at altitudes too high to satisfy their
original program objectives (which relied on the formation of plasma striations).
However, they did produce important data concerning the manner in which the Ba+
clouds develop in the natural ionosphere. The two most interesting effects involve (1)
large increases in electron temperature measured in advance of the expanding Ba+ cloud,
and (2) the generation of a hot plasma column behind the Ba+ cloud at late times (>30 s)
after the release. The hot column is most likely aligned with the geomagnetic field and is
depleted in electron density relative to the background plasma.
4.1.1 Description of the AA-l/AA-7 Releases
The AA-1 release took place at 05:03:33 AST on July 2, 1992, approximately
141 s after the launch at 05:01:12 AST. At the time of release the solar depression angle
was 12.3°. The rocket pay load consisted of 22 kg of Ba and 276 gm of Sr, which was
4-1

used as a dopant These chemicals were carried in six canisters that were simultaneously
discharged at 255 km altitude. The thermite consisted of a Ti/B mixture successfully
used in other CRRES releases. At the time of release the rocket speed was 1.795 km/s.
The westward, northward and vertical components of the rocket velocity were
0.271 km/s, 0.341 km/s, and 1.741 km/s, respectively. A thermite release of this type
produces shells of neutral gas that expand radially relative to the rocket velocity. During
prior CRRES releases involving the Ba/Ti/B mixture [e.g., Berahardt et aL, 1993], the
mean radial expansion speed was found to be -1.4 km/s with a thermal spread of roughly
± 0.3 km/s relative to the mean. An overview of the release geometry and the locations
of several essential ground sites is provided in Figure 1. The AA-1 release point, like
many of the El Coqui campaign chemical releases, was positioned well inside the
viewing limits of the Arecibo 430 MHz radar beam (i.e. within 20° of the zenith). At
time of the release the radar beam was stationary and pointed 15° from the zenith. The
viewing direction was slightly east (1.8° azimuth) of geographic north. The horizontal
separation between the release point and radar beam location at the release height was
-16.4 km.
The AA-7 release took place two days after AA-1 on July 4, 1992. Launch
occurred at 04:58:00 AST, and the chemicals were discharged 141 s after launch at
05:00:21 AST. At the moment of release, the solar depression angle was 12.2°. The
release pay load was identical to that of AA-1. At the time of release the rocket was at
254 km altitude, and its speed was 1.803 km/s. The westward, northward and vertical
components of the rocket velocity were 0.351 km/s, 0.432 km/s, and 1.715 km/s,
respectively. As in the case of AA-1, the Arecibo radar beam was stationary at the time
of release. It was pointed slightly east of geographic north (3.9° azimuth) at a zenith
angle of 15°. The horizontal distance between radar beam location at the release altitude
and the release point was -4.7 km, considerably less than in AA-1 (see Figure 1).
The vaporization efficiency is estimated to be -40%, based on test measurements
from rocket-borne Ba/Ti/B releases at Wallops Island, VA. For the AA-1 and AA-7
experiments, the predicted yield is -4 x 1025 atoms of Ba vapor. Under full solar
illumination of the cloud at UV wavelengths between 310 and 200 nm, the Ba ionization
time constant is 28 s [e.g., Carlsten, 1975]. Because the neutral Ba cloud becomes
optically thin within a few seconds of the release, one expects the cloud as a whole to
ionize with an e-fold time of about 30 s.
4-2

Arecibo Radar Operations
In support of AA-1 and AA-7, special efforts were made to fully exploit the
information available with the Arecibo incoherent scatter radar. This involved the
deployment of a high-speed radar processor system at Arecibo by Geospace Research,
Inc. (GRI). The observing program was designed to provide wideband spectral
information without compromising altitude resolution or system sensitivity. Three types
of phase-coded radar pulses were employed. These included a 13-baud Barker-coded
pulse (BKR) having a baud length of 4 (is; a seven frequency 308-fis long pulse [Sulzer
1986], referred to as a multi-radar autocorrelation function pulse (MRACF); and a 512-
baud, pseudo-random phase-coded pulse (1-us bauds), genetically termed a coded long-
pulse (CLP). The three pulses were cyclically transmitted within a "frame time" of 30
ms. A frame consisted of three 10 ms interpulse periods (IPPs), one for each type of
pulse. Throughout the experiment period, ionospheric backscatter from each radar pulse
was simultaneously sampled at the radar center frequency (430 MHz) and across both
"plasma line" sidebands (430 MHz ± fr), where fr is the plasma line offset frequency.
The plasma line bandpasses were centered near 430 MHz ± 5.0 MHz. Appropriate filters
were selected to optimize measurements made with a particular type of pulse. The
spectral bandwidths of the data channels ranged from 250 kHz on the BKR ion line to
5 MHz at the upshifted and downshifted CLP plasma lines. The three pulse types were
used to extract different kinds of information about the processes occurring in the Ba+
plasma. Power profile (i.e. power versus range) measurements made with the BKR pulse
had the best detection sensitivity with moderately good altitude resolution (600 m).
Better altitude resolution (150 m) and wideband spectral information were obtained with
the CLP with some loss of sensitivity when signals were strong. The MRACF yielded
ion-line spectral information with poor (38 km) altitude resolution but with extremely
good temporal resolution (6 s). A concise description of the above radar techniques is
furnished by Sulzer [1989].
An important feature of the GRI data-acquisition program was that raw,
unintegrated voltage samples were preserved on all data channels throughout the
experiment period (~ 45 min). This made it possible to optimize temporal integration
periods after the fact, change digital processing techniques as desired, and examine radar
returns on a pulse-by-pulse basis to explore interesting events.
4-3

4.13 Radar Results
As noted above, the AA-1 and AA-7 releases occurred at altitudes too high to
readily generate plasma striations. This was confirmed with in 2-D simulation of the
CRRES release conducted by J. D. Huba of the Naval Research Laboratory.
Nevertheless, extremely interesting plasma heating phenomena were observed with the
Arecibo radar. The absence of plasma striations will simplify the interpretations of these
results.
Figure 2 shows backscatter power measured with the 430 MHz radar during the
AA-1 experiment These data were acquired with BKR pulses. Figure 2 is a temporal
expansion of the AA-1 data presented in Section 1 (Figure 2, Section 1). The
ionospheric backscatter power is directly proportional to electron density and inversely
proportional to the quantity [1 + Te/Tj], where Te and Tj are the electron and ion
temperatures, respectively. During the observations of Figure 2, the radar beam was
initially positioned at a zenith angle of 15° and at the azimuth of the nominal release
location (1.8° azimuth). Azimuth scans were initiated at 212 s relative time in Figure 2.
The release event occurred at 138 s. The faint, vertical streak seen near 138 s at
~250 km altitude is the rocket and/or release event as seen through a high order sidelobe
of the radar beam. This echo lasts for about 1 s (141.3 s after launch until 142.2 s after
launch). It is currently not known whether this echo is caused by the rocket body itself
or by a strong specular return off the early time Ba+ cloud. It appears that the echo is
closely tied to the release event itself. Within -2 s of the release, a decrease is
backscatter cross section is evident over roughly a 10 km altitude band centered on 250
km altitude. This depletion persists for approximately 10s; thereafter an enhancement in
backscatter cross section is evident. A series of electron density profiles obtained near
the time of release is displayed in Figure 3. Times are referenced to the release event,
and the electron density scale applies to all of the data shown except for the enhancement
at the rocket/release event and the depletions evident at this altitude immediately
thereafter.
The increase in backscatter cross section signals the arrival of Ba+ ions in the
radar field-of-view. As noted above, the horizontal separation between the release point
and radar beam location at the release height was -16.4 km. The Ba+ ions required -12 s
to reach the radar beam after the release. This implies a travel speed of 1.4 km/s. Notice
that the depletion in cross section persists at altitudes immediately below the Ba+ cloud.
An essential question to be addressed is whether the depletion in cross section
during AA-1 is caused by a reduction in electron density, an increase in the Te/Tj ratio,
or a combination of the two effects. To resolve this issue, spectral information at the
4-4
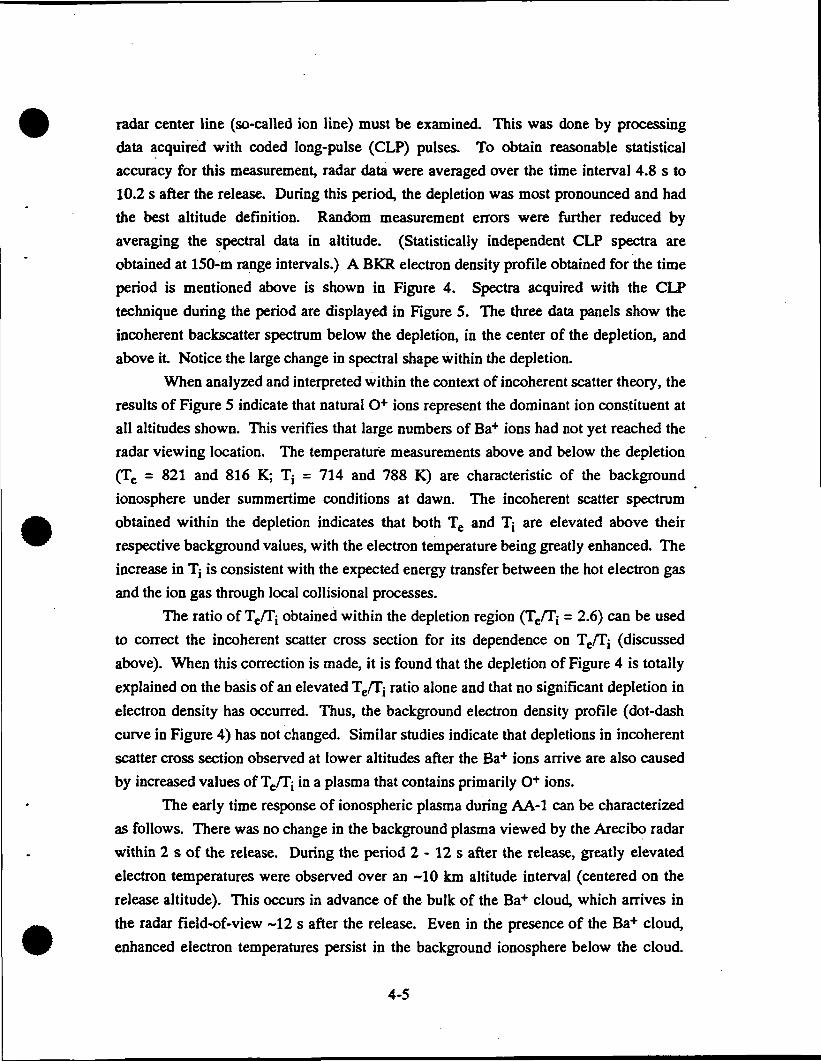
radar center line (so-called ion line) must be examined. This was done by processing
data acquired with coded long-pulse (CLP) pulses. To obtain reasonable statistical
accuracy for this measurement, radar data were averaged over the time interval 4.8 s to
10.2 s after the release. During this period, the depletion was most pronounced and had
the best altitude definition. Random measurement errors were further reduced by
averaging the spectral data in altitude. (Statistically independent CLP spectra are
obtained at 150-m range intervals.) A BKR electron density profile obtained for the time
period is mentioned above is shown in Figure 4. Spectra acquired with the CLP
technique during the period are displayed in Figure 5. The three data panels show the
incoherent backscatter spectrum below the depletion, in the center of the depletion, and
above it. Notice the large change in spectral shape within the depletion.
When analyzed and interpreted within the context of incoherent scatter theory, the
results of Figure 5 indicate that natural O+ ions represent the dominant ion constituent at
all altitudes shown. This verifies that large numbers of Ba+ ions had not yet reached the
radar viewing location. The temperature measurements above and below the depletion
(Te = 821 and 816 K; Tj = 714 and 788 K) are characteristic of the background
ionosphere under summertime conditions at dawn. The incoherent scatter spectrum
obtained within the depletion indicates that both Te and Tj are elevated above their
respective background values, with the electron temperature being greatly enhanced. The
increase in Tj is consistent with the expected energy transfer between the hot electron gas
and the ion gas through local collisional processes.
The ratio of Te/Tj obtained within the depletion region (Te/Tj = 2.6) can be used
to correct the incoherent scatter cross section for its dependence on Te/Tj (discussed
above). When this correction is made, it is found that the depletion of Figure 4 is totally
explained on the basis of an elevated Te/Tj ratio alone and that no significant depletion in
electron density has occurred. Thus, the background electron density profile (dot-dash
curve in Figure 4) has not changed. Similar studies indicate that depletions in incoherent
scatter cross section observed at lower altitudes after the Ba+ ions arrive are also caused
by increased values of Te/Tj in a plasma that contains primarily O+ ions.
The early time response of ionospheric plasma during AA-1 can be characterized
as follows. There was no change in the background plasma viewed by the Arecibo radar
within 2 s of the release. During the period 2 - 12 s after the release, greatly elevated
electron temperatures were observed over an -10 km altitude interval (centered on the
release altitude). This occurs in advance of the bulk of the Ba+ cloud, which arrives in
the radar field-of-view ~12 s after the release. Even in the presence of the Ba+ cloud,
enhanced electron temperatures persist in the background ionosphere below the cloud.
4-5

This temperature enhancement disappears approximately 20 s after the arrival of the Ba+
ions.
Electron heating prior to the arrival of Ba+ ions in the radar field-of-view was
also observed during the AA-2 experiment (Section 2). However, the AA-2 release
occurred in a background ionospheric plasma having significantly less electron density
than with AA-1. As a result, the statistical measurement errors were somewhat greater.
In the case of AA-7, no such measurements were possible because the flight path of the
rocket came much closer to the Arecibo radar beam at the release altitude. This is
illustrated in Figure 6, which offers expanded altitude coverage of the AA-7 data shown
in Section 1 (Figure 3, Section 1). The large echo from the rocket body saturates the
radar receiver at the release altitude for ~8 s following the release. Initially, the radar
beam was pointed at a fixed location (zenith angle = 15°, azimuth = 3.9°), but at 241 s
relative time azimuth scans across the Ba+ cloud were initiated. During the first return
scan across the cloud, a large depletion in backscatter return is evident above the cloud.
The corresponding magnetic flux tube maps to lower altitudes behind the cloud. The
development of a large depletion above the Ba+ cloud appears to be primarily a late time
phenomenon. In Figure 6, a mild depletion forms above the cloud within a minute of the
release, but large depletions are only observed in the late time environment (> 5 min after
release). This type of effect was observed both during AA-7 and AA-1.
An example of an electron density profile illustrating the depletion in backscatter
cross section is provided in Figure 7. The large peak near 240 km is the Ba+ cloud; the
cloud has sunk in altitude relative the release height because of gravity. In Figure 7, the
measured backscatter is correctly represented as electron density at all altitudes except
between 255 and 300 km, where a depletion is evident relative to the background profile
(dashed curve in Figure 7 measured ~2 min earlier ). As noted above, a depletion in
incoherent backscatter may arise because of elevated Te/Tj and/or a reduction in electron
density. Spectral analyses of the incoherent scatter "ion line" are required to make this
determination.
In Figure 8, CLP spectral measurements simultaneously made during the
observing period of Figure 7 are presented. Analyses of these spectra within the context
of incoherent scatter theory yield the physical parameters of interest to this study [e.g.,
Sultan et ai, 1992]. The spectrum in the bottom panel was obtained in the topside of the
Ba+ cloud; it shows that the Ba+ is the dominate ion in the plasma and that the electron
temperature is elevated relative to the ion temperature (Te/Tj = 1.8). The elevated
electron temperature is believed to be caused by the continuous "pumping" of the Ba
cloud by solar UV radiation. A plasma cloud consisting mostly of Ba+ (i.e. 94% Ba+,
4-6

6% O+) is expected because of an "electrostatic snowplow" process that excludes
background O+ ions during cloud formation (e.g., Berahardt et al, 1991; Schunk and
Szuszczewicz, 1991; and references therein). The incoherent scatter spectrum obtained
in the middle of the depletion (center panel in Figure 8) indicates that the ion mixture is
roughly 50% Ba+ and 50% O+ with Te/Tj near 2.5. These results indicate that most, but
probably not all, of the cross section reduction is caused by elevated Te/Tj. Electron
density depletions that are 5 - 20% below background values are consistent random
measurement errors and systematic uncertainties in the least-squares fitting of the
incoherent scatter spectrum. Finally, the spectral measurements made above the
depletion (upper panel, Figure 8) are similar to measurements made in the background
plasma (i.e., a plasma containing dominant O+ ions with Te/Tj ~ 1.1).
4.1.4 Discussion and Conclusions
The principal observational results presented above consist of an early-time
electron heating phenomenon and the development of a hot magnetic flux tube behind
(i.e. to the north of) the Ba+ cloud at late times. The hot flux tube probably has reduced
electron density relative to the background ionosphere. This notion is supported by data
acquired with the Digital Ionospheric Sounding System (DISS) at Ramey, Puerto Rico,
which indicates the presence of an ionospheric duct behind the Ba+ cloud (T. W. Bullett,
private communication, 1993).
The causes of the two phenomena are currently not well-understood. The
electron heating observed at early times during AA-1 is quite remarkable. Within -2 s of
the Ba release, significant elevations in electron temperature are observed at a point
roughly 16 km away from the release point! The temperature increase is confined to a
-10 km altitude interval centered on the release altitude. The direct horizontal path
between the release location and observation point crosses geomagnetic field lines at
nearly a right angle.
Initially, the neutral Ba cloud undergoes photoionization because of the presence
of solar UV radiation at wavelengths between 310 and 200 nm. However, the motion of
the photoelectrons are restricted by the geomagnetic field (e.g., the electron gyroradius of
a 10 eV electron traveling perpendicular to the geomagnetic field is -2 cm). Neutral
waves (e.g., shock waves) initiated by the release could readily move across field lines,
but this does not provide a reasonable explanation for the radar observations. The
associated waves would have to propagate at a very large velocity (~8 km/s). Moreover,
significant ion heating that would be expected to accompany a large shock wave is not
observed. In addition, the observed electron temperature enhancement occurs over a
4-7

relatively-narrow, sharply-defined altitude interval rather than a broad, extended height
range anticipated for a spherically expanding wavefront.
Impulsive electric/electromagnetic fields generated by the release event might
serve as a source for the observed electron heating. In this case, wave propagation
speeds and the rate of collisional dissipation of the wave(s) would determine the onset
time of the electron heating measured with the radar. Because the electron temperature
enhancement is narrowly confined to altitudes surrounding the release height,
propagational geometries perpendicular, or nearly perpendicular, to the geomagnetic
field are needed. For example, the impulsive emission of large amplitude upper hybrid
waves/electron Bernstein modes could provide the source for the electron temperature
enhancement. The source mechanism is currently the subject of a highly focused study.
The late-time formation of a hot flux tube adjacent to the Ba+ cloud is also an
unanticipated result with no readily available interpretation. Presumably, this situation
arises, at least in part, because of electrodynamical and chemical processes that take place
in the ionosphere. It is possible that the radar consistently viewed the southward portion
of the Ba+ cloud, and that the northward extension of the cloud crosses the observed hot
flux tube. This could provide the source of electron heating. Analyses of optical
observations made during AA-l/AA-7 are needed to establish the location of the radar
beam within the Ba+ cloud. At the time of this writing, a detailed explanation of the late-
time radar observations does not exist.
4.2 Arecibo Radar Measurements in Support of AA-3b
Geospace Research, Inc. supported the AA-3b release with observations made
with the 430 MHz incoherent scatter radar at Arecibo Observatory. This included the
development of a measurement strategy, the acquisition of the radar data, and analysis of
selected results. To date, these analyses have been limited to key features in data
acquired during release A. This release occurred on the upleg of the AA-3b rocket and
could be directly viewed with the Arecibo radar.
4.2.1 Description of the AA-3b Releases
Three release events took places as part of the AA-3b experiment. The payload
for release A consisted of 712 g of Ba and 38 g of Li. This release was performed on the
upleg of the flight near 290 km altitude. Rocket-borne diagnostics were positioned to
view this release parallel to geomagnetic field lines. The chemical payload for release B
was identical to that of A. Release B occurred at an altitude near 359 km shortly after the
4-8

rocket passed through apogee. The in situ diagnostic package also viewed this release
along geomagnetic Held lines. Finally, the contents of canisters C and D were
simultaneously discharged on the downleg near 243 km altitude. Each canister contained
1,471 g of Ba and 19 g of Sr. The canisters were both ejected in the same direction
across geomagnetic field lines; the diagnostic payload viewed this release perpendicular
to the geomagnetic field. Release A could be observed directly with the Arecibo
430 MHz radar. However, the pointing limitations of the Arecibo antenna allowed only
the magnetic flux tubes on which releases B and C+D took place to be viewed by the
radar.
The focus of Arecibo radar operations was on release A. The launch of AA-3b
occurred at 04:37:30 AST on June 6, 1992. Release A took place 180 s into the flight
(04:40:30 AST) near the projected release altitude of 290 km. At the time of release, the
solar depression angle was -15.4°.
4.2.2 Arecibo Radar Operations
The radar observing program for AA-3b was designed to provide high temporal
and spatial resolution data important for studies of the early-time release physics. This
was accomplished with two types of radar pulses: a 13-baud Barker-coded pulse (BKR)
having a baud length of 4 us; and a 512-baud, pseudo-random phase-coded pulse (l-|xs
bauds), generically termed a coded long-pulse (CLP) [e.g., Sulzer, 1986, 1989]. Two
BKR pulses and one CLP pulse were cyclically transmitted within a "frame time" of
30 ms. A frame consisted of three 10 ms interpulse periods (IPPs). During the AA-3b
experiment, the ionospheric return from the BKR pulses were sampled at the radar center
frequency (so-called ion line). Backscatter from CLP pulses was monitored across a
1-MHz bandpass at the ion line and across a 5 MHz-bandpass at the downshifted plasma
line (centered at 430 MHz - 5 MHz). The CLP center line measurements yielded
standard incoherent scatter ion-line spectra with 150-m range resolution, whereas the
plasma line channel was used to monitor echoes generated by suprathermal electrons.
4.2.3 Radar Results
During the AA-3b experiment, the Arecibo radar beam was initially directed
toward the exact location of release A (zenith angle = 14.6°, azimuth = 28.2°). This was
accomplished with an updated estimate of the rocket trajectory 60 s into the flight. The
radar pointing remained fixed until 307 s after launch (04:42:37 AST). Thereafter, the
beam was steered toward the geomagnetic flux tube of release B (zenith angle = 14.6°,
azimuth 9.1°) and subsequently scanned in azimuth.
4-9

Backscatter power measured with the Arecibo incoherent scatter radar during the
Ba/Li releases is displayed in Figure 9. These data were acquired with BKR pulses.
Releases A and B take place at 180 s and 365 s, respectively, in this display. The figure
shows radar backscatter power (color scale) versus altitude and time relative to the
launch at 04:37:30 AST. After launch, the radar beam was steered to the projected point
of the first release. In so doing, the radar was aimed directly at the rocket. At the
earliest times in the figure, only noise is evident because the radar receiver was taken off
line during the period of re-pointing. The large echo with the curved trajectory is caused
by the rocket passing through the main lobe of the radar beam. The rocket echo saturated
the sensitive radar receiver, and in this case the color scale at right is wrapped many
times. The weaker streaks seen below the rocket are believed to be echoes from payload
doors ejected earlier in the flight.
During release A, approximately 712 gm of Ba and 38 gm of Li were explosively
released in the middle of the radar beam at 290 km altitude. Surprisingly, this release
produced a decrease in radar backscatter rather than an increase expected because of the
rapid ionization of neutral Ba. As noted above, the radar beam remained pointed at the
release location until 307 s after launch; subsequently the beam was repositioned in
azimuth to intersect the geomagnetic flux tube of the second release point (which could
not be viewed directly by the radar). As the radar beam was moved, backscatter from the
rocket was once again detected near 368 km altitude.
Figure 10 shows a sequence of electron density profiles beginning at the time of
release A (0 s relative time in the figure). Each profile is the result of integrating 1000
BKR pulses over a 15-s interval. The saturated echo from the rocket is intentionally
clipped for display purposes. In Figure 10, a depletion in backscatter is clearly evident
over -15 km altitude interval centered on the release height. As noted in the earlier
discussions of AA-l/AA-7, a reduction in backscatter power may be the result of either a
decrease in electron density or an elevation in Te/Tj. Notice that the expected
enhancement in electron density from the Ba+ cloud never develops, even at late times
after the release. This is somewhat surprising in light of the results of AA-2, AA-1, and
AA-7.
To determine the cause of the reduction in backscatter cross section, one must
perform an incoherent spectral analysis similar to that employed for AA-1. Figure 11
shows the electron density profile recorded during a time interval selected for spectral
analysis. This period was chosen to be as close as possible to the release event, while
avoiding unwanted saturation effects from the rocket echo (a problem for CLP analyses).
The spectral results for this time period are shown in Figure 12. At the time of this
4-10

writing, no incoherent scatter analyses of these spectra have been performed. However,
based on the shapes of the spectra a qualitative analysis can be performed. The spectrum
in the bottom panel of Figure 12 is a background spectrum obtained below the depletion.
Its shape indicates that Te - Tj < 1000 K, under the usual assumption that O+ is the
dominant ion in the ambient ionosphere. The middle and upper panels of Figure 12 show
spectral measurements obtained at the center of the depletion and the upper edge of the
depletion (see Figure 11). A background measurement immediately above the depletion
was not possible because of the presence of the rocket. The spectra obtained in the
depletion do not exhibit features associated with a greatly elevated Te/Tj ratio. In
particular, enhanced acoustic sidebands similar to those found in the center panel of
Figure 5 are absent. The spectrum in the middle panel resembles the background
spectrum with the top sawed off. This spectrum is not amenable to a qualitative
description within the context of incoherent scatter theory. The upper spectrum is not
unlike the result expected for an O+ plasma with Te/Tj ~ 1.1. Thus, the qualitative
analysis seems to imply that the depleted backscatter is largely due to a reduction in
electron density. However, more detailed studies involving incoherent scatter analyses
are required before this conclusion can be firmly established.
For completion, we include the results of a spectral analysis of an unsaturated
echo from the "rocket." Results obtained 25 s after release A are displayed in Figure 13.
This figure clearly shows that three objects constitute the "rocket" echo, each at different
ranges with slightly varying Doppler shifts. One might speculate that this is the rocket
payload (largest echo), canister B, and a remnant of canister A.
42.4 Discussion and Conclusions
Preliminary results from the AA-3b experiment indicate that release A created an
ionospheric depletion rather than the expected enhancement from an ionized Ba cloud.
The reason for this is currently not well-understood. At the time of the release, the
height of the UV terminator is calculated to be -258 km. Thus, the neutral Ba cloud at
290 km altitude was adequately illuminated by ionizing solar radiation.
The total amount of Ba in the release canister (712 gm) was much less than that
of AA-l/AA-7 (22 kg) or AA-2 (35.3 kg). During AA-3b, a significant amount of Li
(38 g) was released with the Ba. On the basis of test releases performed at
NASA/Wallops Island Flight Facility on November 20, 1985, we assume that the
vaporization efficiency of Ba is 40%. For Li, the corresponding value is -100%.
Consequently, -1.2 x 1024 atoms of Ba and ~3.3 x 1024 atoms of Li were vaporized
during release A. The mean velocity of the Li atoms is roughly four times greater than
4-11

that of the Ba atoms, which is assumed to be of the order of 1-2 km/s. This type of
mixture may have pushed background O+ outside of the region of release, while
depositing only a small amount of Ba+ in return. Once the observed large-scale (15-km)
depletion develops, its lifetime (determined by cross-field plasma diffusion) is expected
to be very long (> 1 hr). This assumes that no new ionization source is present The
degeneration of the depletion evident in Figure 10 is probably not related to the lifetime
of the depletion. This effect is caused by the E x B drift of the depletion outside the
volume viewed by the radar.
Optical and in situ data obtained in support of release A may provide important
clues for understanding the development of a electron density depletion. In the near
future, it is anticipated that the complete data set will be assembled. Our overall
objective is to use theoretical models developed as part of the NASA/CRRES program to
interpret the AA-3b radar results.
REFERENCES
Bernhardt, P. A., P. Rodriguez, C. L. Siefring, and C. S. Lin, Field-aligned dynamics of
chemically induced perturbations to the ionosphere, J. Geophys. Res., 96, 13887,
1991.
Schunk, R. W., and E. P. Szuszczewicz, Plasma expansion characteristics of ionized
clouds in the ionosphere: Macroscopic formulation, J. Geophys. Res., 96, 1337,
1991.
Sultan, P. J., M. Mendillo, W. L. Oliver, and J. M. Holt, Detection of artificially creatednegative ion clouds with incoherent scatter radar, J. Geophys. Res., 97, 4085-4097,1992.
Sulzer, M. P., A phase modulation technique for a sevenfold statistical improvement inincoherent scatter data-taking, Radio Sci., 21,737-744,1986.
Sulzer, M. P., Recent incoherent scatter techniques, Adv. Space Res., 9, (5)153-(5)162,1989.
4-12

FIGURE CAPTIONS
Figure 1. Overview of the AA-1 and AA-7 release geometries. The locations of
Arecibo Observatory (AO), the Arecibo HF facility (HF), a
digisonde/optical observing site at Ramey (RA), and the launch site at
Tortuguero, Puerto Rico (TO) are displayed in the figure. A distance
scale along the geomagnetic meridian crossing Arecibo Observatory is
included for reference. .The locations of the two Ba releases are shown
(AAlrel and AATrel) along with the observing points of the Arecibo
diagnostic radar at the release altitudes (AAldia and AA7dia).
Figure 2. Backscatter power measured with the Arecibo incoherent scatter radar
during the AA-1 Ba release. BKR pulses were used for this display. The
figure shows radar backscatter power (color scale) versus altitude and time
relative to 05:01:15 AST. The actual launch time was 3 s earlier. Radar
power is expressed as a signal-to-noise ratio and plotted in dB.
Figure 3. Consecutive series of electron density profiles (linear scale) measured
during the AA-1 release. Individual profiles are offset by two tick marks
(8 x 10⁵ cnr3). Each profile represents the average of 100 radar pulses
recorded over a 3-s period. Times shown inside the plot frame are
referenced to the release time; they represent the beginning times of
integration periods. Error bars are ~10% of the electron density values
displayed. A background profile is plotted as a dotted line for reference.
Figure 4. Electron density profile obtained shortly after the AA-1 release. A
pronounced reduction in backscatter is evident near 250 km altitude. For
reference, a background profile is plotted as a dot-dash line.
Figure 5. Incoherent scatter spectra simultaneously measured during the data
integration period of Figure 4 (4.8 s -10.2 s after release). The spectral
data were recorded with 150-m range resolution using the CLP technique.
In addition to the temporal integration, spectra from consecutive altitudes
were averaged for each display. Altitude ranges of integration are shown
in the upper left hand corner of each panel. Values of Te and Tj (shown at
4-13

right) are best fits to the spectral data with an ion composition of 100%
Figured. Backscatter power measured with the Arecibo incoherent scatter radar
during the AA-7 Ba release. BKR pulses were used for this display. The
figure shows radar backscatter power (color scale) versus altitude and time
relative to the launch at 04:58:00 AST. Radar power is expressed as a
signal-to-noise ratio and plotted in dB.
Figure 7. Electron density profile obtained -15-min after the AA-1 release. A
pronounced reduction in backscatter is evident above the Ba+ cloud (large
peak near 240 km). For reference, a background profile is plotted as a
dot-dash line.
Figure 8. Incoherent scatter spectra simultaneously measured during data integration
period of Figure 7 (15 min 3 s - 15 min 18 s after release). Altitude
ranges of integration are shown in the upper left hand corner of each
panel. Values of Tc and Tj and the percentage of Ba+ ions (shown at
right) are best fits to the spectral data. The balance of the ions are O+.
Figure 9. Backscatter power measured with the Arecibo incoherent scatter radar
during the two Ba/Li releases of AA-3b. BKR pulses were used for this
display. The figure shows radar backscatter power (color scale) versus
altitude and time relative to the launch at 04:37:30 AST. Radar power is
expressed as a signal-to-noise ratio and plotted in dB. The radar directly
viewed the first release at 180 s after launch. For the second release
(365 s relative time), the radar was pointed at the geomagnetic flux tube
along which the release took place. During the first release, backscatter
from the rocket saturates the radar receiver, creating an echo that is
extended in range. As the radar beam was moved to monitor the second
release, backscatter from the rocket was once again detected near 368 km
altitude.
Figure 10. Consecutive series of electron density profiles (linear scale) measured
during the release A. Individual profiles are offset by one tick mark (4 x
105 cm'3). Each profile represents the average of 1000 radar pulses
4-14

recorded over a 15-s period. Times shown inside the plot frame are
referenced to the release time; they represent the beginning times of
integration periods. Error bars are -3% of the electron density values
displayed. The rocket echo is intentionally clipped in this display. For
reference, a background profile is plotted as a dotted line.
Figure 11. Electron density profile highlighting the reduction in radar backscatter
caused by release A. An echo from the rocket is evident beginning at
311 km altitude. For reference, a background profile is plotted as a dot-
dash line.
Figure 12. Incoherent scatter spectra simultaneously measured during the data
integration period of Figure 11 (23.2 s - 53.2 s after release A). Altitude
intervals used for integration are shown in the upper left hand corner of
each panel. Values of Te and Tj and the percentage of Ba+ ions have not
yet been determined.
Figure 13. Analysis of the "rocket" echo recorded shortly after release A. Spectral
power is shown versus Doppler frequency and radar range. These data
were acquired with the CLP technique.
4-15

20
3 18
AAldia100 KM-f- I .AAZdia
66°
WEST LONGITUDE
Figure 1

Figure 2

450
^-3500
.3 250
150
2 July 1992, 05:03:30 - 05:03:54 AST
6s
Electron Density (4 x 105 cm-3 per tick mark)
Figure 3

450
400
350
0̂300
250
200
150
2 July 199205:03:37.8 - 05:03:43.2 AST4.8 s -10.2 s after release
2 4 6Electron Density (105 cm-3)
8
Figure 4
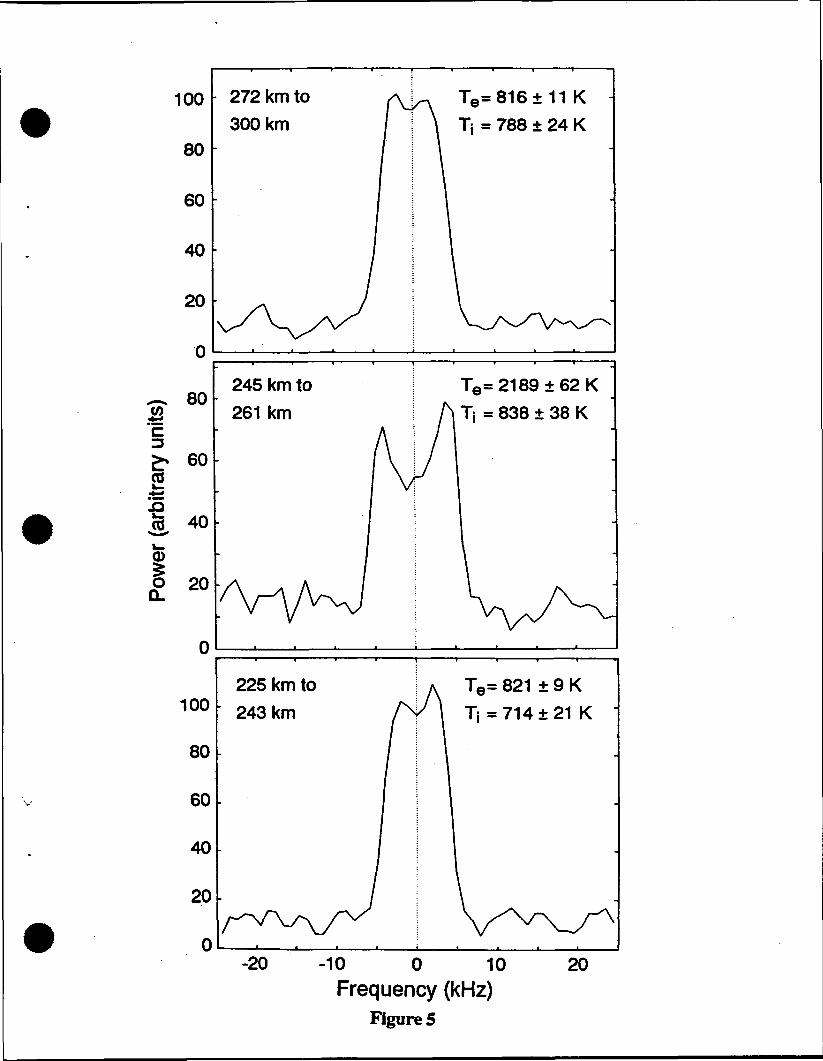
100
80
60
40
20
^ 80
60CO
J3. 40
1O 20
100
80
60
40
20
272 km to
300 km
245 km to
261 km
225 km to
243km
T=816±11 K
= 788 ± 24 K
Te=2189±62K
T| = 838 ± 38 K
Te= 821 ± 9 K
= 714±21 K
-20 -10 0 10
Frequency (kHz)Figures
20

4 July 1992, 64:58:00
SNR(dB)
166.666 212 500*—-**- • *^v\/O*>F rt^^3Z5.6OT
Tine (sec)
437.500 550.600
Figure 6

450
400
350
•8 300
250
200
150
2 July 199205:18:36-05:18:51 AST15 min 3s-15 min 18s
after release
0 2 4 6Electron Density (105 cm-3)
Figure 7
8

160
120
80
40
250
"c 200
5 150+z.a
£- 100
Io 50
800
600
400
200
300 km to
320km
264 km to271 km
240 km to250km
Te= 936 ± 7 KTj = 821 ± 16 K
0% Ba+
Te=1830±59K
Tj = 742 ± 41 K
51% Ba+
Te=1918±49K
TJ = 1070132 K
96% Ba+
-20 -10 0 10Frequency (kHz)
Figures
20

Figure 9

550
?450
6 June 1992, 04:40:30 - 04:43:00 AST
-S350
^250
150
135s
Debris
Electron Density (4 x 105 cm-3 per tick mark)
Figure 10

550
500 "
450 -
400 -
•8 350
300 -
250 -
200 -
150
6 June 199204:40:53.2 - 04:41:23.2 AST
23.2 s - 53.2 s after release A
2 4 6Electron Density (105 cm-3)
Figure 11

250
200
150
100
50
0
-50
^ 200"c
^ 15°£g 10°cdtr 500
I oQ.
-50
200
150
100
50
0
-50
305 km to311 km
289 km to295km
269 km to275km
-20 -10 0 10Frequency (kHz)
20
Figure 12

6 June 199204:40:55.0 - 04:40:55.3 AST
25.0 s - 25.3 s after release A
Figure 13
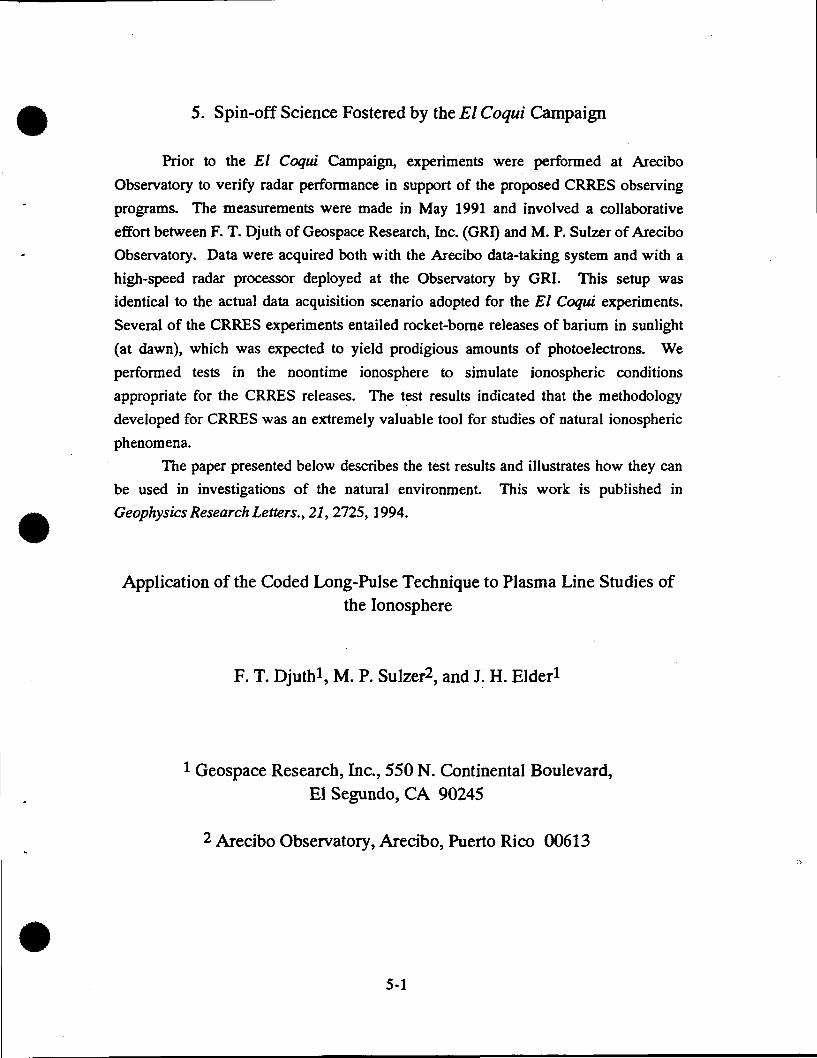
5. Spin-off Science Fostered by the El Coqui Campaign
Prior to the El Coqui Campaign, experiments were performed at Arecibo
Observatory to verify radar performance in support of the proposed CRRES observing
programs. The measurements were made in May 1991 and involved a collaborative
effort between F. T. Djuth of Geospace Research, Inc. (GRI) and M. P. Sulzer of AreciboObservatory. Data were acquired both with the Arecibo data-taking system and with a
high-speed radar processor deployed at the Observatory by GRI. This setup was
identical to the actual data acquisition scenario adopted for the El Coqui experiments.
Several of the CRRES experiments entailed rocket-borne releases of barium in sunlight
(at dawn), which was expected to yield prodigious amounts of photoelectrons. We
performed tests in the noontime ionosphere to simulate ionospheric conditions
appropriate for the CRRES releases. The test results indicated that the methodology
developed for CRRES was an extremely valuable tool for studies of natural ionospheric
phenomena.
The paper presented below describes the test results and illustrates how they can
be used in investigations of the natural environment. This work is published in
Geophysics Research Letters., 21, 2725,1994.
Application of the Coded Long-Pulse Technique to Plasma Line Studies ofthe Ionosphere
F. T. Djuthl, M. P. Sulzer2, and J. H. Elder*
1 Geospace Research, Inc., 550 N. Continental Boulevard,El Segundo, CA 90245
2 Arecibo Observatory, Arecibo, Puerto Rico 00613
5-1

ABSTRACT
Recently, the coded long-pulse radar technique was tested at Arecibo
Observatory, Puerto Rico using photoelectron-enhanced plasma lines in the daytime
ionosphere. The technique immediately proved to be a powerful diagnostic tool for
studying natural ionospheric phenomena. Our initial observations indicate that extremely
accurate measurements of absolute electron density (0.01 to 0.03 % error bars) can be
achieved with an altitude resolution of 150 m and a temporal resolution of ~2 s. In
addition, the technique provides information about electron density structure within a
150-m altitude cell and yields parameters from which the energy spectrum of
suprathermal electrons (;& 5 eV) can be deduced. Our initial measurements are used to
illustrate applications of the coded long-pulse technique to several aeronomic/ionospheric
areas of current interest. These include studies of neutral wave motions in the lower
thermosphere, measurements of ion composition in the Fj region, and investigations of
electron-gas thermal balance and photoelectron energy loss processes. The technique can
be utilized to examine irregularity formation in the F region, measure ionospheric
currents, probe electron acceleration processes in ionospheric modification experiments,
verify the magnetic field dependence of Langmuir wave damping, and more generally
test higher order corrections suggested for the Langmuir dispersion relation.
5-2

INTRODUCTION
Ground-based incoherent scatter radars make use of well-established radar
techniques to obtain information about a wide variety of physical parameters in the upper
atmosphere (-70 km to >1000 km altitude). For example, electron density, electron and
ion temperatures (Te , Tj), ion drift velocities, electrostatic electric fields, and, at lower
heights, the ion-neutral collision frequency and the concentration of negative ions, can be
measured directly by analyzing the ionospheric scatter returned in a narrow frequency
band (10 - 20 kHz) surrounding the radar frequency [Evans, 1969]. While much
information can be extracted from the radar scatter near the radar transmission frequency
(so-called center-line or ion-line scatter), a wealth of additional information is contained
in weak broadband echoes surrounding the center-line scatter (i.e. at frequencies in the
band fr ± f~ where fr is the radar frequency and fp is roughly the electron plasma
frequency). These signals are referred to as "plasma lines" and are the result of radio
wave scattering from Langmuir waves. In the presence of suprathermal electrons,
Langmuir waves are greatly enhanced beyond their natural thermal levels [e.g.
Yngvesson and Perkins, 1968]. Populations of suprathermal electrons are readily
generated in the daytime ionosphere (photoelectrons) and are a common feature of the
auroral ionosphere (particle precipitation events). By monitoring plasma line scatter with
an incoherent scatter radar, one can make extremely accurate measurements of electron
density and electron density gradients, deduce the energy distribution of the suprathermal
electrons present in the ionosphere, monitor the motion of electron density irregularities,
and obtain a great deal of information about electron transport and elastic and inelastic
collision cross sections in the upper atmosphere [e.g., Mantas and Walker, 1976; Abreu
and Carlson, 1977; Carlson et al, 1977; Showen, 1979]. When the ion line and plasma
line observations are combined, new insights into atmospheric processes are often
obtained [Carlson etaL, 1977; Wickwar, 1978; Valladares etal, 1988].
5-3

DATA-TAKING METHODOLOGY
Several new radar techniques have been developed that provide great
improvements in the altitude and temporal resolution of incoherent scatter radar
observations and significantly increase the accuracy with which certain ionospheric
parameters (such as electron density) can be measured [e.g., Showen, 1979; Birkmayer et
aL, 1984; Birkmayer and Hagfors, 1986; Heinselman and Vickrey, 1992a]. The
development of the "cutoff technique [Showen, 1979] and its subsequent refinement
[Heinselman and Vickrey, 1992a] provide for high-accuracy measurements near the F-
region peak The observational technique described by Birkmayer et aL [1984] and
Birkmayer and Hagfors [1986] employs a chirped radar approach to greatly improve
plasma line measurements of electron density and electron density gradients throughout
the F-region ionosphere.
In the current work, we apply the pseudo-random phase-coding technique
described by Sulzer [1986] to plasma line measurements in the daytime ionosphere at
Arecibo Observatory, Puerto Rico. This radar method is often referred to as the coded
long-pulse technique (CLP). During the Arecibo tests discussed below, the 430 MHz
incoherent scatter radar was operated at a peak power near 1.5 MW. Radar pulses 512 (is
in duration were transmitted within an interpulse period (IPP) of 50 ms. The IPP was
initially set to this large value to accommodate the data-taking systems. Each radar pulse
had a different phase code imposed on it; the minimum time (baud length) between 180°
phase reversals was 1 (is. Complex (in-phase and quadrature) voltages were sampled at a
5 MHz rate so that ~5-MHz segments of the plasma line spectrum could be covered.
During the experiment, plasma line sidebands in the frequency range 430 MHz ± (3.5 to
85 MHz) were sampled. The low frequency limit (35 MHz) coincided with an electron
Landau damping cutoff in signal strength; the high frequency limit (85 MHz) was set at
the point where severe losses are encountered in antenna line-feed gain. This upper
frequency restriction will be removed in the near future with the construction of a new
5-4

wideband Gregorian feed system at Arecibo. During the Arecibo experiment,
independent, wideband (5 MHz) plasma line spectra were obtained every 1-fis in radar
time delay, or every 150 m in radar range. The results presented below were obtained at
the downshifted plasma line (fr - f_), where the sensitivity of the Arecibo line feed is the
best The radar beam was pointed vertically.
An example of a plasma line spectrum measured at a single range cell is shown in
Figure 1. The tallest spike in the figure is the plasma line signal; the broad hump is
caused by plasma line clutter originating at other ranges. Spectra measured at each
150-m range cell can be least-squares fit to determine the frequency of the plasma line
peak (approximately equal to the average plasma frequency in a range cell), to establish
plasma line spectral width (proportional to the plasma frequency variation within the
range cell during the 12.5 s integration period), and to obtain the peak amplitude of the
signal as well as the area under the peak (which provides information about the electron
energy distribution). Measurements of plasma line frequency, spectral width, and peak
area are presented in Figure 2 along with error values for an integration of 250 radar
pulses. In general, the error bars at altitudes above 120 km are quite small, and
observations in this region can be processed with an automated routine. Currently, radar
IPPs as short as 9 ms can be accommodated at Arecibo, so the same quality of results as
that shown in Figure 2 is now available after only 2.25 seconds of integration! Below
120 km altitude, error bars can increase significantly because of increased clutter
(determined by the shape of the electron density profile) and because electron-neutral
collision frequencies become large enough to impact Langmuir wave damping
decrements. Measurements below 105 km altitude are extremely difficult to make.
5-5

AERONOMIC OBSERVATIONS
By combining the plasma line observations with independent ion-line
measurements of electron temperature and solving the Langmuir wave dispersion
relationship [Yngvesson and Perkins, 1968], the average electron density in each 150-m
range cell can be accurately established. Figure 3 shows an example of an electron
density profile calculated in this manner along with the electron density profile obtained
from ion-line measurements at about the same time. The normal incoherent scatter ion-
line observations have very large random errors compared to the plasma line results.
With the CLP plasma line technique, the l-o error bars are of the order of 0.03% at
lower heights near 120 km and ~ 0.01% at higher altitudes near 210 km. A worst case
systematic error for plasma line data at Arecibo can be obtained by ignoring
Te-dependent corrections to the Langmuir wave dispersion relation. This yields
systematic electron density errors of ~3% at the lowest heights near 105 km and less than
1% at altitudes above 200 km. Notice that the two data curves in Figure 3 deviate below
200 km altitude. Standard analyses of ion-line data in this altitude region require that an
ion composition model be assumed. Errors in the ion composition model result in
inaccurate determinations of Te/Tj, which give rise to the incorrect estimates of electron
density in Figure 3. (The discrepancy at E-region altitudes where Te/Tj = 1 indicates that
near field correction of the radar beam is not well-understood.) However, one can use
the ion line power profile data along with the plasma line observations to deduce the
altitude profile of Te/Tj. This frees up a fitting parameter and allows the mean ion mass
to be deduced from the ion line spectrum. Similar strategies can be applied at higher
altitudes where the ion mix cannot readily be modeled (e.g. above -400 km).
The total area of the plasma line peak can be converted into the phase-velocity
dependent "temperature" T« [Yngvesson and Perkins, 1968], which is a physically
meaningful way of expressing plasma wave intensity. By plotting KTp versus plasma
wave phase energy one can deduce information about the velocity distribution of
5-6

photoelectrons. Figure 4 shows a display of this type obtained using CLP plasma line
data. These observations have 100 times better energy resolution and approximately 10
times better temporal resolution than previous measurements of this kind at Arecibo
[e.g., Abreu and Carlson, 1977]. This will enable the problem of electron thermal
balance in the ionospheric F region [Carlson et al., 1977] to be examined in great detail.
Currently, well-known discrepancies [e.g., Swartz and Nisbet, 1973; Carlson et al. 1977]
arise when model calculations of electron temperature in the daytime ionosphere are
compared to temperatures directly measured with incoherent scatter radars for a given
value of the solar EUV flux, a measured electron density profile, and measurements of
photoelectron-enhanced plasma waves.
The dips in icTp marked by arrows in Figure 4 are believed to be caused by
inelastic collisions between electrons and the neutral gas. Similar "bite outs" were
observed between 13 and 15 eV by Abreu and Carlson [1977] with much poorer energy
resolution; the bite outs may be related to the dips present in Figure 4. Abreu and
Carlson [1977] indicate that these features are not found in theoretically calculated
electron fluxes and suggest that relevant atmospheric cross sections be reexamined.
Additional theoretical calculations similar to those performed by Jasperse and
Smith [1978] would greatly facilitate the interpretation and utility of these data.
Finally, the great precision with which electron density can be measured with the
CLP technique is likely to open up new vistas of ionospheric investigation. For example,
CLP plasma line studies in the lower thermosphere routinely reveal the presence of
gravity waves. In Figure 5, imprints of gravity waves on the electron density profile are
readily apparent in the measurements. These profiles were obtained from samples of 250
radar pulses taken every 6 min. Well-defined waves having a vertical wavelength of
about 7 km are evident in the early-time observations (11:14 AST, 11:20 AST, and
11:26 AST). In addition, a much longer wavelength disturbance can be seen in the
profiles particularly at altitudes between 130 and 140 km. This wave activity gives way
5-7

to the formation of an intermediate ion layer beginning at 11:32 AST. It is clear that
CLP observations can be a valuable tool for studying the coupling of waves between the
mesosphere and thermosphere.
CONCLUSIONS
The application of the coded long-pulse (CLP) technique to daytime plasma line
studies at Arecibo provides a powerful new diagnostic tool for probing the upper
atmosphere. Although several specific applications have been illustrated in the preceding
section, the utility of the technique is not limited to these examples. By simultaneously
measuring the upshifted and downshifted plasma lines, ionospheric currents can be
measured throughout the ionosphere. Moreover, the technique is sensitive enough to test
higher order corrections suggested for the Langmuir dispersion relation [e.g., Heinselman
and Vickrey, 1992b; Kofman et al., 1993]. Observations made during radio wave
modification of the Arecibo ionosphere have shown that the CLP can readily be used to
study electron acceleration processes in the plasma. The technique is well-suited to
auroral investigations, where good temporal and spatial resolution is often needed to map
out electron density structures and determine electron energy spectra. Other innovative
uses of the technique are likely to emerge as more comprehensive data sets are acquired,
and new approaches are applied to old problems.
Acknowledgments. Two of the authors (F.T.D. and J.H.E.) acknowledge
support from NASA under contract NAS8-39075, the National Science Foundation under
grants ATM-9201040 and ATM-9202658, and from The Phillips Laboratory, Hanscom
Air Force Base under contract NAS8-39238. The Arecibo Observatory is part of the
National Astronomy and Ionosphere Center, which is operated by Cornell University
under cooperative agreement with the National Science Foundation.
5-8

REFERENCES
Abreu, V. J., and H. C. Carlson, Photoelectron energy loss and spectral features deducedby the plasma line technique,/. Geophys. Res., 82,1017-1023,1977.
Birkmayer, W. T., and T. Hagfors, Observational technique and parameter estimation inplasma line spectrum observations of the ionosphere by chirped I.S. radar, J.Atmos. Terr. Phys., 48,1009-1019,1986.
Birkmayer, W. T., T. Hagfors, and M. P. Sulzer, A new method for accurate ionosphericelectron density measurements by incoherent scatter radar, J. Geophys. Res., 89,6841-6849,1984.
Carlson, H. C., Jr., V. B. Wickwar, and G. P. Mantas, The plasma line revisited as anaeronomical diagnostic: suprathermal electrons, solar EUV, electron-gas thermalbalance, Geophys. Res. Lett., 12, 565-567,1977.
Evans, J. V., Theory and practice of ionosphere study by Thomson scatter radar, Proc.IEEE, 57, 495-530,1969.
Heinselman, C. J., and J. F. Vickrey, On the spectral analysis and interpretation ofincoherent scatter plasma line echoes, Radio ScL, 27, 221-230,1992a.
Heinselman, C. J., and J. F. Vickrey, On the frequency of Langmuir waves in theionosphere,/. Geophys. Res., 97,14,905-14,910,1992b.
Jasperse, J. R., and E. R. Smith, The photoelectron flux in the earth's ionosphere atenergies in the vicinity of photoionization peaks, Geophys. Res. Lett., 5, 843-846,1978.
Kofinan, W., J.-P. St-Maurice, and A. P. van Eyken, Heat flow effect on the plasma linefrequency,/. Geophys. Res., 98, 6,079-6,085,1993.
Mantas, G. P., and J. C. G. Walker, The penetration of soft electrons into the ionosphere,Planet. Space Sd., 24,409-423,1976.
Showen, R. L., The spectral measurement of plasma lines, Radio ScL, 14,503-508,1979.
Sulzer, M. P., A radar technique for high range resolution incoherent scatterautocorrelation function measurements utilizing the full average power ofklystron radars, Radio ScL, 21,1033-1040,1986.
Swartz, W. E. and J. S. Nisbet, Incompatibility of solar EUV fluxes and incoherentscatter measurements at Arecibo, /. Geophys. Res., 78,5640,1973.
5-9

Valladares, C. E., M. C. Kelley, and J. F. Vickrey, Plasma line observations in theauroral oval, J. Geophys. Res., 93,1997-2003,1988.
Wickwar, V. B., Plasma lines in the auroral E layer, J. Geophys. Res., 83, 5186-5190,1978.
Yngvesson, K. O., and F. W. Perkins, Radar Thomson scatter studies of photoelectronsin the ionosphere and Landau damping,/. Geophys. Res., 73, 97-110,1968.
5-10

15 May 1991,11:20:00.0 -11:20:12.5 AST
3
CO
t-<u
I
210.45 km Altitude
Plasma Line Frequency Offset (MHz)
Fig. 1. Example of a wideband plasma line spectrum measured in a single 150-m range cell during the May 1991 tests. Theband pass displayed extends from 430 MHz - 3.5 MHz to 430 MHz -8.5 MHz. The tallest spike in the figure is the daytimephotoelectron-enhanced plasma line signal; the broad hump is caused by plasma line clutter originating at other ranges. Insetshows plasma-line peak in greater detail.

280
260
240
220
200
180
160
140
120
Plasma Line Frequency Ficquency Error
4 6 8
Frequency (MHz) Frequency (kHz)
280
260
240
220
|3 2003
1 180
160
140
120
Width of Peak Width Error
10 20
Frequency (kHz)
Area of Peak Arcs Error
J
~0 50 100
Area (Artltmy Units)
5 10 15
Error (Area Units)
Fig. 2. Frequency of plasma line peak, peak width, and area of peak versus altitude for data obtained on 15May 1991, 11:20:00.0 - 11:20:12.5 AST (panels on left). One-sigma error bars calculated as part of thenonlinear least-squares fitting process are shown in panels at right.

•8
300
280
260
240
220
200
3 180
160
140
120
1000
1991
12 16
8
Electron Density (105 cm-3)
10 12 14
Fig. 3. Electron density profile measured using the downshifted plasma line on 15 May 1991, 13:24:00.0 - 13:24:12.5AST with 150-m altitude resolution (solid line), and ion line measurements of the electron density profile made shortlythereafter from 13:32:40.0 to 13:32:52.5 AST with 600-m resolution (dots). The ion line profile has been corrected for range,antenna near-field effects, and TJTj; the peak of the F-layer was calibrated using an f0F2 measurement simultaneously madewith the ionosonde at Arecibo Observatory. Details of the sporadic-E region are shown in upper left inset, and the full profileis displayed at bottom right.

12
10
8
2 -
0
15 May 1991,13:24:00 -13:26:48
8 10 12 14 16 18 20 22
Phase Energy (eV)Fig 4. Plasma line intensity in KTp as a function of Langmuir wave phase energy. The lowest energy near 6 eV correspondsto data taken at an altitude of 125 km, whereas the highest energy (25 eV) corresponds to an altitude of about 275 km.Representative l-o error bars are shown in three regions of the spectrum.

•82
1
140
138
136
134
132
130
128
126
124
122
15 May 1991, 11:14 - 11:32 AST
120
11:14 AST11:20 AST11:26 AST11:32 AST
1.9 2.1 2.2 2.3 2.4 2.5 2.6
Electron Density (105 cm'3)
2.7 2.8
Fig. 5a. Lower thermosphere segment of electron density profiles recorded at six-minute intervals. The dataacquisition period for each profile is 12.5 s.
14015 May 1991, 11:26 -11:44 AST
II
138
136 •
134-
132
130
128
126
124
122
120
11:26 AST11:32 AST11:38 AST11:44 AST
1.9 2.1 2.2 2.3 2.4 2.5 2.6
Electron Density (105 cnr3)
2.7 2.8
Fig. 5b. Continuation of the measurements shown in Fig. 5a at later times. For reference, the profiles recorded at11:26 AST and 11:32 AST are repeated in the display.

REPORT DOCUMENTATION PAGEForm ApprovedOMB No. 0704-0188
Public reporting burden for this co(le<tioo of information n estimated to average 1 hour per response, including the time (or reviewing instructions, searching existing data sources,gathering and maintaining the data needed, and completing and reviewing the collection of information. Send comments regarding this burden estimate or any other aspect of thiscollection of information, including suggestions for reducing this burden, to Washington Headquarters Services. Directorate for information Operations and Reports. 1215 JeffersonOavn Highway. Suite 1204. Arlington. VA 22202-4302. and to the Offke of Management and Budget. Paperwork Reduction Project (0704-0 188). Washington. OC 20S03.
1. AGENCY USE ONLY (Leave blank) I 2. REPORT DATE
1 7Julvl995 13. REPORT TYPE AND DATES COVEREDFinal Report, 21 Aue 1991 through 30 June 1994
4. TITLE AND SUBTITLE
Radar Investigations of Barium Releases over Arecibo Observatory,Puerto Rico
6. AUTHOR(S)
Frank T. Djuth
7. PERFORMING ORGANIZATION NAME(S) AND ADORESS(ES)
Geospace Research, Inc.550 N. Continental Boulevard, Suite 110 •El Segundo, CA 90245
9. SPONSORING /MONITORING AGENCY NAME(S) AND ADDRESS(ES)
NASAMarshall Space Flight CenterMarshall Space Right Center, AL 35812COTR: Mr. Clarence Gearhart/EM41
5. FUNDING NUMBERS
NAS8-39075
8. PERFORMING ORGANIZATIONREPORT NUMBER
GRI-CR-95-7110
10. SPONSORING /MONITORINGAGENCY REPORT NUMBER
11. SUPPLEMENTARY NOTES
12a. DISTRIBUTION /AVAILABILITY STATEMENT
Approved for public release; distribution unlimited
12b. DISTRIBUTION CODE
13. ABSTRACT (Maximum 200 words)The NASA Combined Release and Radiation Effects Satellite (CRRES) El Coqui rocket
campaign was successfully carried out in Puerto Rico during the period 18 May through 12 July 1992.This report describes five chemical release experiments in the upper ionosphere supported by GeospaceResearch, Inc. during the El Coqui campaign. Additional spin-off science is also discussed. The ElCoqui releases are designated AA-1 (rocket 36-082), AA-2 (rocket 36-081), AA-3b (rocket 36-064),AA-4 (rocket 36-065), and AA-7 (rocket 36-083). Particular attention is paid to releases AA-2 andAA-4. These two experiments involved the illumination of ionospheric release regions with powerfulhigh-frequency (HF) radio waves transmitted from the Arecibo HF facility. In the AA-2 experiment,mircroinstabilities excited by the HF wave in a Ba+ plasma were examined. This release yielded asmooth plasma cloud that helped clarify several fundamental issues regarding the physics of wave-plasma instabilities. During AA-2 extremely strong HF-induced Langmuir turbulence was detected withthe Arecibo 430 MHz radar. CF3Br was released in the AA-4 study to create an ionospheric hole thatfocused the HF beam. This experiment successfully explored wave-plasma coupling in an O+ionosphere under conditions of very high HF electric field strengths.14. SUBJECT TERMS
Ionosphere, Chemical Releases, Active Experiments, IonosphericIrregularities, Plasma Instabilities17. SECURITY CLASSIFICATION 18. SECURITY CLASSIFICATION
OF REPORT OF THIS PAGE
Unclassified , Unclassified
IS. NUMBER OF PAGES
15616. PRICE CODE
19. SECURITY CLASSIFICATION 20. LIMITATION OF ABSTRACTOF ABSTRACT
Unclassified SARNSN 7540-01-280-5500 Standard Form 298 (Rev. 2-89)
Prewnbed by ANSI Std. ZJ9-18


![ACIS/MIT Science Publication Report · July 2014 ACIS/MIT Science Publication Report SAO contract SV2-82023 under NASA contract NAS8-03060 From: F. K. Bagano (fkb [AT] space.mit.edu)](https://static.fdocuments.us/doc/165x107/5f0fdd2c7e708231d446438f/acismit-science-publication-report-july-2014-acismit-science-publication-report.jpg)