Final Report: Attention Deficit Hyperactivity Disorder ... were similar when users were restricted...
55
CONFIDENTIAL July 22, 2011 1 ADHD Medications and Risk of Stroke In Young and Middle-Aged Adults Final Report Adverse Effects of Psychostimulant Medications Working Group Steering Committee: Vanderbilt University (Coordinating Center) William O. Cooper M.D., M.P.H. Division of General Pediatrics Suite 313 Oxford House 1313 21 st Avenue South Nashville, TN 37232-4313 phone: 615-936-2430 email: [email protected] Kaiser Permanente Laurel A. Habel, PhD Div. of Research, Kaiser Permanente 2000 Broadway Oakland, CA 94612 phone: (510) 891-3715 email: [email protected] HMO Research Network Colin Sox, MD, MS Department of Pediatrics Boston University Boston, MA 02215 phone: 617-509-9974 email: [email protected] i3 Drug Safety K. Arnold Chan, MD, ScD Ingenix / i3 Drug Safety 950 Winter Street, Suite 3800 Waltham, MA 02451 phone : 781-472-8450 email: [email protected] Food & Drug Administration Andrew D. Mosholder, M.D., M.P.H. FDA Division of Drug Risk Evaluation 10903 New Hampshire Ave Mail Stop 3411Silver Spring, MD 20993- 0002 phone: 301-796-0508 email: [email protected] Agency for Healthcare Research and Quality Chunliu Zhan, MD, PhD Center for Outcomes and Evidence Agency for Healthcare Research and Quality 540 Gaither Road Rockville, MD 20850 phone: 301-427-1225 email: [email protected]
Transcript of Final Report: Attention Deficit Hyperactivity Disorder ... were similar when users were restricted...

CONFIDENTIAL July 22, 2011
1
ADHD Medications and Risk of Stroke
In Young and Middle-Aged Adults
Final Report
Adverse Effects of Psychostimulant Medications Working Group
Steering Committee: Vanderbilt University (Coordinating Center)
William O. Cooper M.D., M.P.H. Division of General Pediatrics Suite 313 Oxford House 1313 21st Avenue South Nashville, TN 37232-4313 phone: 615-936-2430 email: [email protected]
Kaiser Permanente
Laurel A. Habel, PhD Div. of Research, Kaiser Permanente 2000 Broadway Oakland, CA 94612 phone: (510) 891-3715 email: [email protected]
HMO Research Network
Colin Sox, MD, MS Department of Pediatrics Boston University Boston, MA 02215 phone: 617-509-9974 email: [email protected]
i3 Drug Safety K. Arnold Chan, MD, ScD Ingenix / i3 Drug Safety 950 Winter Street, Suite 3800 Waltham, MA 02451 phone : 781-472-8450 email: [email protected]
Food & Drug Administration
Andrew D. Mosholder, M.D., M.P.H. FDA Division of Drug Risk Evaluation 10903 New Hampshire Ave Mail Stop 3411Silver Spring, MD 20993-0002 phone: 301-796-0508 email: [email protected]
Agency for Healthcare Research and Quality Chunliu Zhan, MD, PhD Center for Outcomes and Evidence Agency for Healthcare Research and Quality 540 Gaither Road Rockville, MD 20850 phone: 301-427-1225 email: [email protected]

CONFIDENTIAL July 22, 2011
2
Table of Contents
PagesAbstract 4Introduction 5Methods 6-12
Data sites 6Study participants 6-7Study medications and exposure categories 7Study endpoints 7-8Confounders 8-10Unmeasured confounders 10Statistical approach 11New user analyses 11Remote user comparison 11-12Other subgroup analyses 12Analyses of composite endpoint- stroke/MI/SCD 12Within-site analyses 12Other sensitivity analyses 12
Results 12-17Medication use and person-years of follow-up 12-13Characteristics of study population at baseline and during follow-up 13-14Number of events and rate ratios in the full cohort 14New user analyses 14-15Remote user comparison 15Other subgroup analyses 15Analyses of composite endpoint- stroke/MI/SCD 15-16Within-site analyses 16Sensitivity analyses– adjustment method 16Sensitivity analyses– unmeasured confounding 16-17Other sensitivity analyses– single eligibility period 17
Discussion 17-20Tables 21-41
1a. Cohort characteristics by baseline medication use 21-221b. Characteristics of person-time (after baseline), by medication use 23-262a. Rates of ALL stroke, by use of ADHD medications (n=150,658 total
users) 27
2b. Rates of ALL stroke, by use of ADHD medications (NEW USERS only, n=96,502)
27
2c. Rates of ISCHEMIC stroke, by use of ADHD medications 282d. Rates of HEMORRHAGIC stroke, by use of ADHD medications 282e. Rates of ALL stroke (excluding only those adjudicated as non-
cases), by use of ADHD medications 29
3a. Rates of ALL strokes for current use, by specific ADHD medications 303b. Rates of ALL strokes for current use, by specific ADHD medications
(NEW USERS only) 30
3c. Rates of ISCHEMIC stroke, by specific ADHD medications 313d. Rates of HEMORRHAGIC stroke, by specific ADHD medications 313e. Rates of ALL stroke (excluding only those adjudicated as non- 32

CONFIDENTIAL July 22, 2011
3
cases), by specific ADHD medications 4a. Rates of ALL stroke for duration of current use, by specific ADHD
medications 33
4b. Rates of ALL stroke for duration of current use, by specific ADHD medications (NEW USERS)
33
5a. Rates of ALL stroke, by ADHD medications (remote user comparison)
34
5b. Rates of ALL stroke, by ADHD medications (NEW USER only, remote user comparison)
34
6a. Rates of ALL stroke for current use, by specific ADHD medications (remote user comparison)
35
6b. Rates of ALL stroke for current use, by specific ADHD medications (NEW USER only, remote user comparison)
35
7a. Rate ratios of ALL stroke, overall and by subgroup 36-377b. Rate ratios of ALL stroke, overall and by subgroup (remote users as
comparison) 38-39
8a. Rates of MI or SCD or stroke, by use of ADHD medications 408b. Rates of MI or SCD or stroke, by use of ADHD medications (NEW
USERS only) 40
9a. Rates of MI or SCD or stroke, by use of ADHD medications (remote user comparison)
41
9b. Rates of MI or SCD or stroke , by use of ADHD medications (NEW USERS only, remote user comparison)
41
Appendices 42-51Table A-1. Case identification and adjudication by outcome 42Figure A-1. Stroke case review status: All sites 43Table A-2a. Rates of stroke by site (standardized to age and gender-
distribution of all sites combined) 44
Table A-2. Rates of stroke by site (standardized to age and gender-distribution of all sites combined, NEW USERS)
44
Table A-3. Characteristics of study cohort at baseline, BY SITE 45-46Table A-4a. Rate ratios of ALL stroke, BY SITE 47Table A-4b. Rate ratios of ALL stroke, BY SITE (NEW USERS only) 47Table A-5. Rate ratios of ALL stroke – Standard Adjustment 48-49Table A-6a. RR of ALL stroke, by use of ADHD medications 50Table A-6b. RR of ALL stroke, by use of ADHD medications (NEW USERS only)
50
Table A-7a. RR of MI or SCD or stroke, by use of ADHD medications 51Table A-7b. RR of MI or SCD or stroke, by use of ADHD medications (NEW USERS only)
51
References 52-55

CONFIDENTIAL July 22, 2011
4
Abstract
Background: A growing number of US adults use medications labeled for the treatment of
Attention Deficit Hyperactivity Disorder (ADHD). These agents increase heart rate and blood
pressure, potentially increasing risk of cerebrovascular events.
Methods: Using computerized health records from four study sites (Ingenix-3, Tennessee
Medicaid, Kaiser Permanente California, and the HMO Research Network), we identified
150,658 adults aged 25-64 years with prescriptions for ADHD medications (methylphenidate,
amphetamines, amphetamine salts or atomoxetine) at baseline. Each ADHD medication user
was matched to two non-users on study site, birth year, gender, and calendar year of cohort
entry. The primary endpoint was ischemic or hemorrhagic stroke requiring hospitalization.
Poisson regression was used to compare adjusted rates in users and non-users of ADHD
medications.
Findings: During 835,257 person-years of follow-up, 575 strokes occurred. ADHD medication
users had 111,935 person-years of current use (average 0.74 years per user), with a crude
incidence of stroke of 0.69 per 1,000 person-years. The multivariable adjusted rate ratio (RR)
for any stroke for current use vs. non-use of ADHD medications was 0.77 (95% CI 0.59-1.02).
RRs for ischemic and for hemorrhagic stroke were similar. Among ADHD medication users
only, the adjusted RR for stroke comparing current use to remote use (> 1 year since last use)
was 1.02 (95% CI 0.71-1.45). Results were similar when users were restricted to new users (no
ADHD medication prescription fills in the year prior to cohort entry) and for subgroups stratified
on prior cardiovascular disease, prior non-ADHD psychiatric conditions or age during follow-up
(25-44 and 45-64 years).
Interpretation: Our results do not support an elevated risk of stroke associated with use of
ADHD medications in young and middle-aged adults.
CONFIDENTIAL July 22, 2011
5
Introduction
In recent years, the use of medications labeled for the treatment of Attention Deficit
Hyperactivity Disorder (ADHD) appears to be increasing even more rapidly in adults than in
children. Over 1.5 million U.S. adults now take stimulants1 and approximately 25% of all
prescriptions are issued to persons over 19 years old 2. The rise in ADHD diagnoses is the
primary cause of increased prescribing, although stimulants also are approved for treatment of
narcolepsy3,4 and may be used off-label to treat obesity5 and fatigue related to depression6,7,
stroke8,9 or traumatic brain injury10. In adults, commonly used ADHD medications include the
stimulants methylphenidate and mixed amphetamine salts and increasingly the selective
norepinephrine reuptake inhibitor, atomoxetine.
Placebo-controlled studies in children and adults indicate that stimulants and
atomoxetine elevate systolic blood pressure levels by approximately 2-5 mm Hg and diastolic
blood pressure by 1-3 mm Hg, and also lead to increases in heart rate1,11-13. Such elevation of
blood pressure could potentially increase the risk of either ischemic or hemorrhagic stroke14.
According to a summary from the U.S. Food and Drug Administration’s Adverse Event
Reporting System (AERS), reports of serious adverse events in adults have included sudden
death, myocardial infarction and stroke2. Although one study among children suggested
markedly elevated risks15, cardiovascular safety data from pharmacoepidemiologic studies are
limited and inconsistent15-18, especially among adults19,20.
The primary aim of this study was to examine whether medications used primarily to
treat ADHD are associated with an increased risk of stroke in adults ages 25-64 years. The
study drugs included all medications with a label indication for treatment of ADHD in children or
adults as of December 31, 2005.

CONFIDENTIAL July 22, 2011
6
METHODS
Data sites
The study sites included Vanderbilt University (Tennessee State Medicaid data), Kaiser
Permanente (KP) California (Northern and Southern KP regions), Ingenix-i3 (with data from the
UnitedHealthcare family of health insurance plans and products) and five members of the HMO
Research Network (Harvard Pilgrim Health Care; Group Health Cooperative of Puget Sound;
HealthPartners; Kaiser Permanente Northwest; and Kaiser Permanente Colorado).
Because the computerized data systems at study sites had differing start-up dates,
ranging from 1986 for Tennessee Medicaid to 2002 for KP Southern California, the start of
observation differed by site. Follow-up concluded for all sites at the end of 2005 (to allow
complete mortality searches to be conducted). The study was approved by the institutional
review boards at each of the participating institutions.
Study participants
Eligible individuals were aged 25-64 years with at least 12 months of continuous health
plan coverage and pharmacy benefits prior to the time of cohort entry (denoted as t0).
Individuals were excluded if they had one or more of the following diagnoses during the 365
days prior to t0: sickle cell disease, cancer (other than non-melanoma skin cancer), HIV
infection, organ transplant, liver failure or hepatic coma, end-stage renal disease, respiratory
failure, or severe congestive heart failure. For most of these diagnoses, their occurrence
following cohort entry resulted in censoring. In addition, any study endpoints noted
simultaneously with the appearance of an excluding illness diagnosis were removed from
consideration, with the exception of severe congestive heart failure.
At each contributing site, we assembled the eligible membership periods. Individuals
entered the cohort (t0) upon exposure or as an unexposed match. For each exposed
membership period (i.e., at least one ADHD prescription), starting with the earliest t0, we

CONFIDENTIAL July 22, 2011
7
randomly selected two membership periods with no ADHD medication use on t0 (or in the 365
days prior to t0) and the same gender and birth year.
Study medications and exposure categories
Medication use was based on electronic pharmacy records. ADHD medications included
the amphetamine-related psychostimulants (methylphenidate, dextroamphetamines and
amphetamine salts), pemoline, and atomoxetine. Each person-day of follow-up was classified
according to ADHD drug use, based on prescription fill dates and days supply. Current use was
the period between prescription start date and end of the days supply. Indeterminate use was
the first 89 days after the end of current use. Former use began at 90 days after end of current
use and ended at 365 days after last current use. Greater than 365 days since last days supply
was considered remote use. Non-use referred to person-days with no current or past use (up to
365 days prior to t0). Less than 1% of non-users became users after baseline, at which time
their follow-up was categorized as current use. In some analyses, current use was categorized
by specific medications or duration of use. Non-use was chosen as the reference category for
all primary analyses.
Study endpoints
The primary study endpoint was any stroke, defined as an acute neurologic deficit of
sudden onset that persisted more than 24 hours, corresponded to a vascular territory, and was
not explained by other causes such as trauma, infection, vasculitis, extracranial hemorrhage
leading to hypotension or profound hypotension from another cause. Strokes that occurred
during a hospitalization were excluded. Separate analyses for ischemic and hemorrhagic stroke
also were conducted.
Potential strokes (n=980) were identified from principal hospital discharge diagnoses of
stroke or cause of death from death certificates using the following ICD 9/10 codes:
subarachnoid hemorrhage (ICD-9 430, ICD-10 I60), intracerebral hemorrhage (ICD-9 431, ICD-
10 I61, I64), non-traumatic extradural hemorrhage (ICD-9 432.0, ICD-10 I62.1), subdural

CONFIDENTIAL July 22, 2011
8
hemorrhage (ICD-9 432.1), unspecified intracranial hemorrhage (ICD-9 432.9, ICD-10 I62.0,
I62.9), occlusion and stenosis of precerebral arteries (ICD-9 433.00-.01, 433.10-.11, 433.20-.21,
433.30-.31, ICD-10 I65), occlusion of cerebral arteries (ICD-9 434.00-.01, 434.10-.11, 434.90-
.91, ICD-10 I63, I66), and acute, but ill-defined, cerebrovascular disease (ICD-9 436, ICD-10
I67, I68).
Charts were requested on all potential strokes. Potential strokes with charts (n=911)
underwent adjudication by a team of six trained neurologists, blinded to exposure status (see
Table A-1). For those with insufficient hospital or autopsy records for clinical adjudication
(n=179) or for whom records were completely unavailable (n=69), we used a diagnostic code-
based definition to identify probable strokes. Probable strokes had ICD-9/10 codes with a
positive predictive value (PPV) of 80% or greater, based on those strokes for whom records
were available. Strokes confirmed by clinical adjudication (n=451) and those with insufficient
records meeting the diagnostic code-based definition (n=124), were included as events in
primary analyses (see Figure A-1). In secondary analyses, we include all electronically
identified strokes except those confirmed as non-strokes by clinical adjudication (i.e., strokes
clinically adjudicated as cases plus all those without or with insufficient hospital or autopsy
records).
Confounders
We considered the following risk factors for stroke to be potential confounders: acute
MI, anticoagulants, platelet inhibitors, hypertension, prior stroke or transient ischemic attack
(TIA), peripheral vascular disease, obesity, smoking, diabetes, hyperlipidemia,
alcohol/substance abuse, triptan (migraine medication), oral contraceptives, and menopausal
hormones. In addition, we examined potential confounding by several other variables (see
Table 1a). Only number of different non-ADHD medications with at least one prescription in the
year prior to t0 resulted in a 10% or greater change in the RR for ADHD medications and was
therefore included as a covariate in the fully adjusted models.
CONFIDENTIAL July 22, 2011
9
As a complement to these standard adjustment methods, we constructed a summary
cardiovascular risk score (CRS). The score included the following variables based on
diagnoses, claims or prescriptions in the 365 days preceding t0: acute myocardial infarction,
coronary ischemia, coronary revascularization, congestive heart failure (CHF), arrhythmia,
hypertension; utilization of relevant medical services (psychiatric visits, cardiovascular visits,
other visits, number of different medications), and one or more prescriptions (yes/no) for
cardiovascular drugs such as loop diuretic, digoxin, nitrates, anticoagulant, platelet inhibitor,
anti-arrhythmic agents, angiotensin-converting enzyme inhibitor, angiotensin receptor blocker,
beta-blocker, calcium-channel blocker, thiazide diuretic, and other antihypertensive drugs. The
score also included ever/never (time-varying during follow-up) indicators of smoking, diabetes,
obesity, hyperlipidemia, stroke (prior to baseline only) or transient ischemic attack, congenital
heart disorder, coronary artery anomaly, and peripheral vascular disease. In addition, several
variables not believed to be in any plausible causal pathway from ADHD medications to the
outcomes were treated as time-varying and included the following: alcohol (ETOH)/substance
abuse, suicide attempt, injury, seizure, asthma, major depression, bipolar disorder, anxiety,
psychotic disorders, and several drugs such as antipsychotics, tricyclic antidepressants,
SSRI/SNRI antidepressants, benzodiazepines, lithium, modafinil, insomnia medications,
thioridazine, mood stabilizers, clonidine, guanfacine, beta-agonists, theophylline compounds,
epinephrine, asthma medications, seizure medications, COX-2 inhibitors, other drugs to improve
blood flow, pde5 inhibitors, triptans, oral contraceptives, and menopausal hormones.
The cardiovascular risk scores was created from a Poisson regression model of the
association of the above variables with risk of stroke among all patients, adjusted for use of
ADHD medications and the matching variables. The score was the linear predictor from the
coefficients of the resulting regression model, excluding the coefficients for ADHD medications
and the matching variables.

CONFIDENTIAL July 22, 2011
10
We also constructed a propensity score for current vs. non-use at baseline using the
same variables included in the CRS as our predictor variables. In addition, a separate
propensity score, using the same variables, was constructed for the new user analyses. For
both overall and new user analyses, the propensity score was created from a logistic regression
model of the association of these predictor variables with current use vs. non-use at baseline,
adjusted for the matching variables. The score was the linear predictor of current use vs. non-
use from the coefficients of the resulting regression model.
Unmeasured confounders
In order to examine possible unmeasured confounding by variables inconsistently
available in the electronic record, we used external adjustment methods21-23 to conduct
sensitivity analyses. Information on potential confounders came from two sources.
Race/ethnicity, smoking, obesity, history of cardiovascular disease and drug abuse were
obtained from the reviewed medical records of stroke cases. Information on race/ethnicity,
income, education, smoking, obesity, family history of cardiovascular disease also was available
on approximately 200,000 KP Northern California members aged 25-64 years who took a
mailed survey in 2006. On this survey population, electronic pharmacy records on ADHD
medications were obtained, as well.
We used multivariable logistic regression to examine the association between potential
confounders and use of ADHD medications. Obesity, smoking, family history of cardiovascular
disease were not or were only very weakly associated with use of these medications and,
therefore, would not be important confounders (if associations in our study population are
similar to our external samples). For variables that were associated with use of ADHD
medications (race/ethnicity, income and education), we assessed the extent of their potential
confounding effect on the association of ADHD medication use and risk of stroke using external
adjustment methods22.

CONFIDENTIAL July 22, 2011
11
Statistical approach
Follow-up began at cohort entry and ended at stroke, death, end of insurance
coverage/pharmacy benefit, day before 65th birthday, or end of study period (December 2005),
whichever came first. Poisson regression modeling was used to estimate the association of
ADHD medications with risk of stroke, adjusted for potentially confounding variables. Covariates
in the primary model included matching variables (study site, age (5-year dummy categories),
gender, calendar year (1986-1992, 1993-1999, 2000-2001, 2002-2003, 2004-2005)).
Matching variables were included because, while matching assured balance with respect to
these variables at baseline (point at which matching was done), it did not assure balance during
follow-up as there may have been differential changes in medication use categories or
censoring by these factors. The full model included the following variables categorized as yes
or no: acute MI, anticoagulants, platelet inhibitors, hypertension, prior stroke/TIA, peripheral
vascular disease, obesity, smoking, diabetes, hyperlipidemia, alcohol/substance abuse, triptan,
oral contraceptives, and menopausal hormones. Models also included number of different non-
ADHD medications with at least one prescription in the year prior to t0 (categorized as 0, 1, 2, 3,
4, 5, 6, 7-8, 9-10, 11+). In secondary analyses, ADHD medications, matching variables and
either the CRS or PS were included in regression models. All analyses were done with SAS
version 9.1. All p-values were two-sided.
New user analyses
In sub-analyses, we restricted users of ADHD medications to those who had no use of
these medications in the 365 days prior to cohort entry (i.e., new users). For these analyses,
we used standard adjustment methods to adjust for non-matching variables. In secondary
analyses, we used the CRS and the PS to adjust for these variables (Table A-6b).
Remote user comparison
To examine potential selection bias or unmeasured confounding that could arise from
users being more or less healthy than non-users, we restricted analyses to users of ADHD

CONFIDENTIAL July 22, 2011
12
medications and compared rates in current, indeterminate and former users to rates in remote
users.
Other subgroup analyses
In other analyses, users were restricted to those with a diagnosis or claim for ADHD in
the 365 days prior to cohort entry. Additional subgroups were based on prior cardiovascular
disease at t0, prior non-ADHD psychiatric diagnoses or medication use at t0, and age (25-44 vs.
45-64 years) during follow-up.
Analyses of composite endpoint –stroke/MI/SCD
We have previously conducted, and reported the results, of analyses on the association
between ADHD medications and risk of myocardial infarction (MI) or sudden cardiac death. For
this report, we conducted some analyses using a composite endpoint that included stroke or MI
or SCD.
Within-site analyses
To examine potential heterogeneity across data sites, we conducted analyses within
each of the data sites (Ingenix-i3 (I3), Tennessee Medicaid, HMORN, KPNC, KPSC).
Other sensitivity analyses
In secondary analyses, all variables in the CRS were fixed at baseline to address
concerns that some variables may lie on the causal pathway between medication use and the
outcomes of interest. We also conducted analyses restricting to a single eligibility period.
RESULTS
Medication use and person-years of follow-up
During follow-up, there were 111,935 person-years of current use of ADHD medications
(average of 0.74 years per user at baseline), 53,328 person-years categorized as indeterminate
use (average 0.35 years per user at baseline), 47,333 person-years categorized as former use
(average 0.31 years per user at baseline), 69,202 person-years categorized as remote use of
ADHD medications (average 0.46 years per user at baseline), and 553,459 person-years of non

CONFIDENTIAL July 22, 2011
13
use of ADHD medications (average 1.89 years per non-user at baseline). Of the person-years
of current use, methylphenidate use accounted for approximately 45%, amphetamine use
accounted for 43% and atomoxetine use accounted for 7%. There was very little pemoline use
(3%).
Characteristics of study population at baseline and during follow-up
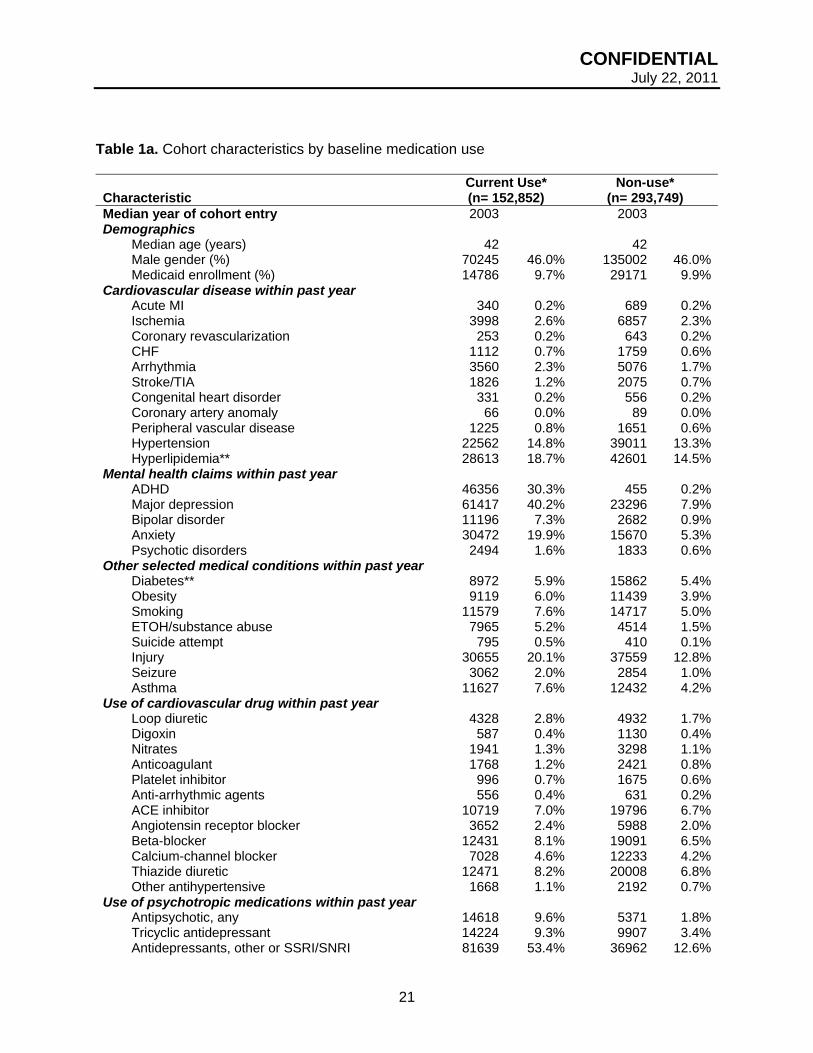
Baseline characteristics of users and non-users are shown in Table 1a. Other than
hypertension and hyperlipidemia, the prevalences of various cardiovascular disease conditions
in the year prior to baseline were rare and less than 3%. Prevalences in the year prior to
baseline of most cardiovascular disease conditions and cardiovascular medications were
generally similar, although some such as hypertension, hyperlipidemia, arrhythmia, and
stroke/TIA were slightly more common in current users than non-users of ADHD medications.
While the prevalences of other established risk factors for stroke, such as diabetes, obesity, and
smoking, were fairly similar, substance abuse was more common in the users than non-users
(5.2% vs. 1.5%). As expected, a diagnosis or claim for ADHD was substantially more common
among current users than non-users (30% vs. 0.2%, respectively). The prevalences of other
mental health conditions were also higher in current users than non-users. During the year prior
to baseline, several non-cardiovascular conditions, such as injury and asthma, also were more
common among current users than among non-users of ADHD medications. As with mental
health conditions, use of psychotropic medications in the year prior to diagnosis was
substantially more common in current users than non-users of ADHD medications. Use of
several other selected medications, such as those for seizures, was also more common among
current users than non-users.
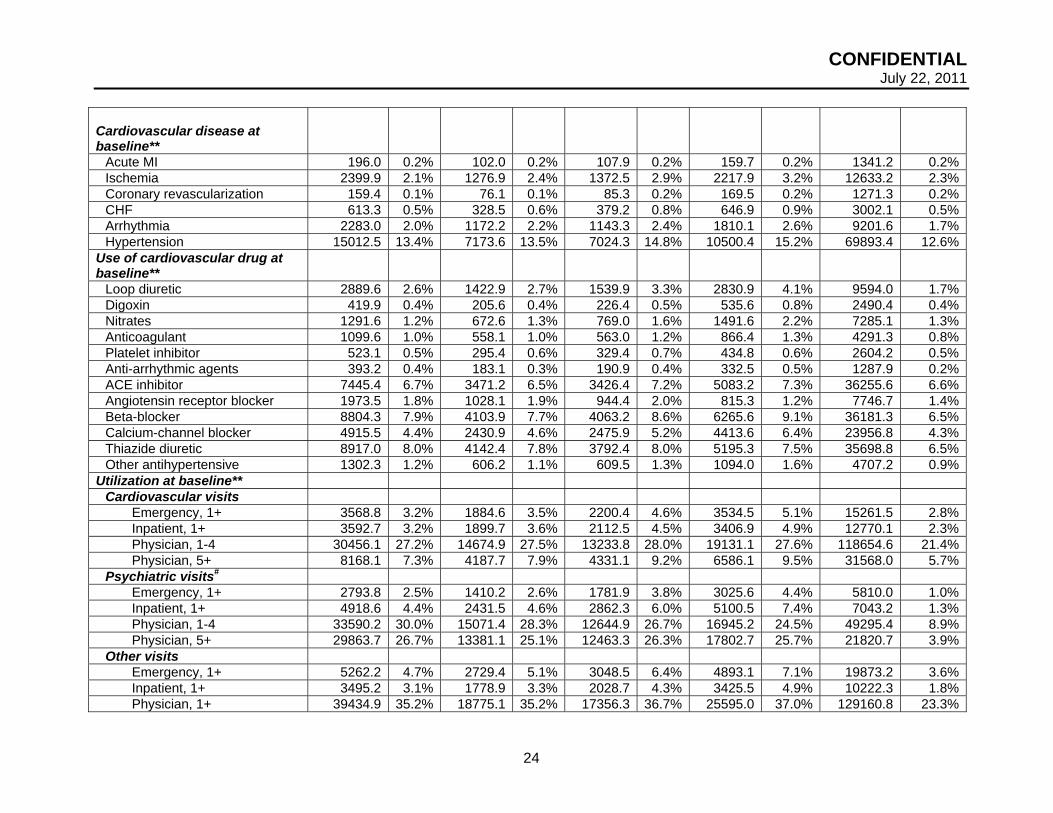
Characteristics of person-time by medication use are presented in Table 1b. The
prevalences of cardiovascular risk factors were slightly higher among the remote users than
among the current users – or the non-users. This risk distribution is summarized by the CRS
deciles (bottom of Table 1b). Remote users are less likely to be in the lowest 3 deciles of the

CONFIDENTIAL July 22, 2011
14
CRS (1, 2, 3) and more likely to be in the highest 3 deciles compared to either current users or
non-users.
Number of events and rate ratios in the full cohort
During 835,257 person-years of follow-up, 575 cases of stroke occurred, giving a crude
incidence rate of 0.69 per 1000 person-years. In analysis adjusted for matching variables only
(i.e., site, age, gender, and calendar year of cohort entry), rate ratios of any stroke for current,
indeterminate, former and remote users vs. non-users of ADHD medications were 0.96 (95% CI
0.73-1.25), 1.02 (95% CI 0.71-1.48), 1.32 (95% CI 0.95-1.84), and 1.06 (95% CI 0.82-1.38),
respectively. In analyses adjusted for matching variables plus selected stroke risk factors (i.e.,
standard adjustment), rate ratios of stroke for current, indeterminate, former and remote users
vs. non-users of ADHD medications were 0.77 (95% CI 0.59-1.02), 0.82 (95% CI 0.57-1.20),
0.99 (95% CI 0.71-1.40), and 0.76 (95% CI 0.58-1.00), respectively (Table 2a). Results were
similar when events were restricted to either ischemic or hemorrhagic stroke alone (Tables 2c,
2d). Stroke results were similar when cases included all electronically identified cases except
those confirmed as non-cases by clinical adjudication (Table 2e).
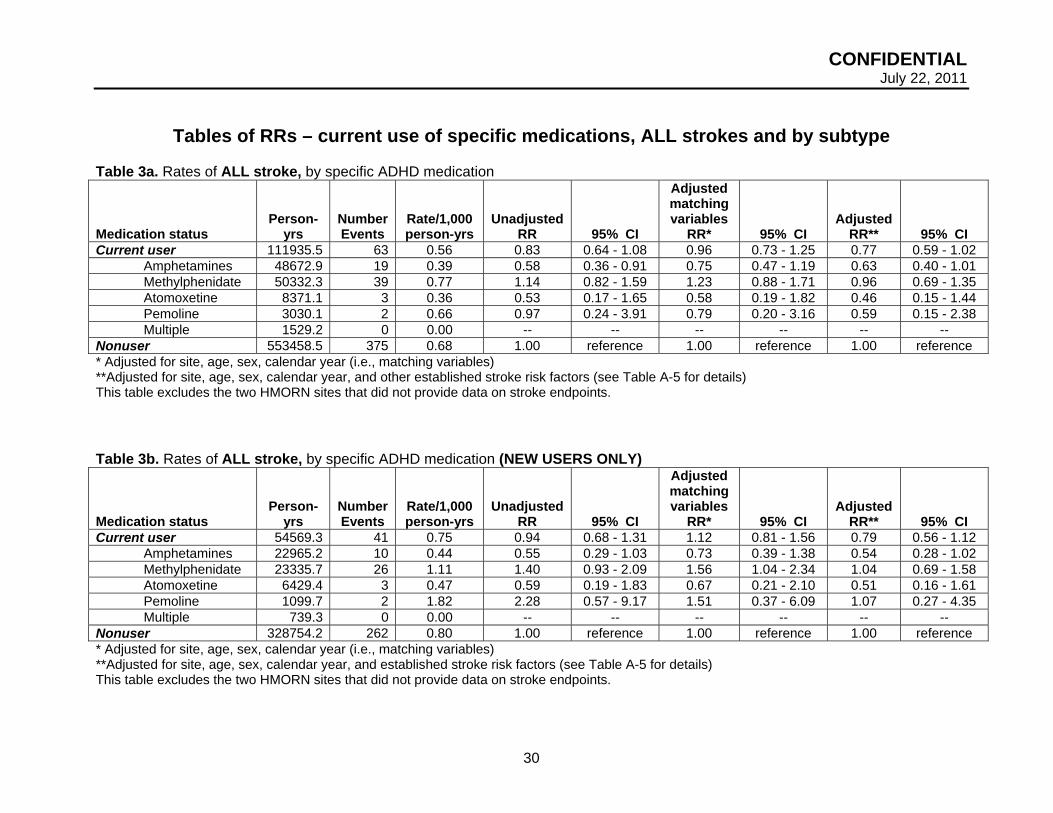
Fully adjusted rate ratios of stroke for current use of amphetamines, methylphenidate
and atomoxetine vs. non-use of any ADHD medications were 0.63 (95% CI 0.40-1.01), 0.96
(95% CI 0.69-1.35), and 0.46 (95% CI 0.15-1.44), respectively (Table 3a). Results were similar
when events were restricted to either ischemic or hemorrhagic stroke alone (Tables 3c, 3d).
Stroke results were similar when cases included all electronically identified cases except those
confirmed as non-cases by clinical adjudication (Table 3e). Analyses of duration among current
users did not suggest any pattern of increasing risk associated with increasing time on ADHD
medications or for any windows of time (Table 4a).
New user analyses
The RR for current vs. non-use did not materially change when users were restricted to
those without use of ADHD medications in the year prior to baseline (i.e., to new users) (Tables

CONFIDENTIAL July 22, 2011
15
2b). Likewise, the RRs for specific ADHD medications and for duration of current use in the
new user analyses (Table 3b, 4b) were similar to those in analyses including both new and
prevalent users.
Remote user comparison
Results of analyses comparing current, indeterminate and former users to remote users
are presented in Table 5a-b. RRs were higher than those with non-users as the comparison and
generally above 1.0, although none were statistically significant. As in the full cohort, there was
little evidence of a difference in risk by type of ADHD medication (Table 6a, 6b).
Other subgroup analyses
Results of subgroup analyses are presented in Tables 7a-b. RRs were not materially
changed when the cohort was restricted to patients with or to those without cardiovascular
disease in the year prior to baseline or to patients with or without non-ADHD psychiatric
conditions in the year prior to baseline. Results also were not materially changed when users
were restricted to those with ADHD-related health encounters in the year prior to baseline.
Note, these RRs were similar when we included all non-users as the comparison or just those
non-users matched to the new users or to users with ADHD, respectively. RRs for current vs.
non-use of ADHD medications were similar for young and middle-aged adults
Analyses of composite endpoint –stroke/MI/SCD
In analysis adjusted for matching variables only (i.e., site, age, gender, and calendar
year of cohort entry), rate ratios of any stroke for current, indeterminate, former and remote
users vs. non-users of ADHD medications were 0.97 (95% CI 0.84-1.12), 1.11 (95% CI 0.92-
1.33), 1.07 (95% CI 0.89-1.29), and 1.02 (95% CI 0.88-1.17), respectively (Table 8a). In
analyses adjusted for matching variables plus selected stroke risk factors (i.e., standard
adjustment), rate ratios of stroke for current, indeterminate, former and remote users vs. non-
users of ADHD medications were 0.80 (95% CI 0.69-0.92), 0.90 (95% CI 0.75-1.09), 0.83 (95%

CONFIDENTIAL July 22, 2011
16
CI 0.68-1.00), and 0.76 (95% CI 0.66-0.87), respectively. When we restricted users to new
users, the RR for current use was lower (0.68, 95% CI 0.56-0.82) (Table 8b).
In analyses among ADHD medication users only, the adjusted RR for current vs. remote
use was 1.05 (95% CI 0.87-1.26) (Table 9a). When we restricted users to new users, the RR for
current vs. remote use was slightly lower (0.94, 95% CI 0.75-1.18) (Table 9b).
Within-site analyses
Some variation in results was observed across data sites. The crude rate of stroke was
significantly higher among the Tennessee Medicaid population (Table A-2). This is expected
since the Tennessee Medicaid population was generally sicker, with greater prevalence at
baseline of most medical conditions and prescription medication use, compared to those at
other sites (Table A-3). While the RR for stroke associated with current use of ADHD
medications was highest among the Tennessee Medicaid population (Table A-4a), it was not
statistically significant.
Sensitivity analyses – adjustment method
The RRs for covariates included in our main model are presented in Table A-5. Results
of analyses for stroke among the full cohort were similar when we used standard adjustment
methods, when we used a propensity score (PS) or when we used a CRS approach (Table A-
6a). In addition, there was little difference in the new user subgroup results when we used the
PS or CRS to adjust for covariates (Table A-6b). We found that fixing at baseline the values of
all covariates in the CRS had little impact on results (not shown).
Sensitivity analyses – unmeasured confounding
When we used external survey data to examine the association of ADHD medication use
with sociodemographic factors that could not be systematically assessed on the study
population using electronic data, we found that stimulant users were less likely than nonusers to
lack any college education (10% v. 17%). If this pattern was similar in our study population, and
CONFIDENTIAL July 22, 2011
17
if lack of any college education doubled the risk of stroke, then our RR estimates would be
biased downward by small amounts.
We similarly found evidence in the external survey data that only 5% of the stimulant
users were black or Hispanic versus 12% of the nonusers. Our chart reviews to validate stroke
cases also found evidence that among the reviewed cases, use of ADHD medications is more
common among whites than among minorities. If black or Hispanic race/ethnicity were as
prevalent in our study population as in our survey sample, and if it also doubled the risk of
stroke, then unmeasured race/ethnicity could also bias our RR estimates by amounts similar to
those reported for education above.
Low income was more prevalent in users than in non-users among the survey
respondents (19% of the users had annual income < $40,000 versus 13% of non-users). This
would suggest that residual confounding from unmeasured income would bias our RR estimates
upwards (toward an apparent RR higher than the true RR), and countering some of the negative
residual confounding from education and race.
Other sensitivity analyses- single eligibility period
Less than 1% of the cohort had multiple eligibility periods (i.e., left and re-entered the
cohort). Results were virtually identical in sensitivity analyses in which we restricted eligibility
periods to one per individual (not shown).
Discussion
In our large cohort of over 440,000 young and middle-aged adults aged 25-64 years,
including over 150,000 users of ADHD medications, we found no evidence for an increased risk
of stroke associated with current ADHD medication use. We also found little evidence of an
increased risk for current use of any of the specific medications examined (i.e.,
methylphenidate, amphetamines or atomoxetine) or for an increase in risk with increasing
duration of current use. Furthermore, results were similar when users were restricted to new
users and when our comparison was remote use of these medications (i.e., one or more years

CONFIDENTIAL July 22, 2011
18
in the past). Results also were similar in subgroups stratified by prior cardiovascular disease or
non-ADHD psychiatric conditions and among young and middle-aged adults.
Our findings of no increased risk of stroke, along with our previous findings of no
increased risk of MI or SCD, are consistent with results from some, but not all, previous
pharmacoepidemiologic studies of serious cardiovascular events 15-20. Only two previous
reports were from studies conducted among adults 19,20. One study compared risk of
cerebrovascular accidents (CVA) and transient ischemic attacks (TIA) among those prescribed
atomoxetine with those prescribed stimulant ADHD medications, as well as with adults in the
general population19. There was a suggestion of higher rates of CVA and lower rates of TIA in
current users of atomoxetine compared to users of stimulants, although the number of events
was small and RRs were not statistically significant. Compared to rates in the general
population, users of ADHD medications had higher rates of TIAs and lower rates of CVA,
although the latter was not statistically significant. In contrast, no increase in sudden cardiac
deaths among children, adolescents or young adults using ADHD medications
(methylphenidate, dexamphetamines or atomoxetine) was observed in a cohort study
conducted in the General Practice Research Database in the UK20.
Our study has several strengths and limitations. Use of ADHD medications was based
on electronic pharmacy records of filled prescriptions. Filled prescriptions may not represent
medications actually consumed and days supply may not represent actual periods of use.
Nonetheless, electronic pharmacy databases have been found to be excellent sources of
information on longitudinal drug use. We reviewed the medical records and death certificates to
confirm stroke diagnoses. However, records were unavailable for some of our electronically
identified cases. We used a diagnostic code-based case definition for these strokes and some
misclassification may have occurred.
We adjusted for a large number of established and potential cardiovascular risk factors.
We also conducted sensitivity analyses, using a cardiovascular risk score or a propensity score
CONFIDENTIAL July 22, 2011
19
(with all covariates fixed at baseline), to examine the robustness of our primary approach.
However there were some factors, primarily psychiatric conditions and/or medications, for which
the prevalence was substantial in the users of ADHD medications but rare in the non-users.
Therefore, we had limited ability to adjust for these variables. Important confounding by these
psychiatric conditions and/or medications seems unlikely though, since they are not considered
established risk factors for cardiovascular disease, they were not or were only modestly related
to risk of stroke (or MI or SCD) in our cohort, and results were similar when we restricted our
analyses to those with or to those without a history of non-ADHD psychiatric conditions.
We had no or incomplete information on several potentially important factors, including
race/ethnicity, socioeconomic status, smoking, obesity, substance abuse and family history of
serious cardiovascular disease. Results of sensitivity analyses suggest that unmeasured
confounding by education and race/ethnicity may account for the slightly lower rates of our
endpoints among users vs. non-users of these medications. The limitations to our sensitivity
analysis approach to evaluating the extent of unmeasured confounding include assumptions
that associations between the confounder and the exposure in the external population parallel
those in the study population and this approach does not address joint confounding by several
unmeasured covariates21-23.
Differential misclassification of confounders is another potential source of bias. It is
possible that users of stimulants were more or less likely than non-users to have their
cardiovascular disease conditions (or other risk factors for our outcomes) captured in the
electronic medical record. If this information was more frequently captured for the users, such
differential misclassification could result in RR estimates that were biased downward. Since
adjustments for number of clinical encounters (physician visits, ER, hospitalization and
medication use—included in CRS and PS in sensitivity analyses) did not materially change our
estimates, this issue seems unlikely to be of significant concern.

CONFIDENTIAL July 22, 2011
20
As with any observational study of medications, some healthy user and provider bias
may have influenced results. In our cohort, users and non-users of ADHD medications
appeared to be quite similar with respect to the prevalence of most cardiovascular disease risk
factors at baseline, although it did appear that these risk factors were generally more prevalent
in those who discontinued use. The results of our remote user comparisons are consistent with
some healthy user or provider bias. The results of our new user subgroup analyses suggest
that our overall results were not appreciably biased by covariates that changed after use of
ADHD medications. In the new user analysis, we did not observe an elevation in risk in the
period shortly after initiation, suggesting our overall results among new and prevalent users
were not biased by an early depletion of susceptibles24.
In conclusion, the results of our large, population-based study should be reassuring with
respect to the cardiovascular safety of relatively short-term use of ADHD medication use in
young and middle-aged adults. In primary and subgroup analyses, as well as multiple
sensitivity analyses that accounted for relevant confounders, we found no evidence for an
increase in the risk of stroke, MI or SCD.
CONFIDENTIAL July 22, 2011
21
Table 1a. Cohort characteristics by baseline medication use
Characteristic
Current Use* (n= 152,852)
Non-use* (n= 293,749)
Median year of cohort entry 2003 2003 Demographics
Median age (years) 42 42 Male gender (%) 70245 46.0% 135002 46.0%Medicaid enrollment (%) 14786 9.7% 29171 9.9%
Cardiovascular disease within past year Acute MI 340 0.2% 689 0.2%Ischemia 3998 2.6% 6857 2.3%Coronary revascularization 253 0.2% 643 0.2%CHF 1112 0.7% 1759 0.6%Arrhythmia 3560 2.3% 5076 1.7%Stroke/TIA 1826 1.2% 2075 0.7%Congenital heart disorder 331 0.2% 556 0.2%Coronary artery anomaly 66 0.0% 89 0.0%Peripheral vascular disease 1225 0.8% 1651 0.6%Hypertension 22562 14.8% 39011 13.3%Hyperlipidemia** 28613 18.7% 42601 14.5%
Mental health claims within past year ADHD 46356 30.3% 455 0.2%Major depression 61417 40.2% 23296 7.9%Bipolar disorder 11196 7.3% 2682 0.9%Anxiety 30472 19.9% 15670 5.3%Psychotic disorders 2494 1.6% 1833 0.6%
Other selected medical conditions within past year Diabetes** 8972 5.9% 15862 5.4%Obesity 9119 6.0% 11439 3.9%Smoking 11579 7.6% 14717 5.0%ETOH/substance abuse 7965 5.2% 4514 1.5%Suicide attempt 795 0.5% 410 0.1%Injury 30655 20.1% 37559 12.8%Seizure 3062 2.0% 2854 1.0%Asthma 11627 7.6% 12432 4.2%
Use of cardiovascular drug within past year Loop diuretic 4328 2.8% 4932 1.7%Digoxin 587 0.4% 1130 0.4%Nitrates 1941 1.3% 3298 1.1%Anticoagulant 1768 1.2% 2421 0.8%Platelet inhibitor 996 0.7% 1675 0.6%Anti-arrhythmic agents 556 0.4% 631 0.2%ACE inhibitor 10719 7.0% 19796 6.7%Angiotensin receptor blocker 3652 2.4% 5988 2.0%Beta-blocker 12431 8.1% 19091 6.5%Calcium-channel blocker 7028 4.6% 12233 4.2%Thiazide diuretic 12471 8.2% 20008 6.8%Other antihypertensive 1668 1.1% 2192 0.7%
Use of psychotropic medications within past year Antipsychotic, any 14618 9.6% 5371 1.8%Tricyclic antidepressant 14224 9.3% 9907 3.4%Antidepressants, other or SSRI/SNRI 81639 53.4% 36962 12.6%

CONFIDENTIAL July 22, 2011
22
Benzodiazepines 43695 28.6% 25956 8.8%Lithium 4177 2.7% 1002 0.3%Modafinil 4732 3.1% 383 0.1%Insomnia meds 15270 10.0% 6732 2.3%Thioridazine 307 0.2% 181 0.1%Mood stabilizers, w/o seizure 22426 14.7% 8631 2.9%Clonidine/guanfacine, w/o HT 2000 1.3% 659 0.2%
Use of other selected medications within past year Beta-agonist 18971 12.4% 20835 7.1%Epinephrine 1342 0.9% 1274 0.4%Asthma med, other 39645 25.9% 45102 15.4%Seizure med, any 24139 15.8% 10397 3.5%Theophylline compounds (asthma med) 960 0.6% 1200 0.4%COX-2 inhibitors 10666 7.0% 10838 3.7%Other drugs to improve blood flow 216 0.1% 250 0.1%Clonidine 2602 1.7% 1787 0.6%pde5 inhibitors 5183 3.4% 4504 1.5%Triptans 7164 4.7% 5298 1.8%Oral contraceptives 18379 12.0% 28590 9.7%Hormones, menopausal or misc 18026 11.8% 23388 8.0%
Utilization within past year Cardiovascular visits Emergency, 1+ 5728 3.7% 7697 2.6% Inpatient, 1+ 6022 3.9% 7130 2.4% Physician, 1-4 43474 28.4% 65256 22.2% Physician, 5+ 13242 8.7% 17713 6.0%Psychiatric visits# Emergency, 1+ 4417 2.9% 2897 1.0% Inpatient, 1+ 7761 5.1% 3827 1.3% Physician, 1-4 43538 28.5% 26703 9.1% Physician, 5+ 40176 26.3% 11048 3.8%Other visits Emergency, 1+ 7885 5.2% 9594 3.3% Inpatient, 1+ 5812 3.8% 5595 1.9% Physician, 1+ 55386 36.2% 69134 23.5%No. of different medications*** 1 24309 15.9% 61193 20.8% 2+ 108955 71.3% 116680 39.7%
*Numbers are for membership periods at baseline or cohort entry (t0); actual counts of unique individuals are 150,359 for current users and 292,540 for non-users at baseline. Note, there were 299 indeterminate and former users at baseline (for a total of 150,658 users at baseline), ** Including medications # Excluding ADHD visits *** Excluding ADHD medications

CONFIDENTIAL July 22, 2011
23
Table 1b. Characteristics of person-time (after baseline), by medication use Characteristic
Current Use
Indeterminate-use
Former Use
Remote Use
Non-use
Pr-yr* % Pr-yr* % Pr-yr* % Pr-yr* % Pr-yr* % Total 111935.5 13.4% 53327.8 6.4% 47333.0 5.7% 69202.3 8.3% 553458.5 66.3%Demographics
Gender Male 51294.6 45.8% 24147.8 45.3% 21784.1 46.0% 32323.5 46.7% 253254.0 45.8%Female 60640.9 54.2% 29180.0 54.7% 25548.9 54.0% 36878.8 53.3% 300204.5 54.2%
Age 25-29 8483.3 7.6% 4557.1 8.5% 3547.1 7.5% 2167.5 3.1% 36630.2 6.6%30-34 12674.5 11.3% 6882.3 12.9% 6334.3 13.4% 7134.0 10.3% 64045.1 11.6%35-39 15189.8 13.6% 7843.2 14.7% 7389.9 15.6% 10347.8 15.0% 79842.8 14.4%40-44 19617.2 17.5% 9509.4 17.8% 8705.9 18.4% 13134.2 19.0% 99128.6 17.9%45-49 21466.0 19.2% 9688.5 18.2% 8508.6 18.0% 13302.5 19.2% 103285.7 18.7%50-54 17936.1 16.0% 7755.3 14.5% 6540.0 13.8% 11129.0 16.1% 86230.5 15.6%55-59 11363.3 10.2% 4843.1 9.1% 4179.1 8.8% 7485.2 10.8% 56005.1 10.1%60-64 5205.3 4.7% 2248.9 4.2% 2128.1 4.5% 4502.2 6.5% 28290.5 5.1%
Site KPNC 14105.0 12.6% 5150.2 9.7% 4889.7 10.3% 8039.6 11.6% 66737.0 12.1%KPSC 5709.7 5.1% 1985.9 3.7% 1909.0 4.0% 1551.1 2.2% 23160.0 4.2%Tennessee Medicaid 8841.5 7.9% 5426.2 10.2% 7552.5 16.0% 20629.0 29.8% 80121.0 14.5%HMORN Group Health 6478.2 5.8% 2419.5 4.5% 1754.9 3.7% 2581.6 3.7% 29536.0 5.3% Harvard Pilgrim 9919.3 8.9% 4426.3 8.3% 3216.8 6.8% 3789.8 5.5% 45958.0 8.3% HealthPartners 4350.8 3.9% 1709.0 3.2% 1252.4 2.6% 1525.0 2.2% 23289.0 4.2% KPCO 3114.0 2.8% 1134.7 2.1% 922.2 1.9% 1454.8 2.1% 13228.0 2.4% KP Northwest 4472.7 4.0% 1543.7 2.9% 1110.8 2.3% 1313.0 1.9% 18488.0 3.3%Ingenix/I3 54945.0 49.1% 29532.0 55.4% 24725.0 52.2% 28318.0 40.9% 252942.0 45.7%
Year 2004-2005 52077.0 46.5% 23914.0 44.8% 20573.0 43.5% 30748.0 44.4% 247969.0 44.8%2002-2003 32182.0 28.8% 14292.0 26.8% 11244.0 23.8% 22449.0 32.4% 157683.0 28.5%2000-2001 17612.0 15.7% 9774.4 18.3% 11055.0 23.4% 9618.8 13.9% 95645.0 17.3%1993-1999 9859.9 8.8% 5138.2 9.6% 4102.2 8.7% 5471.8 7.9% 48617.0 8.8%1986-1992 205.2 0.2% 209.9 0.4% 359.1 0.8% 914.3 1.3% 3544.3 0.6%
ADHD at baseline** 39770.6 35.5% 15776.1 29.6% 10112.9 21.4% 10020.7 14.5% 570.2 0.1%
CONFIDENTIAL July 22, 2011
24
Cardiovascular disease at baseline**
Acute MI 196.0 0.2% 102.0 0.2% 107.9 0.2% 159.7 0.2% 1341.2 0.2%Ischemia 2399.9 2.1% 1276.9 2.4% 1372.5 2.9% 2217.9 3.2% 12633.2 2.3%Coronary revascularization 159.4 0.1% 76.1 0.1% 85.3 0.2% 169.5 0.2% 1271.3 0.2%CHF 613.3 0.5% 328.5 0.6% 379.2 0.8% 646.9 0.9% 3002.1 0.5%Arrhythmia 2283.0 2.0% 1172.2 2.2% 1143.3 2.4% 1810.1 2.6% 9201.6 1.7%Hypertension 15012.5 13.4% 7173.6 13.5% 7024.3 14.8% 10500.4 15.2% 69893.4 12.6%
Use of cardiovascular drug at baseline**
Loop diuretic 2889.6 2.6% 1422.9 2.7% 1539.9 3.3% 2830.9 4.1% 9594.0 1.7%Digoxin 419.9 0.4% 205.6 0.4% 226.4 0.5% 535.6 0.8% 2490.4 0.4%Nitrates 1291.6 1.2% 672.6 1.3% 769.0 1.6% 1491.6 2.2% 7285.1 1.3%Anticoagulant 1099.6 1.0% 558.1 1.0% 563.0 1.2% 866.4 1.3% 4291.3 0.8%Platelet inhibitor 523.1 0.5% 295.4 0.6% 329.4 0.7% 434.8 0.6% 2604.2 0.5%Anti-arrhythmic agents 393.2 0.4% 183.1 0.3% 190.9 0.4% 332.5 0.5% 1287.9 0.2%ACE inhibitor 7445.4 6.7% 3471.2 6.5% 3426.4 7.2% 5083.2 7.3% 36255.6 6.6%Angiotensin receptor blocker 1973.5 1.8% 1028.1 1.9% 944.4 2.0% 815.3 1.2% 7746.7 1.4%Beta-blocker 8804.3 7.9% 4103.9 7.7% 4063.2 8.6% 6265.6 9.1% 36181.3 6.5%Calcium-channel blocker 4915.5 4.4% 2430.9 4.6% 2475.9 5.2% 4413.6 6.4% 23956.8 4.3%Thiazide diuretic 8917.0 8.0% 4142.4 7.8% 3792.4 8.0% 5195.3 7.5% 35698.8 6.5%Other antihypertensive 1302.3 1.2% 606.2 1.1% 609.5 1.3% 1094.0 1.6% 4707.2 0.9%
Utilization at baseline** Cardiovascular visits
Emergency, 1+ 3568.8 3.2% 1884.6 3.5% 2200.4 4.6% 3534.5 5.1% 15261.5 2.8% Inpatient, 1+ 3592.7 3.2% 1899.7 3.6% 2112.5 4.5% 3406.9 4.9% 12770.1 2.3% Physician, 1-4 30456.1 27.2% 14674.9 27.5% 13233.8 28.0% 19131.1 27.6% 118654.6 21.4% Physician, 5+ 8168.1 7.3% 4187.7 7.9% 4331.1 9.2% 6586.1 9.5% 31568.0 5.7%
Psychiatric visits# Emergency, 1+ 2793.8 2.5% 1410.2 2.6% 1781.9 3.8% 3025.6 4.4% 5810.0 1.0% Inpatient, 1+ 4918.6 4.4% 2431.5 4.6% 2862.3 6.0% 5100.5 7.4% 7043.2 1.3% Physician, 1-4 33590.2 30.0% 15071.4 28.3% 12644.9 26.7% 16945.2 24.5% 49295.4 8.9% Physician, 5+ 29863.7 26.7% 13381.1 25.1% 12463.3 26.3% 17802.7 25.7% 21820.7 3.9%
Other visits Emergency, 1+ 5262.2 4.7% 2729.4 5.1% 3048.5 6.4% 4893.1 7.1% 19873.2 3.6% Inpatient, 1+ 3495.2 3.1% 1778.9 3.3% 2028.7 4.3% 3425.5 4.9% 10222.3 1.8% Physician, 1+ 39434.9 35.2% 18775.1 35.2% 17356.3 36.7% 25595.0 37.0% 129160.8 23.3%

CONFIDENTIAL July 22, 2011
25
No. of different medications*** 1 17852.6 15.9% 8704.6 16.3% 7237.0 15.3% 10609.1 15.3% 117170.6 21.2%2 17363.5 15.5% 8329.1 15.6% 7044.1 14.9% 10076.1 14.6% 75566.5 13.7%3 14959.0 13.4% 7012.3 13.1% 6008.5 12.7% 8573.2 12.4% 49386.3 8.9%4 11871.8 10.6% 5557.4 10.4% 4894.8 10.3% 7256.7 10.5% 32306.2 5.8%5 9412.8 8.4% 4277.1 8.0% 3903.4 8.2% 5826.6 8.4% 21762.9 3.9%6 7114.9 6.4% 3345.0 6.3% 3064.6 6.5% 4664.4 6.7% 13948.1 2.5%
7-8 9413.4 8.4% 4318.9 8.1% 4233.1 8.9% 6455.2 9.3% 14915.7 2.7% 9-10 5009.4 4.5% 2340.2 4.4% 2362.8 5.0% 3410.6 4.9% 6602.1 1.2% 11+ 4814.9 4.3% 2315.9 4.3% 2598.4 5.5% 3435.2 5.0% 5142.2 0.9%
Medical conditions, ever/never$ Obesity 11573.6 10.3% 5056.9 9.5% 5141.6 10.9% 11679.8 16.9% 48928.8 8.8%Smoking 14557.7 13.0% 6139.2 11.5% 6704.6 14.2% 15298.8 22.1% 62401.8 11.3%Diabetes## 7977.5 7.1% 3815.4 7.2% 3994.3 8.4% 9453.1 13.7% 43884.6 7.9%Stroke/TIA 2030.1 1.8% 1031.2 1.9% 1223.7 2.6% 3567.2 5.2% 9753.7 1.8%Hyperlipidemia## 27383.0 24.5% 13050.1 24.5% 12634.5 26.7% 25154.0 36.3% 123171.2 22.3%Congenital heart disorder 391.3 0.3% 211.6 0.4% 235.6 0.5% 659.2 1.0% 2398.9 0.4%Coronary artery anomaly 71.4 0.1% 37.7 0.1% 41.4 0.1% 143.3 0.2% 436.9 0.1%Peripheral vascular disease 1799.6 1.6% 824.4 1.5% 853.6 1.8% 2412.4 3.5% 7911.7 1.4%
Mental health claims, time-varying$$
Major depression 47972.8 42.9% 21403.4 40.1% 18520.8 39.1% 20763.6 30.0% 47844.9 8.6%Bipolar disorder 8743.3 7.8% 3996.7 7.5% 4186.7 8.8% 5318.2 7.7% 5983.9 1.1%Anxiety 21431.1 19.1% 9933.8 18.6% 9338.3 19.7% 11045.9 16.0% 31723.0 5.7%Psychotic disorders 1851.8 1.7% 894.2 1.7% 1177.8 2.5% 2372.0 3.4% 5817.6 1.1%
Other selected medical conditions, time-varying$$
ETOH/substance abuse 5322.3 4.8% 2429.3 4.6% 2778.8 5.9% 3386.6 4.9% 9632.7 1.7%Suicide attempt 452.6 0.4% 238.0 0.4% 290.4 0.6% 371.1 0.5% 894.6 0.2%Injury 21672.6 19.4% 10387.2 19.5% 9599.5 20.3% 13526.7 19.5% 72019.9 13.0%Seizure 2057.1 1.8% 1028.9 1.9% 1187.7 2.5% 2184.8 3.2% 7180.1 1.3%Asthma 8599.7 7.7% 4156.7 7.8% 3752.9 7.9% 5659.8 8.2% 25257.1 4.6%
Use of psychotropic medications, time-varying$$
Antipsychotic, any 5857.9 5.2% 1952.0 3.7% 2138.6 4.5% 4289.4 6.2% 7110.6 1.3%Tricyclic antidepressant 4541.8 4.1% 1702.2 3.2% 1687.3 3.6% 3167.3 4.6% 9677.6 1.7%Antidepressants, other or SSRI/SNRI 44591.7 39.8% 15474.8 29.0% 12654.3 26.7% 18015.7 26.0% 42861.9 7.7%

CONFIDENTIAL July 22, 2011
26
Benzodiazepines 15383.8 13.7% 5507.9 10.3% 5296.3 11.2% 8626.4 12.5% 18860.0 3.4%Lithium 1542.9 1.4% 610.7 1.1% 626.8 1.3% 917.9 1.3% 1517.3 0.3%Modafinil 1183.3 1.1% 657.9 1.2% 899.2 1.9% 1165.3 1.7% 338.0 0.1%Insomnia meds 4124.7 3.7% 1613.2 3.0% 1407.3 3.0% 1765.3 2.6% 3418.6 0.6%Thioridazine 87.3 0.1% 34.9 0.1% 46.4 0.1% 182.6 0.3% 413.6 0.1%Mood stabilizers, w/o seizure 9329.0 8.3% 3305.6 6.2% 3177.9 6.7% 5009.0 7.2% 8018.1 1.4%Clonidine/guanfacine, w/o HT 546.8 0.5% 143.4 0.3% 96.4 0.2% 148.5 0.2% 421.3 0.1%
Use of other selected medications, time-varying$$
Beta-agonist 3268.7 2.9% 1301.8 2.4% 1195.3 2.5% 2215.0 3.2% 9819.4 1.8%Epinephrine 66.5 0.1% 28.0 0.1% 26.4 0.1% 33.9 0.0% 158.8 0.0%Asthma med, other 7344.5 6.6% 2970.9 5.6% 2690.5 5.7% 4359.2 6.3% 20122.6 3.6%Seizure med, any 10524.5 9.4% 3818.3 7.2% 3779.4 8.0% 6350.8 9.2% 12366.8 2.2%Theophylline compounds (asthma med) 277.2 0.2% 137.1 0.3% 150.8 0.3% 453.2 0.7% 1466.8 0.3%COX-2 inhibitors 2324.8 2.1% 938.6 1.8% 825.5 1.7% 1516.3 2.2% 5353.9 1.0%Other drugs to improve blood flow 57.2 0.1% 22.2 0.0% 25.4 0.1% 85.2 0.1% 255.4 0.0%Clonidine 848.0 0.8% 271.6 0.5% 248.7 0.5% 506.8 0.7% 2101.6 0.4%pde5 inhibitors 1279.1 1.1% 406.0 0.8% 325.5 0.7% 471.6 0.7% 2330.7 0.4%Triptans 1341.6 1.2% 505.4 0.9% 411.3 0.9% 536.0 0.8% 1911.2 0.3%Oral contraceptives 7023.6 6.3% 3107.0 5.8% 2410.0 5.1% 2950.1 4.3% 26958.9 4.9%Hormones, menopausal or misc 9139.3 8.2% 3678.6 6.9% 3152.4 6.7% 4954.0 7.2% 28407.3 5.1%
Cardiovascular Risk Score decile 1 11198.1 10.0% 5247.9 9.8% 4873.3 10.3% 7899.3 11.4% 54321.9 9.8%decile 2 24730.8 22.1% 12791.1 24.0% 10605.2 22.4% 14210.3 20.5% 238950.7 43.2%decile 3 14037.0 12.5% 6883.1 12.9% 6012.3 12.7% 8228.9 11.9% 65487.5 11.8%decile 4 12407.0 11.1% 5790.0 10.9% 4884.8 10.3% 6428.5 9.3% 37873.1 6.8%decile 5 11573.0 10.3% 5408.3 10.1% 4513.6 9.5% 5899.6 8.5% 37052.8 6.7%decile 6 10062.8 9.0% 4560.4 8.6% 3946.2 8.3% 5511.7 8.0% 31738.0 5.7%decile 7 8635.6 7.7% 3907.0 7.3% 3577.1 7.6% 5257.1 7.6% 26514.3 4.8%decile 8 7728.7 6.9% 3470.1 6.5% 3265.5 6.9% 5018.3 7.3% 22509.7 4.1%decile 9 6678.3 6.0% 2994.3 5.6% 3011.6 6.4% 5151.1 7.4% 21249.0 3.8%decile 10 4884.2 4.4% 2275.8 4.3% 2643.4 5.6% 5597.5 8.1% 17761.5 3.2%
* Using the stroke model; **At baseline or cohort entry (t0): if ‘on’ at baseline, remains on; if ‘off’ at baseline but goes ‘on’ during follow-up, stays off; # Excluding ADHD visits; *** Excluding ADHD medications; $ Ever/never: once ‘on’ at baseline or during follow-up, remains on ## Including medications; $$ Diagnosis: ‘on’ if any day in prior 365 is ‘on’, else ‘off’; Meds: ‘on’ if has supply on the day, else ‘off’

CONFIDENTIAL July 22, 2011
27
Tables of RRs – for ALL strokes and by subtype Table 2a. Rates of ALL stroke, by use of ADHD medications (n=150,658 total users)
* Adjusted for site, age, se bles) x, calendar year (i.e., matching varia
Medication status
Person- yrs
Number Events
Rate/1,000 person-yrs
Unadjusted RR
95% CI
Adjusted matching variables
RR*
95% CI
Adjusted RR**
95% CI ADHD medication users 281798.7 200 0.71
Current user 111935.5 63 0.56 0.83 0.64 - 1.08 0.96 0.73 - 1.25 0.77 0.59 - 1.02 Indeterminate user 53327.8 31 0.58 0.86 0.59 - 1.24 1.02 0.71 - 1.48 0.82 0.57 - 1.20 Former user 47333.0 39 0.82 1.22 0.87 - 1.69 1.32 0.95 - 1.84 0.99 0.71 - 1.40 Remote user 69202.3 67 0.97 1.43 1.10 - 1.85 1.06 0.82 - 1.38 0.76 0.58 - 1.00
Nonuser 553458.5 375 0.68 1.00 reference 1.00 reference 1.00 reference
**Adjusted for site, age, sex, calendar year, and established stroke risk factors (see Table A-5 for details) This table excludes the two HMORN sites that did not provide data on stroke endpoints. Table 2b. Rates of ALL stroke, by use of ADHD medications (NEW USERS only, n=96,502)
* Adjusted for site, age, se bles) x, calendar year (i.e., matching varia
Medication status
Person- yrs
Number Events
Rate/1,000 person-yrs
Unadjusted RR
95% CI
Adjusted matching variables
RR*
95% CI
Adjusted RR**
95% CI ADHD medication users 174573.5 143 0.82
Current user 54569.3 41 0.75 0.94 0.68 - 1.31 1.12 0.81 - 1.56 0.79 0.56 - 1.12 Indeterminate user 30657.1 20 0.65 0.82 0.52 - 1.29 1.02 0.64 - 1.60 0.71 0.45 - 1.13 Former user 34644.6 26 0.75 0.94 0.63 - 1.41 1.08 0.72 - 1.61 0.74 0.49 - 1.11 Remote user 54702.5 56 1.02 1.28 0.96 - 1.71 1.02 0.76 - 1.36 0.72 0.54 - 0.98
Nonuser 328754.2 262 0.80 1.00 reference 1.00 reference 1.00 reference
**Adjusted for site, age, sex, calendar year, and established stroke risk factors (see Table A-5 for details) This table excludes the two HMORN sites that did not provide data on stroke endpoints.

CONFIDENTIAL July 22, 2011
28
Table 2c. Rates of ISCHEMIC stroke, by use of ADHD medications
* Adjusted for site, age, se bles) x, calendar year (i.e., matching varia
Medication status
Person- yrs
Number Events
Rate/1,000 person-yrs
Unadjusted RR
95% CI
Adjusted matching variables
RR*
95% CI
Adjusted RR**
95% CI ADHD medication users 281798.7 148 0.53
Current user 111935.5 46 0.41 0.86 0.63 - 1.18 1.00 0.73 - 1.37 0.79 0.57 - 1.09 Indeterminate user 53327.8 26 0.49 1.02 0.68 - 1.53 1.24 0.83 - 1.86 0.97 0.64 - 1.47 Former user 47333.0 28 0.59 1.24 0.84 - 1.83 1.37 0.93 - 2.02 1.00 0.67 - 1.48 Remote user 69202.3 48 0.69 1.45 1.07 - 1.98 1.07 0.78 - 1.46 0.72 0.53 - 1.00
Nonuser 553458.5 267 0.48 1.00 reference 1.00 reference 1.00 reference
**Adjusted for site, age, sex, calendar year, and established stroke risk factors (see Table A-5 for details) This table excludes the two HMORN sites that did not provide data on stroke endpoints. Table 2d. Rates of HEMORRHAGIC stroke, by use of ADHD medications
* Adjusted for site, age, se bles) x, calendar year (i.e., matching varia
Medication status
Person- yrs
Number Events
Rate/1,000 person-yrs
Unadjusted RR
95% CI
Adjusted matching variables
RR*
95% CI
Adjusted RR**
95% CI ADHD medication users 281798.7 47 0.17
Current user 111935.5 16 0.14 0.79 0.47 - 1.34 0.88 0.52 - 1.49 0.75 0.43 - 1.31 Indeterminate user 53327.8 5 0.09 0.52 0.21 - 1.27 0.59 0.24 - 1.46 0.51 0.20 - 1.26 Former user 47333.0 9 0.19 1.05 0.53 - 2.08 1.10 0.56 - 2.18 0.91 0.45 - 1.83 Remote user 69202.3 17 0.25 1.36 0.81 - 2.27 1.07 0.63 - 1.79 0.90 0.52 - 1.53
Nonuser 553458.5 101 0.18 1.00 reference 1.00 reference 1.00 reference
**Adjusted for site, age, sex, calendar year, and other established stroke risk factors (see Table A-5 for details) This table excludes the two HMORN sites that did not provide data on stroke endpoints.

CONFIDENTIAL July 22, 2011
29
Table 2e. Rates of ALL stroke (excluding only those adjudicated as non-cases), by use of ADHD medications Medication status
Person- yrs
Number Events
Rate/1,000 person-yrs
Unadjusted RR
95% CI
Adjusted matching variables
RR*
95% CI
Adjusted RR**
95% CI ADHD medication users 281716.6 256 0.91
Current user 111919.3 80 0.71 0.89 0.70 - 1.13 1.04 0.82 - 1.33 0.84 0.66 - 1.08 Indeterminate user 53318.5 45 0.84 1.05 0.78 - 1.43 1.25 0.92 - 1.70 1.00 0.73 - 1.37 Former user 47320.9 46 0.97 1.21 0.90 - 1.64 1.30 0.96 - 1.76 0.96 0.70 - 1.31 Remote user 69157.9 85 1.23 1.54 1.22 - 1.94 1.12 0.89 - 1.42 0.78 0.61 - 0.99
Nonuser 553346.6 443 0.80 1.00 reference 1.00 reference 1.00 reference * Adjusted for site, age, sex, calendar year (i.e., matching variables) **Adjusted for site, age, sex, calendar year, and established stroke risk factors (see Table A-5 for details) This table excludes the two HMORN sites that did not provide data on stroke endpoints.
CONFIDENTIAL July 22, 2011
30
Tables of RRs – current use of specific medications, ALL strokes and by subtype
Table 3a. Rates of ALL stroke, by specific ADHD medication Medication status
Person- yrs
Number Events
Rate/1,000 person-yrs
Unadjusted RR
95% CI
Adjusted matching variables
RR*
95% CI
Adjusted RR**
95% CI Current user 111935.5 63 0.56 0.83 0.64 - 1.08 0.96 0.73 - 1.25 0.77 0.59 - 1.02
Amphetamines 48672.9 19 0.39 0.58 0.36 - 0.91 0.75 0.47 - 1.19 0.63 0.40 - 1.01 Methylphenidate 50332.3 39 0.77 1.14 0.82 - 1.59 1.23 0.88 - 1.71 0.96 0.69 - 1.35 Atomoxetine 8371.1 3 0.36 0.53 0.17 - 1.65 0.58 0.19 - 1.82 0.46 0.15 - 1.44 Pemoline 3030.1 2 0.66 0.97 0.24 - 3.91 0.79 0.20 - 3.16 0.59 0.15 - 2.38 Multiple 1529.2 0 0.00 -- -- -- -- -- --
Nonuser 553458.5 375 0.68 1.00 reference 1.00 reference 1.00 reference * Adjusted for site, age, sex, calendar year (i.e., matching variables) **Adjusted for site, age, sex, calendar year, and other established stroke risk factors (see Table A-5 for details) This table excludes the two HMORN sites that did not provide data on stroke endpoints. Table 3b. Rates of ALL stroke, by specific ADHD medication (NEW USERS ONLY) Medication status
Person- yrs
Number Events
Rate/1,000 person-yrs
Unadjusted RR
95% CI
Adjusted matching variables
RR*
95% CI
Adjusted RR**
95% CI Current user 54569.3 41 0.75 0.94 0.68 - 1.31 1.12 0.81 - 1.56 0.79 0.56 - 1.12
Amphetamines 22965.2 10 0.44 0.55 0.29 - 1.03 0.73 0.39 - 1.38 0.54 0.28 - 1.02 Methylphenidate 23335.7 26 1.11 1.40 0.93 - 2.09 1.56 1.04 - 2.34 1.04 0.69 - 1.58 Atomoxetine 6429.4 3 0.47 0.59 0.19 - 1.83 0.67 0.21 - 2.10 0.51 0.16 - 1.61 Pemoline 1099.7 2 1.82 2.28 0.57 - 9.17 1.51 0.37 - 6.09 1.07 0.27 - 4.35 Multiple 739.3 0 0.00 -- -- -- -- -- --
Nonuser 328754.2 262 0.80 1.00 reference 1.00 reference 1.00 reference * Adjusted for site, age, sex, calendar year (i.e., matching variables) **Adjusted for site, age, sex, calendar year, and established stroke risk factors (see Table A-5 for details) This table excludes the two HMORN sites that did not provide data on stroke endpoints.

CONFIDENTIAL July 22, 2011
31
Table 3c. Rates of ISCHEMIC stroke, by specific ADHD medication Medication status
Person- yrs
Number Events
Rate/1,000 person-yrs
Unadjusted RR
95% CI
Adjusted matching variables
RR*
95% CI
Adjusted RR**
95% CI Current user 111935.5 46 0.41 0.86 0.63 - 1.18 1.00 0.73 - 1.37 0.79 0.57 - 1.09
Amphetamines 48672.9 13 0.27 0.56 0.32 - 0.98 0.74 0.43 - 1.30 0.62 0.35 - 1.09 Methylphenidate 50332.3 29 0.58 1.21 0.82 - 1.77 1.29 0.87 - 1.89 0.98 0.66 - 1.45 Atomoxetine 8371.1 2 0.24 0.50 0.12 - 2.01 0.57 0.14 - 2.29 0.43 0.11 - 1.75 Pemoline 3030.1 2 0.66 1.38 0.34 - 5.56 1.11 0.27 - 4.46 0.80 0.20 - 3.21 Multiple 1529.2 0 0.00 -- -- -- -- -- --
Nonuser 553458.5 267 0.48 1.00 reference 1.00 reference 1.00 reference * Adjusted for site, age, sex, calendar year (i.e., matching variables) **Adjusted for site, age, sex, calendar year, and established stroke risk factors (see Table A-5 for details) This table excludes the two HMORN sites that did not provide data on stroke endpoints. Table 3d. Rates of HEMORRHAGIC stroke, by specific ADHD medication Medication status
Person- yrs
Number Events
Rate/1,000 person-yrs
Unadjusted RR
95% CI
Adjusted matching variables
RR*
95% CI
Adjusted RR**
95% CI Current user 111935.5 16 0.14 0.79 0.47 - 1.34 0.88 0.52 - 1.49 0.75 0.43 - 1.31
Amphetamines 48672.9 6 0.12 0.68 0.30 - 1.55 0.82 0.36 - 1.88 0.72 0.31 - 1.68 Methylphenidate 50332.3 10 0.20 1.10 0.57 - 2.11 1.17 0.61 - 2.26 0.99 0.51 - 1.93 Atomoxetine 8371.1 0 0.00 -- -- -- -- -- -- Pemoline 3030.1 0 0.00 -- -- -- -- -- -- Multiple 1529.2 0 0.00 -- -- -- -- -- --
Nonuser 553458.5 101 0.18 1.00 reference 1.00 reference 1.00 reference * Adjusted for site, age, sex, calendar year (i.e., matching variables) **Adjusted for site, age, sex, calendar year, and established stroke risk factors (see Table A-5 for details) This table excludes the two HMORN sites that did not provide data on stroke endpoints.

CONFIDENTIAL July 22, 2011
32
Table 3e. Rates of ALL stroke (excluding only those adjudicated as non-cases), by specific ADHD medications Medication status
Person- yrs
Number Events
Rate/1,000 person-yrs
Unadjusted RR
95% CI
Adjusted matching variables
RR*
95% CI
Adjusted RR**
95% CI Current user 111919.3 80 0.71 0.89 0.70 - 1.13 1.04 0.82 - 1.33 0.84 0.66 - 1.08
Amphetamines 48667.9 25 0.51 0.64 0.43 - 0.96 0.85 0.57 - 1.27 0.73 0.48 - 1.10 Methylphenidate 50322.2 48 0.95 1.19 0.88 - 1.60 1.30 0.96 - 1.75 1.01 0.74 - 1.37 Atomoxetine 8370.2 3 0.36 0.45 0.14 - 1.39 0.50 0.16 - 1.57 0.40 0.13 - 1.25 Pemoline 3029.9 4 1.32 1.65 0.62 - 4.41 1.28 0.48 - 3.43 0.95 0.35 - 2.54 Multiple 1529.1 0 0.00 -- -- -- -- -- --
Nonuser 553346.6 443 0.80 1.00 reference 1.00 reference 1.00 reference * Adjusted for site, age, sex, calendar year (i.e., matching variables) **Adjusted for site, age, sex, calendar year, and established stroke risk factors (see Table A-5 for details) This table excludes the two HMORN sites that did not provide data on stroke endpoints.

CONFIDENTIAL July 22, 2011
33
Tables of RRs – duration of current use for ALL strokes
Table 4a. Rates of ALL stroke, by use of ADHD medications Medication status
Person- yrs
Number Events
Rate/1,000 person-yrs
Unadjusted RR
95% CI
Adjusted matching variables
RR*
95% CI
Adjusted RR**
95% CI Duration of Current use #
366+ days 51540.0 29 0.56 0.83 0.57 - 1.21 0.88 0.60 - 1.28 0.73 0.49 - 1.07 183-365 days 23938.3 9 0.38 0.55 0.29 - 1.07 0.72 0.37 - 1.39 0.58 0.30 - 1.13 91-182 days 13896.9 12 0.86 1.27 0.72 - 2.26 1.64 0.92 - 2.91 1.29 0.72 - 2.31 31-90 days 11539.6 7 0.61 0.90 0.42 - 1.89 1.16 0.55 - 2.45 0.92 0.43 - 1.95 1-30 days 7898.0 4 0.51 0.75 0.28 - 2.00 0.93 0.35 - 2.49 0.73 0.27 - 1.98
Nonuser 553458.5 375 0.68 1.00 reference 1.00 reference 1.00 reference * Adjusted for site, age, sex, calendar year (i.e., matching variables) **Adjusted for site, age, sex, calendar year, and established stroke risk factors (see Table A-5 for details) # Excludes current pemoline use. This table excludes the two HMORN sites that did not provide data on stroke endpoints. Table 4b. Rates of ALL stroke, by use of ADHD medications (NEW USERS ONLY) Medication status
Person- yrs
Number Events
Rate/1,000 person-yrs
Unadjusted RR
95% CI
Adjusted matching variables
RR*
95% CI
Adjusted RR**
95% CI Duration of Current use #
366+ days 16087.6 16 0.99 1.25 0.75 - 2.07 1.22 0.73 - 2.02 0.89 0.53 - 1.49 183-365 days 11018.6 4 0.36 0.46 0.17 - 1.22 0.57 0.21 - 1.54 0.40 0.15 - 1.08 91-182 days 9398.0 9 0.96 1.20 0.62 - 2.34 1.62 0.83 - 3.16 1.11 0.57 - 2.18 31-90 days 9511.8 6 0.63 0.79 0.35 - 1.78 1.13 0.50 - 2.54 0.78 0.34 - 1.75 1-30 days 7421.0 4 0.54 0.68 0.25 - 1.82 0.95 0.35 - 2.56 0.66 0.24 - 1.78
Nonuser 328754.2 262 0.80 1.00 reference 1.00 reference 1.00 reference * Adjusted for site, age, sex, calendar year (i.e., matching variables) **Adjusted for site, age, sex, calendar year, and established stroke risk factors (see Table A-5 for details) # Excludes current pemoline use. This table excludes the two HMORN sites that did not provide data on stroke endpoints.

CONFIDENTIAL July 22, 2011
34
Tables of RRs – Remote users as reference group (Tables 5 and 6) Table 5a. Rates of ALL stroke, by use of ADHD medications Medication status
Person- yrs
Number Events
Rate/1,000 person-yrs
Unadjusted RR
95% CI
Adjusted matching variables
RR*
95% CI
Adjusted RR**
95% CI Current user 111935.5 63 0.56 0.58 0.41 - 0.82 0.90 0.63 - 1.28 1.02 0.71 - 1.45 Indeterminate user 53327.8 31 0.58 0.60 0.39 - 0.92 0.96 0.63 - 1.48 1.08 0.70 - 1.67 Former user 47333.0 39 0.82 0.85 0.57 - 1.26 1.24 0.83 - 1.85 1.31 0.88 - 1.95 Remote user 69202.3 67 0.97 1.00 reference 1.00 reference 1.00 reference
* Adjusted for site, age, sex, calendar year (i.e., matching variables) **Adjusted for site, age, sex, calendar year, and established stroke risk factors (see Table A-5 for details) This table excludes the two HMORN sites that did not provide data on stroke endpoints. Table 5b. Rates of ALL stroke, by use of ADHD medications (NEW USERS ONLY) Medication status
Person- yrs
Number Events
Rate/1,000 person-yrs
Unadjusted RR
95% CI
Adjusted matching variables
RR*
95% CI
Adjusted RR**
95% CI Current user 54569.3 41 0.75 0.73 0.49 - 1.10 1.10 0.73 - 1.65 1.09 0.73 - 1.65 Indeterminate user 30657.1 20 0.65 0.64 0.38 - 1.06 1.00 0.60 - 1.66 0.99 0.59 - 1.65 Former user 34644.6 26 0.75 0.73 0.46 - 1.17 1.05 0.66 - 1.68 1.02 0.64 - 1.63 Remote user 54702.5 56 1.02 1.00 reference 1.00 reference 1.00 reference
* Adjusted for site, age, sex, calendar year (i.e., matching variables) **Adjusted for site, age, sex, calendar year, and established stroke risk factors (see Table A-5 for details) This table excludes the two HMORN sites that did not provide data on stroke endpoints.

CONFIDENTIAL July 22, 2011
35
Table 6a. Rates of ALL stroke, by specific ADHD medication Medication status
Person- yrs
Number Events
Rate/1,000 person-yrs
Unadjusted RR
95% CI
Adjusted matching variables
RR*
95% CI
Adjusted RR**
95% CI Current user 111935.5 63 0.56 0.58 0.41 - 0.82 0.90 0.63 - 1.28 1.02 0.71 - 1.45
Amphetamines 48672.9 19 0.39 0.40 0.24 - 0.67 0.70 0.42 - 1.18 0.83 0.50 - 1.40 Methylphenidate 50332.3 39 0.77 0.80 0.54 - 1.19 1.15 0.77 - 1.72 1.27 0.85 - 1.90 Atomoxetine 8371.1 3 0.36 0.37 0.12 - 1.18 0.55 0.17 - 1.75 0.60 0.19 - 1.93 Pemoline 3030.1 2 0.66 0.68 0.17 - 2.78 0.74 0.18 - 3.04 0.78 0.19 - 3.19 Multiple 1529.2 0 0.00 -- -- -- -- -- --
Remote user 69202.3 67 0.97 1.00 reference 1.00 reference 1.00 reference * Adjusted for site, age, sex, calendar year (i.e., matching variables) **Adjusted for site, age, sex, calendar year, and established stroke risk factors (see Table A-5 for details) This table excludes the two HMORN sites that did not provide data on stroke endpoints. Table 6b. Rates of ALL stroke, by specific ADHD medication (NEW USERS ONLY) Medication status
Person- yrs
Number Events
Rate/1,000 person-yrs
Unadjusted RR
95% CI
Adjusted matching variables
RR*
95% CI
Adjusted RR**
95% CI Current user 54569.3 41 0.75 0.73 0.49 - 1.10 1.10 0.73 - 1.65 1.09 0.73 - 1.65
Amphetamines 22965.2 10 0.44 0.43 0.22 - 0.83 0.72 0.37 - 1.41 0.74 0.38 - 1.47 Methylphenidate 23335.7 26 1.11 1.09 0.68 - 1.73 1.53 0.96 - 2.45 1.44 0.90 - 2.31 Atomoxetine 6429.4 3 0.47 0.46 0.14 - 1.46 0.66 0.20 - 2.11 0.71 0.22 - 2.27 Pemoline 1099.7 2 1.82 1.78 0.43 - 7.28 1.48 0.36 - 6.08 1.48 0.36 - 6.11 Multiple 739.3 0 0.00 -- -- -- -- -- --
Remote user 54702.5 56 1.02 1.00 reference 1.00 reference 1.00 reference * Adjusted for site, age, sex, calendar year (i.e., matching variables) **Adjusted for site, age, sex, calendar year, and established stroke risk factors (see Table A-5 for details) This table excludes the two HMORN sites that did not provide data on stroke endpoints.

CONFIDENTIAL July 22, 2011
36
Subgroup analyses Table 7a. Rate ratios of ALL stroke, overall and by subgroup Cohort/ subgroup
Person-yrs
Number Events
Rate/1,000 person-yrs
RR**
95% CI
Full cohort 835257.2 575 0.69 Current 111935.5 63 0.56 0.77 0.58 - 1.02 Former* 169863.2 137 0.81 0.83 0.68 - 1.02 Nonuser 553458.5 375 0.68 1.00 reference
No history of CVD^ 590555.2 197 0.33 Current 73971.4 18 0.24 0.64 0.38 - 1.07 Former* 109565.1 36 0.33 0.75 0.51 - 1.12 Nonuser 407018.7 143 0.35 1.00 reference
History of CVD^ 244702.0 378 1.54 Current 37964.1 45 1.19 0.85 0.61 - 1.19 Former* 60298.1 101 1.68 0.89 0.70 - 1.13 Nonuser 146439.8 232 1.58 1.00 reference
History of non-ADHD psychiatric condition 332664.0 309 0.93
Current 82584.4 57 0.69 0.89 0.65 - 1.23 Former* 119457.2 115 0.96 0.93 0.73 - 1.20 Nonuser 130622.4 137 1.05 1.00 reference
No history of non-ADHD psychiatric condition 502593.1 266 0.53
Current 29351.0 6 0.20 0.44 0.19 - 0.99 Former* 50406.0 22 0.44 0.72 0.46 - 1.13 Nonuser 422836.1 238 0.56 1.00 reference
Users with ADHD 629138.7 398 0.63 Current 39770.6 10 0.25 0.45 0.24 - 0.85 Former* 35909.7 13 0.36 0.65 0.37 - 1.15 Nonuser 553458.5 375 0.68 1.00 reference
Users with no ADHD 759576.9 552 0.73 Current 72164.9 53 0.73 0.89 0.66 - 1.20 Former* 133953.5 124 0.93 0.86 0.69 - 1.07 Nonuser 553458.5 375 0.68 1.00 reference
Users with ADHD 236843.7 101 0.43 Current 39770.6 10 0.25 0.48 0.25 - 0.96 Former* 35909.7 13 0.36 0.68 0.37 - 1.26 Nonuser (matched to user) 161163.5 78 0.48 1.00 reference
Users with no ADHD 603338.6 475 0.79 Current 72164.9 53 0.73 0.89 0.65 - 1.21 Former* 133953.5 124 0.93 0.87 0.69 - 1.08 Nonuser (matched to user) 397220.2 298 0.75 1.00 reference
Ages 25-44 423164.3 104 0.25 Current 55964.8 12 0.21 0.74 0.39 - 1.42 Former* 87552.8 26 0.30 0.84 0.52 - 1.37 Nonuser 279646.7 66 0.24 1.00 reference
Ages 45-64 412092.9 471 1.14 Current 55970.7 51 0.91 0.77 0.57 - 1.05 Former* 82310.4 111 1.35 0.83 0.66 - 1.04 Nonuser 273811.8 309 1.13 1.00 reference
* Includes indeterminate, former and remote users **Adjusted for site, age, sex, calendar year, and established stroke risk factors (see Table A-5 for details) ^ Definition of CVD included the following diagnoses/claims and medications within the year prior to baseline: acute myocardial infarction, ischemia, coronary revascularization, CHF, arrhythmia, stroke/TIA,

CONFIDENTIAL July 22, 2011
37
congenital heart disorder, coronary artery anomaly, peripheral vascular disease, hyperlipidemia, hypertension, loop diuretic, digoxin, nitrates, anticoagulant, platelet inhibitor, anti-arrhythmic agents, ACE inhibitor, angiotensin receptor blocker, beta-blocker, calcium-channel blocker, thiazide diuretic, and other antihypertensive drugs.
CONFIDENTIAL July 22, 2011
38
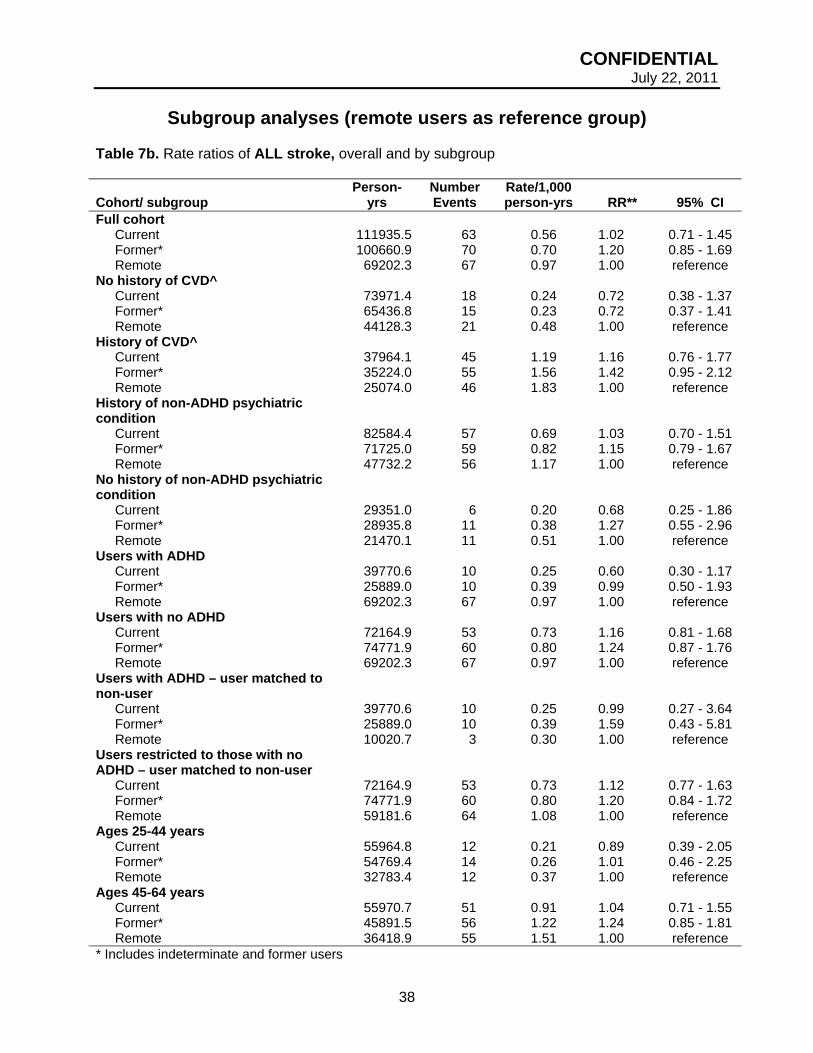
Subgroup analyses (remote users as reference group) Table 7b. Rate ratios of ALL stroke, overall and by subgroup Cohort/ subgroup
Person-yrs
Number Events
Rate/1,000 person-yrs
RR**
95% CI
Full cohort Current 111935.5 63 0.56 1.02 0.71 - 1.45 Former* 100660.9 70 0.70 1.20 0.85 - 1.69 Remote 69202.3 67 0.97 1.00 reference
No history of CVD^ Current 73971.4 18 0.24 0.72 0.38 - 1.37 Former* 65436.8 15 0.23 0.72 0.37 - 1.41 Remote 44128.3 21 0.48 1.00 reference
History of CVD^ Current 37964.1 45 1.19 1.16 0.76 - 1.77 Former* 35224.0 55 1.56 1.42 0.95 - 2.12 Remote 25074.0 46 1.83 1.00 reference
History of non-ADHD psychiatric condition
Current 82584.4 57 0.69 1.03 0.70 - 1.51 Former* 71725.0 59 0.82 1.15 0.79 - 1.67 Remote 47732.2 56 1.17 1.00 reference
No history of non-ADHD psychiatric condition
Current 29351.0 6 0.20 0.68 0.25 - 1.86 Former* 28935.8 11 0.38 1.27 0.55 - 2.96 Remote 21470.1 11 0.51 1.00 reference
Users with ADHD Current 39770.6 10 0.25 0.60 0.30 - 1.17 Former* 25889.0 10 0.39 0.99 0.50 - 1.93 Remote 69202.3 67 0.97 1.00 reference
Users with no ADHD Current 72164.9 53 0.73 1.16 0.81 - 1.68 Former* 74771.9 60 0.80 1.24 0.87 - 1.76 Remote 69202.3 67 0.97 1.00 reference
Users with ADHD – user matched to non-user
Current 39770.6 10 0.25 0.99 0.27 - 3.64 Former* 25889.0 10 0.39 1.59 0.43 - 5.81 Remote 10020.7 3 0.30 1.00 reference
Users restricted to those with no ADHD – user matched to non-user
Current 72164.9 53 0.73 1.12 0.77 - 1.63 Former* 74771.9 60 0.80 1.20 0.84 - 1.72 Remote 59181.6 64 1.08 1.00 reference
Ages 25-44 years Current 55964.8 12 0.21 0.89 0.39 - 2.05 Former* 54769.4 14 0.26 1.01 0.46 - 2.25 Remote 32783.4 12 0.37 1.00 reference
Ages 45-64 years Current 55970.7 51 0.91 1.04 0.71 - 1.55 Former* 45891.5 56 1.22 1.24 0.85 - 1.81 Remote 36418.9 55 1.51 1.00 reference
* Includes indeterminate and former users

CONFIDENTIAL July 22, 2011
39
**Adjusted for site, age, sex, calendar year, and established stroke risk factors (see Table A-5 for details) ^ Definition of CVD included the following diagnoses/claims and medications within the year prior to baseline: acute myocardial infarction, ischemia, coronary revascularization, CHF, arrhythmia, stroke/TIA, congenital heart disorder, coronary artery anomaly, peripheral vascular disease, hyperlipidemia, hypertension, loop diuretic, digoxin, nitrates, anticoagulant, platelet inhibitor, anti-arrhythmic agents, ACE inhibitor, angiotensin receptor blocker, beta-blocker, calcium-channel blocker, thiazide diuretic, and other antihypertensive drugs.

CONFIDENTIAL July 22, 2011
40
Tables of RRs – for MI or SCD or Stroke
Table 8a. Rates of MI or SCD or stroke, by use of ADHD medications
* Adjusted for site, age, se bles) x, calendar year (i.e., matching varia
Medication status
Person- yrs
Number Events
Rate/1,000 person-yrs
Unadjusted RR
95% CI
Adjusted matching variables
RR*
95% CI
Adjusted RR**
95% CI ADHD medication users 272641.8 723 2.65
Current user 107322.4 234 2.18 0.84 0.73 - 0.96 0.97 0.84 - 1.12 0.80 0.69 - 0.92 Indeterminate user 51709.6 125 2.42 0.93 0.77 - 1.11 1.11 0.92 - 1.33 0.90 0.75 - 1.09 Former user 46120.8 121 2.62 1.01 0.84 - 1.21 1.07 0.89 - 1.29 0.83 0.68 - 1.00 Remote user 67489.0 243 3.60 1.38 1.21 - 1.58 1.02 0.88 - 1.17 0.76 0.66 - 0.87
Nonuser 533540.4 1391 2.61 1.00 reference 1.00 reference 1.00 reference
**Adjusted for site, age, sex, calendar year, and established stroke risk factors (see Table A-5 for details) This table excludes the three HMORN sites that did not provide data on SCD or stroke endpoints. Table 8b. Rates of MI or SCD or stroke, by use of ADHD medications (NEW USERS only)
* Adjusted for site, age, se r year (i i es) x, calenda e, match ng variabl
Medication status
Person- yrs
Number Events
Rate/1,000 person-yrs
Unadjusted RR
95% CI
Adjusted matching variables
RR*
95% CI
Adjusted RR**
95% CI ADHD medication users 169013.3 501 2.96
Current user 52094.6 125 2.40 0.80 0.66 - 0.96 0.96 0.80 - 1.16 0.68 0.56 - 0.82 Indeterminate user 29694.2 82 2.76 0.92 0.73 - 1.15 1.14 0.91 - 1.43 0.80 0.63 - 1.01 Former user 33774.3 97 2.87 0.95 0.77 - 1.17 1.08 0.87 - 1.33 0.74 0.60 - 0.91 Remote user 53450.1 197 3.69 1.22 1.05 - 1.43 0.96 0.82 - 1.12 0.72 0.61 - 0.84
Nonuser 317514.4 957 3.01 1.00 reference 1.00 reference 1.00 reference
**Adjusted for site, age, sex, calendar year, and established stroke risk factors (see Table A-5 for details) This table excludes the three HMORN sites that did not provide data on SCD or stroke endpoints.

CONFIDENTIAL July 22, 2011
41
Tables of RRs – for MI or SCD or Stroke (remote users as reference group)
Table 9a. Rates of MI or SCD or stroke, by use of ADHD medications
* Adjusted for site, age, sex, calendar year (i i es) e, match ng variabl
Medication status
Person- yrs
Number Events
Rate/1,000 person-yrs
Unadjusted RR
95% CI
Adjusted matching variables
RR*
95% CI
Adjusted RR**
95% CI Current user 107322.4 234 2.18 0.61 0.51 - 0.72 0.96 0.80 - 1.15 1.05 0.87 - 1.26 Indeterminate user 51709.6 125 2.42 0.67 0.54 - 0.83 1.09 0.88 - 1.35 1.19 0.95 - 1.48 Former user 46120.8 121 2.62 0.73 0.59 - 0.91 1.06 0.85 - 1.32 1.09 0.87 - 1.36 Remote user 67489.0 243 3.60 1.00 reference 1.00 reference 1.00 reference
**Adjusted for site, age, sex, calendar year, and other established stroke risk factors (see Table A-5 for details) This table excludes the three HMORN sites that did not provide data on SCD or stroke endpoints. Table 9b. Rates of MI or SCD or stroke, by use of ADHD medications (NEW USERS only)
* Adjusted for site, age, sex, calendar year (i i es) e, match ng variabl
Medication status
Person- yrs
Number Events
Rate/1,000 person-yrs
Unadjusted RR
95% CI
Adjusted matching variables
RR*
95% CI
Adjusted RR**
95% CI Current user 52094.6 125 2.40 0.65 0.52 - 0.81 1.00 0.80 - 1.26 0.94 0.75 - 1.18 Indeterminate user 29694.2 82 2.76 0.75 0.58 - 0.97 1.19 0.92 - 1.55 1.11 0.86 - 1.44 Former user 33774.3 97 2.87 0.78 0.61 - 0.99 1.13 0.88 - 1.44 1.03 0.80 - 1.31 Remote user 53450.1 197 3.69 1.00 reference 1.00 reference 1.00 reference
**Adjusted for site, age, sex, calendar year, and established stroke risk factors (see Table A-5 for details) This table excludes the three HMORN sites that did not provide data on SCD or stroke endpoints.

CONFIDENTIAL July 22, 2011
42
Appendices
Table A-1. Case identification and adjudication by outcome Stroke N % Total potential cases* 980 100 % Electronic diagnosis/claims 954 NDI search 13 Both electronic record and NDI search 13 Records requested 980 100 % Records received# 911 93 % Confirmed by records a 451 50 % Not confirmed by records a 460 50 % Inadequate information b 179 39 % Evaluated and ruled out b 281 61 % * Cases identified from electronic diagnosis/claims and National Death Index searches. # Received includes ED records, inpatient records, autopsy records, and death certificates. a Percent of records received b Percent of records not confirmed

CONFIDENTIAL July 22, 2011
43
Figure A-1: STROKE Case Review Status, All sites
Note: Groups 2, 3 and 6 constitute analytic cases, groups 1 and 5 did not meet the stroke algorithm.
Possible Cases for Review (n= 980)
*Reasons for cases not being confirmed (Adjudication status=4) Reason for exclusion Count All 281 Carotid endarterectomy/ other procedure for stenosis 97 Transient ischemic attack (TIA), other transient symptoms (< 24 hours) 43 Old stroke/CVA (i.e., before t0) 22 Other head/brain condition/procedure 17 Trauma /injury 17 Syncope, fainting, dizziness, seizure 16 Negative imaging (by MRI) 15 Complications (including stroke) from surgery/procedure 14 Non- neurologic /non-brain/ non-vascular condition 11 Fever, infection 7 Other procedure (non-head/brain/neck) 6 Psychiatric or dementia, headache 6 Stenosis 5 Subdural hemorrhage 3 Vasculitis 2
Confirmed
(n=451) 3
Not confirmed*
(n=281)
4
Does not meet Stroke algorithm
(n=25) 5
Meets Stroke algorithm
(n=44) 6
Not Received (n=69; 7%)
Received (n=911; 93%)
Sufficient information
(n=732)
Insufficient information
(n=179)
Does not meet Stroke
algorithm (n=99) 1
Meets Stroke algorithm
(n=80) 2

CONFIDENTIAL July 22, 2011
44
Table A-2a. Rates of strokes by site (standardized to age and gender-distribution of all sites combined)
*These sites did not contribute to the stroke endpoint.
Site
Person-yrs
Number events
Rate/1,000 person-yrs
Ingenix/I3 390461.8 168 0.50 KPNC 98921.4 71 0.61 KPSC 34316.0 29 0.77 Tennessee Medicaid 122570.1 210 1.82 HMORN 188987.9 97 Fallon Community* -- -- -- Group Health 42769.7 23 0.47 Harvard Pilgrim 67310.0 22 0.29 HealthPartners 32126.2 25 0.75 KP Colorado 19853.5 13 0.47 KP Mid-Atlantic* -- -- -- KP Northwest 26928.4 14 0.41
Table A-2b. Rates of strokes by site (standardized to age and gender-distribution of all sites combined, NEW USERs only)
*These sites did not contribute to the stroke endpoint.
Site
Person-yrs
Number events
Rate/1,000 person-yrs
Ingenix/I3 218434.3 93 0.50 KPNC 54755.5 45 0.70 KPSC 19179.2 17 0.88 Tennessee Medicaid 115848.5 202 1.80 HMORN 95110.2 48 Fallon Community* -- -- -- Group Health 22128.7 10 0.46 Harvard Pilgrim 30964.0 12 0.37 HealthPartners 16477.9 15 0.91 KP Colorado 10131.1 5 0.35 KP Mid-Atlantic* -- -- -- KP Northwest 15408.6 6 0.29

CONFIDENTIAL July 22, 2011
45
Table A-3. Characteristics of study cohort at baseline, by site
I3*
KPNC*
KPSC*
HMORN* Tennessee Medicaid*
Characteristics N=266,787 N=36,450 N=19,947 N=80,351 N=43,371 Demographics
Median age (years) 41 44 45 43 39 Male gender (%) 47.7% 46.3% 47.3% 46.2% 34.0%Medicaid enrollment (%) -- 1.2% 0.9% -- 100.0%
Exposure Nonusers (N) 177,638 24,289 13,295 49,626 28,901Current users (N) 88,868 12,150 6,652 30,725 14,470New users (N) 52,665 7,899 4,350 18,001 13,956
Cardiovascular disease within past year
Acute MI 0.2% 0.1% 0.2% 0.2% 0.5%Ischemia 2.3% 1.1% 1.4% 1.7% 6.5%Coronary revascularization 0.2% 0.1% 0.1% 0.1% 0.5%CHF 0.4% 0.3% 0.4% 0.3% 3.1%Arrhythmia 1.9% 0.6% 1.0% 1.7% 3.9%Stroke/TIA 0.7% 0.3% 0.5% 0.6% 2.8%Congenital heart disorder 0.2% 0.1% 0.1% 0.2% 0.4%Coronary artery anomaly 0.0% 0.0% 0.0% 0.0% 0.1%Peripheral vascular disease 0.5% 0.3% 0.3% 0.5% 2.0%Hypertension 13.2% 10.0% 11.3% 10.8% 27.1%Hyperlipidemia** 16.5% 9.4% 15.0% 13.9% 22.2%
Mental health claims within past year
ADHD 9.6% 15.2% 14.9% 14.1% 3.1%Major depression 15.9% 21.6% 20.2% 23.1% 27.4%Bipolar disorder 2.2% 3.2% 3.0% 3.0% 8.9%Anxiety 8.7% 11.0% 10.8% 11.1% 18.3%Psychotic disorders 0.4% 0.8% 0.9% 0.6% 5.3%
Other selected medical conditions within past year
Diabetes** 4.6% 5.2% 6.3% 4.6% 13.1%Obesity 2.6% 17.6% 5.9% 4.3% 6.1%Smoking 3.6% 10.9% 2.9% 6.9% 15.4%ETOH/substance abuse 1.6% 4.5% 3.4% 2.7% 8.9%Suicide attempt 0.2% 0.1% 0.2% 0.2% 1.2%Injury 14.0% 15.0% 13.6% 14.9% 24.9%Seizure 0.9% 0.6% 0.6% 0.9% 5.7%Asthma 4.8% 5.9% 4.3% 5.4% 9.4%
Use of cardiovascular drug within past year
Loop diuretic 1.4% 1.2% 1.3% 1.1% 9.1%Digoxin 0.2% 0.3% 0.4% 0.3% 1.6%Nitrates 0.7% 1.0% 1.1% 1.0% 4.7%Anticoagulant 0.6% 0.6% 2.9% 0.8% 2.6%Platelet inhibitor 0.5% 0.3% 0.4% 0.3% 2.2%Anti-arrhythmic agents 0.1% 0.1% 0.2% 0.6% 0.5%ACE inhibitor 5.9% 6.0% 8.0% 5.9% 14.3%Angiotensin receptor blocker 2.5% 0.7% 1.1% 0.9% 4.0%Beta- blocker 5.9% 7.5% 8.4% 7.3% 13.0%Calcium-channel blocker 3.9% 3.0% 3.0% 3.0% 11.1%Thiazide diuretic 7.0% 7.3% 8.5% 6.2% 10.6%Other antihypertensive 0.7% 1.0% 1.5% 0.7% 1.9%

CONFIDENTIAL July 22, 2011
46
Use of psychotropic medications within past year
Antipsychotic, any 2.6% 4.3% 4.5% 4.0% 17.0%Tricyclic antidepressant 3.5% 6.0% 5.5% 5.9% 16.0%Antidepressants, other or SSRI/SNRI 22.3% 28.2% 27.6% 31.8% 41.2%Benzodiazepines 14.3% 12.9% 14.1% 14.1% 29.4%Lithium 0.8% 1.4% 0.9% 1.2% 3.1%Modafinil 1.1% 0.6% 1.6% 0.9% 1.8%Insomnia meds 5.7% 1.7% 1.7% 2.5% 9.0%Thioridazine 0.0% 0.1% 0.1% 0.1% 0.9%Mood stabilizers, w/o seizure 5.6% 6.3% 5.7% 6.4% 17.4%Clonidine/guanfacine, w/o HT 0.5% 0.4% 0.5% 0.6% 1.5%
Use of other selected medications within past year
Beta-agonist 6.7% 11.0% 10.0% 9.5% 19.1%Epinephrine 0.5% 0.4% 0.4% 0.8% 0.8%Asthma med, other 18.3% 10.8% 11.8% 21.3% 29.2%Seizure med, any 6.1% 6.7% 6.1% 6.8% 21.3%Theophylline compounds 0.2% 0.3% 0.2% 0.3% 2.7%COX-2 inhibitors 5.9% 0.8% 1.0% 1.2% 10.3%Other drugs to improve blood flow 0.1% 0.1% 0.0% 0.1% 0.4%Clonidine 0.6% 0.7% 0.9% 0.8% 3.7%pde5 inhibitors 2.3% 3.0% 3.7% 1.9% 0.5%Triptans 2.8% 2.5% 2.7% 2.4% 3.9%Oral contraceptives 10.3% 9.8% 10.3% 11.7% 10.7%Hormones, menopausal or misc 8.6% 10.4% 9.4% 9.6% 11.7%
Utilization within past year Cardiovascular visits Emergency, 1+ 1.4% 2.3% 2.2% 3.2% 13.6% Inpatient, 1+ 2.0% 1.7% 3.1% 2.3% 11.1% Physician, 1-4 25.2% 18.7% 19.4% 22.9% 29.0% Physician, 5+ 6.6% 2.1% 2.4% 4.9% 18.9%Psychiatric visits# Emergency, 1+ 0.6% 1.0% 0.9% 1.7% 9.0% Inpatient, 1+ 1.6% 1.7% 2.3% 2.0% 10.7% Physician, 1-4 14.0% 18.2% 19.0% 17.3% 19.8% Physician, 5+ 9.4% 10.5% 8.8% 13.6% 22.5%Other visits Emergency, 1+ 2.0% 2.7% 2.8% 4.2% 16.9% Inpatient, 1+ 1.6% 1.9% 3.1% 1.9% 9.9% Physician, 1+ 25.9% 34.1% 22.9% 25.9% 40.9%No. of different medications*** 1 19.9% 21.1% 20.7% 19.8% 10.8% 2+ 47.8% 47.2% 47.9% 50.3% 72.0%
*Numbers are for membership periods at baseline or cohort entry (t0). ** Including medications # Excluding ADHD visits *** Excluding ADHD medications

CONFIDENTIAL July 22, 2011
47
Tables to examine heterogeneity of RRs by site
Table A-4a. Rate ratios of ALL stroke by site Medication status
I3
RR 95% CI
KPNC
RR 95% CI
KPSC
RR 95% CI
Tennessee Medicaid
RR 95% CI ADHD medication users
Current user 0.68 0.41 - 1.14 0.53 0.23 - 1.23 1.07 0.39 - 2.99 1.23 0.76 - 2.00 Indeterminate user 0.87 0.47 - 1.59 1.03 0.39 - 2.69 1.04 0.23 - 4.81 0.54 0.22 - 1.32 Former user 1.03 0.57 - 1.87 1.03 0.39 - 2.72 1.53 0.41 - 5.66 0.96 0.54 - 1.72 Remote user 0.44 0.21 - 0.92 0.59 0.24 - 1.46 1.95 0.52 - 7.26 0.88 0.61 - 1.26
Nonuser 1.00 reference 1.00 reference 1.00 reference 1.00 reference Adjusted for age, sex, calendar year, and other variables in Table A-5 (some variables are time-varying) Table A-4b. Rate ratios of ALL stroke by site (NEW USERs only) Medication status
I3
RR 95% CI
KPNC
RR 95% CI
KPSC
RR 95% CI
Tennessee Medicaid
RR 95% CI ADHD medication users
Current user 0.55 0.24 - 1.22 0.81 0.29 - 2.27 0.82 0.20 - 3.45 1.31 0.80 - 2.14 Indeterminate user 0.71 0.30 - 1.67 1.50 0.49 - 4.61 0.66 0.08 - 5.61 0.57 0.23 - 1.40 Former user 0.69 0.31 - 1.54 1.01 0.29 - 3.55 1.10 0.21 - 5.70 0.92 0.50 - 1.68 Remote user 0.14 0.03 - 0.57 0.70 0.23 - 2.14 2.33 0.54 - 10.1 0.89 0.62 - 1.29
Nonuser 1.00 reference 1.00 reference 1.00 reference 1.00 reference Adjusted for age, sex, calendar year, and other variables in Table A-5 (some variables are time-varying)

CONFIDENTIAL July 22, 2011
48
Table A-5. Rate ratios of ALL stroke – standard adjustment
Variable in model Person-
yrs Number Events
Rate/1,000 person-yrs
RR* 95% CI
Exposure Amphetamines 48672.9 19 0.39 0.63 0.40-1.01 Methylphenidate 50332.3 39 0.77 0.96 0.69-1.35 Atomoxetine 8371.1 3 0.36 0.46 0.15-1.44 Pemoline 3030.1 2 0.66 0.59 0.15-2.38 Multiple 1529.2 0 0.00 0.00 -- Indeterminate 53327.8 31 0.58 0.82 0.57-1.20 Former 47333.0 39 0.82 0.99 0.71-1.39 Remote 69202.3 67 0.97 0.76 0.58-1.00 Non-user 553458.5 375 0.68 1.00 reference
Demographics Gender
Male 382804.1 274 0.72 1.30 1.08-1.56 Female 452453.1 301 0.67 1.00 reference
Age 25-29 55385.2 3 0.05 0.05 0.01-0.15 30-34 97070.3 22 0.23 0.18 0.11-0.30 35-39 120613.6 27 0.22 0.17 0.11-0.27 40-44 150095.3 52 0.35 0.25 0.18-0.36 45-49 156251.2 92 0.59 0.39 0.29-0.52 50-54 129590.9 125 0.96 0.55 0.43-0.72 55-59 83875.8 129 1.54 0.72 0.56-0.92 60-64 42375.0 125 2.95 1.00 reference
Site KPNC 98921.4 71 0.72 1.33 1.00-1.79 KPSC 34316.0 29 0.85 1.45 0.97-2.17 Tennessee Medicaid 122570.1 210 1.71 1.76 1.39-2.23 HMORN
Group Health 42769.7 23 0.54 0.99 0.63-1.54 Harvard Pilgrim 67310.0 22 0.33 0.63 0.40-0.99 HealthPartners 32126.2 25 0.78 1.63 1.07-2.49 KP Colorado 19853.5 13 0.65 1.10 0.62-1.96
KP Northwest 26928.4 14 0.52 0.88 0.51-1.52 Ingenix/I3 390461.8 168 0.43 1.00 reference
Year 2004-2005 375280.3 242 0.64 1.46 0.53-3.97 2002-2003 237850.0 166 0.70 1.67 0.61-4.58 2000-2001 143704.8 81 0.56 1.41 0.51-3.89 1993-1999 73189.4 82 1.12 2.23 0.81-6.12 1986-1992 5232.7 4 0.76 1.00 reference
Cardiovascular disease in 365 days prior to baseline**
Acute MI, primary 858.9 3 3.49 0.85 0.27-2.70 Acute MI, other 1047.8 6 5.73 1.58 0.70-3.60 Hypertension 109604.2 233 2.13 1.50 1.22-1.84
Use of cardiovascular drug in 365 days prior to baseline **
Anticoagulant 7378.3 46 6.23 2.15 1.55-2.99 Platelet inhibitor 4186.9 31 7.40 1.32 0.88-1.97

CONFIDENTIAL July 22, 2011
49
*RRs adjusted for site, age, sex, calendar year, exposure, and each of the other variables in the table
Medication utilization in 365 days prior to baseline **
No. of different medications*** 1 161573.7 59 0.37 1.08 0.77-1.51 2 118379.3 60 0.51 1.27 0.90-1.79 3 85939.2 51 0.59 1.23 0.86-1.78 4 61886.9 53 0.86 1.53 1.05-2.21 5 45182.9 46 1.02 1.52 1.03-2.25 6 32137.0 44 1.37 1.84 1.23-2.76 7-8 39336.1 82 2.08 2.21 1.53-3.18 9-10 19725.1 41 2.08 1.71 1.10-2.66 11+ 18306.6 59 3.22 1.78 1.14-2.78
Medical conditions, ever/never$ Obesity 82380.8 112 1.36 1.13 0.90-1.41 Smoking 105102.2 154 1.47 1.19 0.97-1.46 Diabetes## 69124.9 195 2.82 1.96 1.60-2.41 TIA, primary 2860.5 40 13.98 1.92 1.33-2.78 TIA, other 16577.4 126 7.60 3.45 2.69-4.44 Hyperlipidemia## 201392.8 289 1.44 0.96 0.78-1.17 Peripheral vascular disease 13801.6 57 4.13 1.11 0.82-1.51
Other selected medical conditions, time-varying$$
ETOH/substance abuse, primary 3698.8 4 1.08 1.11 0.41-2.99 ETOH/substance abuse, other 19850.9 29 1.46 1.49 1.01-2.19
Use of other selected medications, time-varying$$
Triptans 4705.5 5 1.06 1.67 0.69-4.06 Oral contraceptives 42449.6 27 0.64 1.58 1.06-2.36 Hormones, menopausal 49331.7 63 1.28 1.04 0.78-1.39
**At baseline or cohort entry (t0): if ‘on’ at baseline, remains on; if ‘off’ at baseline but goes ‘on’ during follow-up, stays off *** Excluding ADHD medications $ Ever/never: once ‘on’ at baseline or during follow-up, remains on ## Including medications $$ Diagnosis: ‘on’ if any day in prior 365 is ‘on’, else ‘off’; Meds: ‘on’ if has supply on the day, else ‘off’ *RRs adjusted for all other variables in the table; All variables except the utilization variable, no. of different medications, are must-haves. Only the utilization variable earned its way in using the 10% change in RR rule.

CONFIDENTIAL July 22, 2011
50
Comparison of RRs by Adjustment Method Table A-6a. RR of ALL Strokes, by use of ADHD Medications
Adjusted Adjusted Adjusted Unadjusted (matching variables) Adjusted (standard) (Propensity Score) (Stroke Risk Score) Current User 0.83 0.64 - 1.08 0.96 0.73 - 1.25 0.77 0.59 - 1.02 0.75 0.55 - 1.00 0.76 0.58 - 1.00 Indeterminate 0.86 0.59 - 1.24 1.02 0.71 - 1.48 0.82 0.57 - 1.20 0.81 0.55 - 1.19 0.83 0.57 - 1.19 Former 1.22 0.87 - 1.69 1.32 0.95 - 1.84 0.99 0.71 - 1.40 1.05 0.74 - 1.49 1.01 0.73 - 1.41 Remote 1.43 1.10 - 1.85 1.06 0.82 - 1.38 0.76 0.58 - 1.00 0.88 0.66 - 1.17 0.82 0.63 - 1.07 Nonuser 1.00 reference 1.00 reference 1.00 reference 1.00 reference 1.00 reference Table A-6b. RR of ALL Strokes, by use of ADHD Medications (NEW USERS only)
Adjusted Adjusted Adjusted Unadjusted (matching variables) Adjusted (standard) (Propensity Score) (Stroke Risk Score) Current User 0.94 0.68 - 1.31 1.12 0.81 - 1.56 0.79 0.56 - 1.12 0.89 0.61 - 1.28 0.87 0.62 - 1.21 Indeterminate 0.82 0.52 - 1.29 1.02 0.64 - 1.60 0.71 0.45 - 1.13 0.82 0.51 - 1.33 0.80 0.50 - 1.26 Former 0.94 0.63 - 1.41 1.08 0.72 - 1.61 0.74 0.49 - 1.11 0.88 0.57 - 1.35 0.83 0.55 - 1.24 Remote 1.28 0.96 - 1.71 1.02 0.76 - 1.36 0.72 0.54 - 0.98 0.86 0.63 - 1.18 0.80 0.59 - 1.07 Nonuser 1.00 reference 1.00 reference 1.00 reference 1.00 reference 1.00 reference

CONFIDENTIAL July 22, 2011
Comparison of RRs by Adjustment Method
For analyses with Composite Endpoint: Stroke, MI or SCD Table A-7a. RR of ALL MI or SCD or Strokes, by use of ADHD Medications
51
Adjusted Adjusted Adjusted Adjusted Unadjusted (matching variables) (standard) (Propensity Score) (Stroke Risk Score) Current User 0.84 0.73 - 0.96 0.97 0.84 - 1.12 0.80 0.69 - 0.92 0.81 0.69 - 0.94 0.83 0.72 - 0.96 Indeterminate 0.93 0.77 - 1.11 1.11 0.92 - 1.33 0.90 0.75 - 1.09 0.93 0.77 - 1.13 0.94 0.78 - 1.13 Former 1.01 0.84 - 1.21 1.07 0.89 - 1.29 0.83 0.68 - 1.00 0.91 0.75 - 1.10 0.86 0.72 - 1.04 Remote 1.38 1.21 - 1.58 1.02 0.88 - 1.17 0.76 0.66 - 0.87 0.88 0.76 - 1.01 0.81 0.70 - 0.93 Nonuser 1.00 reference 1.00 reference 1.00 reference 1.00 reference 1.00 reference Table A-7b. RR of ALL MI or SCD or Strokes, by use of ADHD Medications (NEW USERS only)
Unadjusted Adjusted
(matching variables) Adjusted
(standard) Adjusted
(Propensity Score) Adjusted
(Stroke Risk Score) Current User 0.80 0.66 - 0.96 0.96 0.80 - 1.16 0.68 0.56 - 0.82 0.77 0.63 - 0.94 0.77 0.64 - 0.93 Indeterminate 0.92 0.73 - 1.15 1.14 0.91 - 1.43 0.80 0.63 - 1.01 0.94 0.74 - 1.19 0.92 0.73 - 1.16 Former 0.95 0.77 - 1.17 1.08 0.87 - 1.33 0.74 0.60 - 0.91 0.89 0.72 - 1.11 0.84 0.68 - 1.03 Remote 1.22 1.05 - 1.43 0.96 0.82 - 1.12 0.72 0.61 - 0.84 0.81 0.68 - 0.95 0.76 0.65 - 0.88 Nonuser 1.00 reference 1.00 reference 1.00 reference 1.00 reference 1.00 reference

CONFIDENTIAL July 22, 2011
52
Reference List
(1) Nissen SE. ADHD drugs and cardiovascular risk. N Engl J Med. 2006;354:1445-1448.
(2) Food and Drug Administration. Drug Safety and Risk Management Advisory Committee
Meeting. Food and Drug Administration . 2006.
Ref Type: Electronic Citation
(3) Challman TD, Lipsky JJ. Methylphenidate: its pharmacology and uses. Mayo Clin Proc.
2000;75:711-721.
(4) Auger RR, Goodman SH, Silber MH, Krahn LE, Pankratz VS, Slocumb NL. Risks of
high-dose stimulants in the treatment of disorders of excessive somnolence: a case-
control study. Sleep. 2005;28:667-672.
(5) Leddy JJ, Epstein LH, Jaroni JL et al. Influence of methylphenidate on eating in obese
men. Obes Res. 2004;12:224-232.
(6) Frierson RL, Wey JJ, Tabler JB. Psychostimulants for depression in the medically ill. Am
Fam Physician. 1991;43:163-170.
(7) Rosenberg PB, Ahmed I, Hurwitz S. Methylphenidate in depressed medically ill patients.
J Clin Psychiatry. 1991;52:263-267.
(8) Tharwani HM, Yerramsetty P, Mannelli P, Patkar A, Masand P. Recent advances in
poststroke depression. Curr Psychiatry Rep. 2007;9:225-231.

CONFIDENTIAL July 22, 2011
53
(9) Zorowitz RD, Smout RJ, Gassaway JA, Horn SD. Neurostimulant medication usage
during stroke rehabilitation: the Post-Stroke Rehabilitation Outcomes Project (PSROP).
Top Stroke Rehabil. 2005;12:28-36.
(10) Warden DL, Gordon B, McAllister TW et al. Guidelines for the pharmacologic treatment
of neurobehavioral sequelae of traumatic brain injury. J Neurotrauma. 2006;23:1468-
1501.
(11) Vitiello B. Understanding the risk of using medications for attention deficit hyperactivity
disorder with respect to physical growth and cardiovascular function. Child Adolesc
Psychiatr Clin N Am. 2008;17:459-74, xi.
(12) Wilens TE, Hammerness PG, Biederman J et al. Blood pressure changes associated
with medication treatment of adults with attention-deficit/hyperactivity disorder. J Clin
Psychiatry. 2005;66:253-259.
(13) Wernicke JF, Faries D, Girod D et al. Cardiovascular effects of atomoxetine in children,
adolescents, and adults. Drug Saf. 2003;26:729-740.
(14) Lewington S, Clarke R, Qizilbash N, Peto R, Collins R. Age-specific relevance of usual
blood pressure to vascular mortality: a meta-analysis of individual data for one million
adults in 61 prospective studies. Lancet. 2002;360:1903-1913.
(15) Gould MS, Walsh BT, Munfakh JL et al. Sudden death and use of stimulant medications
in youths. Am J Psychiatry. 2009;166:992-1001.

CONFIDENTIAL July 22, 2011
54
(16) Winterstein AG, Gerhard T, Shuster J, Johnson M, Zito JM, Saidi A. Cardiac safety of
central nervous system stimulants in children and adolescents with attention-
deficit/hyperactivity disorder. Pediatrics. 2007;120:e1494-e1501.
(17) Schelleman H, Bilker WB, Strom BL et al. Cardiovascular events and death in children
exposed and unexposed to ADHD agents. Pediatrics. 2011;127:1102-1110.
(18) Winterstein AG, Gerhard T, Shuster J, Saidi A. Cardiac safety of methylphenidate versus
amphetamine salts in the treatment of ADHD. Pediatrics. 2009;124:e75-e80.
(19) Holick CN, Turnbull BR, Jones ME, Chaudhry S, Bangs ME, Seeger JD. Atomoxetine
and cerebrovascular outcomes in adults. J Clin Psychopharmacol. 2009;29:453-460.
(20) McCarthy S, Cranswick N, Potts L, Taylor E, Wong IC. Mortality associated with
attention-deficit hyperactivity disorder (ADHD) drug treatment: a retrospective cohort
study of children, adolescents and young adults using the general practice research
database. Drug Saf. 2009;32:1089-1096.
(21) Suissa S, Edwardes MD. Adjusted odds ratios for case-control studies with missing
confounder data in controls. Epidemiology. 1997;8:275-280.
(22) Schneeweiss S. Sensitivity analysis and external adjustment for unmeasured
confounders in epidemiologic database studies of therapeutics. Pharmacoepidemiol
Drug Saf. 2006;15:291-303.

CONFIDENTIAL July 22, 2011
55
(23) Schneeweiss S, Glynn RJ, Tsai EH, Avorn J, Solomon DH. Adjusting for unmeasured
confounders in pharmacoepidemiologic claims data using external information: the
example of COX2 inhibitors and myocardial infarction. Epidemiology. 2005;16:17-24.
(24) Ray WA. Evaluating medication effects outside of clinical trials: new-user designs. Am J
Epidemiol. 2003;158:915-920.