Final presentation
13
CARBONACEOUS AEROSOLS PRAVEEN KUMAR MISHRA Department Of Geology Banaras Hindu University
-
Upload
praveen-mishra -
Category
Technology
-
view
68 -
download
0
Transcript of Final presentation
CARBONACEOUS AEROSOLS
PRAVEEN KUMAR MISHRADepartment Of Geology
Banaras Hindu University
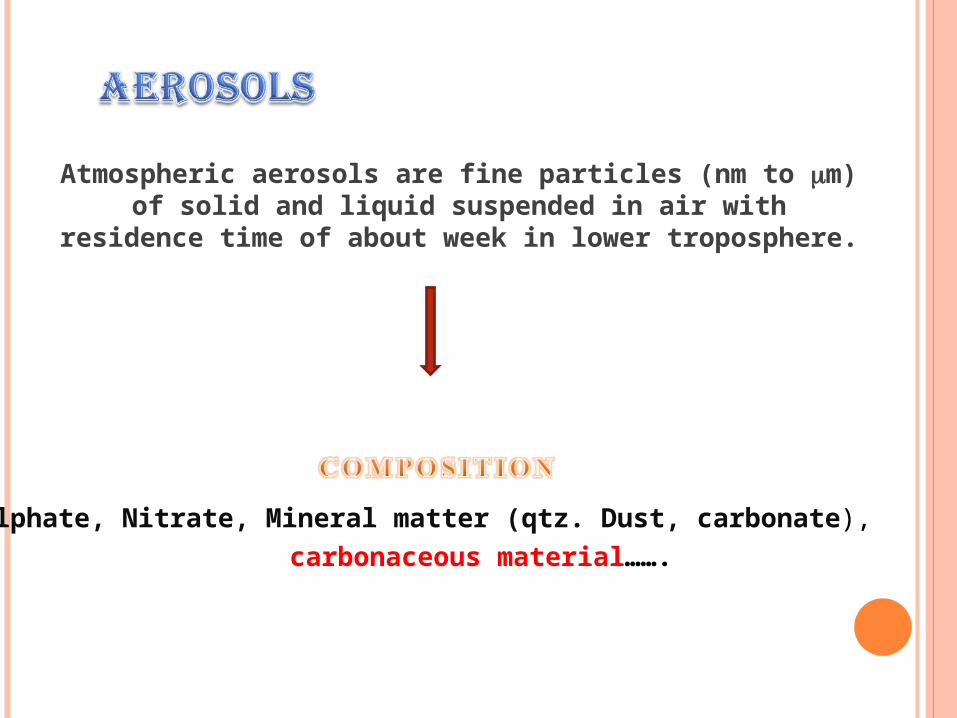
Atmospheric aerosols are fine particles (nm to m) of solid and liquid suspended in air with residence time of about week in lower
troposphere.
Sulphate, Nitrate, Mineral matter (qtz. Dust, carbonate),
carbonaceous material…….

CARBONACEOUS AEROSOLS
ORIGIN
PRIMARY SOURCES SECONDARY SOURCES
Natural AnthropogenicGPC
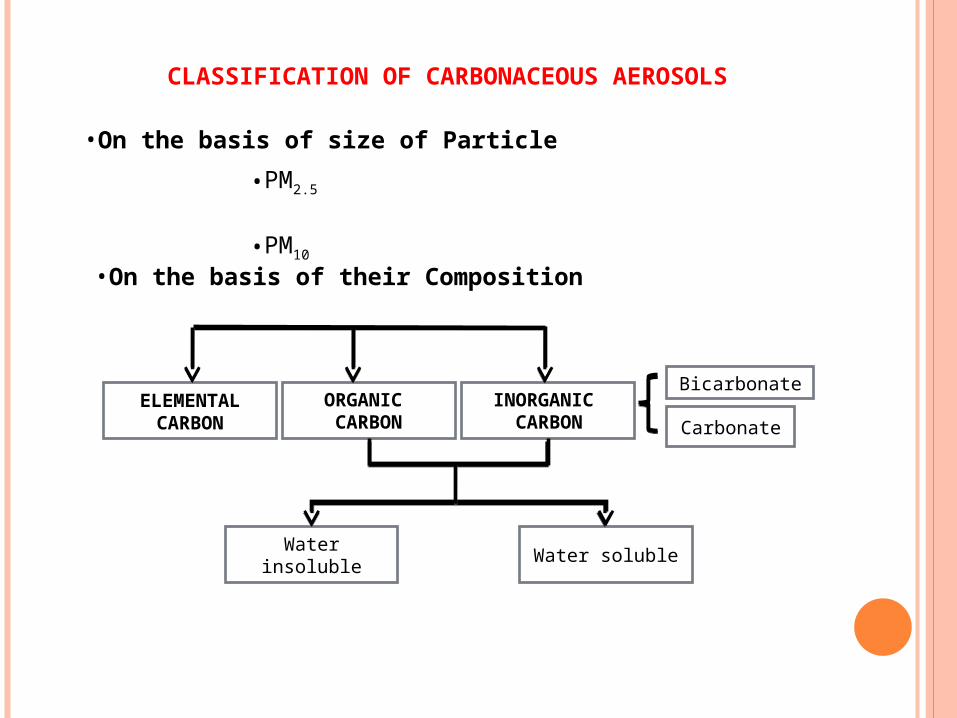
CLASSIFICATION OF CARBONACEOUS AEROSOLS
ELEMENTAL CARBON Carbonate
Bicarbonate
Water solubleWater insoluble
INORGANIC CARBON
ORGANIC CARBON
•On the basis of size of Particle
•PM2.5
•PM10
•On the basis of their Composition

EC-OC Analyzer TOC Analyzer

EC-OC ANALYZER
•Based on thermal and optical property of material.
• EC: those fraction of carbon which are volatilise at >550°C temperature in presence of oxygen.
•OC: fraction of carbon which are volatilised at low temperature.

TOC ANALYZER
•It measure soluble fraction of organic carbon in water.
• Based on simple principle of oxidation.
TOC = TC-IC
Platinum catalyst
150ml/min
Acidified solution

0
10
20
30
40
50
60
PM2.5
OC (µg m-3)
16-M
ay-0
723
-May
-07
23-M
ay-0
730
-May
-07
30-M
ay-0
706
-Jun
-07
13-J
un-0
713
-Jun
-07
19-J
ul-0
725
-Jul
-07
01-A
ug-0
723
-Aug
-07
10-S
ep-0
720
-Sep
-07
03-O
ct-0
710
-Oct
-07
17-O
ct-0
718
-Oct
-07
24-O
ct-0
724
-Oct
-07
31-O
ct-0
708
-Nov
-07
09-N
ov-0
709
-Nov
-07
14-N
ov-0
714
-Nov
-07
24-N
ov-0
725
-Nov
-07
30-N
ov-0
730
-Nov
-07
06-D
ec-0
706
-Dec
-07
13-D
ec-0
728
-Dec
-07
08-J
an-0
817
-Jan
-08
25-J
an-0
801
-Feb
-08
07-F
eb-0
807
-May
-08
15-M
ay-0
822
-May
-08
28-M
ay-0
810
-Jun
-08
20-J
un-0
822
-Jul
-08
04-S
ep-0
822
-Sep
-08
07-O
ct-0
815
-Oct
-08
0
5
10
15
20
25
PM2.5
EC (µg m-3)
DATE
•Temporal variation of OC and EC in PM2.5
•Abundance of OC and EC high during Oct.,07-Feb.,08 low during May, 07 to Sept.,07 and also during May,0 to Oct.08
•Seasonal Variation
0
10
20
30
40
50
60
70
PM10
OC (µg m-3)
16-M
ay-0
723
-May
-07
23-M
ay-0
730
-May
-07
30-M
ay-0
706
-Ju
n-0
713
-Ju
n-0
713
-Ju
n-0
719
-Ju
l-07
25-J
ul-
0701
-Au
g-0
723
-Au
g-0
710
-Sep
-07
20-S
ep-0
703
-Oct
-07
10-O
ct-0
717
-Oct
-07
18-O
ct-0
724
-Oct
-07
24-O
ct-0
731
-Oct
-07
08-N
ov-
0709
-No
v-07
09-N
ov-
0714
-No
v-07
14-N
ov-
0724
-No
v-07
25-N
ov-
0730
-No
v-07
30-N
ov-
0706
-Dec
-07
06-D
ec-0
713
-Dec
-07
28-D
ec-0
708
-Jan
-08
17-J
an-0
825
-Jan
-08
01-F
eb-0
807
-Feb
-08
07-M
ay-0
815
-May
-08
22-M
ay-0
828
-May
-08
10-J
un
-08
20-J
un
-08
22-J
ul-
0804
-Sep
-08
22-S
ep-0
807
-Oct
-08
15-O
ct-0
8
0
5
10
15
20
PM10
EC (µg m-3)

EC (µg m-3)
0 5 10 15 20 25
OC (µ
g m
-3)
0
20
40
60
80
PM2.5PM10
•Plot between concentration of OC and EC
• Originated from same point
•Straight line

Date
May Jun Jul Aug Sep Oct
WS
OC
1
2
3
4
5
6
7
WSOC (g/m3) PM10
Date
May Jun Jul Aug Sep Oct
WS
OC
1.0
1.5
2.0
2.5
3.0
3.5
4.0
4.5
5.0
WSOC (g/m3)PM2.5 •Soluble fraction of OC
•Peak during June and AugustIndicating photochemical rk.i.e. GPC
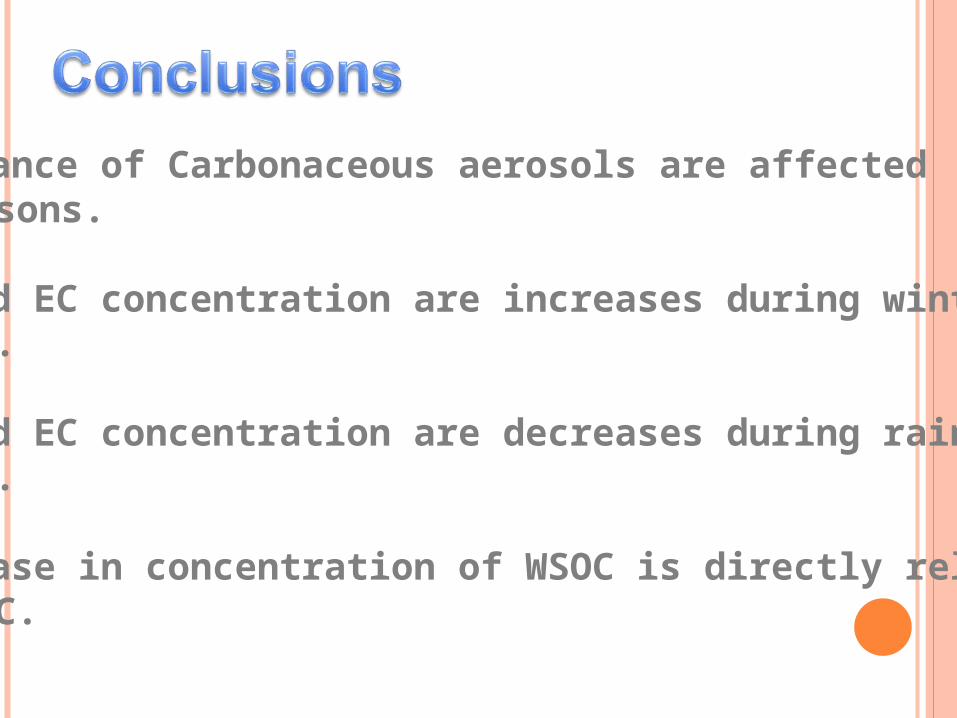
Abundance of Carbonaceous aerosols are affected by seasons.
OC and EC concentration are increases during winter season.
OC and EC concentration are decreases during rainy season.
Increase in concentration of WSOC is directly related with OC.