Final Nutrient TMDL For Lake Bonny (WBID 1497E)
64
FLORIDA DEPARTMENT OF ENVIRONMENTAL PROTECTION Division of Environmental Assessment and Restoration Water Quality Evaluation and TMDL Program SOUTHWEST DISTRICT • PEACE RIVER BASIN • UPPER PEACE RIVER PLANNING UNIT Final TMDL Report Nutrient TMDL For Lake Bonny (WBID 1497E) and Documentation in Support of Development of Site Specific Numeric Interpretations of the Narrative Nutrient Criteria Kevin Petrus September 2016
Transcript of Final Nutrient TMDL For Lake Bonny (WBID 1497E)

FLORIDA DEPARTMENT OF ENVIRONMENTAL PROTECTION Division of Environmental Assessment and Restoration
Water Quality Evaluation and TMDL Program
SOUTHWEST DISTRICT • PEACE RIVER BASIN • UPPER PEACE RIVER PLANNING UNIT
Final TMDL Report
Nutrient TMDL For Lake Bonny (WBID 1497E)
and Documentation in Support of Development of Site Specific Numeric Interpretations of the Narrative Nutrient Criteria
Kevin Petrus
September 2016
Nutrient TMDL Report for Lake Bonny: September 2016
i
Acknowledgments
This study could not have been accomplished without contributions from staff in the Florida Department of Environmental Protection’s Southwest District Office and the Division of Environmental Assessment and Restoration Office of Watershed Services. The Department also recognizes the City of Lakeland and Polk County Natural Resource Division for their contributions towards understanding the issues, history, and processes at work in the Lake Bonny watershed.
Editorial assistance provided by Douglas Gilbert, Wayne Magley, Xueqing Gao, and Daryll Joyner.
For additional information on the watershed management approach and impaired waters in the Peace River, Myakka River, and Sarasota Bay Planning Units, contact: Terry Hansen Florida Department of Environmental Protection Water Quality Restoration Program Watershed Planning and Coordination Section 2600 Blair Stone Road, Mail Station 3565 Tallahassee, FL 32399-2400 Email: [email protected] Phone: (850) 245-8561 Fax: (850) 245-8434 Access to all data used in the development of this report can be obtained by contacting: Kevin Petrus Florida Department of Environmental Protection Water Quality Evaluation and TMDL Program Watershed Evaluation and TMDL Section 2600 Blair Stone Road, Mail Station 3555 Tallahassee, FL 32399-2400 Email: [email protected] Phone: (850) 245-8459 Fax: (850) 245-8536

Nutrient TMDL Report for Lake Bonny: September 2016
ii
Contents
CHAPTER 1: INTRODUCTION ................................................................................................. 1
1.1 Purpose of Report .................................................................................................. 1
1.2 Identification of Waterbody ................................................................................... 1
1.3 Background ............................................................................................................ 5
CHAPTER 2: STATEMENT OF WATER QUALITY PROBLEM ........................................... 6
2.1 Legislative and Rulemaking History ..................................................................... 6
2.2 Information on Verified Impairment ...................................................................... 6
CHAPTER 3. DESCRIPTION OF APPLICABLE WATER QUALITY STANDARDS AND TARGETS..................................................................................................................................... 10
3.1 Classification of the Waterbody and Criteria Applicable to the TMDL ............ 10
3.2 Numeric Interpretation of Narrative Nutrient Criterion ................................... 11
3.3 Water Quality Variable Definitions ..................................................................... 13
CHAPTER 4: ASSESSMENT OF SOURCES .......................................................................... 14
4.1 Types of Sources ............................................................................................... 14
4.2 Point Sources ...................................................................................................... 14
4.3 Land Uses and Nonpoint Sources .................................................................... 15
CHAPTER 5: DETERMINATION OF ASSIMILATIVE CAPACITY ................................... 20
5.1 Determination of Loading Capacity .................................................................... 20
5.2 Analysis of Water Quality .................................................................................. 20
5.3 The TMDL Development Process ........................................................................ 26
5.4 Critical Conditions ............................................................................................... 29
CHAPTER 6: DETERMINATION OF THE TMDL ................................................................ 30
6.1 Expression and Allocation of the TMDL ............................................................. 30
6.2 Load Allocation (LA) ............................................................................................ 31
6.3 Wasteload Allocation (WLA)................................................................................ 31
6.4 Margin of Safety (MOS) ........................................................................................ 31
CHAPTER 7: NEXT STEPS: IMPLEMENTATION PLAN DEVELOPMENT AND BEYOND ...................................................................................................................................... 33
7.1 Implementation Mechanisms .............................................................................. 33
7.2 Basin Management Action Plans ........................................................................ 33
7.3 Implementation Considerations for Lake Bonny ............................................... 34

Nutrient TMDL Report for Lake Bonny: September 2016
iii
APPENDIX A: BACKGROUND INFORMATION ON FEDERAL AND STATE STORMWATER PROGRAMS .................................................................................................... 37
APPENDIX B: GRAPHS OF SURFACE WATER QUALITY RESULTS ............................. 38
APPENDIX C: LAKE BONNY PHYTOPLANKTON RESULTS – COLLECTED JUNE 27, 2013............................................................................................................................................... 41
APPENDIX D: WATER QUALITY STANDARDS TEMPLATE DOCUMENT .................... 43
APPENDIX E: POLK COUNTY STATIONS ANNUAL GEOMETRIC MEANS .................. 53
APPENDIX F: LAKE BONNY MULTIPLE REGRESSION MODEL RESULTS ................ 55

Nutrient TMDL Report for Lake Bonny: September 2016
iv
List of Tables
Table 2.1 Lake Bonny Annual Geometric Mean Values for the 2002 to 2012 Period. __ 7 Table 3.1. State Adopted Lake Criteria _____________________________________ 12 Table 4.1 Classification of Land Use Categories in the Lake Bonny Watershed in 2011
____________________________________________________________ 16 Table 5.1 Water Quality Results at the Time of Phytoplankton Sampling on June 27,
2013. _______________________________________________________ 22 Table 5.2 Lake Bonny Inferred Total Phosphorus Concentrations from Sediment
Collected July 19, 2001 (Whitmore and Brenner, 2002). ________________ 27 Table 5.3 Lake Bonny Nutrient Annual Geometric Means Used to Calculate the Percent
Reductions Needed to Meet the Water Quality Targets. ________________ 29 Table 6.1. TMDL Components for Lake Bonny _______________________________ 31
List of Figures Figure 1.1 Location of the Lake Bonny Basin and Major Geopolitical Features in West
Central Polk County. ____________________________________________ 3 Figure 1.2 The Lake Bonny Basin with Major Geopolitical and Hydrologic Features. ___ 4 Figure 2.1 Surface Water Monitoring Locations in the Lake Bonny Watershed. _______ 9 Figure 4.1 Principle Land Uses in the Lake Bonny Watershed in 2011 _____________ 17 Figure 4.2 Septic Tank Locations within the Lake Bonny Watershed _______________ 19 Figure 5.1 Total Nitrogen and Total Phosphorus Annual Geometric Means in Lake
Bonny. ______________________________________________________ 23 Figure 5.2 Lake Bonny Chlorophyll a Annual Geometric Means and Annual Rainfall. __ 23 Figure 5.3 Relationship Between Lake Bonny Chlorophyll a Annual Geometric Means
and Annual Rainfall. ___________________________________________ 24 Figure 5.4 Relationship Between Annual Geometric Means of Chlorophyll a and Total
Nitrogen in Lake Bonny. ________________________________________ 24 Figure 5.5 Relationship Between Annual Geometric Means of Chlorophyll a and Total
Phosphorus in Lake Bonny. ______________________________________ 25 Figure 5.6 Lake Bonny Chlorophyll a Results and Lake Area Treated for Invasive Aquatic
Plant Growth. _________________________________________________ 25 Figure 5.7 Relationship Between Total Phosphorus Annual Geometric Means and
Averages (Arithmetic Means) from Lake Results Used in NNC Development.____________________________________________________________ 27

Nutrient TMDL Report for Lake Bonny: September 2016
v
Web sites
FLORIDA DEPARTMENT OF ENVIRONMENTAL PROTECTION, DIVISION OF ENVIRONMENTAL ASSESSMENT AND RESTORATION Total Maximum Daily Load (TMDL) Program http://www.dep.state.fl.us/water/tmdl/index.htm Identification of Impaired Surface Waters Rule http://www.dep.state.fl.us/legal/Rules/shared/62-303/62-303.pdf Florida STORET Program http://www.dep.state.fl.us/water/storet/index.htm 2012 305(b) Report http://www.dep.state.fl.us/water/docs/2012_Integrated_Report.pdf Criteria for Surface Water Quality Classifications http://www.dep.state.fl.us/water/wqssp/classes.htm Water Quality Status and Assessment Reports for the Sarasota Bay – Peace River – Myakka River Basins http://www.dep.state.fl.us/water/basin411/sbpm/index.htm U.S. Environmental Protection Agency Region 4: Total Maximum Daily Loads in Florida http://www.epa.gov/region4/water/tmdl/florida/
National STORET Program http://www.epa.gov/storet/

Nutrient TMDL Report for Lake Bonny: September 2016
1
Chapter 1: INTRODUCTION 1.1 Purpose of Report
This report presents the Total Maximum Daily Loads (TMDLs) developed to address the nutrient impairment of Lake Bonny, which is located in the Upper Peace River Planning Unit, that is part of the larger Peace River Basin. The TMDLs will constitute the site specific numeric interpretation of the narrative nutrient criterion set forth in paragraph 62-302.530(47)(b), Florida Administrative Code (F.A.C.), that will replace the otherwise applicable numeric nutrient criteria in subsection 62-302.531(2) for this particular water, pursuant to paragraph 62-302.531(2)(a), F.A.C.. The lake was verified as impaired for nutrients using the methodology in the Identification of Impaired Surface Waters Rule (IWR, Rule 62-303, F.A.C.), and was included on the Verified List of impaired waters for the Sarasota Bay – Peace River – Myakka River Group 3 Basin that was adopted by Secretarial Order on June 17, 2005. The TMDL process quantifies the amount of a pollutant that can be assimilated in a waterbody, identifies the sources of the pollutant, and provides water quality targets needed to achieve compliance with applicable water quality standards based on the relationship between pollution sources and receiving waterbody water quality. The TMDLs establish the allowable loadings to Lake Bonny that would restore the waterbody so that it meets its applicable water quality criteria for nutrients.
1.2 Identification of Waterbody
Lake Bonny is located inside the City of Lakeland, Polk County, Florida, (Figure 1.1). The lake’s watershed encompasses 1.9 square miles (1,197 acres) in west central Polk County. The lake outlet is connected to Lake Parker, which flows into upper Saddle Creek that in turn drains to Lake Hancock. Lake Hancock discharges to lower Saddle Creek, which along with the Peace Creek Drainage Canal, makes up the headwaters of the Peace River. The estimated surface area of the lake is 249 acres and includes Little Lake Bonny, a small, once isolated seepage lake located along the southeastern part of the lake. The average lake volume is 1,475,940 m3 (3.9 * 108 gallons). The average depth of the lake is 3.0 ft. (0.9 m), with a maximum depth of 11.2 ft. (3.4 m). The watershed area is within the Lakeland/Bone Valley Upland Lake Region (Region 75-30), which consists of areas covered by phosphatic sand or clayey sand (Griffith et al. 1997). The lake’s watershed includes Lake Holloway which discharges to Lake Bonny. Lake Bonny can also receive inputs from Lake Parker, via a connecting channel located on the northeastern part of the lake. A city water control structure is located in the channel between the lakes, however, there are no records of the structure operation. Historically, Lake Bonny and Little Lake Bonny were naturally land-locked and disconnected seepage lakes. However, in the mid 1920’s, Lake Bonny and Little Lake Bonny were connected to each other and Lake Parker via canals. Little Lake Bonny receives inflow from Lake Holloway via a pipe, with Lake Bonny discharging into Lake Parker. A public park and boat ramp are located on the north shore of the lake with another park located on the west shore (City of Lakeland, 2001).

Nutrient TMDL Report for Lake Bonny: September 2016
2
The climate of the Lake Bonny and Peace River watershed area is generally subtropical with an annual average temperature of about 73 degrees. Annual rainfall in or near the Peace River drainage basin averages 50 to 56 inches, and approximately 60 percent of the rainfall occurs from June through September (SWFWMD, 2004). The long-term average annual rainfall for Polk County, based on Southwest Florida Water Management District (SWFWMD) records in the period from 1915 to 2013, is about 52 inches/year. For assessment purposes, the Department has divided the Peace River Basin into watershed assessment polygons with a unique waterbody identification (WBID) number for each watershed or surface water segment. Lake Bonny has been given the WBID number 1497E. Figure 1.2 displays the location of the lake WBID along with the major geopolitical and hydrologic features.

Nutrient TMDL Report for Lake Bonny: September 2016
3
Figure 1.1 Location of the Lake Bonny Basin and Major Geopolitical Features in West Central Polk County.

Nutrient TMDL Report for Lake Bonny: September 2016
4
Figure 1.2 The Lake Bonny Basin with Major Geopolitical and Hydrologic Features.

Nutrient TMDL Report for Lake Bonny: September 2016
5
1.3 Background
This report was developed as part of the Department’s watershed management approach for restoring and protecting state waters and addressing TMDL Program requirements. The watershed approach, which is implemented using a cyclical management process that rotates through the state’s 52 river basins over a 5-year cycle, provides a framework for implementing the TMDL Program–related requirements of the 1972 federal Clean Water Act and the 1999 Florida Watershed Restoration Act (FWRA, Chapter 99-223, Laws of Florida); as amended. A TMDL represents the maximum amount of a given pollutant that a waterbody can assimilate and still meet water quality standards, including its applicable water quality criteria and its designated uses. TMDLs are developed for waterbodies that are verified as not meeting their water quality standards. They provide important water quality restoration goals that will guide restoration activities. This TMDL Report will be followed by the development and implementation of a restoration plan to reduce the amount of pollutants that caused the verified impairment of Lake Bonny. These activities will depend heavily on the active participation of the SWFWMD, local governments, businesses, and other stakeholders. The Department will work with these organizations and individuals to undertake or continue reductions in the discharge of pollutants and achieve the established TMDLs for the impaired waterbody.

Nutrient TMDL Report for Lake Bonny: September 2016
6
Chapter 2: STATEMENT OF WATER QUALITY PROBLEM
2.1 Legislative and Rulemaking History
Section 303(d) of the federal Clean Water Act requires states to submit to the U. S. Environmental Protection Agency (EPA) a list of surface waters that do not meet applicable water quality standards (impaired waters) and establish a TMDL for each pollutant identified as causing the impairment of the listed waters on a schedule. The Department has developed such lists, commonly referred to as 303(d) lists, since 1992. The state’s list of impaired waters, referred to as the Verified List, is required by the FWRA (Subsection 403.067[4], Florida Statutes [F.S.]). It is amended annually to include basin updates and these updates are submitted to EPA for inclusion on the state’s 303(d) list. Florida’s 1998 303(d) list included 51 waterbodies in the Peace River Basin. However, the FWRA (Section 403.067, F.S.) stated that all previous Florida 303(d) lists were for planning purposes only and directed the Department to develop, and adopt by rule, a new science-based methodology to identify impaired waters. The Environmental Regulation Commission adopted the new methodology as Rule 62-303, Florida Administrative Code (F.A.C.) (Identification of Impaired Surface Waters Rule, or IWR), in April 2001; the rule was amended in 2006, 2007, 2012, and 2013.
2.2 Information on Verified Impairment
The Department used the IWR to assess water quality impairments in Lake Bonny, and the lake was verified as impaired for nutrients based on elevated annual average Trophic State Index (TSI) values during the Cycle 1 verification period (the verified period for the Group 3 basins is from January 1997 to June 2004). At the time the Cycle 1 assessment was performed, the IWR methodology used the water quality variables total nitrogen (TN), total phosphorus (TP), and chlorophyll a (a measure of algal mass, corrected and uncorrected) in calculating annual TSI values and in interpreting Florida’s narrative nutrient threshold. The TSI is calculated based on concentrations of TP, TN, and chlorophyll a. Exceeding a TSI of 60 in any one year of the verified period was sufficient for identifying a lake as impaired for nutrients. All annual mean TSI values in the 1996 to 2002 period exceeded the impairment threshold of 60. In the more recent Cycle 2 verification period (January 2002 to June 2009), the annual mean TSI values continued to exceed the threshold of 60. Florida adopted new numeric nutrient standards for lakes, spring vents, and streams in 2011, which were approved by the EPA in 2012. It is envisioned that these standards, in combination with the related bioassessment tools, will facilitate the assessment of designated use attainment for its waters and provide a better means to protect state waters from the adverse effects of nutrient over-enrichment. The new lake NNC, which are set forth in subparagraph 62-302.531(2)(b)1., F.A.C., are expressed as annual geometric mean values for chlorophyll a, TN, and TP, which are further described in Chapter 3. Although the Department has not formally assessed the data for Lake Bonny using the new NNC, based on an analysis of the data from 2002 to 2012 in IWR Database Run 48, the preliminary results indicate that Lake Bonny would not attain the new lake NNC for chlorophyll

Nutrient TMDL Report for Lake Bonny: September 2016
7
a, TN, and TP for low color (< 40 PCU), high alkalinity (> 20 mg/L CaCO3) lakes, and thus remains impaired for nutrients. This time frame represents the Cycle 2 verification period and water quality in more recent years that has been reported. Under the new NNC, Lake Bonny is classified as a lake with low color (<40 PCU) and high alkalinity (>20 mg/L CaCO3), based on the long-term geometric mean values for color and alkalinity. The preliminary annual geometric mean values for chlorophyll a, TN, and TP during the 2002 to 2012 period are presented in Table 2.1. The sources of data for the Cycle 1 and Cycle 2 IWR assessments of WBID 1497E come from stations sampled by Polk County (21FLPOLK…), the Southwest Florida Water Management District (21FLSWFD…) and Florida LakeWatch (21FLKWAT…). The majority of the available data comes from the monitoring conducted by Polk County. The county has been sampling at the center of the lake since 1986 at station 21FLPOLKBONNY1. In 1999, the county began sampling for corrected chlorophyll a, which is the more common form of chlorophyll a used in assessing surface water quality. The other sampling organizations conduct monitoring intermittently. The sampling locations are displayed in Figure 2.1. The individual water quality measurements used in this analysis are available in the IWR database (Run 48), and are available upon request. Water quality results for the period of record for variables relevant to this TMDL effort, which were collected by all sampling entities, are displayed in the graphs in Appendix B. Table 2.1 Lake Bonny Annual Geometric Mean Values for
the 2002 to 2012 Period.
YearChlorophyll a
(ug/L)
Total Nitrogen (mg/L)
Total Phosphorus
(mg/L)2002 86 2.6 0.12003 31 1.43 0.052004 ID ID ID2005 45 1.61 ID2006 69 2.32 ID2007 150 4.25 0.232008 148 5.67 0.362009 ID ID ID2010 ID ID ID2011 68 2.59 0.12012 48 2.06 0.09
ID - Insufficient Data to Calculate Geometric Means per the Requirements of Rule 62-303. Note: Values shown shaded are greater than the new NNC for lakes. Rule 62-302.531(2)(b)1., F.A.C., states that the applicable numeric interpretations for TN, TP, and chlorophyll a shall not be exceeded more than once in any consecutive three year period. In Florida waterbodies, nitrogen and phosphorus are most often the limiting nutrients. The limiting nutrient is defined as the nutrient(s) that limit plant growth (both macrophytes and algae) when it is not available in sufficient quantities. A limiting nutrient is a chemical that is necessary for plant growth, but available in quantities smaller than those needed for algae, represented by
Nutrient TMDL Report for Lake Bonny: September 2016
8
chlorophyll a, and macrophytes to grow. In the past, management activities to control lake eutrophication focused on phosphorus reduction as phosphorus was generally recognized as the limiting nutrient in freshwater systems. Recent studies, however, have supported that the reduction of both nitrogen and phosphorus is necessary to control algal growth in aquatic systems (Conley et al. 2009, Paerl 2009, Lewis et al. 2011, Paerl and Otten 2013). Furthermore, the analysis used in the development of the Florida lake NNC support this idea as statistically significant relationships were found between chlorophyll a values and both nitrogen and phosphorus concentrations (Florida DEP, 2012).

Nutrient TMDL Report for Lake Bonny: September 2016
9
Figure 2.1 Surface Water Monitoring Locations in the Lake Bonny Watershed.

Nutrient TMDL Report for Lake Bonny: September 2016
10
Chapter 3. DESCRIPTION OF APPLICABLE WATER QUALITY STANDARDS AND TARGETS
3.1 Classification of the Waterbody and Criteria Applicable to the TMDL
Florida’s surface water is protected for six designated use classifications, as follows: Class I Potable water supplies Class II Shellfish propagation or harvesting Class III Recreation, propagation, and maintenance of a healthy, well-
balanced population of fish and wildlife Class III-Limited Fish Consumption; Recreation or Limited Recreation; and/or
Propagation and Maintenance of a Limited Population of Fish and Wildlife
Class IV Agricultural water supplies Class V Navigation, utility, and industrial use (there are no state
waters currently in this class) Lake Bonny is classified as a Class III freshwater waterbody, with a designated use of recreation, propagation and maintenance of a healthy, well-balanced population of fish and wildlife. The Class III water quality criterion applicable to the verified impairments (nutrients) for this water is the state of Florida’s nutrient criterion in Paragraph 62-302.530(47)(b), Florida Administrative Code (F.A.C.). Florida has newly adopted lake criteria in Rule 62-302.531, F.A.C., for total nitrogen, total phosphorous, and chlorophyll a that went into effect on October 27, 2014. The Department has not formally assessed the data for Lake Bonny using the new criteria. However, based on preliminary analysis of the available data, Lake Bonny would not attain the new NNC, and is expected to remain listed as verified impaired for nutrients under the new criteria. The nutrient TMDLs presented in this report constitute site specific numeric interpretations of the narrative nutrient criterion set forth in paragraph 62-302.530(47)(b), F.A.C., that will replace the otherwise applicable NNC in subsection 62-302.531(2), F.A.C., for this particular water, pursuant to paragraph 62-302.531(2)(a), F.A.C. The Water Quality Standards template document in Appendix D, provides the relevant TMDL information, including information that the TMDL provides for the attainment and maintenance of water quality standards in downstream waters (pursuant to subsection 62-302.531(4)), to support using the TMDL nutrient targets as the site specific numeric interpretations of the narrative nutrient criterion. Targets used in TMDL development are designed to restore surface water quality to meet a waterbody’s designated use. Criteria are based on scientific information used to establish specific levels of water quality constituents that protect aquatic life and human health for particular designated use classifications. As a result, TMDL targets and water quality criteria serve the same purpose as both measures are designed to protect surface water designated use.

Nutrient TMDL Report for Lake Bonny: September 2016
11
3.2 Numeric Interpretation of Narrative Nutrient Criterion
The applicable lakes NNC are dependent on the alkalinity and true color (color), based on the long-term period of record (POR) geometric means (GM), Table 3.1. Using this methodology, Lake Bonny is classified as a lake with low color (<40 PCU) and high alkalinity (>20 mg/L CaCO3). The new chlorophyll a NNC for low color, high alkalinity lakes is an annual geometric mean value of 20 µg/L, which is not to be exceeded more than once in any consecutive three-year period. The associated TN and TP criteria for a lake can vary on an annual basis, depending on the availability of data for chlorophyll a and the concentrations of nutrients and chlorophyll a in the lake, as described below. If there are sufficient data to calculate an annual geometric mean for chlorophyll a and the mean does not exceed the chlorophyll a criterion for the lake type in Table 3.1, then the TN and TP numeric interpretations for that calendar year shall be the annual geometric means of lake TN and TP samples, subject to the minimum and maximum TN and TP limits in the table below. If there are insufficient data to calculate the annual geometric mean chlorophyll a for a given year, or the annual geometric mean chlorophyll a exceeds the values in Table 3.1 for the lake type, then the applicable numeric interpretations for TN and TP shall be the minimum values in the table. The analyses supporting the criteria represent the best scientific understanding of nutrient and chlorophyll a concentrations that each lake type can support while maintaining designated uses and were used as evidence for establishing the appropriate targets for TMDL development for Lake Bonny.
The development of the lake NNC are based on an evaluation of a response variable (chlorophyll a) and stressor variables (nitrogen and phosphorus) to develop water quality thresholds that are protective of designated uses (Florida DEP, 2012). Based on several lines of evidence, the DEP developed a chlorophyll a threshold of 20 μg/L for colored lakes (above 40 PCU) and clear lakes with alkalinity above 20 mg/L CaCO3. Since the Department has demonstrated that the chlorophyll a threshold of 20 µg/L is protective of designated uses, this value will be used as a water quality target for TMDL development to address the nutrient impairment of Lake Bonny. Empirical equations that describe the relationships between chlorophyll a and nutrient concentrations in Lake Bonny were then used in the TMDL development approach, which is explained in detail in Chapter 5.

Nutrient TMDL Report for Lake Bonny: September 2016
12
Table 3.1. State Adopted Lake Criteria
Minimum Minimum Maximum Long Term Calculated Calculated Annual Calculated Calculated Geometric Annual Annual Geometric Annual Annual Mean Lake Geometric Geometric Mean Geometric Geometric Color and Mean Total Mean Total Chlorophyll a Mean Total Mean Total Alkalinity Phosphorus Phosphorus Nitrogen NNC Nitrogen NNC NNC NNC
Maximum
>40 Platinum Cobalt Units 20 µg/L 0.05 mg/L 1.27 mg/L 0.16 mg/L1 2.23 mg/L
≤ 40 Platinum Cobalt Units
and > 20 mg/L CaCO3
20 µg/L 0.03 mg/L 1.05 mg/L 0.09 mg/L 1.91 mg/L
≤ 40 Platinum Cobalt Units
and ≤ 20 mg/L CaCO3
6 µg/L 0.01 mg/L 0.51 mg/L 0.03 mg/L 0.93 mg/L
1 - For lakes with color > 40 PCU in the West Central Nutrient Watershed Region, the maximum TP limit shall be the 0.49 mg/L TP streams threshold for the region.

Nutrient TMDL Report for Lake Bonny: September 2016
13
3.3 Water Quality Variable Definitions
Chlorophyll a Chlorophyll is a green pigment found in plants and is an essential component in the process of converting light energy into chemical energy. Chlorophyll is capable of channeling the energy of sunlight into chemical energy through the process of photosynthesis. In photosynthesis, the energy absorbed by chlorophyll transforms carbon dioxide (CO2) and water (H2O) into carbohydrates and oxygen (O2). The chemical energy stored by photosynthesis in carbohydrates drives biochemical reactions in nearly all living organisms. Thus, chlorophyll is at the center of the photosynthetic oxidation-reduction reaction between carbon dioxide and water. There are several types of chlorophyll; however, the predominant form is chlorophyll a. The measurement of chlorophyll a in a water sample is a useful indicator of phytoplankton biomass, especially when used in conjunction with analysis concerning algal growth potential and species abundance. The greater the abundance of chlorophyll a, typically the greater the abundance of algae. Algae are the primary producers in the aquatic web, and thus are very important in characterizing the productivity of lakes and streams. As noted earlier, chlorophyll a measurements are also used to estimate the trophic conditions of lakes and other lentic waters. Total Nitrogen as N (TN) Total nitrogen is the sum of nitrate (NO3), nitrite (NO2), ammonia (NH3 ), and organic nitrogen found in water. Nitrogen compounds function as important nutrients to many aquatic organisms and are essential to the chemical processes that exist between land, air, and water. The most readily bioavailable forms of nitrogen are ammonia and nitrate. These compounds, in conjunction with other nutrients, serve as an important base for primary productivity. The major sources of excessive amounts of nitrogen in surface water are the effluent from wastewater treatment plants and runoff from urban and agricultural land areas. When nutrient concentrations consistently exceed natural levels, the resulting nutrient imbalance can cause undesirable changes in a waterbody’s biological community and drive an aquatic system into an accelerated rate of eutrophication. Usually, the eutrophication process is observed as a change in the structure of the algal community and includes severe algal blooms that may cover large areas for extended periods. Large algal blooms are generally followed by a depletion in dissolved oxygen concentrations as a result of algal decomposition. Total Phosphorus as P (TP) Phosphorus is one of the primary nutrients that regulates algal and macrophyte growth in natural waters, particularly in fresh water. Phosphate, the predominant form of phosphorus found in the water column, can enter the aquatic environment in a number of ways. Natural processes transport phosphate to water through atmospheric deposition, ground water percolation, and terrestrial runoff. Municipal treatment plants, industries, agriculture, and domestic activities also contribute to phosphate loading through direct discharge and natural transport mechanisms. The very high levels of phosphorus in some of Florida’s streams and estuaries are usually caused by phosphate mining and fertilizer processing activities. High phosphorus concentrations are frequently responsible for accelerating the process of eutrophication, or accelerated aging, of a waterbody. Once phosphorus and other important nutrients enter the ecosystem, they are extremely difficult to remove. They become tied up in biomass or deposited in sediments. Nutrients, particularly phosphates, deposited in sediments generally are redistributed to the water column. This type of cycling compounds the difficulty of halting the eutrophication process.

Nutrient TMDL Report for Lake Bonny: September 2016
14
Chapter 4: ASSESSMENT OF SOURCES
4.1 Types of Sources
An important part of the TMDL analysis is the identification of pollutant source categories, source subcategories, or individual sources of the pollutants of concern in the watershed and the amount of pollutant loading contributed by each of these sources. Sources are broadly classified as either “point sources” or “nonpoint sources.” Historically, the term point sources has meant discharges to surface waters that typically have a continuous flow via a discernable, confined, and discrete conveyance, such as a pipe. Domestic and industrial wastewater treatment facilities (WWTFs) are examples of traditional point sources. In contrast, the term “nonpoint sources” was used to describe intermittent, rainfall driven, diffuse sources of pollution associated with everyday human activities, including runoff from urban land uses, agriculture, silviculture, and mining; discharges from failing septic systems; and atmospheric deposition.
However, the 1987 amendments to the Clean Water Act redefined certain nonpoint sources of pollution as point sources subject to regulation under the EPA’s National Pollutant Discharge Elimination System (NPDES) Program. These nonpoint sources included certain urban stormwater discharges, including those from local government master drainage systems, construction sites over 5 acres, and a wide variety of industries (see Appendix A for background information on the federal and state stormwater programs).
To be consistent with Clean Water Act definitions, the term “point source” is used to describe traditional point sources (such as domestic and industrial wastewater discharges) and stormwater systems requiring an NPDES stormwater permit when allocating pollutant load reductions required by a TMDL. However, the methodologies used to estimate nonpoint source loads do not distinguish between NPDES stormwater discharges and non-NPDES stormwater discharges, and as such, this chapter does not make any distinction between the two types of stormwater.
4.2 Point Sources
4.2.1 NPDES Permitted Wastewater Facilities
There are no NPDES permitted domestic or industrial wastewater facilities that discharge within the watershed.
4.2.2 Municipal Separate Storm Sewer System Permittees
Municipal separate storm sewer systems (MS4s) may also discharge pollutants to waterbodies in response to storm events. To address stormwater discharges, the EPA developed the NPDES stormwater permitting program in two phases. Phase 1, promulgated in 1990, addresses large and medium-size MS4s located in incorporated areas and counties with populations of 100,000 or more. Phase 2 permitting began in 2003. Regulated Phase 2 MS4s are defined in Section 62-624.800, F.A.C., and typically cover urbanized areas serving jurisdictions with a population of at least 10,000 or discharging into Class I or Class II waters, or into Outstanding Florida Waters.

Nutrient TMDL Report for Lake Bonny: September 2016
15
The stormwater collection systems in the Lake Bonny watershed, which are owned and operated by Polk County, in conjunction with the Florida Department of Transportation (FDOT) District 1, are covered by a NPDES Phase I MS4 permit (Permit No. FLS000015). The city of Lakeland is a co-permittee in the MS4 permit and a large portion of the watershed is within the city limits.
4.3 Land Uses and Nonpoint Sources
Nutrient loading from urban areas is most often attributable to multiple sources, including stormwater runoff, leaks and overflows from sanitary sewer systems, illicit discharges of sanitary waste, runoff from improper disposal of waste materials, leaking septic systems, and domestic animals. As the Lake Bonny watershed is primarily urban and there is a negligible area of agricultural land use, the anthropogenic nutrient load in the basin originates from urban sources. In addition to the nutrient sources associated with anthropogenic activities, birds and other wildlife can also contribute considerable amounts of nutrients to waterbodies through their feces, particularly in areas that have bird rookeries. While detailed source information is not always available for accurately quantifying the loadings from wildlife sources, land use information can be used to help identify areas where there is the potential for wildlife to congregate. Along the west shore of Lake Bonny there is an extensive area of wetlands that should be considered as a potential area for further evaluation.
4.3.1 Land Uses
The spatial distribution and acreage of different land use categories were identified using the SWFWMD 2011 land use coverage contained in the Department’s geographic information system (GIS) library. Land use categories within the Lake Bonny watershed were aggregated using the Florida Land Use Code and Classification System (FLUCCS) expanded Level 1 codes (including low, medium, and high density residential) and are tabulated in Table 4.1. Figure 4.1 shows the spatial distribution of the principal land uses in the watershed. Land use is predominately urban, with approximately 40 percent of the land area developed into medium and high density residential areas. Other urban areas include institutional land use (8.6 percent), the largest area being Southeastern University property, and recreational land use (4.4 percent). Surface waters and wetlands combined cover 33 percent of the watershed, with wetlands, located primarily along the west shore of the lake, representing approximately 13 percent of the area.

Nutrient TMDL Report for Lake Bonny: September 2016
16
Table 4.1 Classification of Land Use Categories in the Lake
Bonny Watershed in 2011
FLUCCs Code Landuse Acreage
Percent of Total
1100 Low Density Residential 7.7 0.6 1200 Medium Density Residential 261.2 21.8 1300 High Density Residential 213.3 17.8 1400 Commercial and Services 101.3 8.5 1500 Industrial 9.0 0.7 1700 Institutional 102.6 8.6 1800 Recreational 52.5 4.4 1900 Urban Open Land 5.1 0.4 2000 Agriculture 0.2 0.0
3000+4000 Rangeland + Forest/Rural Open 0.0 0.0 5000 Water 243.5 20.3 6150 Stream and Lake Swamps (bottomland) 15.5 1.3 6410 Freshwater Marshes 131.3 11.0
6000… Other Wetlands 8.0 0.7 7000 Barren Land 0.0 0.0 8000 Communication and Transportation 46.2 3.9 Total All Combined 1,197 100.0

Nutrient TMDL Report for Lake Bonny: September 2016
17
Figure 4.1 Principle Land Uses in the Lake Bonny Watershed in 2011
Nutrient TMDL Report for Lake Bonny: September 2016
18
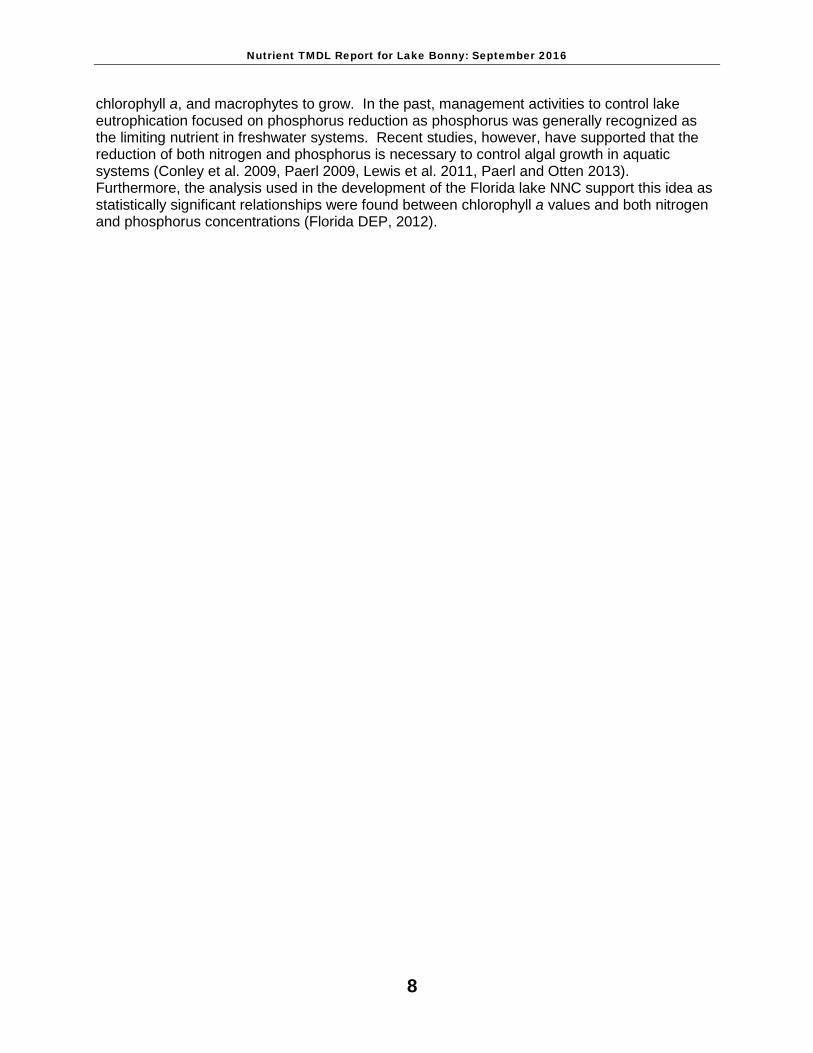
Polk County Population According to the U.S Census Bureau, the population density in Polk County, in the year 2010, was 334.9 persons per square mile. The Census Bureau reports that the total population in 2010 for Polk County, which includes (but is not exclusive to) the Lake Bonny watershed, was 602,095, with 281,385 housing units. Polk County occupies an area of approximately 1,798 square miles. For all of Polk County, the housing density is 156.5 houses per square mile. (U. S. Census Bureau Web site, 2014).
Polk County Septic Tanks
Onsite sewage treatment and disposal systems (OSTDSs), including septic tanks, are commonly used where providing central sewer service is not cost-effective or practical. When properly sited, designed, constructed, maintained, and operated, OSTDSs are a safe means of disposing of domestic waste. The effluent from a well-functioning OSTDS is comparable to secondarily treated wastewater from a sewage treatment plant. When not functioning properly, however, OSTDSs can be a source of nutrients (nitrogen and phosphorus), pathogens, and other pollutants to both ground water and surface water. Information on the location of septic systems was obtained from a Florida Department of Health Onsite Sewage Treatment and Disposal Systems GIS coverage dated November 2012. The septic tanks located in the Lake Bonny watershed are displayed in Figure 4.2. Currently the number of septic tanks in the watershed is estimated to be 93 and the largest number of septic tanks is in the eastern part of the watershed.

Nutrient TMDL Report for Lake Bonny: September 2016
19
Figure 4.2 Septic Tank Locations within the Lake Bonny Watershed

Nutrient TMDL Report for Lake Bonny: September 2016
20
Chapter 5: DETERMINATION OF ASSIMILATIVE CAPACITY 5.1 Determination of Loading Capacity
The TMDL development process identifies nutrient target concentrations and nutrient reductions for Lake Bonny in order for the waterbody to achieve the applicable nutrient water quality criteria, and maintain its function and designated use as a Class III fresh water. The methods utilized to address the nutrient impairment included the development of regression equations that relate lake nutrient concentrations to the annual geometric mean chlorophyll a levels and the evaluation of paleolimnological results to establish a water quality target for total phosphorus. For addressing nonpoint sources (both NPDES stormwater discharges and non-NPDES stormwater discharges), the TMDLs are expressed as percent reductions in the existing lake water total nitrogen and total phosphorus concentrations necessary to meet the applicable chlorophyll a target while taking into consideration the estimated pre-disturbance conditions in the lake. The primary focus in the implementation of this TMDL is to maintain the lake’s annual geometric mean chlorophyll a values at or below the target concentration of 20 µg/L through reductions in nutrient inputs to the system. Nutrient reductions are also expected to result in improvements of dissolved oxygen levels within the lake. When algae die they become part of the organic matter pool in the water column and the sediments. The decomposition of organic substrates by microbial activity exerts an oxygen demand which leads to a lowering of dissolved oxygen levels. Lower algal biomass should lower the biochemical oxygen demand levels in the water column, and sediment oxygen demand in the lake should also decrease over time as reductions in algal biomass will result in less accumulation of organic matter in the lake sediments.
5.2 Analysis of Water Quality
Lake Bonny water quality monitoring in recent years has been performed by three different entities. Polk County has been routinely sampling the lake since 1986 and a large portion of the data used to assess water quality were obtained at station 21FLPOLKBONNY1, which is located near the center of the lake. The other sampling organizations (the Southwest Florida Water Management District and Florida LakeWatch), have conducted monitoring intermittently for short periods of time. The individual water quality results for variables relevant to this TMDL effort for the period of record, which were collected by all sampling organizations, are displayed in the graphs in Appendix B. The results collected at the Polk County sampling location near the center of the lake were evaluated to determine if relationships exist between nutrient concentrations and chlorophyll a levels. The county monitoring at this location provides a consistent data set for evaluating surface water quality. In 2005, Polk County started sampling in Little Lake Bonny at station 21FLPOLKLTL BONNY1. The data set for Little Lake Bonny is much smaller compared to the data available at the county station near the center of Lake Bonny. Therefore, it would be inappropriate to include the results at this station in the analysis, as doing so would enter a bias into the analysis. Additionally, the annual geometric mean results for chlorophyll a, TN, and TP at the sampling locations near the center of Lake Bonny and in Little Lake Bonny (displayed in the graphs in Appendix E) exhibit similar patterns and magnitudes.

Nutrient TMDL Report for Lake Bonny: September 2016
21
The nutrient and chlorophyll a annual geometric means were used in this evaluation to be consistent with the expression of the adopted NNC for lakes. In 1999, the county began sampling for corrected chlorophyll a, which is the more common form of chlorophyll a used in assessing surface water quality. For the purpose of this analysis, a minimum of two samples per year collected in different quarters of the year, were used to calculate the annual geometric means. In the 1999 to 2012 period, there were sufficient results collected in most years to calculate annual geometric mean values for corrected chlorophyll a and nutrients. There were insufficient results available in 2009 to calculate geometric mean values. In 2009 lake levels reached such an extreme low that much of the lake bottom became exposed and the lake was transformed into four small cells of water separated by dry lake bottom (City of Lakeland 2010). Annual geometric mean values for total nitrogen (TN) and total phosphorus (TP) results measured at the center of the lake are presented in Figure 5.1. During the 1999 to 2012 period, TN annual means ranged from 1.43 mg/L to 5.54 mg/L and the TP annual means ranged from 0.048 mg/L to 0.335 mg/L.
The chlorophyll a annual geometric mean values along with annual total rainfall are presented in Figure 5.2. The chlorophyll a annual geometric mean values in Lakes Bonny were above 20 µg/L throughout the 1999 to 2012 period and ranged from 31 µg/L in 2003 to 170 µg/L in 2008. The lowest chlorophyll a annual means typically occurred in years with the highest rainfall (i.e. 2002 to 2005). Linear regression analysis comparing the annual geometric mean chlorophyll a results to annual rainfall, Figure 5.3, indicates that there is a significant inverse relationship between these variables (p value < 0.05). The results suggest that factors in addition to external nutrient loadings, such as lake residence time and internal cycling of nutrients, may be exhibiting a considerable influence on lake chlorophyll a levels since in years with presumably higher watershed nutrient loadings (i.e. higher rainfall years) the chlorophyll a results tend to be lower.
Information obtained from recent monitoring by the DEP Southwest District to enumerate the phytoplankton community and a previous watershed and lake modeling effort performed by the DEP suggest that other factors, in addition to watershed nutrient loadings, are having an effect on lake water quality.
Samples for phytoplankton enumeration and water quality characterization were collected near the center of the lake in June 2013. The water quality measurements are presented in Table 5.1 and the phytoplankton community results are presented in Appendix C. Phytoplankton in the Phylum Cyanophycota (the blue-green algae) were the dominant group, representing 68 percent of the algal community based on cell densities. Many blue-green algae taxa are capable of fixing atmospheric nitrogen, among them are Aphanizomenon and Cylindrospermopsis raciborskii, which were observed in Lake Bonny.
The Florida DEP TMDL Program previously conducted watershed and lake water quality modeling of lakes within the Lake Hancock watershed, which included water quality simulations for Lake Bonny (Florida DEP, 2005 and US EPA, 2006). The watershed model was not delivering enough mass to match the measured in-lake TN and TP concentrations and it was necessary to utilize the lake model internal loading rate functions for both TN and TP to match the measured in-lake mass. The modeling effort provides further evidence that internal loadings (e.g. sediment nutrient fluxes and/or nitrogen fixation) are factors which may be influencing the lake nutrient budgets and the growth of phytoplankton.
The relationships between the chlorophyll a and TN and TP annual geometric mean concentrations are presented in Figure 5.4 and Figure 5.5, respectively. Chlorophyll a exhibits a strong and significant positive relationship with TN (r square = 0.91, p value < 0.05) and TP (r

Nutrient TMDL Report for Lake Bonny: September 2016
22
square = 0.89, p value < 0.05). These observations suggest that with a lowering of the in-lake nutrient concentrations the chlorophyll a concentrations will likewise decrease. Invasive aquatic plants occur within Lake Bonny, (most notably hydrilla, water hyacinth, and water lettuce) and herbicide treatment is conducted at times to control the spread of these plants in the lake. This practice may enhance the cycling of nutrients within the lake, as the decomposition of dead plant material leads to the release of nutrients into the water column which can be a nutrient source for the phytoplankton community. Herbicide treatment information (acres treated and targeted vegetation) was obtained from the Polk County Parks and Natural Resources Office and compared to the lake chlorophyll a results, Figure 5.6. In general, since the year 2000, the herbicides have been applied to a relatively small lake area (only three of thirty-nine treatment events covered more than 10 percent of the lake surface area). There does not appear to be any strong relationship between herbicide applications and chlorophyll a results, however, after the July and August 2005 events, when more than 25 percent of the surface area was treated, higher chlorophyll a concentrations were observed. Table 5.1 Water Quality Results at the Time of
Phytoplankton Sampling on June 27, 2013.
Parameter Value Qualifier
Code Alkalinity (mg CaCO3/L) 63 Biochemical Oxygen Demand-5 Day (mg/L) 3.5 Chloride (mg Cl/L) 17 Chlorophyll-a, Corrected (µg/L) 31 Color - true (PCU) 26 Dissolved Oxygen (mg/L) 7.98 Fluoride (mg F/L) 0.33 Kjeldahl Nitrogen (mg N/L) 1.7 NO2NO3-N (mg N/L) 0.006 I O-Phosphate-P (mg P/L) 0.004 U Organic Carbon (mg C/L) 15 pH (SU) 8.34 Phaeophytin-a (µg/L) 1.7 U Sample Depth (m) 0.2 Specific Conductance (umhos/cm) 196 Sulfate (mg SO4/L) 5.8 TDS (mg/L) 130 Temperature (deg. C) 30.89 Total-P (mg P/L) 0.031 TSS (mg/L) 12 I Turbidity (NTU) 5.6
I - The reported value is greater than or equal to the laboratory method detection limit but less than the laboratory practical quantitation limit. U - Indicates that the compound was analyzed for but not detected.

Nutrient TMDL Report for Lake Bonny: September 2016
23
Figure 5.1 Total Nitrogen and Total Phosphorus Annual Geometric Means in Lake Bonny.
Figure 5.2 Lake Bonny Chlorophyll a Annual Geometric Means and Annual Rainfall.
0.00
0.05
0.10
0.15
0.20
0.25
0.30
0.35
0.40
0.0
1.0
2.0
3.0
4.0
5.0
6.0
1998
1999
2000
2001
2002
2003
2004
2005
2006
2007
2008
2009
2010
2011
2012
2013
Tota
l Pho
spho
rus (
mg/
L)
Tota
l Nitr
ogen
(mg/
L)Lake Bonny - Nutrient Annual Geometric Means
Total Nitrogen Total Phosphorus
0
10
20
30
40
50
60
70
0
20
40
60
80
100
120
140
160
180
1998
1999
2000
2001
2002
2003
2004
2005
2006
2007
2008
2009
2010
2011
2012
2013
Rain
fall
(inch
es)
Annu
al G
eom
etric
Mea
nCo
rrec
ted
Chlo
roph
yll a
(µg/
L)
Lake Bonny - Chlorophyll a and Rainfall
Corrected Chlorophyll a Polk County Rainfall - SWFWMDLong-Term Average Rainfall

Nutrient TMDL Report for Lake Bonny: September 2016
24
Figure 5.3 Relationship Between Lake Bonny Chlorophyll a Annual Geometric Means and Annual Rainfall.
Figure 5.4 Relationship Between Annual Geometric Means of Chlorophyll a and Total Nitrogen in Lake Bonny.
y = -2.7067x + 212.59R² = 0.346, p < 0.05
0
20
40
60
80
100
120
140
160
180
0 10 20 30 40 50 60 70
Annu
al G
eom
etric
Mea
nCo
rrec
ted
Chlo
roph
yll a
(µg/
L)
Annual Rainfall (inches)
Lake Bonny - Chlorophyll a vs. Rainfall1999 - 2012
y = 1.1404x + 1.3552R² = 0.9113, p < 0.05
0.0
0.5
1.0
1.5
2.0
2.5
0 0.2 0.4 0.6 0.8Log
of A
nnua
l Geo
met
ric M
ean
Chla
(µg/
L)
Log of Annual Geometric Mean TN (mg/L)
Lake Bonny (1497E) - Chlorophyll a vs. Total Nitrogen1999 - 2012

Nutrient TMDL Report for Lake Bonny: September 2016
25
Figure 5.5 Relationship Between Annual Geometric Means of Chlorophyll a and Total Phosphorus in Lake Bonny.
Figure 5.6 Lake Bonny Chlorophyll a Results and Lake Area Treated for Invasive Aquatic Plant Growth.
y = 0.8208x + 2.6105R² = 0.8923, p < 0.05
0.0
0.5
1.0
1.5
2.0
2.5
-1.4 -1.2 -1 -0.8 -0.6 -0.4 -0.2 0Log
of A
nnua
l Geo
met
ric M
ean
Chla
(µg/
L)
Log of Annual Geometric Mean TP (mg/L)
Lake Bonny (1497E) - Chlorophyll a vs. Total Phosphorus1999 - 2012
0%
10%
20%
30%
40%
50%
0
50
100
150
200
250
300
Jan-
99
Jan-
00
Jan-
01
Jan-
02
Jan-
03
Jan-
04
Jan-
05
Jan-
06
Jan-
07
Jan-
08
Jan-
09
Jan-
10
Jan-
11
Jan-
12
Perc
ent S
urfa
ce A
rea
Trea
ted
Corr
ecte
d Ch
loro
phyl
l a(µ
g/L)
Lake Bonny - WBID 1497ECorrected Chlorophyll a
Percent Treated Chlorophyll Conc

Nutrient TMDL Report for Lake Bonny: September 2016
26
5.3 The TMDL Development Process
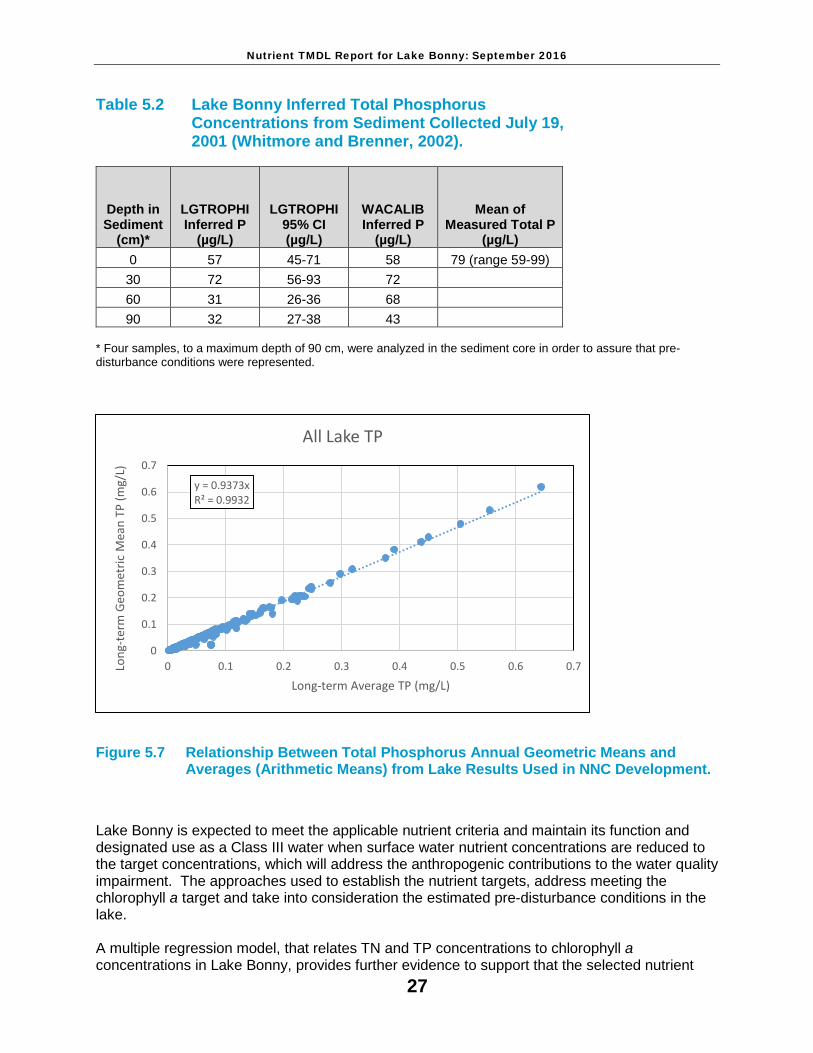
The method used for developing the nutrient TMDLs is a percent reduction approach, whereby the percent reductions in the existing lake TN and TP concentrations were calculated to meet the nutrient water quality targets. As discussed in Chapter 3, the NNC chlorophyll a threshold of 20 µg/L, expressed as an annual geometric mean, was selected as the response variable target for TMDL development. To identify the TN water quality target, the regression equation explaining the relationship between annual geometric mean chlorophyll a and TN, Figure 5.4, was used to determine the TN concentration necessary to meet the chlorophyll a target of 20 µg/L. An annual TN geometric mean of 0.89 mg/L results in a chlorophyll a annual geometric mean of 20 µg/L. The TP water quality target was derived in a different fashion to take into consideration the pre-disturbance inferred water quality from a paleolimnological study (Whitmore and Brenner, 2002). Although a significant relationship was found between annual geometric mean chlorophyll a and TP, Figure 5.5, the predicted TP concentration necessary to achieve the chlorophyll a target of 20 µg/L, using the regression equation, is less than the TP results obtained from the paleolimnological study. The study estimated pre-disturbance average TP levels by applying two statistical models that are based on sedimented diatoms and calibrated using a large number of Florida lakes (Whitmore 1989, Line et al. 1994). The predicted average TP results from the maximum sediment depth analyzed, which equates to pre-disturbance conditions, were 32 µg/L and 43 µg/L, Table 5.2. The inferred water quality in the deepest sediments analyzed are believed to represent conditions at least 100 years ago. Using the regression equation, a TP concentration of 25 µg/L results in a chlorophyll a concentration of 20 µg/L. As FL regulations prevent the abatement of natural conditions, an alternative method is needed to identify the TP target. The higher value in the TP range from the paleolimnological results, 43 µg/L, was selected as the TP target. Since the pre-disturbance TP results represent an estimate of average conditions, a method was applied to relate averages to geometric means using the lake dataset applied in NNC development. Using all the state-wide lake TP data, which were applied in the development of the lake NNC thresholds, (Florida DEP, 2012), the comparison of average and geometric mean values shows that there is a strong linear relationship, Figure 5.7. The expression of this relationship in the form of an equation is: TP geometric mean = TP average * 0.9373. In the case of Lake Bonny, the pre-disturbance average TP value is equivalent to a geometric mean of 40 µg/L. For TMDL development, a TP value of 40 µg/L expressed as a geometric mean is being applied as a water quality target.
Nutrient TMDL Report for Lake Bonny: September 2016
27
Table 5.2 Lake Bonny Inferred Total Phosphorus Concentrations from Sediment Collected July 19, 2001 (Whitmore and Brenner, 2002).
Depth in Sediment
(cm)*
LGTROPHI Inferred P
(µg/L)
LGTROPHI 95% CI (µg/L)
WACALIB Inferred P
(µg/L)
Mean of Measured Total P
(µg/L) 0 57 45-71 58 79 (range 59-99) 30 72 56-93 72 60 31 26-36 68 90 32 27-38 43
* Four samples, to a maximum depth of 90 cm, were analyzed in the sediment core in order to assure that pre-disturbance conditions were represented.
Figure 5.7 Relationship Between Total Phosphorus Annual Geometric Means and Averages (Arithmetic Means) from Lake Results Used in NNC Development.
Lake Bonny is expected to meet the applicable nutrient criteria and maintain its function and designated use as a Class III water when surface water nutrient concentrations are reduced to the target concentrations, which will address the anthropogenic contributions to the water quality impairment. The approaches used to establish the nutrient targets, address meeting the chlorophyll a target and take into consideration the estimated pre-disturbance conditions in the lake. A multiple regression model, that relates TN and TP concentrations to chlorophyll a concentrations in Lake Bonny, provides further evidence to support that the selected nutrient
y = 0.9373xR² = 0.9932
0
0.1
0.2
0.3
0.4
0.5
0.6
0.7
0 0.1 0.2 0.3 0.4 0.5 0.6 0.7Long
-ter
m G
eom
etric
Mea
n TP
(mg/
L)
Long-term Average TP (mg/L)
All Lake TP

Nutrient TMDL Report for Lake Bonny: September 2016
28
targets can achieve the chlorophyll a target of 20 µg/L. The model was developed using log-transformed annual geometric means of corrected chlorophyll a, TN, and TP concentrations calculated from Polk County lake measurements recorded in the 1999 to 2014 period. The results of the multiple regression analyses are presented in Appendix F, and the resultant equation is as follows: Log of Annual Geo Mean Chl a = 1.9 + 0.7 * Polk Co. Sta. 1 TN Log of Annual Geo Mean + 0.4 * Polk Co. Sta. 1 TP Log of Annual Geo Mean Applying the TN and TP annual geometric mean TMDL targets in the equation, results in a chlorophyll a value of 20 µg/L. Existing lake nutrient conditions used in establishing the TMDLs were the conditions measured in the 2002-2012 period. This period includes the entire Cycle 2 verified period and water quality in more recent years. The existing nutrient conditions used in the percent reduction calculation are the median values of the TN and TP annual geometric means that exceed the water quality targets. The geometric means were calculated from nutrient results available in IWR Database Run 48. All of the annual TN and TP geometric means in the 2002-2012 period exceed the water quality targets, Table 5.3. In this case, the use of the median of the geometric mean values is considered a conservative assumption for establishing reductions to address anthropogenic watershed runoff contributions because the lake results indicate that the chlorophyll a annual geometric means are inversely related to rainfall. The equation used to calculate the percent reduction is as follows:
[measured exceedance – target] X 100 measured exceedance
The measured exceedances in this case are the medians of the TN and TP annual geometric mean values that exceed the water quality targets. For the existing geometric mean TN concentration of 2.46 mg/L to achieve the target concentration of 0.89 mg/L, a 64 percent reduction in the lake TN concentration is necessary. A 60 percent reduction in the existing annual geometric mean TP concentration of 0.10 mg/L is necessary to meet the target concentration of 0.04 mg/L. These nutrient TMDL values, which are expressed as annual geometric means, address the anthropogenic nutrient inputs which contribute to the exceedances of the chlorophyll a restoration target.

Nutrient TMDL Report for Lake Bonny: September 2016
29
Table 5.3 Lake Bonny Nutrient Annual Geometric Means Used to Calculate the Percent Reductions Needed to Meet the Water Quality Targets.
Year
IWR Run 48 TN
Annual Geometric
Mean (mg/L)
IWR Run 48 TP
Annual Geometric
Mean (mg/L)
2002 2.60 0.10 2003 1.43 0.05 2004 ID ID 2005 1.61 ID 2006 2.32 ID 2007 4.25 0.23 2008 5.67 0.36 2009 ID ID 2010 ID ID 2011 2.59 0.10 2012 2.06 0.09
Median 2.46 0.10 ID - Insufficient Data to Calculate Geometric Means per the Requirements of Rule 62-303.
5.4 Critical Conditions
The estimated assimilative capacity is based on annual conditions, rather than critical/seasonal conditions because (a) the methodology used to determine the assimilative capacity does not lend itself very well to short-term assessments, (b) the Department is generally more concerned with the net change in overall primary productivity in the segment, which is better addressed on an annual basis, and (c) the methodology used to determine impairment is based on annual conditions (annual geometric means or arithmetic means).

Nutrient TMDL Report for Lake Bonny: September 2016
30
Chapter 6: DETERMINATION OF THE TMDL
6.1 Expression and Allocation of the TMDL
A TMDL can be expressed as the sum of all point source loads (wasteload allocations or WLAs), nonpoint source loads (load allocations or LAs), and an appropriate margin of safety (MOS) that takes into account any uncertainty about the relationship between effluent limitations and water quality: As mentioned previously, the WLA is broken out into separate subcategories for wastewater discharges and stormwater discharges regulated under the NPDES Program:
TMDL ≅ ∑ WLAswastewater + ∑ WLAsNPDES Stormwater + ∑ LAs + MOS
It should be noted that the various components of the TMDL equation may not sum up to the value of the TMDL because a) the WLA for NPDES stormwater is typically based on the percent reduction needed for nonpoint sources and is accounted for within the LA, and b) TMDL components can be expressed in different terms [for example, the WLA for stormwater is typically expressed as a percent reduction and the WLA for wastewater is typically expressed as a mass per day]. WLAs for stormwater discharges are typically expressed as “percent reduction” because it is very difficult to quantify the loads from MS4s (given the numerous discharge points) and to distinguish loads from MS4s from other nonpoint sources (given the nature of stormwater transport). The permitting of stormwater discharges is also different than the permitting of most wastewater point sources. Because stormwater discharges cannot be centrally collected, monitored and treated, they are not subject to the same types of effluent limitations as wastewater facilities, and instead are required to meet a performance standard of providing treatment to the “maximum extent practical” through the implementation of Best Management Practices. This approach is consistent with federal regulations [40 CFR § 130.2(I)], which state that TMDLs can be expressed in terms of mass per time (e.g. pounds per day), toxicity, or other appropriate measure. The TMDLs for Lake Bonny are expressed in terms of nutrient concentration targets and the percent reductions for nonpoint sources necessary to meet the targets, Table 6.1, and represent the maximum lake nutrient concentrations the surface water can assimilate to meet the applicable nutrient criteria. The TMDLs will constitute the site specific numeric interpretation of the narrative nutrient criterion set forth in paragraph 62-302.530(47)(b), Florida Administrative Code (F.A.C.), that will replace the otherwise applicable numeric nutrient criteria in subsection 62-302.531(2) for this particular water, pursuant to paragraph 62-302.531(2)(a) F.A.C.

Nutrient TMDL Report for Lake Bonny: September 2016
31
Table 6.1. TMDL Components for Lake Bonny
WBID Parameter TMDL (mg/L)1
WLA Wastewater
(lbs/year)
WLA NPDES
Stormwater (% Reduction)2
LA (% Reduction)2 MOS
1497E Total Nitrogen 0.89 NA 64% 64% Implicit
1497E Total Phosphorus 0.04 NA 60% 60% Implicit
1 Represents the annual geometric mean lake value that is not to be exceeded. 2 As the TMDL represents a percent reduction, it also complies with EPA requirements to express the TMDL on a daily basis. NA - Not Applicable
6.2 Load Allocation (LA)
A total nitrogen reduction of 64 percent and a total phosphorus reduction of 60 percent is required from nonpoint sources. It should be noted that the load allocation includes loading from stormwater discharges that are not part of the NPDES Stormwater Program.
6.3 Wasteload Allocation (WLA)
6.3.1 NPDES Wastewater Discharges
There are no NPDES wastewater facilities that discharge directly to Lake Bonny or its watershed. As such, a WLA for wastewater discharges is not applicable.
6.3.2 NPDES Stormwater Discharges
Polk County and Co- Permittees (FDOT District 1 and the City of Lakeland) are covered by a Phase I NPDES municipal separate storm sewer system (MS4) permit (FLS000015) and areas within their jurisdiction in the Lake Bonny watershed may be responsible for a 64 percent total nitrogen reduction and a 60 percent total phosphorus reduction in current anthropogenic loading. It should be noted that any MS4 permittee is only responsible for reducing the anthropogenic loads associated with stormwater outfalls that it owns or otherwise has responsible control over, and it is not responsible for reducing other nonpoint source loads in its jurisdiction.
6.4 Margin of Safety (MOS)
TMDLs must address uncertainty issues by incorporating a MOS into the analysis. The MOS is a required component of a TMDL and accounts for the uncertainty about the relationship between pollutant loads and the quality of the receiving waterbody [Clean Water Act, Section 303(d)(1)(c)]. Considerable uncertainty is usually inherent in estimating nutrient loading from nonpoint sources, as well as predicting water quality response. The effectiveness of

Nutrient TMDL Report for Lake Bonny: September 2016
32
management activities (e.g., stormwater management plans) in reducing loading is also subject to uncertainty. The MOS can either be implicitly accounted for by choosing conservative assumptions about loading or water quality response, or explicitly accounted for during the allocation of loadings. Consistent with the recommendations of the Allocation Technical Advisory Committee (Florida Department of Environmental Protection, February 2001), an implicit margin of safety (MOS) was used in the development of these TMDLs because of the conservative assumptions that were applied. The TMDLs were developed using water quality results from both high and low rainfall years during a period when lake chlorophyll a concentrations tended to be inversely related to rainfall.

Nutrient TMDL Report for Lake Bonny: September 2016
33
Chapter 7: NEXT STEPS: IMPLEMENTATION PLAN DEVELOPMENT AND BEYOND 7.1 Implementation Mechanisms
Following the adoption of a TMDL, implementation takes place through various measures. Implementation of TMDLs may occur through specific requirements in NPDES wastewater and municipal separate storm sewer (MS4) permits, and, as appropriate, through local or regional water quality initiatives or Basin Management Action Plans (BMAPs). Facilities with NPDES permits that discharge to the TMDL waterbody must respond to the permit conditions that reflect target concentrations, reductions, or wasteload allocations identified in the TMDL. NPDES permits are required for Phase I and Phase II MS4s as well as domestic and industrial wastewater facilities. MS4 Phase I permits require that the permit holder prioritize and take action to address a TMDL unless their management actions are already defined in a BMAP. MS4 Phase II permit holders must also implement responsibilities defined in a BMAP.
7.2 Basin Management Action Plans
BMAPs are discretionary and are not initiated for all TMDLs. A BMAP is a TMDL implementation tool that integrates the appropriate management strategies applicable through the existing water quality protection programs. The Department or a local entity may develop a BMAP that addresses some or all of the contributing areas to the TMDL waterbody. Section 403.067, Florida Statutes, called the “Florida Watershed Restoration Act” provides for the development and implementation of BMAPs. BMAPs are adopted by the Secretary of the Department and are legally enforceable. BMAPs describe the management strategies that will be implemented as well as funding strategies, project tracking mechanisms, water quality monitoring, as well as fair and equitable allocations of pollution reduction responsibilities to the sources in the watershed. BMAPs also identify mechanisms to address potential pollutant loading from future growth and development. The most important component of a BMAP is the list of management strategies to reduce the pollution sources, as these are the activities needed to implement the TMDL. The local entities that will conduct these management strategies are identified and their responsibilities are enforceable. Management strategies may include wastewater treatment upgrades, stormwater improvements, and agricultural best management practices. Additional information about BMAPs is available at the following Department web site: http://www.dep.state.fl.us/water/watersheds/bmap.htm

Nutrient TMDL Report for Lake Bonny: September 2016
34
7.3 Implementation Considerations for Lake Bonny
In addition to addressing reductions in watershed pollutant contributions to impaired waters during the implementation phase, it may also be necessary to consider the impacts of internal sources (e.g., sediment nutrient fluxes or the presence of nitrogen-fixing cyanobacteria) and the results of any associated remediation projects on surface water quality. In the case of Lake Bonny, the previous watershed and waterbody modeling effort and the recent phytoplankton monitoring suggest that other factors besides external loading inputs, such as sediment nutrient fluxes and/or nitrogen fixation, are also influencing the lake nutrient budgets and the growth of phytoplankton. Approaches for addressing these other factors should be included in a comprehensive management plan for the lake.

Nutrient TMDL Report for Lake Bonny: September 2016
35
References City of Lakeland, 2005. Lakeland 2005 Capital Improvement Projects. Prepared by the City of Lakeland, Public Works Department, Lakes and Stormwater Division, Lakeland, Florida. City of Lakeland, 2010. City of Lakeland 2009 Lakes Report. Prepared by the City of Lakeland Division of Lakes and Stormwater, Lakeland, Florida, September 2010. Conley, D.J., H. W. Paerl, R.W. Howarth, D.F. Boesch, S.P. Seitzinger, K.E. Havens, C. Lancelot, and G.E. Likens. 2009. Controlling eutrophication: Nitrogen and phosphorus. Science 323: 1014-1015. Florida Department of Environmental Protection, February 2001. A Report to the Governor and the Legislature on the Allocation of Total Maximum Daily Loads in Florida. Florida Department of Environmental Protection, Allocation Technical Advisory Committee, Division of Water Resource Management, Bureau of Watershed Management, Tallahassee, Florida. —, April 2001. Chapter 62-303, Identification of Impaired Surface Waters Rule (IWR), Florida Administrative Code. Florida Department of Environmental Protection, Division of Water Resource Management, Bureau of Watershed Management, Tallahassee, Florida. —, June 2004. Division of Water Resource Management, Bureau of Information Systems, Geographic Information Systems Section, Florida Department of Environmental Protection, Tallahassee, Florida. Available at http://www.dep.state.fl.us/gis/contact.htm —, October 2004. Group 3 Sarasota Bay and Peace and Myakka Rivers Water Quality Assessment Report. Florida Department of Environmental Protection, Division of Water Resource Management, Watershed Assessment Section, Southwest District, Group 3 Basin, Tallahassee, Florida. —, October 2005. Nutrient TMDL For Lake Bonny (WBID 1497E). Draft Report Prepared by Florida Department of Environmental Protection, Division of Water Resource Management, Bureau of Watershed Management, Tallahassee, Florida. —, 2012. Technical Support Document: Development of Numeric Nutrient Criteria for Florida Lakes, Spring Vents and Streams. Division of Environmental Assessment and Restoration, Standards and Assessment Section. Tallahassee, FL. —, August 2013. Chapter 62-302, Surface Water Quality Standards, Florida Administrative Code (F.A.C.), Division of Environmental Assessment and Restoration. Tallahassee, Florida. Florida Department of Transportation, 1999. Florida Land Use, Cover and Forms Classification System (FLUCCS). Florida Department of Transportation Thematic Mapping Section. FWRA, 1999. Florida Watershed Restoration Act, Chapter 99-223, Laws of Florida. Griffith, G. E., D. E. Canfield, Jr., C. A. Horsburgh, and J. M Omernik. 1997. Lake Regions of Florida. EPA/R-97/127, USEPA, Corvallis, OR. Lewis, W.M., W.A. Wurtsbaugh, and H.W. Paerl. 2011. Rationale for control of anthropogenic nitrogen and phosphorus in inland waters. Environmental Science & Technology 45:10300-10305.

Nutrient TMDL Report for Lake Bonny: September 2016
36
Line, J.M., C.F. ter Braak, and H.J. Birks. 1994. WACALIB version 3.3 - a computer program to reconstruct environmental variables from fossil assemblages by weighted averaging and to derive sample specific errors of prediction. Journal of Paleolimnology 10: 147-152. Paerl, H.W. 2009. Controlling eutrophication along the freshwater-marine continuum: dual nutrient (N and P) reductions are essential. Estuaries and Coasts 32: 593-601. Paerl, H.W. and T.G. Otten. 2013. Harmful cyanobacterial blooms: Causes, consequences and controls. Microbial Ecology 65: 995-1010. Polk County, 2002. Polk County 2002 Annual Lake and Stream Report. Prepared for the Polk County Board of County Commissioners. Published by the Environmental Services Department, Natural Resources Division, Polk County, Florida. Available at http://www.polk.wateratlas.usf.edu/upload/documents/2002Lk_StrRpt.pdf. Polk County, 2005. Polk County Water Atlas Homepage. Available at http://www.polk.wateratlas.usf.edu/. Southwest Florida Water Management District. August, 2004. Background Information on the Peace River Basin. Resource Conservation & Development Department. U. S. Environmental Protection Agency, April 1991. Guidance for Water Quality – Based Decisions: The TMDL Process. U. S. Environmental Protection Agency, Office of Water, Washington, D.C. EPA-440/4-91-001. —, November 1999. Protocol for Developing Nutrient TMDLs. U. S. Environmental Protection Agency, Office of Water, Washington, D.C. EPA841-B-99-007. —, March 2006. Nutrient TMDL For Lake Bonny (WBID 1497E). U. S. Environmental Protection Agency, Region 4, Atlanta, Georgia. —, July 2003. 40 CFR 130.2(I), Title 40 – Protection of the Environment, Chapter I – U.S. Environmental Protection Agency, Part 130 – Water Quality Planning and Management, U.S. Environmental Protection Agency, Washington, D.C. Whitmore, T.J. 1989. Florida diatom assemblages as indicators of trophic state and pH. Limnology and Oceanography. 34: 882-895. Whitmore, T.J., and M. Brenner. 2002. Paleolimnological Characterization of Pre-disturbance Water Quality Conditions in EPA-Defined Florida Lake Regions. Final Report to the Florida Department of Environmental Protection. Gainesville, Florida: University of Florida, Department of Fisheries and Aquatic Sciences. U. S. Census Bureau Web Site. 2014. Available at: http://quickfacts.census.gov/qfd/states/12/12105.html

Nutrient TMDL Report for Lake Bonny: September 2016
37
Appendix A: Background Information on Federal and State Stormwater Programs In 1982, Florida became the first state in the country to implement statewide regulations to address the issue of nonpoint source pollution by requiring new development and redevelopment to treat stormwater before it is discharged. The Stormwater Rule, as authorized in Chapter 403, F.S., was established as a technology-based program that relies on the implementation of BMPs that are designed to achieve a specific level of treatment (i.e., performance standards) as set forth in Chapter 62-40, F.A.C. The rule requires the state’s water management districts (WMDs) to establish stormwater pollutant load reduction goals (PLRGs) and adopt them as part of a SWIM plan, other watershed plan, or rule. Stormwater PLRGs are a major component of the load allocation part of a TMDL. To date, stormwater PLRGs have been established for Tampa Bay, Lake Thonotosassa, the Winter Haven Chain of Lakes, the Everglades, Lake Okeechobee, and Lake Apopka. In 1987, the U.S. Congress established Section 402(p) as part of the federal Clean Water Act Reauthorization. This section of the law amended the scope of the federal NPDES stormwater permitting program to designate certain stormwater discharges as “point sources” of pollution. These stormwater discharges include certain discharges that are associated with industrial activities designated by specific Standard Industrial Classification (SIC) codes, construction sites disturbing five or more acres of land, and master drainage systems of local governments with a population above 100,000, which are better known as municipal separate storm sewer systems (MS4s). However, because the master drainage systems of most local governments in Florida are interconnected, the EPA has implemented Phase 1 of the MS4 permitting program on a countywide basis, which brings in all cities (incorporated areas), Chapter 298 urban water control districts, and the Florida Department of Transportation throughout the fifteen counties meeting the population criteria. An important difference between the federal and state stormwater permitting programs is that the federal program covers both new and existing discharges, while the state program focuses on new discharges. Additionally, Phase 2 of the NPDES Program will expand the need for these permits to construction sites between one and five acres, and to local governments with as few as 10,000 people. These revised rules require that these additional activities obtain permits by 2003. While these urban stormwater discharges are now technically referred to as “point sources” for the purpose of regulation, they are still diffuse sources of pollution that cannot be easily collected and treated by a central treatment facility similar to other point sources of pollution, such as domestic and industrial wastewater discharges. The Department recently accepted delegation from the EPA for the stormwater part of the NPDES Program. It should be noted that most MS4 permits issued in Florida include a re-opener clause that allows permit revisions to implement TMDLs once they are formally adopted by rule.

Nutrient TMDL Report for Lake Bonny: September 2016
38
Appendix B: Graphs of Surface Water Quality Results
0
50
100
150
200
250
300
Jan-
95
Jan-
96
Jan-
97
Jan-
98
Jan-
99
Jan-
00
Jan-
01
Jan-
02
Jan-
03
Jan-
04
Jan-
05
Jan-
06
Jan-
07
Jan-
08
Jan-
09
Jan-
10
Jan-
11
Jan-
12
Jan-
13
Corr
ecte
d Ch
loro
phyl
l a(µ
g/L)
Lake Bonny - WBID 1497ECorrected Chlorophyll a
21FLPOLKBONNY1 21FLSWFDBONNY 21FLPOLKLTL BONNY1
21FLSWFDSTA0411 21FLA 25020128
02468
10121416
Jan-
75Ja
n-76
Jan-
77Ja
n-78
Jan-
79Ja
n-80
Jan-
81Ja
n-82
Jan-
83Ja
n-84
Jan-
85Ja
n-86
Jan-
87Ja
n-88
Jan-
89Ja
n-90
Jan-
91Ja
n-92
Jan-
93Ja
n-94
Jan-
95Ja
n-96
Jan-
97Ja
n-98
Jan-
99Ja
n-00
Jan-
01Ja
n-02
Jan-
03Ja
n-04
Jan-
05Ja
n-06
Jan-
07Ja
n-08
Jan-
09Ja
n-10
Jan-
11Ja
n-12
Jan-
13
Tota
l Nitr
ogen
(mg/
L)
Lake Bonny - WBID 1497ETotal Nitrogen
21FLA 25020128 21FLA 25020241 21FLKWATPOL-BONNY-121FLKWATPOL-BONNY-2 21FLKWATPOL-BONNY-3 21FLPOLKBONNY121FLPOLKBONNY2 21FLPOLKBONNY3 21FLPOLKBONNY521FLPOLKLTL BONNY1 21FLSWFDBONNY 21FLSWFDSTA0411

Nutrient TMDL Report for Lake Bonny: September 2016
39
0.00.10.20.30.40.50.60.70.80.91.0
Jan-
86Ja
n-87
Jan-
88Ja
n-89
Jan-
90Ja
n-91
Jan-
92Ja
n-93
Jan-
94Ja
n-95
Jan-
96Ja
n-97
Jan-
98Ja
n-99
Jan-
00Ja
n-01
Jan-
02Ja
n-03
Jan-
04Ja
n-05
Jan-
06Ja
n-07
Jan-
08Ja
n-09
Jan-
10Ja
n-11
Jan-
12Ja
n-13
Tota
l Pho
spho
rus (
mg/
L)Lake Bonny - WBID 1497E
Total Phosphorus
21FLA 25020128 21FLKWATPOL-BONNY-1 21FLKWATPOL-BONNY-221FLKWATPOL-BONNY-3 21FLPOLKBONNY1 21FLPOLKBONNY221FLPOLKBONNY3 21FLPOLKBONNY5 21FLPOLKLTL BONNY121FLSWFDBONNY 21FLSWFDSTA0411
0
10
20
30
40
50
60
70
80
Jan-
86Ja
n-87
Jan-
88Ja
n-89
Jan-
90Ja
n-91
Jan-
92Ja
n-93
Jan-
94Ja
n-95
Jan-
96Ja
n-97
Jan-
98Ja
n-99
Jan-
00Ja
n-01
Jan-
02Ja
n-03
Jan-
04Ja
n-05
Jan-
06Ja
n-07
Jan-
08Ja
n-09
Jan-
10Ja
n-11
Jan-
12Ja
n-13
Colo
r (PC
U)
Lake Bonny - WBID 1497EColor
21FLA 25020128 21FLPOLKBONNY1 21FLPOLKBONNY2 21FLPOLKBONNY321FLPOLKBONNY5 21FLPOLKLTL BONNY1 21FLSWFDBONNY 21FLSWFDSTA0411

Nutrient TMDL Report for Lake Bonny: September 2016
40
0
10
20
30
40
50
60
70
80
Jan-
75Ja
n-76
Jan-
77Ja
n-78
Jan-
79Ja
n-80
Jan-
81Ja
n-82
Jan-
83Ja
n-84
Jan-
85Ja
n-86
Jan-
87Ja
n-88
Jan-
89Ja
n-90
Jan-
91Ja
n-92
Jan-
93Ja
n-94
Jan-
95Ja
n-96
Jan-
97Ja
n-98
Jan-
99Ja
n-00
Jan-
01Ja
n-02
Jan-
03Ja
n-04
Jan-
05Ja
n-06
Jan-
07Ja
n-08
Jan-
09Ja
n-10
Jan-
11Ja
n-12
Jan-
13
Alka
linity
(mg/
L)Lake Bonny - WBID 1497E
Alkalinity
21FLA 25020241 21FLPOLKBONNY1 21FLPOLKBONNY2
21FLPOLKBONNY3 21FLPOLKLTL BONNY1

Nutrient TMDL Report for Lake Bonny: September 2016
41
Appendix C: Lake Bonny Phytoplankton Results – Collected June 27, 2013
Phylum Class Order Family Genus Taxon Name (#
counted) (# per mL)
Phylum (%)
Bacillariophyta Bacillariophyta Bacillariophyta Bacillariophyta Bacillariophyta Bacillariophyta 16 5,869 5.3 Chlorophycota Chlorophyceae Chlorococcales Chlorococcaceae Chlorococcum Chlorococcum humicola 1 367 Chlorophycota Chlorophyceae Zygnematales Desmidiaceae Closterium Closterium gracile 1 367 Chlorophycota Chlorophyceae Chlorococcales Scenedesmaceae Crucigenia Crucigenia tetrapedia 1 367 Chlorophycota Chlorophyceae Chlorococcales Scenedesmaceae Scenedesmus Scenedesmus abundans 1 367 Chlorophycota Chlorophyceae Chlorococcales Chlorococcaceae Schroederia Schroederia judayi 1 367 Chlorophycota Chlorophyceae Chlorococcales Chlorococcaceae Tetraedron Tetraedron caudatum 1 367
Chlorophycota Chlorophyceae Volvocales Chlamydomonadaceae Chlamydomonas Chlamydomonas 2 734
Chlorophycota Chlorophyceae Zygnematales Desmidiaceae Cosmarium Cosmarium emarginatum 2 734 Chlorophycota Chlorophyceae Chlorococcales Hydrodictyaceae Pediastrum Pediastrum obtusum 2 734 Chlorophycota Chlorophyceae Chlorococcales Scenedesmaceae Scenedesmus Scenedesmus arcuatus 2 734 Chlorophycota Chlorophyceae Chlorococcales Scenedesmaceae Scenedesmus Scenedesmus bijuga 2 734 Chlorophycota Chlorophyceae Chlorococcales Scenedesmaceae Scenedesmus Scenedesmus dimorphus 2 734 Chlorophycota Chlorophyceae Zygnematales Desmidiaceae Staurastrum Staurastrum 2 734 Chlorophycota Chlorophyceae Chlorococcales Chlorococcaceae Tetraedron Tetraedron trigonum 2 734 Chlorophycota Chlorophyceae Chlorococcales Scenedesmaceae Actinastrum Actinastrum gracilimum 3 1,101 Chlorophycota Chlorophyceae Chlorococcales Oocystaceae Ankistrodesmus Ankistrodesmus falcatus 3 1,101 Chlorophycota Chlorophyceae Chlorococcales Dictyosphaeriaceae Botryococcus Botryococcus braunii 3 1,101 Chlorophycota Chlorophyceae Chlorococcales Oocystaceae Oocystis Oocystis 4 1,467 Chlorophycota Chlorophyceae Chlorococcales Scenedesmaceae Selenastrum Selenastrum 4 1,467 Chlorophycota Chlorophyceae Chlorococcales Chlorococcaceae Tetraedron Tetraedron regulare 4 1,467 Chlorophycota Chlorophyceae Chlorococcales Chlorococcaceae Tetraedron Tetraedron minimum 5 1,834 Chlorophycota Chlorophyceae Chlorococcales Scenedesmaceae Scenedesmus Scenedesmus quadricauda 7 2,568 Chlorophycota Chlorophyceae Chlorococcales Oocystaceae Chlorella Chlorella 10 3,668 Chlorophycota Chlorophyceae Chlorococcales Scenedesmaceae Crucigenia Crucigenia rectangularis 10 3,668 24.9

Nutrient TMDL Report for Lake Bonny: September 2016
42
Phylum Class Order Family Genus Taxon Name (#
counted) (# per mL)
Phylum (%)
Cryptophycophyta Cryptophyceae
Cryptomonadales Cryptomonadaceae Cryptomonas Cryptomonas 2 734 0.7
Cyanophycota Cyanophyceae Chroococcales Merismopediaceae Aphanocapsa Aphanocapsa elachista 2 734 Cyanophycota Cyanophyceae Chroococcales Merismopediaceae Aphanocapsa Aphanocapsa planctonica 2 734 Cyanophycota Cyanophyceae Chroococcales Merismopediaceae Merismopedia Merismopedia tenuissima 3 1,101
Cyanophycota Cyanophyceae Oscillatoriales Pseudanabaenaceae Romeria Romeria leopoliensis 3 1,101
Cyanophycota Cyanophyceae Chroococcales Microcystaceae Microcystis Microcystis aeruginosa 4 1,467 Cyanophycota Cyanophyceae Chroococcales Microcystaceae Microcystis Microcystis wesenbergii 5 1,834 Cyanophycota Cyanophyceae Nostocales Nostocaceae Aphanizomenon Aphanizomenon 7 2,568 Cyanophycota Cyanophyceae Chroococcales Merismopediaceae Merismopedia Merismopedia warmingiana 8 2,935 Cyanophycota Cyanophyceae Chroococcales Synechococcaceae Rhabdogloea Rhabdogloea 15 5,503
Cyanophycota Cyanophyceae Oscillatoriales Pseudanabaenaceae Planktolyngbya Planktolyngbya limnetica 18 6,603
Cyanophycota Cyanophyceae Nostocales Nostocaceae Cylindrospermopsis
Cylindrospermopsis raciborskii 20 7,337
Cyanophycota Cyanophyceae Oscillatoriales Pseudanabaenaceae Planktolyngbya Planktolyngbya contorta 20 7,337
Cyanophycota Cyanophyceae Oscillatoriales Pseudanabaenaceae Jaaginema Jaaginema gracile 21 7,704
Cyanophycota Cyanophyceae Chroococcales Chroococcaceae Synechocystis Synechocystis 77 28,247 68.1 Pyrrophycophyta Dinophyceae Peridiniales Glenodiniaceae Glenodinium Glenodinium 3 1,101 1 - - - - - - - - - - - - - - Total 301 110,425 100

Nutrient TMDL Report for Lake Bonny: September 2016
43
Appendix D: Water Quality Standards Template Document Table D-1. Spatial Extent of the Numeric Interpretation of the Narrative Nutrient Criterion: Documentation of location and descriptive information Waterbody Location Information Description of Waterbody Location Information
Waterbody Name Lake Bonny Waterbody Type(s) Lake Water Body ID (WBID) WBID 1497E (See Figure 1) Description Lake Bonny is located inside the City of Lakeland, Polk County,
Florida. The surface area of the lake is 249 acres and includes Little Lake Bonny, a small, once isolated seepage lake located along the southeastern part of the lake. The lake’s watershed encompasses 1,197 acres. The average lake volume is 3.9 * 108 gallons. The average depth of the lake is 3.0 ft., with a maximum depth of 11.2 ft. The lake outlet is connected to Lake Parker, which flows into upper Saddle Creek that in turn drains to Lake Hancock. Lake Hancock discharges to lower Saddle Creek, which along with the Peace Creek Drainage Canal, makes up the headwaters of the Peace River.
Specific Location (Latitude/ Longitude or River Miles)
The center of Lake Bonny is located at N: 280 2’20”/ W: -810
55’30”. The site specific criteria apply as a spatial average for the lake, as defined by WBID 1497E.
Map The general location of Lake Bonny and its watershed are shown in Figure 1, and the land uses of the watershed are shown in Figure 2 (provided at the end of this document). Land use is predominately urban, with approximately 40 percent of the land area developed into medium and high density residential areas. Other urban land uses include institutional land use (8.6 percent) and recreational land use (4.4 percent). Surface waters and wetlands combined cover 33 percent of the watershed, with wetlands, located primarily along the west shore of the lake, representing approximately 13 percent of the area.
Classification(s) Class III Freshwater Basin Name (HUC 8)
Peace River Basin (03100101)
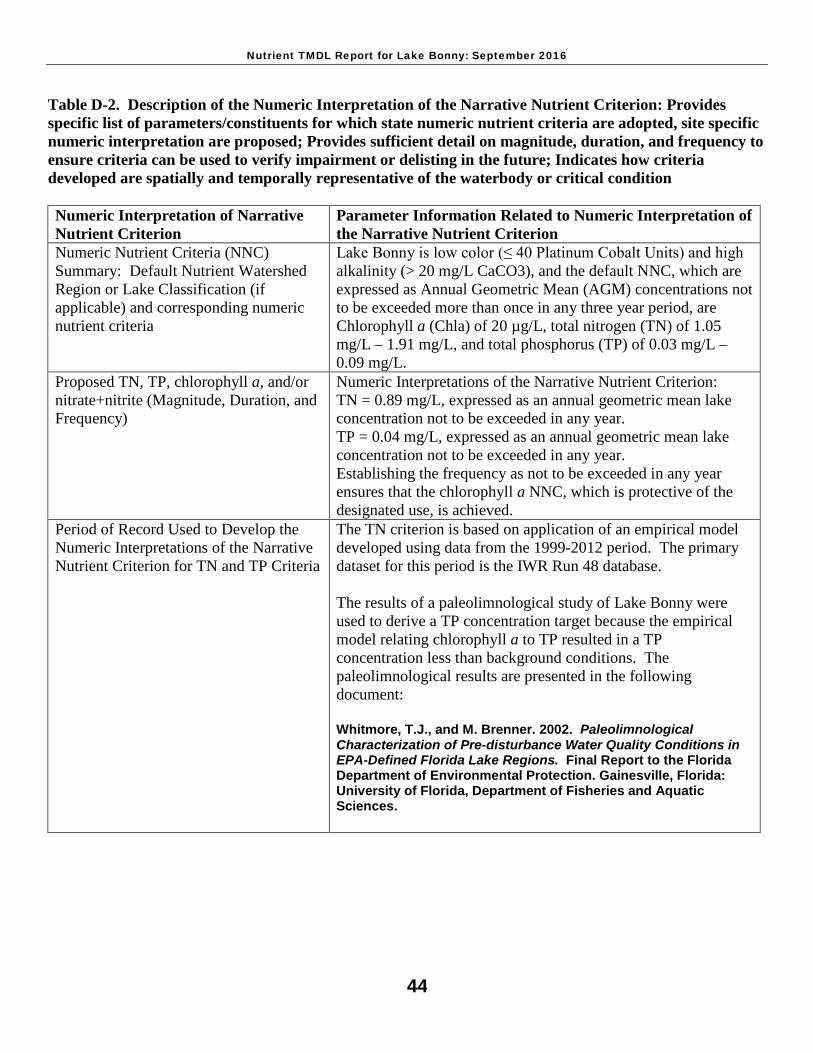
Nutrient TMDL Report for Lake Bonny: September 2016
44
Table D-2. Description of the Numeric Interpretation of the Narrative Nutrient Criterion: Provides specific list of parameters/constituents for which state numeric nutrient criteria are adopted, site specific numeric interpretation are proposed; Provides sufficient detail on magnitude, duration, and frequency to ensure criteria can be used to verify impairment or delisting in the future; Indicates how criteria developed are spatially and temporally representative of the waterbody or critical condition Numeric Interpretation of Narrative Nutrient Criterion
Parameter Information Related to Numeric Interpretation of the Narrative Nutrient Criterion
Numeric Nutrient Criteria (NNC) Summary: Default Nutrient Watershed Region or Lake Classification (if applicable) and corresponding numeric nutrient criteria
Lake Bonny is low color (≤ 40 Platinum Cobalt Units) and high alkalinity (> 20 mg/L CaCO3), and the default NNC, which are expressed as Annual Geometric Mean (AGM) concentrations not to be exceeded more than once in any three year period, are Chlorophyll a (Chla) of 20 µg/L, total nitrogen (TN) of 1.05 mg/L – 1.91 mg/L, and total phosphorus (TP) of 0.03 mg/L – 0.09 mg/L.
Proposed TN, TP, chlorophyll a, and/or nitrate+nitrite (Magnitude, Duration, and Frequency)
Numeric Interpretations of the Narrative Nutrient Criterion: TN = 0.89 mg/L, expressed as an annual geometric mean lake concentration not to be exceeded in any year. TP = 0.04 mg/L, expressed as an annual geometric mean lake concentration not to be exceeded in any year. Establishing the frequency as not to be exceeded in any year ensures that the chlorophyll a NNC, which is protective of the designated use, is achieved.
Period of Record Used to Develop the Numeric Interpretations of the Narrative Nutrient Criterion for TN and TP Criteria
The TN criterion is based on application of an empirical model developed using data from the 1999-2012 period. The primary dataset for this period is the IWR Run 48 database. The results of a paleolimnological study of Lake Bonny were used to derive a TP concentration target because the empirical model relating chlorophyll a to TP resulted in a TP concentration less than background conditions. The paleolimnological results are presented in the following document: Whitmore, T.J., and M. Brenner. 2002. Paleolimnological Characterization of Pre-disturbance Water Quality Conditions in EPA-Defined Florida Lake Regions. Final Report to the Florida Department of Environmental Protection. Gainesville, Florida: University of Florida, Department of Fisheries and Aquatic Sciences.

Nutrient TMDL Report for Lake Bonny: September 2016
45
Numeric Interpretation of Narrative Nutrient Criterion
Parameter Information Related to Numeric Interpretation of the Narrative Nutrient Criterion
Indicate how criteria developed are spatially and temporally representative of the waterbody or critical condition Are the stations used representative of the entire extent of the WBID and where the criteria area apply? In addition, for older TMDLs, an explanation of the representativeness of the data period is needed (e.g., has data or information become available since the TMDL analysis?). These details are critical to demonstrate why the resulting criteria will be protective as opposed to the otherwise applicable criteria (in cases where a numeric criterion is otherwise in effect unlike this case).
The water quality results applied in the analysis spanned the 1999 - 2012 period, which included both wet and dry years. The annual average rainfall for 1999-2012 was 48.2 inches/year. The years 2000, 2006, and 2007 were dry years, 2009 to 2011 were average years, and 2002, 2004, and 2005 were wet years. Figure 3 (below) shows the sampling stations in Lake Bonny. The Polk County data collected near the center of the lake at station 21FLPOLKBONNY1 were used to develop the regression equations relating nutrient concentrations to chlorophyll a levels. The majority of data were collected at this Polk County monitoring station; results collected at other lake sampling locations were similar to the results observed there. Water quality data for variables relevant to TMDL development are presented in graphs in the Appendix of the Lake Bonny TMDL report.

Nutrient TMDL Report for Lake Bonny: September 2016
46
Table D-3. Designated Use, Verified Impairment, and Approach to Establish Protective Restoration Targets: Summary of how the designated use(s) are demonstrated to be protected by the criteria; Summarizes the review associated with the more recent data collected since the development of the TMDL, and evaluates the current relevance of assumptions made in the TMDL development (most likely applicable for existing TMDLs that are subsequently submitted as changes to WQS); Contains sufficient data to establish and support the TMDL target concentrations or resulting loads Designated Use Requirements Information Related to Designated Use Requirements
History of assessment of designated use support.
Lake Bonny was initially verified as impaired during the Cycle 1 assessment (the verified period was January 1, 1997, to June 30, 2004) due to excessive nutrients because the Trophic State Index (TSI) threshold of 60 was exceeded using the methodology in the Identification of Impaired Surface Waters Rule (IWR) (Chapter 62-303, F.A.C.). As a result, the lake was included on the Cycle 1 Verified List of impaired waters for the Sarasota Bay-Peace River-Myakka River Basin that was adopted by Secretarial Order on June 17, 2005. During the Cycle 2 assessment (verified period of January 1, 2002, to June 30, 2009), the impairment for nutrients was documented as continuing, as the TSI threshold of 60 was exceeded.
Based on an analysis of the data from 2002 to 2012 in IWR Database Run 48, the results indicate that Lake Bonny would not attain the default lake NNC for chlorophyll a, TN, and TP for low color, high alkalinity lakes, and thus remains impaired for nutrients.
Quantitative indicator(s) of use support A Chla value of 20 µg/L was selected as the response variable
target for use in establishing the nutrient TMDLs. This target is based on information in the Department’s 2012 document titled, Technical Support Document: Development of Numeric Nutrient Criteria for Florida Lakes, Spring Vents and Streams, which demonstrates a Chla threshold of 20 µg/L is protective of designated uses for low color, high alkalinity lakes.
Summarize Approach Used to Develop Criteria and How it Protects Uses
The methods utilized to address the nutrient impairment included a) the development of regression equations that relate the lake TN and TP concentrations to the annual geometric mean chlorophyll a levels, and b) the evaluation of paleolimnological results to refine the water quality target for total phosphorus consistent with pre-disturbance conditions. The criteria are expressed as maximum annual geometric mean concentrations not to be exceeded in any year. Establishing the frequency as not to be exceeded in any year ensures that the chlorophyll a NNC, which is protective of the designated use, is achieved.

Nutrient TMDL Report for Lake Bonny: September 2016
47
Designated Use Requirements Information Related to Designated Use Requirements
Discuss how the TMDL will ensure that nutrient related parameters are attained to demonstrate that the TMDL will not negatively impact other water quality criteria. These parameters must be analyzed with the appropriate frequency and duration. If compliance with 47(a) is not indicated within the TMDL, it should be clear that further reductions may be required in the future.
The method indicated that the Chla concentration target for the lake will be attained at the TMDL in-lake TN concentration, frequency and duration, while taking into consideration the estimated pre-disturbance phosphorus condition in the lake. The Department notes that there were no impairments for nutrient- related parameters (such as DO or unionized ammonia). The proposed reductions in nutrient inputs will result in further improvements in water quality.

Nutrient TMDL Report for Lake Bonny: September 2016
48
Table D-4. Documentation of the Means to Attain and Maintain WQS of Downstream Waters Downstream Waters Protection and Monitoring Requirements
Information Related to Downstream Waters Protection and Monitoring Requirements
Identification of Downstream Waters: List receiving waters and identify technical justification for concluding downstream waters are protected.
Lake Parker and Saddle Creek are the nearest downstream waters to Lake Bonny. The Lake Bonny watershed comprises only 8 percent of the Lake Parker basin area. The existing Lake Bonny watershed TN and TP loads are only 9 percent and 7 percent, respectively, of the Lake Parker basin total nutrient loadings. The Lake Bonny nutrient concentration targets of 0.89 mg/L for TN and 0.04 mg/L for TP are less than the West Central Nutrient Watershed Region thresholds of 1.65 mg/L for TN and 0.49 mg/L for TP that are applicable to Saddle Creek. The West Central Nutrient Watershed Region stream thresholds, expressed as annual geometric means, may be exceeded once in a three year period and are higher than the annual geometric mean lake TMDL nutrient targets. Since the TMDL nutrient targets are lower than the stream nutrient thresholds for the area and are expressed as a frequency of “not to be exceeded in any year” the TMDL targets are clearly protective of the applicable stream thresholds. The reductions in nutrient concentrations prescribed in the TMDL are not expected to cause nutrient impairments downstream and will actually result in water quality improvements to downstream waters.
Provide summary of existing monitoring and assessment related to implementation of rule 62-302.531(4) and trends tests within Chapter 62-303, F.A.C.
Polk County conducts routine monitoring of Lake Parker, approximately four times per year. Future monitoring results from waters downstream of Lake Bonny, and from Lake Bonny itself, will be used to assess the effect of the established site specific numeric interpretation of the narrative nutrient criterion on the lake.

Nutrient TMDL Report for Lake Bonny: September 2016
49
Table D-5. Documentation to Demonstrate Administrative Requirements Are Met Administrative Requirements Information for Administrative Requirements Notice and comment notifications A public workshop was conducted by the Department on March
26, 2014 in Bartow, Florida to obtain comments on the draft nutrient TMDLs for four lakes in the Peace River Basin, including Lake Bonny. The workshop notice indicated that these nutrient TMDLs, if adopted, constitute site specific numeric interpretations of the narrative nutrient criterion set forth in paragraph 62-302.530(47)(b), F.A.C., that would replace the otherwise applicable numeric nutrient criteria in subsection 62-302.531(2) for these particular waters, upon paragraph 62-302.531(2)(a), F.A.C., becoming effective. No formal public comments were received at the workshop. In addition, a 30 day comment period was provided to allow opportunity for the general public to submit written comments to the Department. No formal comments were received related to the establishment of the TMDLs as the site specific interpretation of the narrative nutrient criteria or on the TMDLs themselves.
Hearing requirements and adoption format used; Responsiveness summary
The Notice of Proposed Rule for this TMDL was published in the Florida Administrative Register on November 26, 2014. No requests for a hearing were received during the 21-day challenge period. The rule for this TMDL, subsection 62-304.625(13), F.A.C., became effective on February 19, 2015.
Official submittal to EPA for review and GC Certification
The TMDLs were officially submitted to EPA on June 30, 2015.

Nutrient TMDL Report for Lake Bonny: September 2016
50
Figure 1. Location of the Lake Bonny Watershed in West Central Polk County, Florida

Nutrient TMDL Report for Lake Bonny: September 2016
51
Figure 2. Lake Bonny Watershed Land Use

Nutrient TMDL Report for Lake Bonny: September 2016
52
Figure 3. Lake Bonny Sampling Stations.
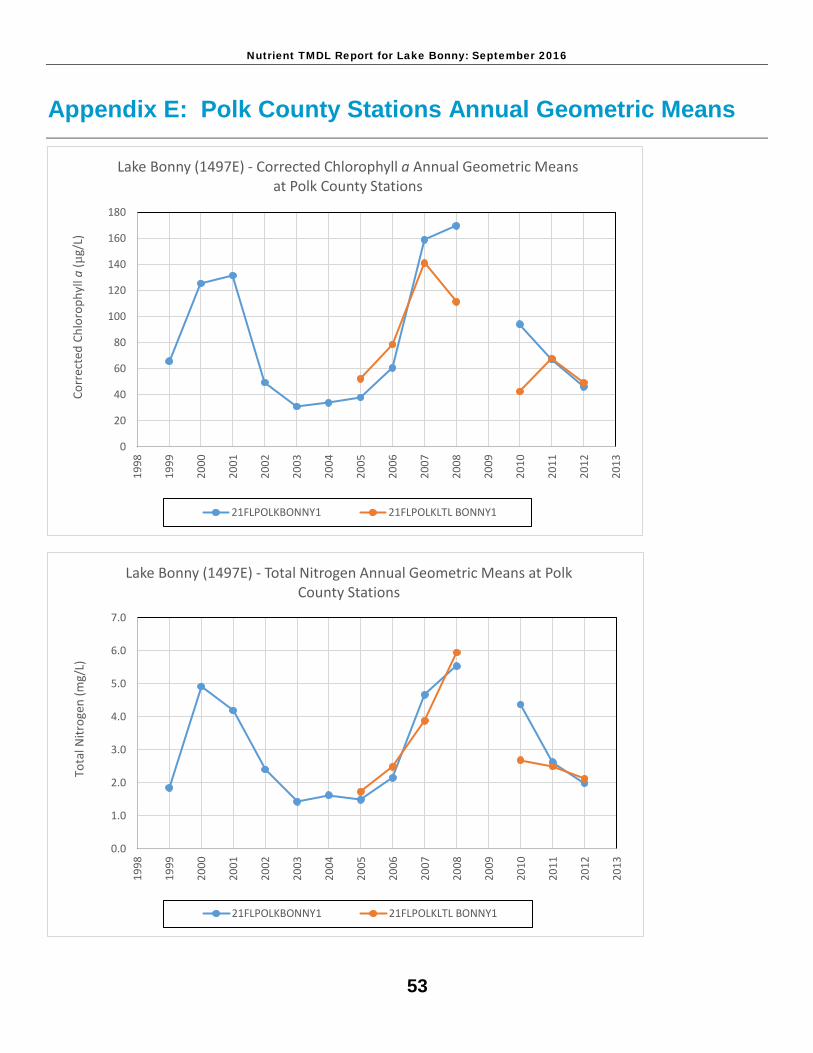
Nutrient TMDL Report for Lake Bonny: September 2016
53
Appendix E: Polk County Stations Annual Geometric Means
0
20
40
60
80
100
120
140
160
180
1998
1999
2000
2001
2002
2003
2004
2005
2006
2007
2008
2009
2010
2011
2012
2013
Corr
ecte
d Ch
loro
phyl
l a(µ
g/L)
Lake Bonny (1497E) - Corrected Chlorophyll a Annual Geometric Means at Polk County Stations
21FLPOLKBONNY1 21FLPOLKLTL BONNY1
0.0
1.0
2.0
3.0
4.0
5.0
6.0
7.0
1998
1999
2000
2001
2002
2003
2004
2005
2006
2007
2008
2009
2010
2011
2012
2013
Tota
l Nitr
ogen
(mg/
L)
Lake Bonny (1497E) - Total Nitrogen Annual Geometric Means at Polk County Stations
21FLPOLKBONNY1 21FLPOLKLTL BONNY1

Nutrient TMDL Report for Lake Bonny: September 2016
54
0.00
0.05
0.10
0.15
0.20
0.25
0.30
0.35
0.40
0.45
1998
1999
2000
2001
2002
2003
2004
2005
2006
2007
2008
2009
2010
2011
2012
2013
Tota
l Pho
spho
rus (
mg/
L)
Lake Bonny (1497E) - Total Phosphorus Annual Geometric Means at Polk County Stations
21FLPOLKBONNY1 21FLPOLKLTL BONNY1

Nutrient TMDL Report for Lake Bonny: September 2016
55
Appendix F: Lake Bonny Multiple Regression Model Results
Response Polk County Station 1 CHLAC Log of Annual Geometric Mean: Lake Bonny 1999-2014 Results Whole Model Actual by Predicted Plot
Summary of Fit RSquare 0.958172 RSquare Adj 0.9512 Root Mean Square Error 0.055978 Mean of Response 1.812925 Observations (or Sum Wgts) 15 Analysis of Variance Source DF Sum of
Squares Mean Square F Ratio
Model 2 0.86135569 0.430678 137.4433 Error 12 0.03760195 0.003133 Prob > F C. Total 14 0.89895764 <.0001*
1.4
1.5
1.6
1.7
1.8
1.9
2
2.1
2.2
2.3
Polk
Co.
Sta
. 1 C
HLA
C Lo
g of
Ann
ual G
eo M
ean
Actu
al
1.4 1.5 1.6 1.7 1.8 1.9 2 2.1 2.2 2.3
Sta. 1 CHLAC Log of Annual Geo Mean Predicted P<.0001 RSq=0.96 RMSE=0.056

Nutrient TMDL Report for Lake Bonny: September 2016
56
Parameter Estimates Term Estimate Std Error t Ratio Prob>|t| VIF Intercept 1.9449335 0.16715 11.64 <.0001* . Polk Co. Sta. 1 TN Log of Annual Geo Mean 0.6601247 0.155471 4.25 0.0011* 4.5549467 Polk Co. Sta. 1 TP Log of Annual Geo Mean 0.4192488 0.111551 3.76 0.0027* 4.5549467 Residual by Predicted Plot
Prediction Expression 1.9 + 0.7 * Polk Co. Sta. 1 TN Log of Annual Geo Mean + 0.4 * Polk Co. Sta. 1 TP Log of Annual Geo Mean
-0.10
-0.05
0.00
0.05
0.10
Polk
Co.
Sta
. 1 C
HLA
C Lo
g of
Ann
ual G
eo M
ean
Resid
ual
1.4 1.5 1.6 1.7 1.8 1.9 2 2.1 2.2 2.3
Polk Co. Sta. 1 CHLAC Log of Annual Geo Mean Predicted

Nutrient TMDL Report for Lake Bonny: September 2016
57
Lake Bonny Annual Geometric Means Used in the Multiple Regression Model
Year
Polk County Sta. 1
CHLAC Annual
Geometric Mean (µg/L)
Polk County
Sta. 1 TN Annual
Geometric Mean (mg/L)
Polk County
Sta. 1 TP Annual
Geometric Mean (mg/L)
1999 65.8 1.85 0.102 2000 125.4 4.92 0.308 2001 131.6 4.19 0.285 2002 49.5 2.40 0.062 2003 31.0 1.43 0.050 2004 34.0 1.63 0.048 2005 38.0 1.49 0.083 2006 60.7 2.15 0.114 2007 159.0 4.67 0.223 2008 169.7 5.54 0.335 2009 2010 94.2 4.37 0.119 2011 67.1 2.63 0.086 2012 46.3 1.99 0.082 2013 39.0 1.82 0.077 2014 38.8 1.98 0.059

Nutrient TMDL Report for Lake Bonny: September 2016
58