
FINAL DRAFT 12-6-12 Energy Strategy - Draft 12-6-12... · 2018-01-23 · FINAL DRAFT 12-6-12 ......
33
NVDA ENERGY STRATEGY PAGE 1 2020 Energy Strategy FINAL DRAFT 12-6-12 Northeastern Vermont Development Association This material based upon work supported by the Dept. of Energy and Vermont's Clean Energy Development Fund under Award Number DE-EE0000859
Transcript of FINAL DRAFT 12-6-12 Energy Strategy - Draft 12-6-12... · 2018-01-23 · FINAL DRAFT 12-6-12 ......

NVDA ENERGY STRATEGY PAGE 1
2020 Energy Strategy
FINAL DRAFT 12-6-12
Northeastern Vermont Development Association
This material based upon work supported by the Dept. of Energy and Vermont's Clean Energy Development Fund under Award Number DE-EE0000859
NVDA ENERGY STRATEGY PAGE 2
INTRODUCTION Northeastern Vermont Development Association (NVDA) originally prepared this plan as a supplement to the Regional Plan for the Northeast Kingdom 2006. The 2020 Energy Plan is an update to the 2011 Energy Plan (and a reflection of a statutory change that extended the life of regional plans to 8 years), which outlines a regional energy strategy for Northeastern Vermont, specifically the counties of Orleans, Essex, and Caledonia. NVDA’s statutory role in energy planning is outlined in V.S.A. Title 24, Chp.117 §4348a (3), which stipulates that a regional plan include:
An energy element, which may include an analysis of energy resources, needs, scarcities, costs and problems within the region, a statement of policy on the conservation of energy, and the development of renewable energy resources, and a statement of policy on patterns and densities of land use and control devices likely to result in conservation of energy.
In addition, NVDA is required to define what constitutes a ‘substantial regional impact’ with regards to development (24 V.S.A. Chp.117 §4345a (17)), because the definition is given due consideration in state regulatory proceedings. This definition is provided within Land Use section of the Regional Plan for the Northeast Kingdom 2006 (Chp.1, pg. 16).
Background Traditionally, NVDA approached energy planning from a strictly “supply-and-demand” perspective and this approach has generally supported the traditional systems that have continued to meet our regional energy needs. However, the energy trends of the last decade present NVDA with the challenge of addressing a much broader perspective, one that transcends current energy production and usage. At this time there are several factors that are creating a contentious climate for the future planning of our energy systems. Because of this, NVDA has expanded both its approach to energy planning and its role in regional energy policy. This new role has stemmed from public response to rather swift changes now occurring in the energy industry. In the past several years, the region has had to contemplate the effect of utility-scale wind development on our mountains; how to ensure forest sustainability as wood-fuels grow in popularity; and whether or not an aging nuclear plant can be replaced with other generation resources. In addition, throughout these dynamic times affordability has become the primary concern of public and business communities. Because of our statutory responsibility, NVDA, through this document, is giving relevant information regarding various energy resources and setting our regional energy agenda for the next eight years.
NVDA Energy Committee
The 2020 update has been overseen by an Energy Committee whose members include Jim Greenwood, Marty Feltus, Robert Croteau, and John Morley. NVDA committee staff included Planning Manager, Dave Snedeker, and Senior Planner, Laurie Stillwell.
NVDA ENERGY STRATEGY PAGE 3
Strategy Outline The Energy Strategy aims to guide the region’s energy development for the next eight years. In order to accomplish this task, the Energy Committee has analyzed the current conditions of the region, calculated future growth, and evaluated the potential for resources to meet future needs. From the findings, the Energy Committee has developed regional portfolio recommendations, and overall energy goals and strategies. The basic components of the Energy Strategy are organized into four main sections: REGIONAL OVERVIEW This section provides an evaluation of local consumption, energy sectors, electricity infrastructure and demand, and anticipated future growth in energy usage. RESOURCE ANALYSIS In this section resources are analyzed for their current and future potential as part of the overall energy portfolio. Both traditional sources are addressed, including fossil fuels, hydro-power, and nuclear power, as well as the advancing renewable sources, such as solar, methane, wind, and biomass. Efficiency/conservation is also addressed as an important piece to meeting future needs. NORTHEAST KINGDOM PORTFOLIO* This section provides recommendations for each resource addressed within the Resource Analysis. It also addresses other important non-resource aspects of the portfolio, such as net-metering, and efficiency/conservation. REGIONAL GOALS & STRATEGIES* This section presents the main goals for the next eight years of energy planning and identifies clear strategies to meet those goals. * Both the Northeast Kingdom Portfolio and the Regional Goals & Strategies include the guiding language for future energy development in the region.
REGIONAL OVERVIEW
Current Status of the Region The Northeast Kingdom’s energy trends have mimicked those of the state, and while the state has been subjected to the same energy issues occurring nationally, Vermont still remains a national role model for energy. Throughout the U.S., energy prices are rising due to the stress on traditional resources and increasing consumption levels. To address rising energy costs, Vermonters are turning more and more towards supplemental fuels, renewables, co-generation facilities, and efficiency/conservation efforts. In 2010 Vermont ranked 51st out of the entire U.S. in total

NVDA ENERGY STRATEGY PAGE 4
consumption of energy across all sectors and 42nd in per-capita consumption of total energy across all sectors1. In the past few years, the Northeast Kingdom has hosted electricity projects that have decreased transmission losses and improved reliability. The region is home to three major renewable generation facilities: the Ryegate Wood-Chip Plant, the Coventry Landfill methane-generator, and the Sheffield Wind Farm, which together produced 82% of the region’s total electricity generation (2010). The Vermont State Legislature has made several changes with energy legislation as well, including policies pertaining to distributive generation (net-metering), renewable energy (portfolio goals and incentives), the creation of an efficiency utility, and alternative fuels/vehicles. While Vermont continues to make changes in energy policy and infrastructure, there are some elements of the current energy system that negatively affect our region. The following overview proceeds to review all of the aspects of our energy system and pinpoint major elements that impact our region. CONSUMPTION Energy consumption has grown rather steadily since the 1950s. Historically, leaps in consumption are associated with major economic growth, low energy prices, population growth, and an overall increase in the number of vehicle miles driven. Vermont has traditionally ranked one of the lowest per capita energy consumption states in the nation. Table 2.1 represents the amount of energy consumed in the state in 2009. Regional figures for energy consumption are unavailable, but the Northeast Kingdom’s consumption by source is similar to the state’s breakdown. Petroleum products are by far the leading source of fuel in the state, most of which is used in the transportation and residential heating sectors (Table 2.2).
Table 2.3 outlines Vermont’s energy usage by sector between 1993 and 2009. Over these years consumption has grown rather steadily, with major growth seen in particular sectors. Transportation energy usage has remained relatively steady over this period, most likely a result of an increase in fuel
1 U.S. Energy Information Administration: State Energy Consumption Estimates 1960-2010. http://www.eia.gov/state/seds/sep_use/notes/use_print.pdf
Source Trillion BTUs*
Coal 0
Natural Gas 8.7
Petroleum Products 82.2
Biomass (Wood & Ethanol) 14.3
Renewable Other** 0.3
Nuclear Electric Power 56.1
Hydro Electric Power 14.5
Net Interstate Flow of Electricity/Loses -26.7
Net Imports of Electricity 8.7
Total 158.1
Table 2.1 Vermont Energy Consumption by Source 2009
**geothermal, wind, photovoltaic, and solar thermal energy.
*A kilowatt hour is approximately 3,412 BTUs
(Source: Energy Information Association)
Type Trillion BTUs
Motor gasoline 39.1
Heating oil and diesel fuel 30
Liqued petroleum gas 8.6
Jet Fuel 2.9
Other 1.7
Table 2.2 Vermont Petroleum Product Consumption 2009
Source: Energy Information Association
Sector 1993 2001 2009
Transportation 50.7 51.9 53.5Residential 34.6 47.8 48.3Commercial 15.2 32.7 31.8Industrial 14.2 31.2 24.4Total 114.7 163.6 158.0
(Source: Energy Information Administration)
Table 2.3 Statewide Energy Use by Sector (Trillion BTUs)

NVDA ENERGY STRATEGY PAGE 5
efficiency and conservation efforts. Residential sector consumption grew by 38.2% between 1993 and 2001. These residential fluctuations are considered to be normal - resulting from general population growth, an increase in the average house size, and additional modern conveniences. While the minuscule growth since 2001 corresponds with the recession, there is a general nation-wide “belt-tightening” initiated by rising energy prices, economic woes, conservation efforts and energy efficiency. By far the largest growth occurred between 1993 and 2001 in the commercial and industrial sectors, which had more than doubled their energy consumption. Most of this growth can be attributed towards the advancement of computer technology and its widespread use in the workforce. The industrial sectors also saw a significant dip in consumption between 2001 and 2009; however it is unclear as to how much of this reduction is attributed to new energy efficiency measures employed by manufacturers, reduced production levels, or plant closings in Vermont. Prior to 2008, energy consumption had continued to increase every year in each of these sectors. It is expected that the pre-2008 (pre-recession) consumptions figures will easily be met again once the economy turns around.
Energy Usage by Sector TRANSPORTATION According to the U.S. Energy Information Administration, approximately 34% of all energy used in the state is for transportation, almost entirely for cars and trucks. While the benefits of automobiles are obvious, they account for about 60% of all fossil fuels used in Vermont, 57% of carbon dioxide emissions and are the largest sources of several other pollutants. Since 1960, transportation energy use has grown at a faster pace than any other energy sector (Chart 1), especially in heavily auto dependent Vermont. However growth in transportation consumption has slowed considerably since 1993.
According to the Vermont Fuel Price Report, the average retail cost of gasoline was $2.34 in January of 2006. In only 5 years the costs per gallon has risen 35% to $3.17 (January, 2011). On average
0
10
20
30
40
50
60
Tri
llio
n B
TU
s
Source: U.S. Energy Information Administration
Chart 1.1 Vermont Energy Consumption by Sector 1960-2009
Transportation
Residential
Commercial
Industrial
NVDA ENERGY STRATEGY PAGE 6
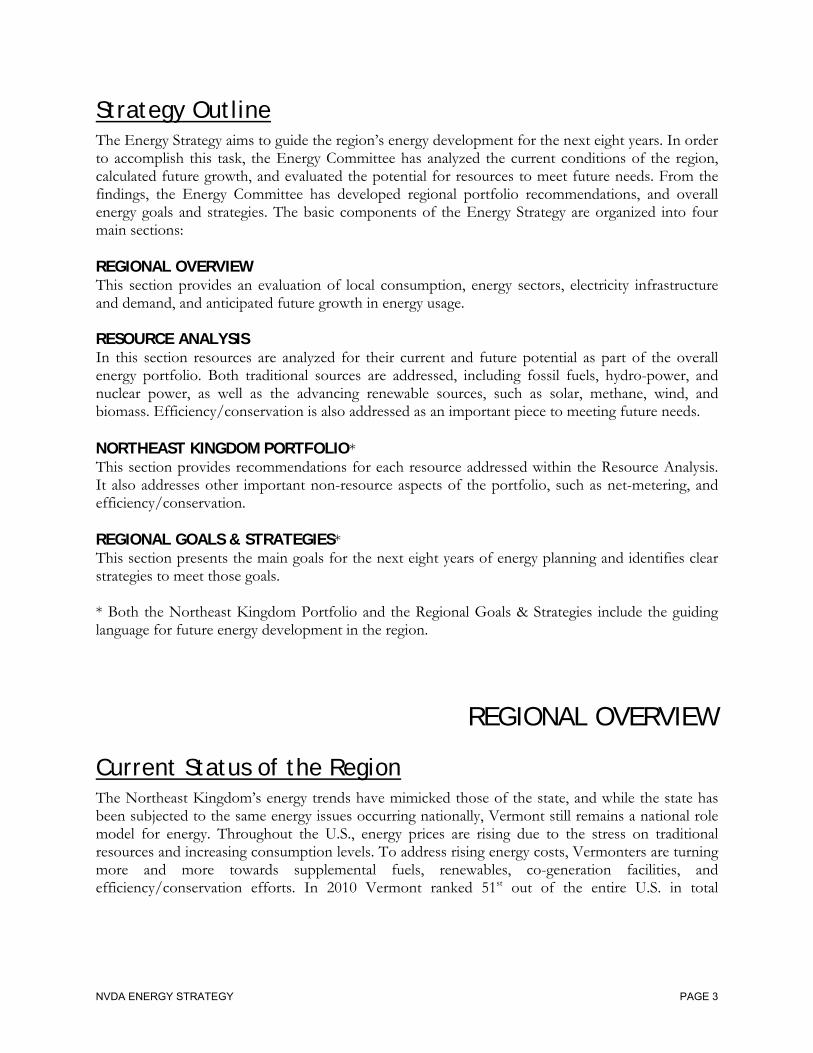
Americans spend 15.7 cents out of every dollar on transportation2. Transportation costs now rank second only to housing costs for families throughout the country with food costs narrowing out a close third. Energy usage in transportation is most greatly influenced by the development patterns of the region. Given that the Northeast Kingdom consists of a rural landscape with small pockets of concentrated development, there are minimal avenues in which energy consumption as part of the transportation sector can be effectively reduced. According to the Vermont Energy Transportation Report, the use of
high fuel-efficiency and alternative fuel vehicles is one way Vermonters can reduce transportation energy use. Table 2.4 depicts the use of alternative-fuel vehicles in Vermont over the last few years. Hybrids seem to be the most popular type of alternative fuel vehicle. Electric and electric-hybrid vehicles have the most potential to reduce Vermont’s
statewide greenhouse gas emissions relative to conventional vehicles. This is because of their overall energy efficiency and relatively low greenhouse gas emissions associated with the electricity generation resources in the state (Vermont Energy Transportation Report 2010). Alternative fuel vehicles still require refueling infrastructure to support their use. According to the U.S. Department of Energy’s Alternative Fuels Data Center, only 1 biodiesel, 3 compressed natural gas, 7 electric, 1 ethanol, and 1 propane refueling centers exist in Vermont (amounts include public and private facilities). Commercial shipping is one of the highest consumers of transportation fuels and another area in which the region can reduce consumption. As gas prices started to climb in the last decade area businesses looked for alternative shipping methods and inquiries into the region’s rail infrastructure grew. Railroad shipping is most desirable for non-perishable commodity goods. Upon further review it was found that regional rail infrastructure has the potential for growth, with room for increased traffic and a number of underutilized sidings. The Kingdom may also be able to attract additional rail usage if rail beds are upgraded to meet the 286,000 lb. weight limit standard and bridge heights are increased. Both improvements will allow rail cars to be filled to capacity and allow for the double stacking of rail cars, which is now standard across the country. NVDA also supports the re-establishment of the Twin State Line as a means to better connect the Kingdom with greater rail markets in New England. As already noted, regional development patterns directly impact transportation energy usage, especially in regards to individual behaviors. For example, mixed-use, higher density neighborhoods encourage more pedestrian use. The following land use principles encourage reduced transportation energy consumption3: 1. Encourage the location of new development in or near traditional village and city centers to
reduce both sprawl and the number of vehicle miles driven.
2 U.S. Dept. of Labor, Bureau of Labor Statistics: Consumer Expenditure Survey 2009-2010. 3 See the Transportation, Land-Use, and Housing Sections of the Regional Plan for the Northeast Kingdom for additional energy-related recommendations.
Fuel/Vehicle Type 2007 2008 2009 2010 Change
Hybrids 3,651 4,565 5,473 6,335 73%
Electric 106 101 94 77 -27%
Propane 93 75 69 40 -56%
Diesel 31,648 32,140 30,724 25,025 -21%
Gasoline 583,568 578,881 528,930 514,894 -11%
Table 2.4 All Vehicles Registered in Vermont by Fuel Type
(Source: Vermont Energy Transportation Report)
NVDA ENERGY STRATEGY PAGE 7
2. Support transit oriented development that fosters the expansion of public transportation and rail use.
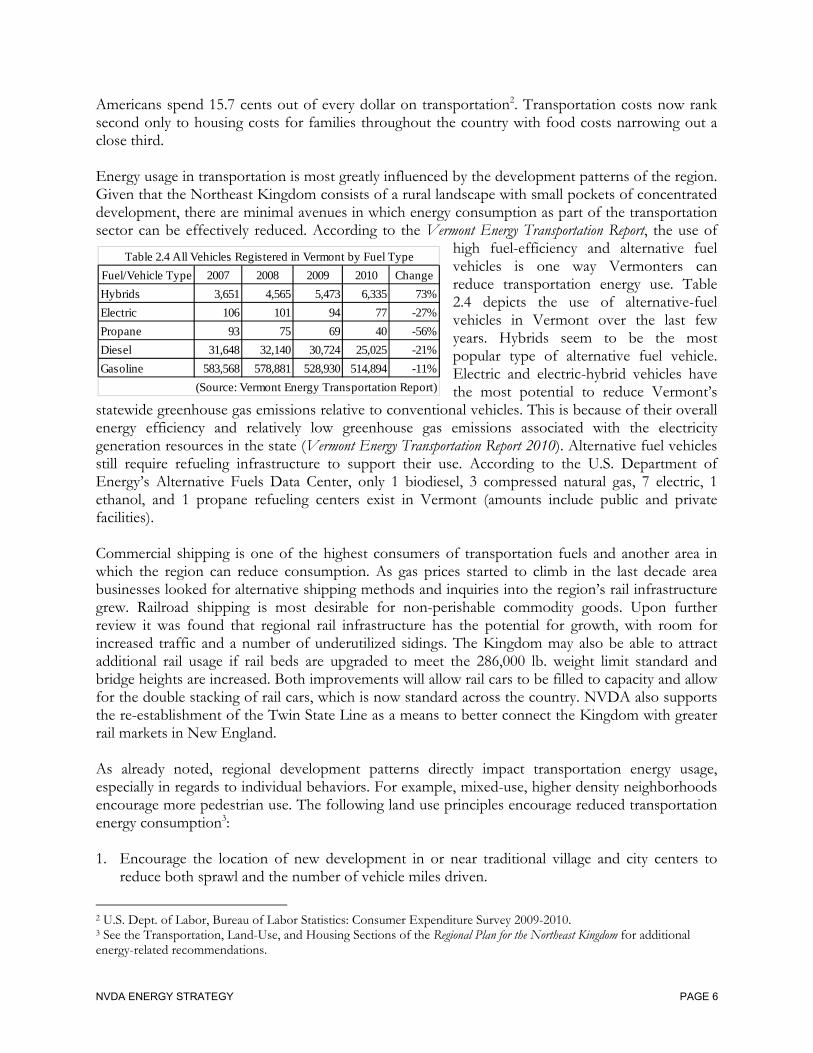
3. Encourage the construction of Park and Ride facilities to support carpooling efforts. 4. Encourage the expansion of bicycle and pedestrian facilities such as sidewalks and bike lanes. RESIDENTIAL Residential uses account for 30.5% of the energy used in Vermont (U.S. Energy Information Administration). Most of this energy is for residential heating. According to the 2005-2010 American Community Survey, heating oil is still the most common fuel source in the Northeast Kingdom, accounting for 62.5% of total home usage. Twenty-two percent of homes are heated by wood, 10.9% heated with propane gas, and 2.0% heated with electricity. All other fuels accounted for less than 1% each.
Table 2.5 demonstrates the trend of instability in heating fuel prices in the last few years. Only the least used (and priciest) heating resources, such as Kerosene, Propane, and Electricity have remained relatively steady in price. Meanwhile fuel-oil, the number one household heating fuel in the region, has seen dramatic cost increases. Fuel oil prices may continue to rise as the U.S. economy turns around and demand for oil in growing economies, such as China and India, increases worldwide demand. Natural gas prices show a continuation of the dramatic price reduction seen in the last several years. According to the U.S. Energy Information Administration (U.S. EIA), natural gas prices reached their lowest point in a decade this past January (2011). The dramatic drop is attributed to shale drilling (“hydro-fracking”) throughout Pennsylvania that has exploded in the last few years. Unfortunately, Northeast Kingdom residents are not able to utilize natural gas for home heating as the region lacks distribution infrastructure. At present wood-heat is still the cheapest source of home heating in Vermont (See $/MMBtu in Table 2.5 above). Both wood-pellets and cord wood saw decreases in price in the last few years, returning to 2007 figures. The decrease in wood-pellet pricing is attributed to an influx in pellets shipped in from British Columbia, which have kept prices down, but is not expected to last. While cord wood and wood-pellets have traditionally been used as supplemental heating fuels, the rising cost of fuel-oil has caused many home owners to swap the two, making fuel-oil a back-up to wood-pellet furnaces and out-door wood boilers. This switch was reflected in the 2005-2010 American
BTU/Unit Adj. Effic $/Unit $/MMBtu BTU/Unit Adj. Effic $/Unit $/MMBtu
Fuel Oil (gallon) 138,200 80% $3.18 $28.75 138,200 80% $3.82 $34.58 15%
Kerosene (gallon) 136,600 80% $3.77 $34.51 136,600 80% $4.17 $38.16 6%
Propane (gallon) 91,600 80% $3.01 $41.03 91,600 80% $3.16 $43.16 1%
Natural Gas (therm) 100,000 80% $1.90 $23.75 100,000 80% $1.67 $20.83 -16%
Electricity (kWh) 3,412 100% $0.14 $41.35 3,412 100% $0.15 $43.46 1%
Wood (cord - green) 22,000,000 60% $190.00 $14.39 22,000,000 60% $180.00 $13.64 -9%
Pellets (ton) 16,400,000 80% $257.00 $19.59 16,400,000 80% $247.00 $18.83 -8%
*Adjusted for Inflation Source: Vermont Fuel Price Report, November 2008 & November 2011, Department of Public Service)
Table 2.5: Comparing the Cost of Heating Fuels, November 2008 & November 2011November 2008 November 2011 %
Change*Type of Energy

NVDA ENERGY STRATEGY PAGE 8
Community Survey, showing a 6% decline in homes heated with fuel oil and a 6% increase in homes heated with wood fuels, as compared to 2000 Census figures.4 Electric usage is the other major energy component in the residential sector. The majority of the electricity consumed in the region is for residential purposes (Table 2.6). Since 1990 the percentage of electric usage by the residential sector has declined, while total electric usage across all sectors has grown rather steadily. Some of this shift is a result of improved efficiency and conservation measures provided to homeowners by the state’s energy efficiency utility, Efficiency Vermont. For example, Efficiency Vermont assisted in saving roughly 3,425 megawatt-hours (MWhs) through the participation of 4,295 homeowners in the Northeast Kingdom in 2009 alone. In 2007, Efficiency Vermont’s programs expanded into commercial and industrial sectors when a dramatic reduction in electric consumption was seen across all sectors. Unfortunately the continued reduction in 2008 is almost entirely in the commercial and industrial sectors, indicating this reduction is not due to savings measures alone but also the economic recession. It has already been mentioned that residential usage accounts for a significant portion of the total amount of the total energy consumed in Vermont (30.5%). Residential usage consists primarily of heating for hot water and home heating, and fossil fuels remain the most common heating resources used within the region (fuel oil accounts for 62.5% of total residential usage and propane gas accounts for another 10.9%). Given the price volatility of these resources and the constant trend upward, it makes good sense to reduce the use of these resources whenever possible. The best opportunities to reduce consumption include conservation, weatherization, and efficiency. Other fuels, such as wood, can be used as a lower cost replacement or supplement for home heating. COMMERCIAL/INDUSTRIAL Combined, commercial and industrial activity account for the largest percentage of state-wide energy usage (35.5%). Most of the commercial/industrial energy usage can be attributed to space heating and process heating (Dept. of Public Service). Electric costs are a major factor in attracting and retaining major commercial/industrial operations in the region. New England retains the highest electric costs in the lower 48 states for both sectors. In December 2011 the state’s average electric retail price was 13.98 cents/kWh in the commercial sector and 10.05 cents/kWh in the industrial sector. Nationally, the December 2011 average electric retail prices for both the commercial and industrial sectors were 9.85 cents/kWh and 6.60 cents/kWh respectively (U.S. Energy Information Administration, Electric Power Monthly). When most large manufacturers are speaking in terms of megawatt-hours (thousands of kilowatt-hours) for power consumption, those price differences are considerable.
4 The American Community Survey data differs from Census data in that it utilizes annual survey figures, from a smaller cross-section of the population, across a 5-year timeframe to provide data estimates for a given year.
Year Residential % Commercial/Industrial % Total
2004 197,136 46% 235,882 54% 433,018
2005 201,916 44% 255,532 56% 457,448
2006 206,629 44% 259,722 56% 466,351
2007 203,137 44% 255,207 56% 458,344
2008 202,823 47% 233,170 53% 435,993
(U.S. EIA)
Table 2.6 2004-2008 NEK Electric Consumption by Sector (MWh)
NVDA ENERGY STRATEGY PAGE 9
To combat high electric and heating costs in the region a few industrial operations have resorted to generating their own energy. RadianTec, a radiant-floor heating manufacturing company in Lyndon, Vermont utilizes solar hot water panels and passive solar design to reduce their heat loads; the former Dirigo Paper Mill utilized on-site hydro and waste steam for electrical generation, which are still in operation under an independent power producer today; the Ethan Allen plant in Beecher Falls uses scrap wood to fuel an on-site generator, and is studying the feasibility of a combined heat-and-power plant with Orleans and Barton Electric for their Orleans facility; and, Lyndon Furniture in St. Johnsbury has employed a diesel-fueled electric generator to stabilize their electric costs for several years. The opportunities for reduced energy consumption in the commercial/industrial sector are similar to those in the residential sector but typically differ in size and scale. These again include conservation and energy efficiency (including weatherization) and should not be underestimated. Other opportunities include: Investing in renewable energy systems such as solar, small wind, or biomass as some businesses and schools in the region have already done (including net-metered systems); and, altering hours of operation to take advantage better electric rates in off-peak hours/days.
Electricity Electric systems today are part of large regional networks that extend beyond state boundaries. Vermont belongs to a network that encompasses the six states of New England. These regional networks are responsible for the general organization and operation of the electric businesses and market territory. However, the vast diversity in state-to-state infrastructure can influence the energy climate in surrounding network states. For Vermont this translates into major effects on the affordability, cost, and reliability of electrical systems. REGIONAL UTILITIES The Northeast Kingdom is served by eight electric utilities. Map 4 depicts the coverage areas of the region’s utilities and the major transmission lines. Vermont Electric Co-Op serves the largest area, covering over 19 towns in Northern Essex and Orleans Counties. Green Mountain Power also covers a large area in Caledonia and Southern Essex Counties, with the remainder of the region served by Washington Electric, and four municipal-owned electric companies. The NEK’s municipal electric utilities include Barton Electric, Orleans Electric, Lyndonville Electric, and Hardwick Electric. Together the municipal utilities provide service to over 19 different towns and villages (see Regional Generation Facilities Map).

NVDA ENERGY STRATEGY PAGE 10
MAP 4: Regional Generation Facilities Map
NVDA ENERGY STRATEGY PAGE 11
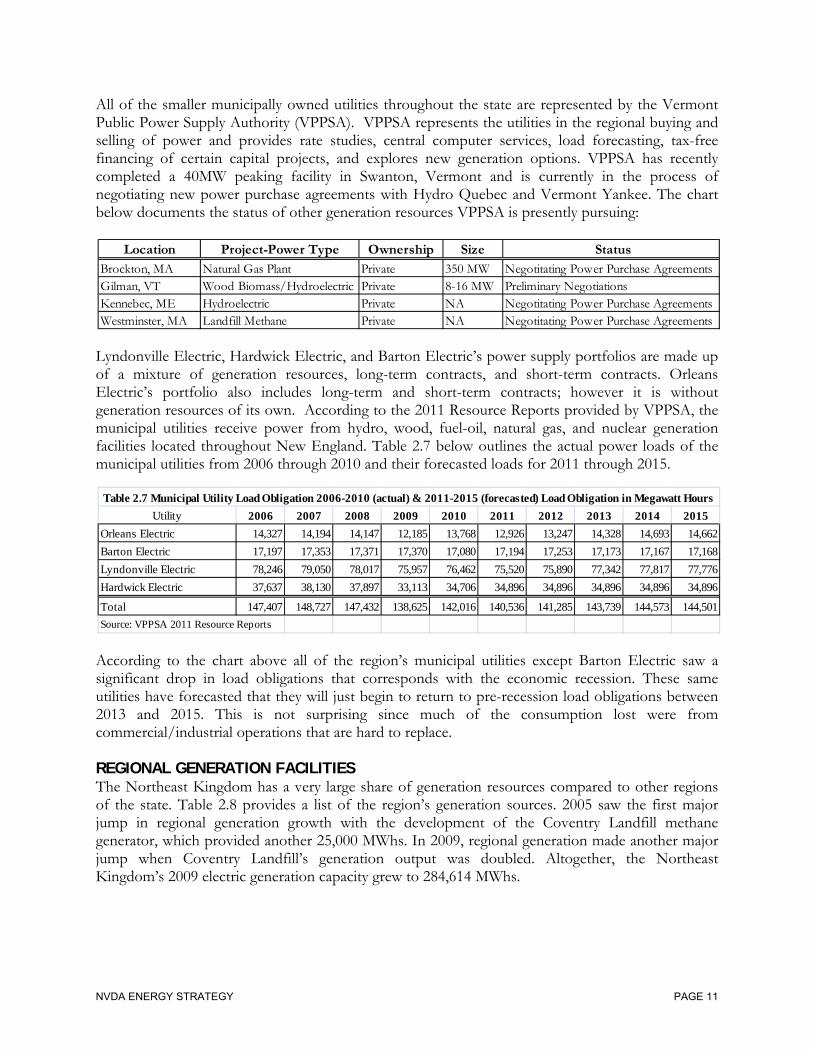
All of the smaller municipally owned utilities throughout the state are represented by the Vermont Public Power Supply Authority (VPPSA). VPPSA represents the utilities in the regional buying and selling of power and provides rate studies, central computer services, load forecasting, tax-free financing of certain capital projects, and explores new generation options. VPPSA has recently completed a 40MW peaking facility in Swanton, Vermont and is currently in the process of negotiating new power purchase agreements with Hydro Quebec and Vermont Yankee. The chart below documents the status of other generation resources VPPSA is presently pursuing:
Lyndonville Electric, Hardwick Electric, and Barton Electric’s power supply portfolios are made up of a mixture of generation resources, long-term contracts, and short-term contracts. Orleans Electric’s portfolio also includes long-term and short-term contracts; however it is without generation resources of its own. According to the 2011 Resource Reports provided by VPPSA, the municipal utilities receive power from hydro, wood, fuel-oil, natural gas, and nuclear generation facilities located throughout New England. Table 2.7 below outlines the actual power loads of the municipal utilities from 2006 through 2010 and their forecasted loads for 2011 through 2015.
According to the chart above all of the region’s municipal utilities except Barton Electric saw a significant drop in load obligations that corresponds with the economic recession. These same utilities have forecasted that they will just begin to return to pre-recession load obligations between 2013 and 2015. This is not surprising since much of the consumption lost were from commercial/industrial operations that are hard to replace. REGIONAL GENERATION FACILITIES The Northeast Kingdom has a very large share of generation resources compared to other regions of the state. Table 2.8 provides a list of the region’s generation sources. 2005 saw the first major jump in regional generation growth with the development of the Coventry Landfill methane generator, which provided another 25,000 MWhs. In 2009, regional generation made another major jump when Coventry Landfill’s generation output was doubled. Altogether, the Northeast Kingdom’s 2009 electric generation capacity grew to 284,614 MWhs.
Location Project-Power Type Ownership Size Status
Brockton, MA Natural Gas Plant Private 350 MW Negotitating Power Purchase AgreementsGilman, VT Wood Biomass/Hydroelectric Private 8-16 MW Preliminary NegotiationsKennebec, ME Hydroelectric Private NA Negotitating Power Purchase AgreementsWestminster, MA Landfill Methane Private NA Negotitating Power Purchase Agreements
Utility 2006 2007 2008 2009 2010 2011 2012 2013 2014 2015
Orleans Electric 14,327 14,194 14,147 12,185 13,768 12,926 13,247 14,328 14,693 14,662
Barton Electric 17,197 17,353 17,371 17,370 17,080 17,194 17,253 17,173 17,167 17,168
Lyndonville Electric 78,246 79,050 78,017 75,957 76,462 75,520 75,890 77,342 77,817 77,776
Hardwick Electric 37,637 38,130 37,897 33,113 34,706 34,896 34,896 34,896 34,896 34,896
Total 147,407 148,727 147,432 138,625 142,016 140,536 141,285 143,739 144,573 144,501
Source: VPPSA 2011 Resource Reports
Table 2.7 Municipal Utility Load Obligation 2006-2010 (actual) & 2011-2015 (forecasted) Load Obligation in Megawatt Hours

NVDA ENERGY STRATEGY PAGE 12
While not reflected in this chart, the region saw more generation growth in 2010 with the addition of the largest utility-scale wind farm in Vermont, by First Wind, Inc. The First Wind facility, located in Sheffield, Vermont came online in September 2010 and contributed another 25,948 MWhs to regional generation. The wind-farm was only operating for a portion of 2010, but it’s expected to contribute a total 112,000 MWhs annually. Another utility-scale wind farm in the region, Kingdom Community Wind (Lowell, Vermont), was also recently approved with a Certificate of Public Good. Once built, the Kingdom Community Wind Project is expected to contribute another 185,570 MWhs annually. If producing at expected capacity5, both wind farms will bring the region’s electric generation capacity to approximately 580,000 MWhs. There are also three very large generation assets located on the border of the region that deserve to be mentioned. The Comerford Dam, McIndoe Falls Dam, and the Moore Dam are all located on
5 Expected production capacity figures are provided by the Public Service Department and include discounts from actual total production capacity based on the frequency of wind generation (i.e. intermittency).
Owner/Operator - Facility Name
Facility Type
2005 MWH Produced
2009 MWH Produced* Location
Great Bay Hydro Corp. (IPP) - Newport Units 1,2,3 Hydro 15,678.22 undisclosed Newport
Great Bay Hydro Corp. (IPP) - Newport 4-10 Diesel 0 - Newport
Great Bay Hydro Corp. (IPP) - West Charleston Hydro undisclosed 2,070.00 Charleston
CVPS - Emerson Falls Hydro undisclosed 700.00 St. Johnsbury
CVPS - Arnold Falls Hydro 1,510.70 1,965.00 St. Johnsbury
CVPS - Gage Hydro 2,968.00 3,582.00 St. Johnsbury
CVPS - Passumpsic Hydro 2,158.70 2,060.00 Barnet
CVPS - East Barnet Hydro 9,855.70 7,320.00 Barnet
Barnet (IPP) Hydro 1,767.38 1,814.00 Barnet
Village of Barton - Diesels Diesel 3.83 4.00 Barton
Village of Barton Hydro 3,678.92 5,101.00 Barton
Great Bay Hydro Corp. (IPP) - North Troy Hydro 0 - T roy
Chaput Family Farms Methane 0 2,490.00 T roy
Maplehurst Farm Methane 0 723.00 Greensboro
Norton Hydro Hydro 0 - Norton
Lyndonville Electric - Vail & Great Falls Hydro 4,455.91 6,205.00 Lyndonville
CVPS - Pierce Mills Hydro 1,411.40 1,464.00 St. Johnsbury
Ampersand Gilman Hydro (IPP) Hydro undisclosed undisclosed Lunenburg
GMP – Joe’s Pond Hydro 11,122.50 2,759.00 Danville
Dodge Falls (IPP) Hydro 23,500.00 21,734.00 Ryegate
Ryegate Power Station (IPP) Wood Chip 167,627.41 172,367.00 Ryegate
Maxwell's Neighborhood Energy, LLC (IPP) Methane 0 1,750.00 Coventry
WEC - Coventry Landfill Methane 25,000.00 50,506.00 Coventry
224,509.00 284,614.00
*figures are a mixture of actual & projected
Table 2.8 Generation Facilities in Caledonia, Essex, and Orleans Counties
(Source: VT Dept. of Public Service & IPPs)
Total
NVDA ENERGY STRATEGY PAGE 13
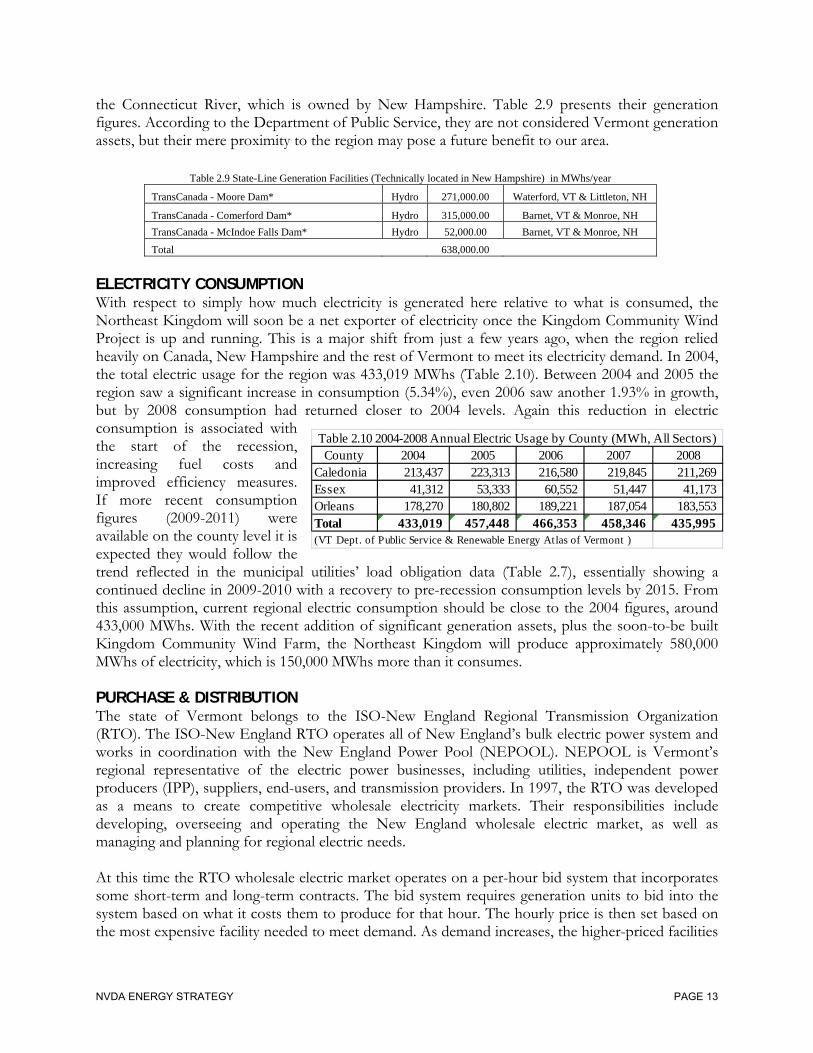
the Connecticut River, which is owned by New Hampshire. Table 2.9 presents their generation figures. According to the Department of Public Service, they are not considered Vermont generation assets, but their mere proximity to the region may pose a future benefit to our area.
Table 2.9 State-Line Generation Facilities (Technically located in New Hampshire) in MWhs/year
TransCanada - Moore Dam* Hydro 271,000.00 Waterford, VT & Littleton, NH
TransCanada - Comerford Dam* Hydro 315,000.00 Barnet, VT & Monroe, NH
TransCanada - McIndoe Falls Dam* Hydro 52,000.00 Barnet, VT & Monroe, NH
Total 638,000.00 ELECTRICITY CONSUMPTION With respect to simply how much electricity is generated here relative to what is consumed, the Northeast Kingdom will soon be a net exporter of electricity once the Kingdom Community Wind Project is up and running. This is a major shift from just a few years ago, when the region relied heavily on Canada, New Hampshire and the rest of Vermont to meet its electricity demand. In 2004, the total electric usage for the region was 433,019 MWhs (Table 2.10). Between 2004 and 2005 the region saw a significant increase in consumption (5.34%), even 2006 saw another 1.93% in growth, but by 2008 consumption had returned closer to 2004 levels. Again this reduction in electric consumption is associated with the start of the recession, increasing fuel costs and improved efficiency measures. If more recent consumption figures (2009-2011) were available on the county level it is expected they would follow the trend reflected in the municipal utilities’ load obligation data (Table 2.7), essentially showing a continued decline in 2009-2010 with a recovery to pre-recession consumption levels by 2015. From this assumption, current regional electric consumption should be close to the 2004 figures, around 433,000 MWhs. With the recent addition of significant generation assets, plus the soon-to-be built Kingdom Community Wind Farm, the Northeast Kingdom will produce approximately 580,000 MWhs of electricity, which is 150,000 MWhs more than it consumes. PURCHASE & DISTRIBUTION The state of Vermont belongs to the ISO-New England Regional Transmission Organization (RTO). The ISO-New England RTO operates all of New England’s bulk electric power system and works in coordination with the New England Power Pool (NEPOOL). NEPOOL is Vermont’s regional representative of the electric power businesses, including utilities, independent power producers (IPP), suppliers, end-users, and transmission providers. In 1997, the RTO was developed as a means to create competitive wholesale electricity markets. Their responsibilities include developing, overseeing and operating the New England wholesale electric market, as well as managing and planning for regional electric needs. At this time the RTO wholesale electric market operates on a per-hour bid system that incorporates some short-term and long-term contracts. The bid system requires generation units to bid into the system based on what it costs them to produce for that hour. The hourly price is then set based on the most expensive facility needed to meet demand. As demand increases, the higher-priced facilities
County 2004 2005 2006 2007 2008Caledonia 213,437 223,313 216,580 219,845 211,269 Essex 41,312 53,333 60,552 51,447 41,173 Orleans 178,270 180,802 189,221 187,054 183,553 Total 433,019 457,448 466,353 458,346 435,995(VT Dept. of Public Service & Renewable Energy Atlas of Vermont )
Table 2.10 2004-2008 Annual Electric Usage by County (MWh, All Sectors)

NVDA ENERGY STRATEGY PAGE 14
are pulled online to meet the increasing load. In Vermont, many of the “peaking” plants utilize diesel fuel. New England is also heavily dependent on natural gas generation facilities, which set the hourly price 85% of the time. Even though natural gas prices have dropped recently, New England households retain the highest electric costs in the country (Table 2.11). As part of the RTO, Vermont is subject to these higher electric costs, even though there is only one natural gas generation facility in the state. According to the Public Service Department, the higher pricing is caused by existing long-term contracts and restrictive pipeline infrastructure. In other words New England is still paying natural gas pricing that was set in a 30-year contract, plus its limited pipeline capacity means it cannot access additional volumes of natural gas outside of those contracts. Massachusetts is currently pursuing the expansion of a major pipeline to be able to utilize larger volumes of natural gas. TRANSMISSION A majority of Vermont’s electric transmission system is operated by the Vermont Electric Power Company (VELCO). VELCO is responsible for bulk transmission lines with a voltage rating of 115kV and above. Lines with a rating of 34.5kV, 44kV, and 69kV are considered sub-transmission lines. The Northeast Kingdom has roughly 325 miles of transmission and sub-transmission lines (Map 4) and serves as an important gateway for electricity coming from both Canada and New Hampshire. At this time, Vermont is considered a constrained zone due to transmission grid congestion. Constrained states have a limited transmission network and transport electricity over long distances, creating congestion on the lines and restricting the ability to receive additional electricity from outside the state during increasing demand. The majority of the constraint has been caused by the considerable growth in the Northwest region of the state. The increasing demand has congested the Northeast Kingdom’s transmission network – limiting the capacity to receive additional electricity from out of state when needed. Constraint issues usually result in increased electricity costs. Because of transmission line congestion in-state facilities must be brought online (started up) in order to meet the new demand, even though less expensive generation facilities might be available out of state. VELCO’s recently completed Northern Loop Project has alleviated much of the congestion of the Northern transmission grid. In our region, the project installed new lines between Irasburg and Newport; upgraded the St. Johnsbury substation; upgraded the Irasburg substation; and reconfigured the Hydro Quebec interconnection at Highgate – resulting in a significant amount of new transmission capacity on existing lines. The Northern Loop Project increased the reliability throughout Northern Vermont and should provide the transmission capacity needed to meet the Northeast Kingdom’s electrical growth for the next several years. An upgrade of the Hill Street substation in Lyndonville is also underway to provide a secondary connection between Lyndonville Electric’s grid and the larger VELCO transmission lines. The project is expected to ensure adequate future demand is met and improve overall reliability in Caledonia and Essex Counties. Other similar upgrades are being made throughout the region.

NVDA ENERGY STRATEGY PAGE 15
VELCO’s implementation of Smart Grid technology is also expected to improve transmission reliability. With the help of a $69M grant from the American Recovery and Reinvestment Act, the technology will be installed throughout the state in the next several years. A “Smart Grid” is named for the improvements made to existing transmission networks that convert existing one-way transmission system into a two-way system. The new fiber-optic system will be able to relay real-time data on electric usage, voltage, existing or potential outages, and generation facility performance allowing utilities to resolve problems quickly and assess customers’ electric usage patterns. The Smart Grid technology also improves the incorporation of more and more distributed generation systems into the current electrical grid. According to VELCO the Smart Grid, “has the potential to increase energy efficiency and thereby reduce environmental impacts and energy consumption, and empower customers to manage their energy choices”. NET-METERING Another means of alleviating transmission congestion is to reduce the need for transmission altogether, which is something that net-metering can help provide. Net-metering requires electric utilities to permit customers to interconnect on-site renewable electricity systems with the grid (e.g. a photovoltaic system with proper DC-AC conversion equipment) and to be billed only for the net amount of power they consume. This effectively creates an incentive equal to the customer’s electric rate for the kWh’s of renewable electricity that they create. In 1998 the Vermont State legislature passed a bill allowing the practice of net-metering. Approved net-metering systems include photovoltaic, small wind, fuel cell, farm methane, and bio-gasification facilities. Several revisions to the net-metering law over the last several years, including expanding production limits, simplifying permitting, and increasing peak load capacity, have made it easier to establish individual and group run net-metered systems. The current law allows for net-metered systems of up to 500 kW with a capacity limit of 4% of a utility’s 1996 system peak or previous year’s peak, whichever is higher. Farm methane systems are now exempt from the capacity limit and solar net-metered systems have an added financial incentive called the “Solar Adder”, which increases the average value of solar net-metered payback to $0.20/kWh. According to Vermont’s 2011 Comprehensive Energy Plan, there are currently 1,319 permitted systems that have a peak production capacity of 10,923 kW, the majority of which are residential. Net-metered renewable systems have multiple benefits. Besides producing green power and providing monthly electric bill credits, the systems reduce the capacity pressure on local transmission systems during peak demand times.
Other Energy Facilities The electricity system is the major energy network in the region. However, it is important to mention the Northeast Kingdom’s other major energy infrastructure. The Portland Pipeline is a major crude oil pipeline that stretches from Portland, Maine into Canada. In our region the pipeline runs from Guildhall northwest to Jay before crossing into Canada. While Vermont doesn’t tap into the pipeline, its existence in our region as major transporter of oil is important for potential future use. The Portland Natural Gas Transmission system also just touches the region. The transmission line also runs from Portland, Maine into Canada and is owned by TransCanada, a major Canadian energy supplier. The line just barely passes through the state in Canaan, Vermont before reaching Canada.

NVDA ENERGY STRATEGY PAGE 16
A spur has recently been created from this line, but only serves the Ethan Allen Manufacturing Plant in Beecher Falls. Future potential to expand this transmission system into the region remains possible.
Anticipated Future Growth According to the 2005 Vermont Electric Plan, energy consumption will increase in coordination with economic growth and population growth. According to the 2000 and 2010 Census, the region has grown by roughly 3.7% in the last decade, down from a 4.2% population growth between 1990 and 2000. If the region continues this slower than average growth rate, as it is expected, the Kingdom will see 0.3 – 0.4% population increase each year for the next decade. Economically, Vermont is expected to return to its pre-recession levels by 2015, and grow mildly through 2020 as compared to the rest of New England. According to the New England Economic Partnership (NEEP), New England’s economic base will grow by just under 1% per year up to 2013. Unfortunately, this figure is said to be barely strong enough to overcome unemployment growth as the overall employment base is expected to grow as well, creating a rather stagnant economy. Vermont, however seems to be faring slightly better than the rest of New England, with lower unemployment, limited housing value decline, and growth in real personal income in 2011; pre-recession growth levels of 1% per year are predicted to be reached for Vermont prior to 2015, putting the state at a slight advantage. Although this figure represents the State’s growth, the Northeast Kingdom should plan to incorporate a small percentage of this growth into the region approximately 0.2 - 0.3% between 2013 and 2020. We project the future growth in energy demand for the Northeast Kingdom to be between 0.5 – 0.7% a year for the next eight years. This is very similar to the compound annual growth rate of between 0.4 - 0.7% (forecast to 2030) predicted for the Vermont as a whole by the Department of Public Service. Using the conservative projection (0.5% per year), the Northeast Kingdom’s electricity consumption will reach approximately 462,886 MWH by 2020, which is still below the regional consumption peak of 466,353 in 2006 (Table 2.10). This is certainly a possibility, since 2006 peak demand was reached prior to the implementation of extensive conservation and efficiency programs. The more realistic projection is 0.7% per year in electric consumption growth, as it reflects the 2015 rebound amount of 457,812 MWH, nearly matching the pre-recession consumption figures of 2007 that account for conservation and efficiency measures. Following the more realistic figure, we project that the Northeast Kingdom will consume an additional 40,000 MWH of power by 2020. Transportation sector energy consumption is projected to have a much more conservative growth rate, which is most often tied to Vehicle Miles Traveled (VMT) data. According to the Vermont Transportation Energy Report, the amount of VMT has been decreasing statewide between 2006 and 2009 (reduced by 1.75% annually). This decline is attributed to the economic recession and growing fuel costs over this period, but it is unclear as to whether higher fuel prices will have a more lasting effect on the amount people are driving even after the economy turns around. Because of this, we project that the number of Vehicle Miles Traveled to grow rather conservatively for the Northeast
NVDA ENERGY STRATEGY PAGE 17
Kingdom following the projected 2015 economic turnaround, translating to an additional 3,800,000 VMT from 2015 and 2020. According to Vermont’s 2011 Comprehensive Energy Plan, thermal energy consumption has changed little in the last 20 years. Petroleum fuel consumption for heating purposes only grew at an average annual rate of 0.8% between 1990 and 2009. Increases in costs for heating fuels mostly result in fuel substitutions and investments in efficiency and weatherization. At the same time, new residential development and population growth has balanced out any decline in consumption that might be seen in the region so far. Therefore, we project thermal energy consumption in the NEK to remain relatively stable to 2020, with decline only expected if efficiency and weatherization activities increase.
RESOURCE ANALYSIS
Traditional Resources FOSSIL FUELS Fossil fuels account for over 60% of Vermont’s energy consumption. Transportation and household heating are the two leading uses of fossil fuels. Fossil fuels include: natural gas, propane, heating oil/diesel fuel, gasoline, coal, and kerosene. As mentioned previously, the Northeast Kingdom is not served by natural gas; instead heating oil and propane are major resources. There are also no crude oil processing facilities in the state, the nearest facility is located in Quebec and is served by the Portland Pipeline, which runs through the region. Coal and kerosene are also used, though minimally. One area in which Vermont is seeing growth in fossil fuel usage is via compressed natural gas. With a reduction in natural gas prices, compressed natural gas is now economical for large industrial applications (utilize over 150,000 gallons fuel oil annually) and as a transportation fuel. Both the Burlington Department of Public Works and Vermont Gas maintain vehicle fleets fueled with compressed natural gas. According to Vermont Transportation Energy Report, a total of 2.6 million cubic feet of CNG was sold at the two compressed natural gas filling stations in Vermont, the equivalent of over 20,000 gallons of gasoline or 19,500 gallons of diesel. In the past, the abundance of cheap fossil fuels has influenced the development of our energy systems. Their current price volatility has dramatically affected the economy and the cost of living. In order to stabilize the country’s energy structure, many states are encouraging diversification of energy portfolios through renewable resources. In the last few years, fossil fuel costs have risen to the point where renewable and alternative fuels are becoming more attractive within the energy market. NUCLEAR In 2009, nuclear power constituted roughly 38% of Vermont’s electric needs. Vermont only has one nuclear facility located in Vernon, Vermont and owned by Entergy. Nuclear energy is produced using an atomic reaction and the process needed for this type of generation produces a lot of radioactive waste and environment temperature increases. Because of these outputs, there is a lot of

NVDA ENERGY STRATEGY PAGE 18
apprehension towards this type of energy production. Public concern over facility safety has been another major concern for nuclear, particularly with the Vernon facility and the recent natural disasters in Japan (earthquake and flooding). Green Mountain Power and Central Vermont Public Service held the largest share of power purchase agreements with Vermont Yankee, which expired in 2012 as the plant faces relicensing. Entergy is in the process of renewing its Vermont license to continue operation for another 20 years, but there is significant public sentiment against the continued operation of Vermont Yankee. At this time it is unclear as to whether or not the plant will receive license renewal or shut down and begin decommissioning. Because of this uncertainty many Vermont utilities have already begun seeking replacements for power previously provided by Vermont Yankee in their portfolios. A large share of this replacement power is expected to come from Hydro Quebec and other facilities in the regional market. According to Vermont’s 2011 Comprehensive Energy Plan, “even with new Hydro Quebec and other contracts being offered to replace power previously supplied by Vermont Yankee, a gap between contracted supply and expected demand still exists”. Presently, Vermont utilities retain the ability to purchase nuclear power from Vermont Yankee and other nuclear facilities.
Renewable Resources In response to issues with conventional energy sources, Vermont is exploring newly emerging technologies and renewable energy sources, in particular, to meet future needs. Renewable resources generally include solar, wind, methane, hydro, and biomass energy. In June 2005, Vermont enacted the Sustainably Priced Energy Enterprise Development (SPEED) Program and Renewable Portfolio Goal. The SPEED Program provides financial incentives for the development of new renewable generation facilities under 2.2 MW. The program encourages development by providing feed-in tariffs, which pay a set incentive rate/kWh above current market retail prices for power that meets program criteria and agrees to long-term contracts. Specific types of renewable generation were initially assigned different tariff amounts (Table 2.12) and a total cap of 50 MW was established for the program. To date the 50 MW cap has been met, with 15 projects in operation (7.58 MW) and another 43 projects (42.37 MW) in various stages of development (Public Service Department). In the 2012 latest legislative session, the cap was increased to a total of 127.5MW that will be rolled out in set allotments each year to limit the impact on rate payers. The first allotment will be 5MW/year for the first three years, then it will increase to 7.5MW/year for the next three years, after which it will increase to 10MW/year for each remaining years until the 127.5MW capacity is met by 2022. Changes to the program also address how tariff rates are established, with the legislature promoting a reverse auction process to ensure competitive rates. Northeast Kingdom renewable energy development projects enrolled in the SPEED Program include First Wind, Coventry Landfill, Maxwell’s Neighborhood Energy, Chaput Family Farms, Great Bay Hydro - West Charleston, and Kingdom Community Wind. Vermont’s Renewable Portfolio Goal calls for utilities to meet growth in electricity demand by using energy efficiency and new renewable generation sources. This law encourages each retail electricity
Renewable Energy Technology
Current Tarrif Rates*
Landfill Methane 0.09$ Farm Methane 0.141$ Wind (small) 0.214$ Wind (large) 0.118$ Solar PV 0.24$ Hydroelectric 0.12$ Biomass 0.13$ *As amended in 2010(Source: Public Service Department)
Table 2.12 SPEED Program Renewable Energy Rates ($/kWh)

NVDA ENERGY STRATEGY PAGE 19
provider to supply an amount of new renewable energy equal to its total incremental energy growth between 2005 and 2012, with a minimum requirement of 5% (2008 amendment). If this goal is not achieved by 2012 the policy will become a mandatory Renewable Portfolio Standard in 2013. According to the 2011 Comprehensive Energy Plan the 5% minimum was met in 2011, and there is a new goal established by the Legislature of 75% minimum by 2032. Presently, Vermont utilities are on track to provide 17% of the state’s total electric portfolio from new renewable resources by 2013. HYDRO Hydro-power is second leading generation resource in the Northeast Kingdom. Fifteen of the 22 generation facilities in the region are hydro. The largest electric producers include Green Mountain Power’s facility on Joe’s Pond, Lyndonville Electric’s Vail & Great Falls facilities, Central Vermont Power Service’s East Barnet Dam, and Great Bay Hydro’s facilities in Newport (Table 2.8). The three Connecticut River Dams, though not considered part of our regional generation, are three of the largest hydro facilities in the Northeastern U.S. Together the Moore, Comerford, and McIndoe Falls Dams produce roughly 638,000 MWH of electricity annually (double what the region consumes). Altogether, the Northeast Kingdom can produce roughly 78,000 MWhs of hydro-electric power. A hydro-power resource map developed by NVDA (provided on the following page) identifies where the potential for new hydro facility siting may exist in the region. Hydro facilities can be a good source of base-load power when regular rainfall is received. For river-run facilities, power generation is dependent upon continuous levels of rainfall and must run when the flow is at optimum levels. This can mean producing electricity when it might not be needed. Dams, on the other hand, have the advantage of storing their resource for later use. Unfortunately, drought can severely limit the production capacity of dams as well. Hydro power facilities can also alter the ecosystem of a waterway. Both reservoir and river-run systems can increase water temperature, decrease water speed, limit oxygen and increase nitrogen levels, and alter riparian areas. These changes to the ecosystem cause stress to fish populations and riparian-habitat wildlife6. Today, new hydro facility design and upgrades are engineered to mitigate or lessen negative impacts on the ecosystem. Overall hydro-power is considered a long-term resource and is relatively secure and stable. Generation costs for hydropower vary considerably between facilities. Many of the facilities in the region were built in the early 1900’s and have needed significant upgrades over the years. Upgrading existing hydro and permitting new hydro can prove to be very costly and consequently raises the production costs for the facility. To alleviate some of the permitting costs new legislation was recently passed to help expedite permitting for new small-scale hydro projects in the state. SOLAR Overall solar resources in Vermont are quite good, and solar energy can be harnessed effectively for primary and secondary energy needs. The two main types of solar energy systems are photovoltaic (PV), which generates electricity, and solar thermal, which generates hot air or hot water for water and/or space heating. For some homeowners in our region, solar electricity systems have proven more cost effective than extending power lines to the home. A typical off-grid system consists of photovoltaic (PV) modules that convert solar energy to electricity, batteries that store the electricity
6 Foundation for Water and Energy Education.

NVDA ENERGY STRATEGY PAGE 20
(if off-grid), and an inverter that converts DC power to AC for use in conventional electric appliances. As a rough rule of thumb, a 1 kilowatt photovoltaic system can be expected to produce 3-3.5 kWh/day on average in Vermont. Solar water heating systems typically utilize collectors to capture the sun’s energy, a pump to circulate a solution through the collectors to extract heat energy, and a well-insulated storage tank to hold the heated water for use as needed (this can be integrated with an existing water-heating system). An appropriate size solar water-heating system can provide one-half to two-thirds of a household’s annual hot water needs – typically 100% in summer, but as little as 25% in winter. In Vermont, these types of systems tend to pay themselves off in under two decades. Solar energy can also be harnessed through passive solar design (day-lighting and space heating) with Green Building Design. This includes orienting buildings close to true south, as well as using appropriate windows on the south wall, installing thermal mass (brick, concrete, or water) to store the sun’s energy, and using appropriate levels of insulation. Through these designs, as much as 60% of a building’s space heat can be derived from the sun. This type of heating is termed “passive solar” because no moving parts are needed, the collection and storage system is built into the structure. Green Building Design principles also attempt to maximize the amount of natural light a building receives, in order to reduce the energy costs associated with daytime lighting. Active and passive solar systems are custom built based on the building site, building and purpose of the solar system. There are many factors that bear on siting solar systems. Many homes and businesses have good rooftop sites, or good sites nearby for ground mounted systems. Unfortunately some do not, such as properties where there is limited southern exposure, possibly blocked by other development or trees. This is common for more urbanized areas. One way to address this situation is through the development of “community-sized” PV projects or co-operative systems on the order of a few hundred kilowatts up to a few megawatts. Utility-scale PV developments are also becoming popular in other areas of the U.S. Often referred to as solar parks, farms, or ranches, these utility-scale PV installations are designed for the sale of merchant power (MWh) into the electric grid and can utilize several acres of land. Public concerns surrounding solar installations of this size usually focus on aesthetics and transmission line development. Improving technology, in cost and output, also suggests that Vermont’s solar energy potential will continue to grow. Vermont is already one of the top 10 states for PV on a per capita basis (Vermont’s 2011 Comprehensive Energy Plan). Today, smaller net-metered (or “grid-tied”) PV systems tend to produce power with a long-term levelized cost of about $.20/kWh (with the 30% Federal Tax Credit included). The following chart shows the dropping price of photovoltaic modules from the Department of Energy’s Solar Technologies Market Report7. There is also a wide range of photovoltaic technologies now 7 http://www.nrel.gov/docs/fy12osti/51847.pdf
Chart 1.2 Global Average PV Module Prices, all PV technologies 1984-2010 (Mints 2011)

NVDA ENERGY STRATEGY PAGE 21
under development, including various thin film technologies, which may further advance the use of solar systems in Vermont. METHANE Methane, a common gas found in the environment, can be burned to produce electricity. Large amounts of methane are produced through the anaerobic digestion of manure, agricultural wastes, and other organic wastes. Both large farms and landfills offer the best potential to utilize this resource. In agricultural practices, manure is collected in various containment systems, where it can be heated up for methane gas production and collection. The remaining manure by-product can be spread on fields as fertilizer, and the dry solids can be used for animal bedding. In agricultural practices, the procedure also destroys harmful pathogens, reduces water quality impacts, reduces manure odors, and provides a new source of income to local farmers. The Blue Spruce Farm in Bridgeport, Vermont was the first farm in the state to develop a manure-methane generation system. The farm began producing in January of 2005 and estimates production at 1.7 million kWh annually. The project is supported through the Central Vermont Public Service’s (CVPS) Cow Power Program, which grants financial assistance for the development of methane generation systems. Through this program, farmers receive 95 percent of the market price for the electricity produced plus the additional fees (4 cents/kWh) from participating rate payers. In the Northeast Kingdom the Maplehurst Farm, Maxwell Farm, and Chaput Family Farms have installed anaerobic digester systems and collectively produce approximately 4.9MW of electricity. According to the Renewable Energy Atlas of Vermont, there are another 31 dairy farms in the Northeast Kingdom that have the potential to support anaerobic digesters. With landfills, facilities are capped and have special extraction systems to remove the methane for generation. If not utilized, methane - which is 20 times more potent as a greenhouse gas than carbon dioxide - escapes into the atmosphere. In late 2005, the Coventry Landfill began producing electricity from the facility. According to the Washington Electric Cooperative, this facility currently provides two-thirds of the Co-op’s power demand. There are a number of smaller landfills in the region that may have the potential to produce electricity depending upon the content of the landfills and their age. WIND Wind energy has recently been on the forefront of the renewable energy movement. The U.S. Department of Energy has announced a goal of obtaining 5% of U.S. electricity from wind by 2020, a goal consistent with the current rate of growth of wind energy nationwide. Vermont is currently ranked 34th out of the lower 48 states for wind energy potential. At this time, our region harnesses wind energy through small-scale individual systems and one utility-scale wind farm (First Wind) located in Sheffield, VT. The First Wind facility, which consists of 16 turbines over 400’ tall, was the first large utility-scale wind farm permitted in Vermont following the experimental and much smaller Searsburg facility. Already permitted and currently under construction is the Kingdom Community Wind project, located in Lowell. Kingdom Community Wind will be the NEK’s second and Vermont’s largest utility-scale wind farm, utilizing 3 miles of ridgeline, and 21 turbines over 400’ tall, and is predicted to produce approximately 185,570 MWhs annually. There are several more utility-scale wind projects in the works at various
NVDA ENERGY STRATEGY PAGE 22
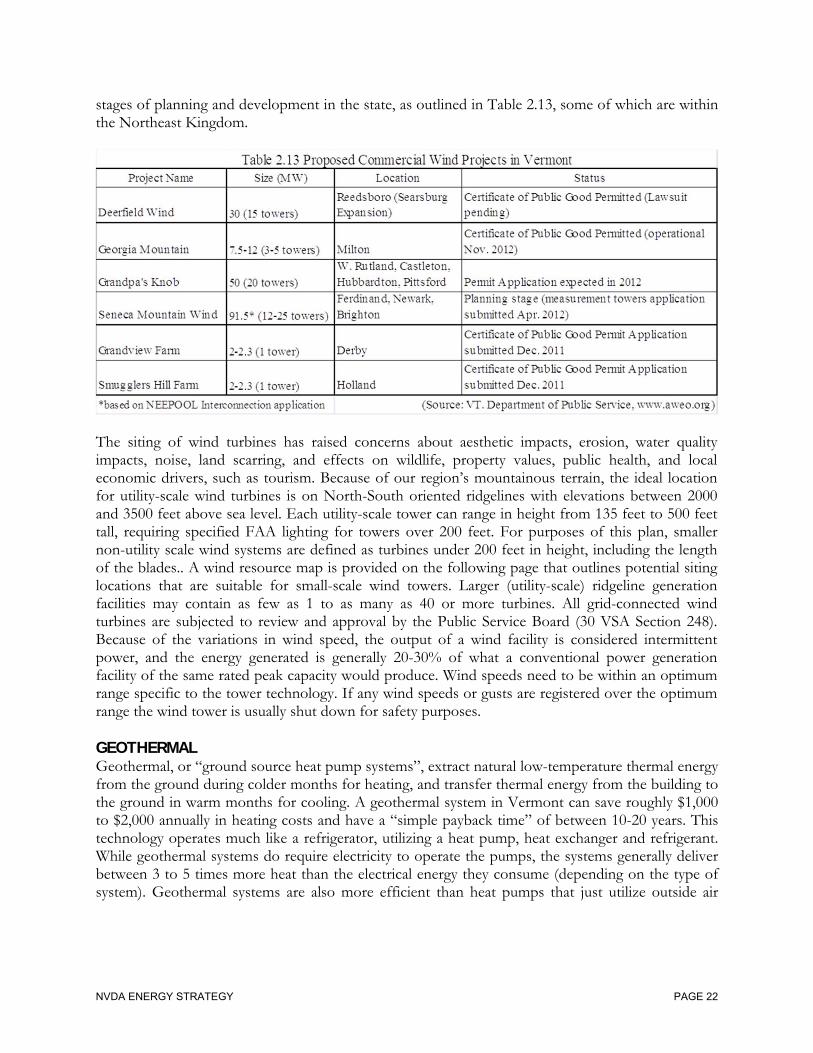
stages of planning and development in the state, as outlined in Table 2.13, some of which are within the Northeast Kingdom.
The siting of wind turbines has raised concerns about aesthetic impacts, erosion, water quality impacts, noise, land scarring, and effects on wildlife, property values, public health, and local economic drivers, such as tourism. Because of our region’s mountainous terrain, the ideal location for utility-scale wind turbines is on North-South oriented ridgelines with elevations between 2000 and 3500 feet above sea level. Each utility-scale tower can range in height from 135 feet to 500 feet tall, requiring specified FAA lighting for towers over 200 feet. For purposes of this plan, smaller non-utility scale wind systems are defined as turbines under 200 feet in height, including the length of the blades.. A wind resource map is provided on the following page that outlines potential siting locations that are suitable for small-scale wind towers. Larger (utility-scale) ridgeline generation facilities may contain as few as 1 to as many as 40 or more turbines. All grid-connected wind turbines are subjected to review and approval by the Public Service Board (30 VSA Section 248). Because of the variations in wind speed, the output of a wind facility is considered intermittent power, and the energy generated is generally 20-30% of what a conventional power generation facility of the same rated peak capacity would produce. Wind speeds need to be within an optimum range specific to the tower technology. If any wind speeds or gusts are registered over the optimum range the wind tower is usually shut down for safety purposes. GEOTHERMAL Geothermal, or “ground source heat pump systems”, extract natural low-temperature thermal energy from the ground during colder months for heating, and transfer thermal energy from the building to the ground in warm months for cooling. A geothermal system in Vermont can save roughly $1,000 to $2,000 annually in heating costs and have a “simple payback time” of between 10-20 years. This technology operates much like a refrigerator, utilizing a heat pump, heat exchanger and refrigerant. While geothermal systems do require electricity to operate the pumps, the systems generally deliver between 3 to 5 times more heat than the electrical energy they consume (depending on the type of system). Geothermal systems are also more efficient than heat pumps that just utilize outside air
NVDA ENERGY STRATEGY PAGE 23
because the ground/well source systems can take advantage of relatively constant temperatures below the frost line (45-60 Fahrenheit). 8 There are two main types of geothermal systems, open-loop and closed-loop. Open-loop systems utilize a deep rock well or pond to draw water to the heat exchanger where heat flows from the water into cold refrigerant. The refrigerant is then compressed, which greatly raises its temperature and converts it to vapor. Refrigerant vapors then transfers heat to water in a second heat exchanger that is then circulated to heat the building. The process operates in reverse for cooling. Closed-loop systems are slightly different in that they utilize piping in the ground or a pond that can be placed closer to the surface, but then require refrigerant or water with antifreeze to circulate in the piping. Open-loop systems are more efficient than closed-loop systems, and are often cheaper to install because they require less excavation. Open-loop systems are also a good fit for Vermont, since standing column wells can be constructed virtually everywhere. While existing well systems can have geothermal systems installed, installation of this technology is often cheapest during construction of a new building and development of a new well site. A geothermal well resource map is provided on the following page that outlines existing wells with a high potential for geothermal heating and cooling applications. BIOMASS Biomass is organic material that is burned to generate energy. The most common forms of biomass are wood, solid waste (biogas), and biofuels such as ethanol and biodiesel. Wood is already an abundant renewable resource in the region and commonly comes in the form of cordwood, wood chips, and wood pellets. Appropriate biomass applications include use as fuels for heating, electric generation, combined heat-and-power (CHP), and transportation. Wood chips and wood-pellets have become increasingly popular as a heating resource in the region. Wood chips - either bole chips or whole tree chips - are well suited for combustion to supply heat, hot water, or steam in institutional, commercial, and industrial settings. While wood-pellets can be used in these same applications, they have proven to be most popular in residential applications due to the increased efficiency and ease of existing operating systems. According to the Pellet Fuels Institute, sales of pellet-burning stoves and furnaces grew from 55,000 in 2007 to 141,208 in 2008. For institutional applications the Vermont Fuels for Schools Program has been extremely successful, installing 43 schools with heating systems that burn small-diameter waste wood. Several Vermont colleges now also have campus-wide district heating systems supported by wood-waste. Middlebury College, for example utilizes a 21,000 ton/year wood-chip fueled combined heat-and-power (CHP) system. Industrial and commercial enterprises in the state are also moving towards wood based heating systems, and in some cases co-generation. In the Northeast Kingdom the North Country Hospital, Ethan Allen Plant (Canaan), and Lyndon Furniture utilize wood-chip CHP systems to meet partial heat and power needs. The Vermont Department of Buildings and General Services operate a large number of facilities on wood-chips including the Montpelier Capital Complex, the Middlebury State Office Complex, the Emory Hebard State Office Building, and several state prisons. According to
8 Source: Heating Your Home or Business in Vermont with a Geothermal System (a NVDA Publication).

NVDA ENERGY STRATEGY PAGE 24
the Vermont State Agency Energy Plan (July 2005) wood resources account for only 2% of energy expenditures for state buildings, but yields 20% of the energy required. The region already supports a large scale wood-chip fueled electric generation facility. The Ryegate Power Station will be the second largest electric generation facility in the region once Kingdom Community Wind is built in Lowell. Capable of generating 172,367 MWh annually; the plant operated at 100% capacity in 2009, but was idle in the spring of 2012. New power purchase agreements have been drafted and the plant resumed production in June 2012. The plant remained shut down for a while because its retail price/kWh cannot compete on the electric spot market. Plant modifications underway will enable it to receive Renewable Energy Credits, effectively subsidizing its production costs to make its retail price more competitive. Ryegate Power Station is a good example of the difficulties in making an electric-only wood generation plant profitable and competitive. Overall, the ease of handling, local availability, low emissions, and general low-costs of wood resources will allow the region an opportunity to expand this resource if fossil fuel prices climb. One of the most efficient uses for wood-fuels is co-generation, the simultaneous production of both heat and power, such as the system in North Country Regional Hospital that generates a third of its electric needs and heats the entire hospital. Recent studies looking at co-generation opportunities in the region indicate that it works best when there is an equal need for heat and power9. Balanced heat and power loads are easier to provide for on the small scale, such as for an individual business but larger plants are more desirable, since they can secure more renewable energy incentives and the capital cost/kWh improves. Large co-gen applications (10+MW) may make sense if an equally large heat user can be found, such as a manufacturer that requires tremendous heat loads. Some engineers propose developing district heating systems along with co-gen plants in areas where a considerable industrial heat user is not available. District heating systems are utilized throughout Europe and one will soon come on-line in Montpelier. Unfortunately most of Vermont’s communities do not have the density to support nor afford the $400/linear foot installation cost district heating requires for distribution. In addition, the average connection cost for district heating is around $5,000 per homeowner. In other words, district heating is not an easy sell to tax payers. Siting wood-generation and co-generation facilities are not always easy either. Noise, emissions, truck traffic, and unsightly smoke stacks are concerns when siting facilities near residential neighborhoods and since these facilities use a renewable fuel that grows at a specific rate, overharvesting of the regional woodshed is also a concern. By diversifying transportation fuels with ethanol or biodiesel, the region would be able to reduce a significant portion of our fossil fuel consumption and stabilize transportation costs. Ethanol based fuels such as E85 are a combination of ethanol and gasoline. Corn is the most common element used to produce ethanol, even though it can be produced from a variety of elements, including wood. Ethanol burns cleaner than gasoline and is very effective in lowering fuel emissions. Unfortunately, the fuel also has significant problems in cold-weather, which make it less useful for Vermont’s climate. Biomass fuels are also vulnerable to natural disasters, such as drought and wildfires.
9 Town of Sutton - Burke Lumber Site Redevelopment: Wood Supply Assessment & Wood Pellet Manufacturing Facility Feasibility Study/Business Plan (June 2009, Innovative Natural Resource Solutions for NVDA), St. Johnsbury-Lyndon Industrial Park Energy Study (2007).

NVDA ENERGY STRATEGY PAGE 25
Biodiesel is a better fit as a biofuel in the state of Vermont, as it can easily be supported in the existing infrastructure of the region. Existing diesel engines and heating oil furnaces do not need to be altered in any way to use biodiesel. Both systems can use pure biodiesel, but combination fuels have been developed for maximum output, such as B10 and B20. Biodiesel is commonly made from soybeans, rapeseed (canola), and sunflowers; all of which can be grown in Vermont. Currently the Vermont Biodiesel Project is working to expand the usage of biofuels for heating and transportation in the state.
Energy Generation Facility Permitting Process As with the development of any energy generation facility, a Certificate of Public Good must first be issued by the Public Service Board. Prior to issuance, the Board takes into account the environmental, economic, and social impacts of a proposed facility (see Appendix A for specifics). Municipalities and other groups are allowed to participate in the Section 248 review process, but many find doing so to be difficult and expensive. At this time towns may only regulate the development of individual owner-consumption electric generation facilities that are not connected to the transmission grid. Moreover, under Section 248 the Public Service Board must consider, but is not bound by, environmental criteria and may approve a project simply on the basis that they deem the project to be in the “public good”.
Incentives and Subsidies There are considerable federal incentives that support the market for renewable energy development in Vermont. Without the tax credits and Renewable Energy Credits (RECs), some renewable technologies, such as utility-scale wind, would not be an economically viable resource. There are currently three major federal tax credits supporting the development of renewable energy facilities. The extension of some subsides by the Federal government is now currently in question, and as a result, the industry is presently unstable. Table 2.14 below lists the current federal subsidies and their eligible renewable technologies:
Business Investment Tax Credits are a major contributor to the renewable energy market at this time. Investors receive deductions from 10-30% of the cost of investing, purchasing, or construction depending on the type of renewable technology. Vermont provides a corporate state-tax credit that
Program Name Applicable Technology
Business Investment Tax Credit (ITC)
Solar Water Heat, Solar Space Heat, Solar Thermal Electric, Solar Thermal Process Heat, Photovoltaics, Wind, Biomass, Geothermal Electric, Fuel Cells, Geothermal Heat Pumps, CHP/Cogeneration, Solar Hybrid Lighting, Fuel Cells using Renewable Fuels, Microturbines, Geothermal Direct-Use
Modified Accelerated Cost-Recovery System (MARCS)
Solar Water Heat, Solar Space Heat, Solar Thermal Electric, Solar Thermal Process Heat, Photovoltaics, Landfill Gas, Wind, Biomass, Geothermal Electric, Fuel Cells, Geothermal Heat Pumps, Municipal Solid Waste, CHP/Cogeneration, Solar Hybrid Lighting, Anaerobic Digestion, Fuel Cells using Renewable Fuels, Microturbines, Geothermal Direct-Use
Renewable Energy Production Tax Credit (PTC)
Landfill Gas, Wind, Biomass, Hydroelectric, Geothermal Electric, Municipal Solid Waste, Hydrokinetic Power (i.e., Flowing Water), Anaerobic Digestion, Small Hydroelectric, Tidal Energy, Wave Energy, Ocean Thermal
Table 2.14 Federal Subsidies for Renewable Energy Development

NVDA ENERGY STRATEGY PAGE 26
investors can claim in addition to the federal credit. The federal Production Tax Credit (PTC) provides residential and business generators of renewable power a tax credit of up to 2.2 cents/kWh for 10 years depending on the type of renewable technology. In order to claim the Production Tax Credit eligible facilities must be in-service before a set date. Wind technologies will be the first to expire from the Production Tax Credit, unless the in-service deadline of December 31, 2012 is extended. All other eligible PTC technologies have an in-service deadline of December 31, 2013. At this time it is unclear if the Production Tax Credit will be extended by Congress for wind facilities. Modified Accelerated Cost Recovery System (MACRS) is another extremely important subsidy, especially to wind farms at this time, due to the short life-span of wind turbines. The system provides specific tax depreciation deductions for a variety of technologies based on pre-determined life-spans. Renewable Energy Credits (RECs) are also a major supporting factor in the development of renewable energy. RECs are derived from the Renewable Portfolio Standards (RPS) laws mandatory in Massachusetts, Connecticut, Rhode Island, Maine, and New York. Although similar to Vermont’s Renewable Portfolio Goals, the standards require utilities to have a certain percentage of renewable power in their mix. Commonly the RPS starts at 1-5% in the first year and increases to as much as 20% in ten years. Most RPS policies involve a credit trading mechanism, so that companies with extra renewable power can sell the extra "renewable-credits" to utilities who haven't met their RPS requirement. Vermont currently allows the sale of renewable credits in other New England states, since Vermont’s goals are not mandatory. Essentially as Vermont utilities build additional renewable generation, the RECs can be sold separately from the electricity to other states’ utilities, where they have a higher value, thereby subsidizing the development of the new renewable generation in Vermont. Unfortunately, the separate sale of RECs also has provided for a kind of a ‘double counting’ of renewable generation. For example, a Vermont utility can currently claim to provide renewable power to its ratepayers (possibly as part of the Vermont SPEED Program), while at the same time sell the RECs from the same power to Massachusetts ratepayers. Overall, this is clearly an issue which deserves further consideration and refinement by the Legislature. Property-Assessed Clean Energy (PACE) Districts are a relatively new method to encourage property owners to install renewable energy systems and make energy efficiency improvements. PACE programs allow property owners to borrow money to pay for such things as energy efficient water heaters, lighting, furnaces, boilers, windows, programmable thermostats, and insulation, as well as solar heating, PV, wind and biomass systems. The amount borrowed is typically repaid via a special assessment on the property over a period of up to 20 years. In Vermont, local governments are authorized to create PACE Districts to provide financing. Participating property owners must agree to a special assessment and lien on the property and pay a one-time, non-refundable fee (equal to 2% of the assessment) to support the reserve fund created to cover losses in the event of foreclosure of participating properties. The district may release a lien on a property once the property owner has met the terms of the loan. At this time only a few local towns are considering implementing PACE Districts.
Efficiency & Conservation Energy efficiency is a very significant part of any long-term energy strategy, yet it is often overlooked when adopting an energy plan. Conservation involves reducing or eliminating unnecessary energy use and waste (e.g. lowering thermostats, limiting hours of operation, etc). Efficiency also involves reducing the total amount of energy consumed, but the reduction comes from improving equipment
NVDA ENERGY STRATEGY PAGE 27
or operating processes that use energy. Efficiency can be improved in any number of ways (e.g. switching to efficient fluorescent light bulbs, insulating an attic, driving a more fuel efficient vehicle, , or replacing older equipment with new technologies that consume less energy). The net result is that less energy is used, while the overall costs needed for energy are reduced. Energy efficiency improvements typically have a cost, but the payback periods will vary depending upon the cost of the improvement and the amount of energy that is saved. Weatherization improvements are energy efficiency measures and include such things as insulating walls and ceilings, installing programmable thermostats, and replacing inefficient machinery. There are energy efficiency and weatherization programs in Vermont available to businesses and homeowners and these do change over time. Efficiency Vermont is a good starting place to find out what is available. EFFICIENCY VERMONT In 1999, the Vermont Public Service Board created an energy efficiency utility for the state, called Efficiency Vermont. The utility is funded by an energy efficiency charge on consumer electric bills, similar to a system benefits charge. Efficiency Vermont offers energy and money-saving programs to consumers that allow them to install and use energy-efficient construction designs, products and equipment. They also offer low-income energy assistance programs. Over the last ten years, Efficiency Vermont has had a strong impact on reducing energy consumption. According to Efficiency Vermont’s 2011 Annual Report, the savings from their programs have met 11% of Vermont’s 2011 total electrical energy needs. In 2011 alone, they were responsible for saving 108,000 MWhs of electricity, 66,762 MMBTUs, and 790,000 tons of cumulative CO2 emissions state-wide. In the Northeast Kingdom, their programs accounted for 5,609 MW hours of electricity savings, a net -462 MMBTU of fuel savings, and 27,300 CCF of water savings in 2011 (Efficiency Vermont Year 2011 Annual Report). In 2009, Vermont Energy Investment Corporation signed a new three-year contract with the Public Service Board to provide services through Efficiency Vermont that will raise the annual energy savings goal to 360,000 MWhs from 204,000 MWhs (2005-2008) and provided a $100 million dollar budget to do so. The economic benefit goal for the current contract term aims to provide $85 million in total resource (lifetime) benefits to the Vermont economy. This translates to a benefit cost ratio of 1.2 (Highlights of Efficiency Vermont’s Plans for 2009-2011). As of Efficiency Vermont’s 2009 Annual Report, 95% of the Caledonia County and 85% of Orleans/Essex Counties total resource benefit goals had been met, accounting for a total of $6.4 Million in savings.
NEK PORTFOLIO
Portfolio Recommendations As we look at meeting the energy needs for the Northeast Kingdom it is important to remember that there are several distribution companies that supply the region with power and each will need to focus on their individual future needs. All distribution companies are planning for greater diversity in their resources as well as evaluating fuel sources, contract lengths, and contract terms.

NVDA ENERGY STRATEGY PAGE 28
The following recommendations express how each resource should fit into the regional energy portfolio for the next eight years: FOSSIL FUELS Base-load Power, Standard Heating & Transportation Fuel Resource Determining the future extent to which fossil fuels can remain a part of the region’s energy mix is difficult. For years, experts have been trying to determine the time frame in which world oil production will peak and just how long worldwide supplies will be able to keep up with demand. At the time of this writing, world oil production is growing more slowly than demand, causing a major increase in fuel prices. The trend of rising fossil fuel prices over the long-term is expected to continue although downward fluctuations do occur. Natural gas has been a relatively recent exception to this trend for fossil fuels. Expanding production capacity can be developed, but this only translates into a short-term fix. For the next eight years fossil fuels, with the exception of natural gas, should play a reduced role in the region’s energy mix. HYDRO Base-load & Intermittent Power Resource While this energy source is renewable, the ability to create new hydro-power generation is limited. Some of the best hydro resources in the region are already generating, while permitting new facilities has been a long and difficult process. At this point the focus for hydro-power should be focused on maintaining facilities with renewed permits, upgrades to aging infrastructure, and improved safety standards. The development of new facilities should be pursued where practical, and may now be easier under new state law. NUCLEAR Base-load Power Resource Nuclear power is a reasonable priced base-load resource. The Vermont Yankee plant provided a significant portion of the state’s electricity and its power has been replaced by utilities with other base-load resources, primarily from Hydro Quebec. Nuclear energy should remain an option for the region’s energy portfolio, either through Vermont Yankee (if it’s relicensed), or through other nuclear facilities in New England. SOLAR Intermittent Power & Supplemental Heating Resource Solar power (photovoltaic) has an ability to meet some of our future energy needs, by successful implementation as a supplemental resource. The recent decrease in cost of PV and technology advances suggests that prospects for this resource will continue to improve. A gradual, sustainable increase in the use of solar power should be encouraged, especially in residential applications. Solar hot water heating is already a proven cost reducer and/or stabilizer. This technology should be considered where applicable. Green Building Design principles, including passive solar design, are also a very cost-effective way to help reduce energy consumption and should be encouraged in renovations or new buildings. METHANE Base-load Power Resource Methane proves to be a significant resource to meet our short-term energy growth and also support agricultural practices in the region. The only large-scale landfill in the region is already being utilized for methane generation, but there are at least 31 dairy farms with enough capacity to sustain a manure-methane generation facility (Renewable Energy Atlas of Vermont). Farms with over 200 cows can produce a favorable amount of generation, potentially over 1,000 MWhs/year. The development of such systems can be costly however. If state and federal grants, tax credits, and

NVDA ENERGY STRATEGY PAGE 29
incentives remain in place to combat the high start-up costs, manure-methane generation should be expanded in the region’s energy mix. WIND Intermittent Power Resource Two large utility-scale wind farms have already been permitted in the Northeast Kingdom and at least four other projects are in development stages. Given the recent increase in development pressure the NVDA region is experiencing in regards to utility-scale wind; the NVDA Board of Directors passed the following resolution10,
“The Executive Committee recommends a suspension of new construction of industrial size wind turbines in excess of two hundred feet for a three-year period. This will allow time for a thorough evaluation of the impact of wind towers on the Northeast Kingdom. Such an evaluation will be conducted by NVDA and include the following criteria (additional criteria may be added as determined by the Executive and Energy Committees:
The cost versus the benefit of industrial size wind turbines in the Northeast Kingdom;
what does objective data and science show concerning measurable health impacts, what does national and international research shows;
are transmission requirements being adequately addressed with these projects; do statutes, regulations and the review process (Section 248) provide ample
environmental protections for the development of higher elevation ridgelines; what is the impact of utility-scale wind turbines on property values and tourism in
the Northeast Kingdom; and, what impact do utility-scale wind turbines have on greenhouse gas emissions in
the Northeast Kingdom.” Upon completion of the Wind Study, the NVDA Energy Committee shall revise this version of the Energy Strategy to incorporate the findings from the study. While NVDA is recommending suspending utility-scale wind development, there is still very strong support for small-scale non-utility wind development as a resource for the region. For purposes of this plan, smaller non-utility scale wind systems are defined as turbines under 200 feet in height, including the blades length. Small-scale wind should remain a viable resource option for farms, communities, and landowners in the region. GEOTHERMAL Supplemental Heating Resource Geothermal has great potential for expansion in the Northeast Kingdom, with the most promising systems being open-loop well systems. This technology is also one of few renewable resources that can directly reduce fuel oil consumption used for space heating and should be encouraged in both existing and new construction in the region.
10 Area towns may take differing positions on wind energy facilities which may be at significant variance with NVDA’s resolution. Town plans will be deemed compatible with this regional plan and with other town plans so long as the plans demonstrate that wind energy was taken into consideration in the development of the town’s energy component.
NVDA ENERGY STRATEGY PAGE 30
BIOMASS Base-load Power, Standard/Supplemental Heating & Transportation Fuel Resource Biomass has significant potential to reduce the region’s fossil fuel consumption. The majority of our fossil fuel consumption is for transportation and home heating uses, only a small portion of fossil fuels are used in electricity generation for the region. Wood chips, wood pellets, and biodiesel hold the greatest potential for Vermont to transition these uses towards renewable energy. The expansion of these resources will also offer strong support for our traditional economy (forestry and agriculture) and stabilize regional fuel costs. In the next few years, biomass usage should be promoted and expanded as a significant resource to diversify the region’s energy portfolio and meet future energy needs. ENERGY EFFICIENCY & CONSERVATION The Northeast Kingdom expects energy efficiency improvements and weatherization could meet a significant portion of growth in energy demand. Through efficiency programs and weatherization, such as the ones offered by Efficiency Vermont, energy efficiency and weatherization efforts should be promoted and utilized as much as possible at the local and regional level. All municipalities should lead by example and conduct energy efficiency audits of public buildings and make efficiency and weatherization improvements to reduce energy consumption and save local taxpayer dollars.
REGIONAL GOALS & STRATEGIES
Policy Statement This region has a responsibility to plan for the production, storage, and distribution of energy to meet its local energy demand. Individuals, businesses, organizations, and communities are encouraged to explore emerging energy supply, efficiency, and net-metering opportunities that meet accepted environmental standards in order to satisfy their power demand. New industrial/utility energy development shall meet the highest standards required by law. Permitting authorities shall first consider current and historical land use and the culture of the region, community opinion, economic benefit, as well as the land owner’s rights. Any development shall to the extent possible be done so as to mitigate adverse impacts to the region. Any utility-scale energy generation project deemed acceptable by the Public Service Board shall include a plan for distributing benefits to the towns in the region proportional to the adverse effects experienced by that town. Long term maintenance, safety issues, decommissioning, and land reclamation procedures required at the end of the energy project’s life must also be included in the project plan. This plan aims to balance environmental quality and important natural resources with energy production. Significant local and regional support and clearly demonstrated benefits should exist in any energy proposal.
Regional Energy Goals & Strategies 1. An adequate, reliable, diverse, and secure energy supply will benefit the region.
Support the upgrade of regional transmission systems to continue to reduce constraints.

NVDA ENERGY STRATEGY PAGE 31
Support the maintenance and upgrade of existing energy generation facilities and related infrastructure.
Promote a diversified energy portfolio for the region.
Encourage local responders to plan for emergency energy resources (VEM Emergency Generator Grant Program generators).
2. Affordable energy alternatives will be available for the region’s users.
Assist in the development of businesses that support alternative energy use.
Support the development of small-scale renewable resources, such as wind and solar, and the use of supplemental sources (wood) to stabilize energy costs.
Promote and support rail infrastructure as a cost-effective transportation resource for the energy industry.
3. Net-metering capacity in the region will be maximized.
Encourage municipalities to become “clean energy districts” and participate in the PACE program (Property Assessed Clean Energy). This would provide consumers with options to more affordably implement grid tied renewable energy systems.
4. Energy generation that provides the best cost-benefit to the region will be promoted.
Promote wood-based energy generation to support the region’s forest industry.
Encourage the development of energy facilities and resources that help sustain local agriculture and forestry (i.e. grass/wood-pellets, small-wind, solar, farm-methane, wood-chip, biodiesel).
5. Environmental and aesthetic impacts of energy generation and usage will be considered.
6. Energy efficiency and weatherization will be an integral part of the energy portfolio.
Encourage municipalities to reduce their energy costs through conservation and efficiency, and weatherization programs
Support Local Energy Committee/Coordinator efforts to reduce energy consumption, improve efficiency and weatherization, and develop new generation resources.
Encourage municipalities to conduct energy audits and weatherization programs.
Encourage businesses to make energy efficiency investments and develop energy efficient production methods.
Promote energy efficient building design and construction methods (Green Building Design & LEED certification).
7. There will be broad public participation in the decision-making process.
Encourage the Vermont Legislature to develop policies that support the development of solar, small-wind, hydro-electric, farm methane and biomass generation facilities, while respecting current local land use and the culture of the region.

NVDA ENERGY STRATEGY PAGE 32
Encourage the PSB to examine the long-term sustainability of proposed facilities.
Ensure that developments subject to Act 250 consider new energy requirements.
Support the NVDA Board of Directors resolution for a three-year suspension of utility-scale wind development in the Northeast Kingdom until a study is completed.
8. Assessment of local needs and values on new energy development will be encouraged.
Encourage towns to address energy development in town planning and zoning.
Provide assistance to businesses/municipalities to develop cogeneration and other alternative energy strategies.

Vermont State Statute Appendix A Title 30: Public Service Board, Chapter 5 § 248 (b): (1) with respect to an in-state facility, will not unduly interfere with the orderly development of the region with due consideration having been given to the recommendations of the municipal and regional planning commissions, the recommendations of the municipal legislative bodies, and the land conservation measures contained in the plan of any affected municipality. However, with respect to a natural gas transmission line subject to board review, the line shall be in conformance with any applicable provisions concerning such lines contained in the duly adopted regional plan; and, in addition, upon application of any party, the board shall condition any certificate of public good for a natural gas transmission line issued under this section so as to prohibit service connections that would not be in conformance with the adopted municipal plan in any municipality in which the line is located;
(2) is required to meet the need for present and future demand for service which could not otherwise be provided in a more cost effective manner through energy conservation programs and measures and energy-efficiency and load management measures, including but not limited to those developed pursuant to the provisions of subsection 209(d), section 218c, and subsection 218(b) of this title;
(3) will not adversely affect system stability and reliability;
(4) will result in an economic benefit to the state and its residents;
(5) with respect to an in-state facility, will not have an undue adverse effect on esthetics, historic sites, air and water purity, the natural environment and the public health and safety, with due consideration having been given to the criteria specified in 10 V.S.A. §§ 1424a(d) and 6086(a)(1) through (8) and (9)(K);
(6) with respect to purchases, investments, or construction by a company, is consistent with the principles for resource selection expressed in that company's approved least cost integrated plan;
(7) except as to a natural gas facility that is not part of or incidental to an electric generating facility, is in compliance with the electric energy plan approved by the department under section 202 of this title, or that there exists good cause to permit the proposed action;
(8) does not involve a facility affecting or located on any segment of the waters of the state that has been designated as outstanding resource waters by the water resources board, except that with respect to a natural gas or electric transmission facility, the facility does not have an undue adverse effect on those outstanding resource waters;
(9) with respect to a waste to energy facility, is included in a solid waste management plan adopted pursuant to 24 V.S.A. § 2202a, which is consistent with the state solid waste management plan; and
(10) except as to a natural gas facility that is not part of or incidental to an electric generating facility, can be served economically by existing or planned transmission facilities without undue adverse effect on Vermont utilities or customers.


![contenthub.bvsd.org Course... · Web viewDRAFT. DRAFT. DRAFT. DRAFT. DRAFT. DRAFT. DRAFT. DRAFT. DRAFT. DRAFT. DRAFT. DRAFT. 12/28/2015BVSD Curriculum Essentials32 [Course Name]](https://static.fdocuments.us/doc/165x107/5e38c5b23f41ba01b81b757e/course-web-view-draft-draft-draft-draft-draft-draft-draft-draft-draft.jpg)
![contenthub.bvsd.org Course... · Web viewDRAFT. DRAFT. DRAFT. DRAFT. DRAFT. DRAFT. DRAFT. DRAFT. DRAFT. DRAFT. DRAFT. DRAFT. 6/15/2016BVSD Curriculum Essentials44 [Course Name] Curriculum](https://static.fdocuments.us/doc/165x107/5a9eefd17f8b9a67178c19c5/doc-courseweb-viewdraft-draft-draft-draft-draft-draft-draft-draft-draft.jpg)


![contenthub.bvsd.org Catalog/5 6... · Web viewDRAFT. DRAFT. DRAFT. DRAFT. DRAFT. DRAFT. DRAFT. DRAFT. DRAFT. DRAFT. DRAFT. DRAFT. 6/15/2016BVSD Curriculum Essentials44 [Course Name]](https://static.fdocuments.us/doc/165x107/5d46356d88c99379458b9579/catalog5-6-web-viewdraft-draft-draft-draft-draft-draft-draft-draft.jpg)


