Final Direct Surge Control Report & GMRC Project Plan Library/Research/Oil-Gas/Natural Gas... ·...
45
Increased Flexibility of Turbo-Compressors in Natural Gas Transmission Through Direct Surge Control Final Direct Surge Control Report & GMRC Project Plan October 2001 - December 2004 Prepared by Robert McKee Shane Siebenaler Danny Deffenbaugh of Southwest Research Institute ®
Transcript of Final Direct Surge Control Report & GMRC Project Plan Library/Research/Oil-Gas/Natural Gas... ·...

Increased Flexibility of Turbo-Compressors in Natural Gas Transmission Through
Direct Surge Control
Final Direct Surge Control Report & GMRC Project Plan
October 2001 - December 2004
Prepared by Robert McKee
Shane SiebenalerDanny Deffenbaugh
of Southwest Research Institute®

Project Identification
This DOE project was directed and funded by DOE’s Office of Fossil Energy, the National Energy Technology Laboratory, and theStrategic Center for Natural Gas and Oil, in the Delivery Reliability Program, as part of the Natural Gas Infrastructure Program.
The Co-funders are the Gas Machinery Research Council and Siemens Energy and Automation Other participants were Duke and El Paso Energy and Solar Turbines. Conducted by Southwest Research Institute

Centrifugal Compressor Operating Map
1.2
1.24
1.28
1.32
15 30 45 60
Inlet Volume Flow
Dis
char
ge P
ress
ure
Rat
io
1 0 0 % RPM9 5 % RPM9 0 % RPM8 5 % RPM Surge LineSurge Cont rol
Compressor Curve Showing Surge Line and Operational Boundaries
SUR
GE
LIN
E
STONEWALL
MAX SPEED/ MAOP/ POWER LIMIT
MINIMUM SPEED LIMIT LIMIT
Surge is a potentially damaging instability. Surge limits low flow operations. Current controls results in unnecessary recycle flow.

Objectives
To develop an internal surge control sensor and an associated surge control system that will allow reduced surge margins, increased range and flexibility of operation, and safe minimization of the energy and costs of avoiding surge in pipeline centrifugal compressors.To meet the needs of the natural gas industry for improved surge control.

What happens before and during surge?
In some, but not all cases, surge is preceded by unsteady pulsation and vibrations due to stall. In other cases, there are no vibrations, pulsation, or warnings and surge occurs suddenly. Surge is a complete collapse of compressor flow and results in gas travelling backwards through a forward spinning impeller.Surge is energetic and can cause damage to thrust bearings, seals, impellers, etc. A flow re-circulation occurs at the impeller inlet as
identified by previous GMRC research
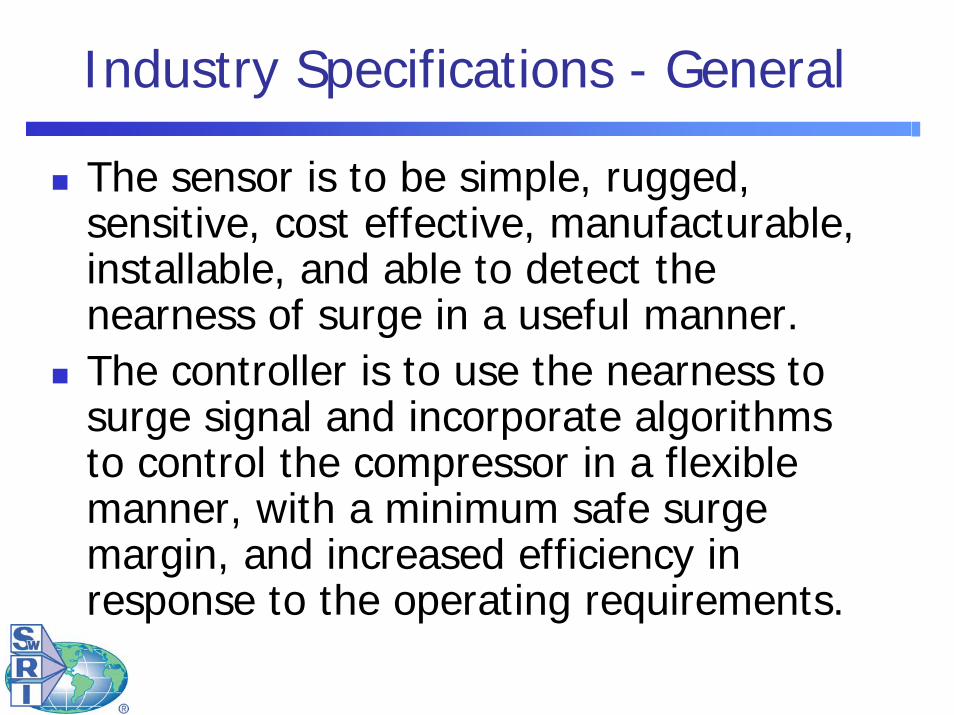
Industry Specifications - General
The sensor is to be simple, rugged, sensitive, cost effective, manufacturable, installable, and able to detect the nearness of surge in a useful manner. The controller is to use the nearness to surge signal and incorporate algorithms to control the compressor in a flexible manner, with a minimum safe surge margin, and increased efficiency in response to the operating requirements.

Design Process and Typical Drag Probe
• Size probe for max and min velocity & force
• Size bending beam for support & strain sensitivity
• Predict & avoid vortex & mech. natural frequencies
• Design probe holder & wire way
• Iterate on design until all is OK

Flow Test Results for a Drag Probe
-5
0
5
10
15
20
25
30
0 100 200 300 400 500 600 700
Flow Rate ACFM
Stra
in m
icro
inch
es
Base84 Repeat Rep2 130
Flow Test of Long Probe in 1-3 Direction at 84 and 130 Degrees
One Direction Flow at Two Temperatures

Flow Test Results as Force vs. Strain
-5
0
5
10
15
20
25
30
0 10 20 30 40 50 60 70 80 90
Force (Calculated)
Stra
in m
icro
inch
es
Base 84 Repeat Rep2 130
Flow Test of Long Probe in 1-3 Direction at 84 and 130 Degrees
Flow calibrations are not necessary for every probe

A Finding from the Test Program
Direct Surge Control in the present implementation with a probe at the impeller inlet is applicable for modern 3D impellers and not for older units with 2D impellers where the blades are recessed from the inlet. It is estimated that between 66 and 80 percent of pipeline centrifugal compressors in use are of the modern 3D design.

Laboratory Compressor Test at Low Speed Axial & Tangential Strain with Scaled Flow
-10
-5
0
5
10
15
20
25
30
2:26 2:34 2:41 2:48 2:55 3:02 3:10 3:17 3:24
Time
Stra
in A
xial
AxialStr ScFlow TangSt4
Second Lab Test 13,100 RPM

Laboratory Compressor Test at High Speed Axial & Tangential Strain with Scaled Flow
-2 0
-1 5
-1 0
-5
0
5
1 0
1 5
2 0
2 5
3 0
10:45 10:46 10:47 10:48 10:48 10:49 10:50
Time During Test
Stra
in
AxialStr ScFlow TangSt4
Second Lab Test 19,200 RPM

Increased Range on the Laboratory Unit Map with Use of Direct Surge Detection
0
1000
2000
3000
4000
5000
6000
7000
8000
9000
10000
0 500 1000 1500 2000 2500 3000
Inlet Flow Q
Head
ft-
lbf/l
bm
LowS p
Me dS p
De signS p
HighS p
13,100
16,020
19,240
21,865
S urgeLine
Turndown by Surge Line = 47%, by Surge Probe = 68%

Plot of Axial Strain Changes as a Function of Flow Coefficient for Laboratory Tests
-25
-20
-15
-10
-5
0
5
10
15
20
25
30
0 0.2 0.4 0.6 0.8 1 1.2 1.4 1.6
Flow Coefficient
Axia
l Stra
in
13.1K 16.0K 19.2K
Strain vs. Flow Coefficient

Diagram of Flow Vectors as Surge is Approached with a Drag Probe Location
1 2
3 4

Requirements for Direct Surge Detection
The route of the wire within and leaving the compressor must be protected and secure. Solid core wires in a quality compression fitting are needed.The output of the strain gauge bridge from the probe must be stable and repeatable. The strain gauge circuit should automatically balance when a compressor is shut down for a period of time.

Long-Term Stability of Strain Signals with Operational Changes
-1.5
-1
-0.5
0
0.5
1
1.5
2
8/ 10/ 04 0:00 8/ 12/ 04 0:00 8/ 14/ 04 0:00 8/ 16/ 04 0:00 8/ 18/ 04 0:00 8/ 20/ 04 0:00 8/ 22/ 04 0:00 8/ 24/ 04 0:00
Time During Monitoring
Axi
al &
Tan
g St
rain
Vol
ts
Axia l
Ta nge nt
Flow

Field Test B - Axial and Tangential Strain at Low Pressure & Low Speed
-40
-20
0
20
40
60
80
14:05 14:12 14:19 14:26 14:34 14:41 14:48
Time
Stra
ins
& F
low
Rel
ated
Axial Tang Flow
Test B, approaching surge at low pressure & low speed

Field Test C - Axial and Tangential Strain at Low Pressure & Low Speed
-40
-20
0
20
40
60
80
16:26 16:33 16:40 16:48 16:55 17:02 17:09 17:16
Time
Stra
ins
& F
low
Rel
ated
Axial
Tang
Flow
Test C, approaching surge at low pressure & low speed

Field Test E - Axial and Tangential Strain at Low Pressure & Low Speed
-40
-20
0
20
40
60
80
15:00 15:07 15:14 15:21 15:28 15:36 15:43 15:50
Time
Surg
e Pa
ram
eter
s
Flow DP Axial St
Tangent St
Approach Into Surge at Low Pressure (200 psia) and Low Speed

Plot of Strain Difference as a Function of Nominal Flow for Lab and Field Tests
-50
-40
-30
-20
-10
0
10
20
30
40
2 4 6 8 10 12 14 16
Flow
Stra
in D
iff
13,100RPM16,000RPM19,200RPMNG Test B NG Test CNG Test E

Axial and Tangential Strain Changes During a Rapid Approach to Surge
-10
0
10
20
30
14:57 14:58 14:59 15:00 15:00 15:01
Time
Varia
ble Axial
Tangent Flow Scal
Rapid Approach to Surge July 29, 2004

-100
-50
0
50
100
150
200
250
300
350
400
13:50 13:52 13:53 13:54 13:56 13:57
Time
Axi
al S
trai
n
Tangential Strain
Axial Strain
Scaled Flow Rate
Axial and Tangential Strain During a Moderate Pressure Approach to Surge

Axial and Tangential Strain During a High Pressure High Speed Approach to Surge
-100
-50
0
50
100
150
200
250
300
16:06 16:07 16:09 16:10 16:12 16:13 16:14 16:16 16:17 16:19 16:20
Time During High Speed Test
Stra
ins
and
Flow
Scaled Flow Rate
Axial Strain
Tangential Strain

Trends is Strain as the Field Compressor Approached Surge
-100
-80
-60
-40
-20
0
20
40
60
80
100
100 150 200 250 300 350 400
Flow DP
Stra
ins
Axia l S t
Tangent S t
Appro ximate Vo lumetric F lo w Ra tes

Field Compressor Performance Map with Direct Surge Control
1.06
1.07
1.08
1.09
1.1
1.11
1.12
1.13
1.14
1.15
1.16
0 200 400 600 800 1000 1200 1400 1600 1800 2000
Inlet Flow ACFM\
Pres
sure
Rat
io
16K
17K
18K
19K
20K
Surge Limit
Data Points
SurgeControl
New Control
Data Points

CFD Modeling of Impeller Inlet Flows
To determine if CFD analysis can be used to predict re-circulation zones. To explain the differences between 2D and 3D impeller results. Undertaken as a result of improved modeling capability and better understanding of geometric and operational flow effects on re-circulation.

Cross-Section of the Modeled Impeller Inlet Flow Path

CFD Models of 3D and 2D Impellers

CFD Results at Design Flow (1037 ACFM)
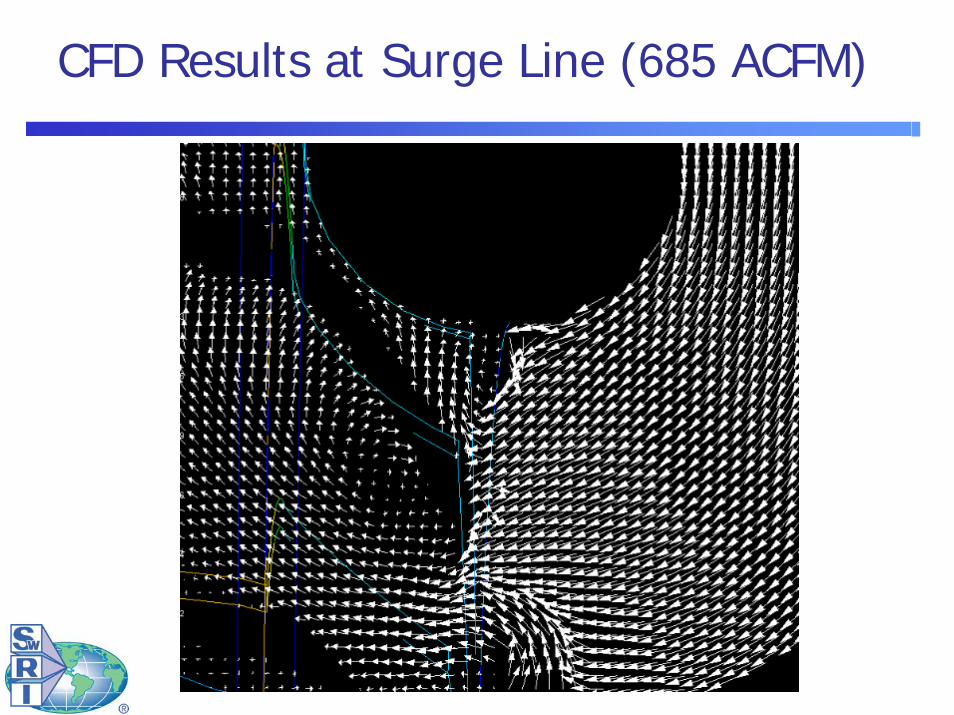
CFD Results at Surge Line (685 ACFM)

CFD Results at Near Actual Surge
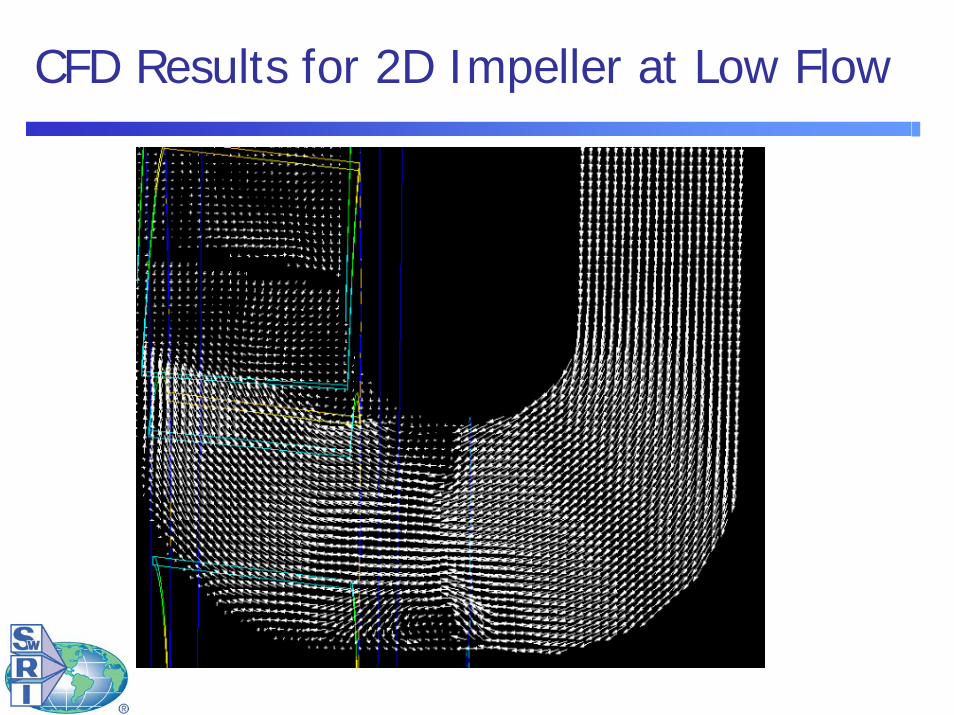
CFD Results for 2D Impeller at Low Flow
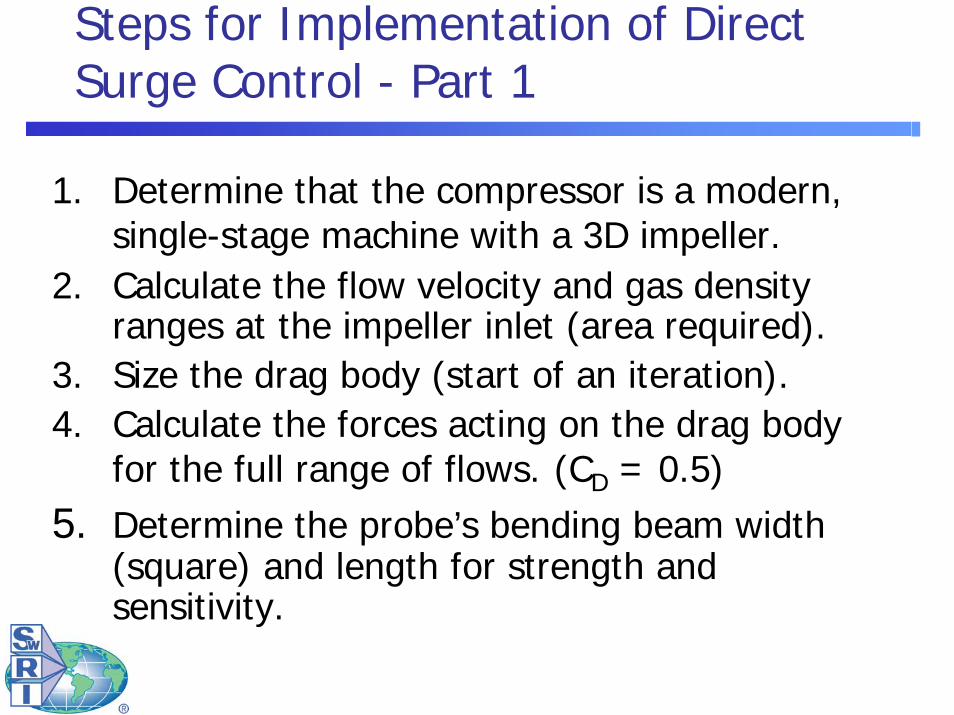
Steps for Implementation of Direct Surge Control - Part 1
1. Determine that the compressor is a modern, single-stage machine with a 3D impeller.
2. Calculate the flow velocity and gas density ranges at the impeller inlet (area required).
3. Size the drag body (start of an iteration).4. Calculate the forces acting on the drag body
for the full range of flows. (CD = 0.5)5. Determine the probe’s bending beam width
(square) and length for strength and sensitivity.

Steps for Implementation of Direct Surge Control - Part 2
6. Calculate the strain expected from gauges due to maximum and near surge flows.
7. Calculate the mechanical natural and vortex shedding frequencies. Check that these do not coincide with compressor or other frequencies.
8. Design the probe holder to secure the probe in the correct location at the impeller inlet. Check the location relative to the expected re-circulation using a CFD analysis.
9. Check that the final design is properly sized, rugged (strong), sensitive, and vibration free. If it is not, return to Step 3 to adjust variables.

A Drag Probe Resulting from Design Steps and Ready for Installation

Steps for Implementation of Direct Surge Control - Part 3
10. Arrange for the signal wires to pass through internal dividers, in conduits, and a pressure fitting to the outside of the compressor case.
11. Connect the probe wires to an amplifier and a surge controller to monitor axial and tangential strain signals, filter (avg.), and process the strain indications of approaching surge.
12. Tune the balance, gain, filter, and algorithms to control the compressor to minimize recycle flow and achieve stable, wider, and efficient operation.

The Surge Controller should;
Accommodate two half bridge amplifiers for the strain signals with ±5 volt outputs. Sample data at 80 to 240 Hz to follow flow changes but not high frequency noise or disturbances. Satisfy Class I, Div. 2, Group D in a NEMA panel.Monitor compressor speed, pressure, temperature, & flow as a convenience for display and recording.Filter by short averaging and process the strain signals through a selected algorithm such as the difference of axial and tangential strain and provide an output when the signal drops below a set limit.

Conclusions
Surge is a potentially damaging flow instability that limits the low-flow operation of centrifugal compressors and is usually avoided by wasteful and inefficient recycling of flow. Early GMRC research identified flow recirculation along the outer wall of a compressor inlet as a surge precursor and a potential control signal that can be sensed with a drag type probe. A step-by-step design procedure for direct surge control drag probes and controllers is defined by this research and given in the report.

Conclusions - continued a
Surge probes designed per the procedures and fabricated per specifications need to be checked functionally but not calibrated or flow tested. Test results show that for sensitive near surge detection, with the current methods the impellers must be a modern 3D design. Flow changes along the outer wall of a centrifugal impeller inlet do produce re-circulating flows, which cause axial and tangential strain changes on a drag probe that indicate the approach of surge.

Conclusions – continued b
A control algorithm based on comparing the difference between the axial and tangential strains is less sensitive in installation details and can be used as a surge control method. Operational tests show an increase in low flow range of up to 25 percent for compressors with direct surge control. A potential savings of 10 to 24 MSCF or $50 to $120 per hour of operation is expected. The possible industry wide saving is $50 to $85 million per year. CFD modeling can be used to check the location of a direct surge control probe in the re-circulation.

Demonstration and Commercialization of Direct Surge ControlThe direct surge control system is successful as a prototype but needs to be demonstrated as a commercial product in a pipeline compressor. SwRI, along with the GMRC advisors, will identify and interview a number of potential application contractors and will help to select one. The interest of all parties, DOE, Siemens Energy & Automation, Solar Turbines, others, and particularly the user companies, will be considered. A demonstration project led by an application contractor will install a system in a member’s pipeline compressor & operate it for all to see.

Tasks in the Demonstration and Commercialization Project
Task A. Identify and select an application contractor or contractor alliance. Task B. Transfer the technology for design and installation of direct surge probes and controller interfaces to the application contactor. Task C. Conduct a field demonstration of the commercial direct surge control system led by the contractor with oversight from SwRI & GMRC.
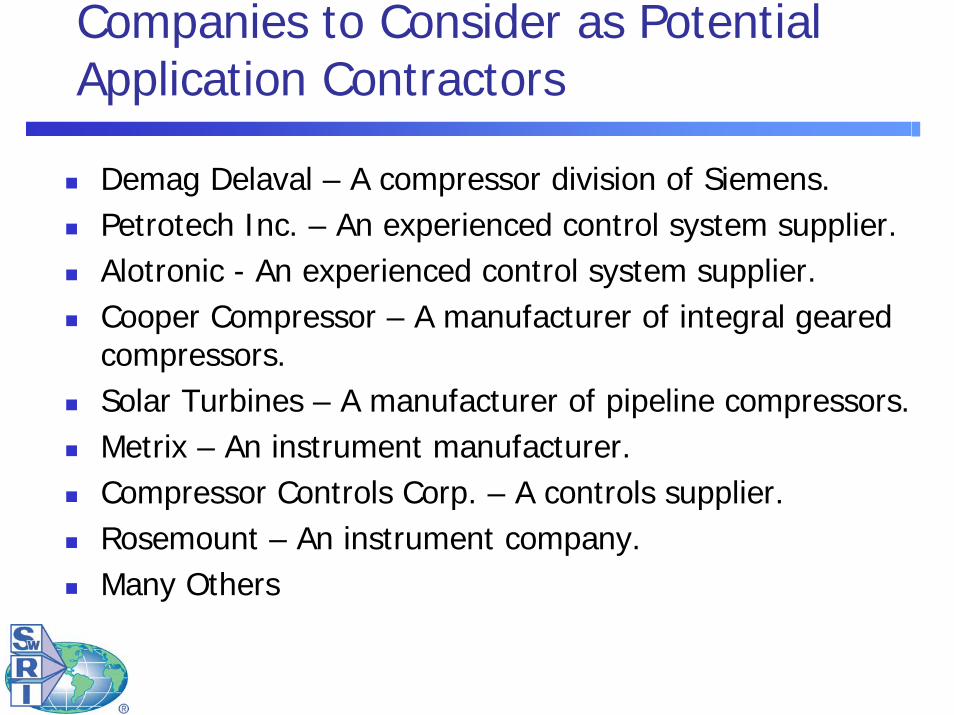
Companies to Consider as Potential Application Contractors
Demag Delaval – A compressor division of Siemens.Petrotech Inc. – An experienced control system supplier. Alotronic - An experienced control system supplier.Cooper Compressor – A manufacturer of integral geared compressors. Solar Turbines – A manufacturer of pipeline compressors.Metrix – An instrument manufacturer.Compressor Controls Corp. – A controls supplier.Rosemount – An instrument company.Many Others

SwRI’s Actions at the Start of the Project
Contact each company to discuss the technology and needs and to determine who is interested With the oversight committee, develop a selection criteria and what we need from the contractor.Request a proposal from the interested parties.Evaluate the proposal and with industry select one.Start the transfer of technology to the contractor.Plan for and monitor the demonstration test. Report to the GMRC at all stages in the project and on the final report.