FIMCAR – FRONTAL IMPACT AND COMPATIBILITY ASSESSMENT RESEARCH: STRATEGY AND …€¦ · ·...
15
Johannsen 1 FIMCAR – FRONTAL IMPACT AND COMPATIBILITY ASSESSMENT RESEARCH: STRATEGY AND FIRST RESULTS FOR FUTURE FRONTAL IMPACT ASSESSMENT Heiko Johannsen Technische Universität Berlin Thorsten Adolph Bundesanstalt für Straßenwesen Germany Robert Thomson VTI Sweden Mervyn Edwards TRL United Kingdom Ignacio Lázaro APPLUS IDIADA Spain Ton Versmissen TNO The Netherlands Paper Number 11-0286 ABSTRACT For the assessment of vehicle safety in frontal collisions, the crash compatibility between the colliding vehicles is crucial. Compatibility compromises both the self protection and the partner protection properties of vehicles. For the accident data analysis, the CCIS (GB) and GIDAS (DE) in-depth data bases were used. Selection criteria were frontal car accidents with car in compliance with ECE R94. For this study belted adult occupants in the front seats sustaining MAIS 2+ injuries were studied. Following this analysis FIMCAR concluded that the following compatibility issues are relevant: • Poor structural interaction (especially low overlap and over/underriding) • Compartment strength • Frontal force mismatch with lower priority than poor structural interaction In addition injuries arising from the acceleration loading of the occupant are present in a significant portion of frontal crashes. Based on the findings of the accident analysis the aims that shall be addressed by the proposed assessment approach were defined and priorities were allocated to them. The aims and priorities shall help to decide on suitable test procedures and appropriate metrics. In general it is anticipated that a full overlap and off-set test procedure is the most appropriate set of tests to assess a vehicle’s frontal impact self and partner protection. INTRODUCTION For the assessment of vehicle safety in frontal collisions, the crash compatibility between the colliding vehicles is crucial. Compatibility compromises both the self protection and the partner protection properties of vehicles. Although compatibility has received worldwide attention for many years, no final assessment approach has been defined. FIMCAR (Frontal Impact and Compatibility Assessment Research) is a research project started in October 2009 to address compatibility test procedures and is co-funded by the European Commission within the 7th Framework Programme. The aim of the project is to answer the remaining open questions identified in earlier projects (such as understanding the advantages and disadvantages of force based metrics and barrier deformation based metrics, confirmation of specific compatibility issues like structural interaction, investigation of force matching) and to finalise the test procedures required to assess compatibility. Within the project the research activities focus on car-to-car frontal impact accidents. However, other configurations such as lateral impact, car-to-HGV accidents etc. will be considered to ensure that changes made to cars to improve their compatibility in frontal impacts are not detrimental for other impact types. The FIMCAR project is harmonising its activities with the GRSP informal group on frontal impact
Transcript of FIMCAR – FRONTAL IMPACT AND COMPATIBILITY ASSESSMENT RESEARCH: STRATEGY AND …€¦ · ·...

Johannsen 1
FIMCAR – FRONTAL IMPACT AND COMPATIBILITY ASSESSMENT RESEARCH: STRATEGY AND FIRST RESULTS FOR FUTURE FRONTAL IMPACT ASSESSMENT
Heiko Johannsen Technische Universität Berlin Thorsten Adolph Bundesanstalt für Straßenwesen Germany Robert Thomson VTI Sweden Mervyn Edwards TRL United Kingdom Ignacio Lázaro APPLUS IDIADA Spain Ton Versmissen TNO The Netherlands Paper Number 11-0286
ABSTRACT
For the assessment of vehicle safety in frontal collisions, the crash compatibility between the colliding vehicles is crucial. Compatibility compromises both the self protection and the partner protection properties of vehicles.
For the accident data analysis, the CCIS (GB) and GIDAS (DE) in-depth data bases were used. Selection criteria were frontal car accidents with car in compliance with ECE R94. For this study belted adult occupants in the front seats sustaining MAIS 2+ injuries were studied. Following this analysis FIMCAR concluded that the following compatibility issues are relevant:
• Poor structural interaction (especially low overlap and over/underriding)
• Compartment strength • Frontal force mismatch with lower priority
than poor structural interaction
In addition injuries arising from the acceleration loading of the occupant are present in a significant portion of frontal crashes.
Based on the findings of the accident analysis the aims that shall be addressed by the proposed assessment approach were defined and priorities were allocated to them. The aims and priorities shall help to decide on suitable test procedures and appropriate metrics. In general it is anticipated that a full overlap and off-set test procedure is the most
appropriate set of tests to assess a vehicle’s frontal impact self and partner protection.
INTRODUCTION
For the assessment of vehicle safety in frontal collisions, the crash compatibility between the colliding vehicles is crucial. Compatibility compromises both the self protection and the partner protection properties of vehicles. Although compatibility has received worldwide attention for many years, no final assessment approach has been defined. FIMCAR (Frontal Impact and Compatibility Assessment Research) is a research project started in October 2009 to address compatibility test procedures and is co-funded by the European Commission within the 7th Framework Programme. The aim of the project is to answer the remaining open questions identified in earlier projects (such as understanding the advantages and disadvantages of force based metrics and barrier deformation based metrics, confirmation of specific compatibility issues like structural interaction, investigation of force matching) and to finalise the test procedures required to assess compatibility. Within the project the research activities focus on car-to-car frontal impact accidents. However, other configurations such as lateral impact, car-to-HGV accidents etc. will be considered to ensure that changes made to cars to improve their compatibility in frontal impacts are not detrimental for other impact types. The FIMCAR project is harmonising its activities with the GRSP informal group on frontal impact

Johannsen 2
and cooperating with EUCAR to address relevant stakeholders.
ACCIDENT ANALYSIS
Over the past twelve years, since the introduction of the European frontal impact legislation and Euro NCAP, the frontal impact crashworthiness of cars has improved significantly. The objectives of the accident analysis were: • To determine if compatibility issues identified
in previous studies [1, 2] are still relevant in the current vehicle fleet.
o structural interaction o frontal force matching o compartment strength (in particular
for light cars) • To determine the current nature of occupant
injuries and injury mechanisms The analysis was performed in two parts. Firstly, an overall analysis was performed, using data that could be analysed statistically, to investigate compartment strength issues, occupant injury patterns and injury mechanisms. Secondly, a detailed case analysis was performed, using all data available including photographic evidence, to investigate structural interaction and frontal force / compartment strength matching issues. To ensure that the results of the work were relevant to the current fleet only cars which were compliant with UNECE R94 or had an equivalent safety level (i.e. new cars) were selected for the analysis.
Data Sample
The accident data bases used for this study were: • UK Cooperative Crash Injury Study (CCIS) • German In-Depth Accident Survey (GIDAS) The following criteria were used to select the data samples used in this study: • Car involved in significant frontal impact • UNECE Regulation 94 compliant or equivalent
safety level. • Front seat adult occupants (i.e. over 12 years
old).
The resulting data sample sizes are shown (Table 1). The reason that CCIS had more cases of interest than GIDAS is that CCIS uses a stratified accident sampling procedure which favours accidents in which there were fatal or serious injuries. The GIDAS sampling procedure is designed to produce a sample representative of the national data. Also, it should be noted that for an accident to be included in the CCIS study a newer car (not older than 7 years at the time of the accident) must have been
involved. The result of this is that the CCIS data sample does not represent the national data precisely. The main bias is that older occupants are over-represented slightly.
Table 1. Number of occupants in CCIS and GIDAS data
samples
Database Fatal MAIS2+ Survived MAIS 1
CCIS 83 466 1236 GIDAS 16 155 701 The following additional criteria were used to refine the data sample for the majority of the analyses: • Occupant belted • Occupant sustained a MAIS 2+ injury
Overall Analysis
The overall characteristics of the data sets were investigated. The key finding from this work, for both CCIS and GIDAS data sets, was that there was a high proportion of fatal and MAIS 2+survived injuries in accidents with high overlap, i.e. >75% (Figure 1).
0
5
10
15
20
25
30
35
40
45
0 1-24% 25-49% 50-75% 75-100% Unknown
Perc
enta
ge o
f occ
upan
ts in
inju
ry s
ever
ity
grou
ps
Fatal
MAIS2+ Survived
MAIS1
0%
5%
10%
15%
20%
25%
30%
35%
40%
45%
1% - 24% 25% - 49% 50% - 74% 75% - 100% unknown
Fatal (n=9)
MAIS2+ survived (n=141)
MAIS1 (n=630)
Figure 1. Injury distribution by overlap for belted occupants (Note: in CCIS narrow object impacts (poles and trees) are included in the ‘0’ category whereas in GIDAS they are included in the ‘1-24%’ category).
For the GIDAS data there is a higher proportion of fatal and MAIS 2+ survived injuries for low
CCIS
GIDAS

Johannsen 3
overlap impacts (1-24%). However, the overlap definition in GIDAS refers to the amount of direct contact on the vehicle front, regardless of location. Thus many of the cases in the low overlap (1-24%) category are impacts with narrow objects such as trees. These impacts could be at the centre of the car. Injury mechanisms and patterns were examined to investigate compartment strength issues. In both CCIS and GIDAS the accident investigators attribute each injury a causation code. For example, an occurrence of multiple rib fractures may be attributed a code relating to the seat belt, whilst a fracture to the tibia or fibula may be attributed to contact with the facia. For this investigation the causation codes were grouped into the six categories below: • ‘Restraint’: relating to seatbelts and airbags,
mainly caused by acceleration loading • ‘Contact no intrusion’: relating to contact with
an interior component of the occupant compartment with investigators determined had not intruded.
• ‘Contact with intrusion’: as above but the structure contacted has intruded.
• ‘Non-contact’: for injuries where no contact with any component was made, e.g. whiplash.
• ‘Other object’: relating to contact with another object inside or outside the vehicle such as unrestrained loads or an external object such as a tree.
• ‘Unknown’: cause could not be determined.
186
167
102
2819 17
0
5
10
15
20
25
30
35
40
45
50
Restraint Contact No Intrusion
Contact Intrusion
Non-Contact Unknown causation
Other objectPerc
enta
ge o
f MA
IS2+
occ
upan
ts w
ith
AIS
2+ in
jury All occupants (n=410)
0%
5%
10%
15%
20%
25%
30%
35%
40%
45%
Restraint Contact No Intrusion
Contact Intrusion
Non-contact Unknown causation
Other object
AIS unknown
AIS2-AIS6
N = 141
n =16n =20
n = 2
n =61 n =59
n = 17
Figure 2. Percentage of belted MAIS 2+ injured occupants with AIS 2+ injury attributed to injury causation category.
The percentage of belted MAIS 2+ injured occupants who had an AIS 2+ associated with each of the categories above was determined (Figure 2). The proportion of occupants with injuries categorised as ‘contact with intrusion’ can be used to give an indication of the size of the compartment strength problems because reduction of the intrusion would likely help mitigate these injuries. The percentage of MAIS 2+ occupants who had an AIS 2+ injury caused by ‘contact with intrusion’ was 25% for CCIS and 12% for GIDAS. Note: for CCIS this reduces to 16% if intrusion of less than 10 cm is classified as ‘no intrusion’. Further analysis was performed with the CCIS data to investigate the cause of the most severe injury received by the occupant, see Figure 3. This showed that for 22% of occupants, the most severe injury was attributed to ‘contact with intrusion’. When this is compared with the 25% above it can be concluded that in the majority of cases when an occupant receives an AIS 2+ injury related to ‘contact with intrusion’ it is the most severe injury.
Figure 3. Cause of most severe injury for belted MAIS 2+ occupants in CCIS data set (Note: a small number of occupants are counted twice as they have two most severe injuries by more than one cause).
Figure 4. Distribution of ‘most severe’ injury by body region for MAIS 2+ belted occupants with their most severe injury caused by contact with intrusion.
For CCIS additional analysis was performed to investigate the injury patterns for injuries with
CCIS
GIDAS

Johannsen 4
specific causes. It was found that for occupants whose most severe injury was caused by ‘contact with intrusion,’ the injury was mainly to the legs with some to the thorax (Figure 4). For occupants whose ‘most severe’ injury was attributed to the ‘restraint system’, the injury was mainly to the thorax (62%) with some to the arms (21%) (clavicle fractures). Similarly for occupants whose most severe injury was attributed to ‘contact no intrusion’ the injury was mainly to the legs (42%) with some to the arms (30%) and thorax (12%). Further analysis was performed to investigate the nature of the injuries received by the occupant overall. It was found that the body region most frequently injured at the AIS 2+ level was the thorax for both CCIS and GIDAS (Figure 5).
0
5
10
15
20
25
30
35
40
45
% o
f occ
upan
ts w
ith A
IS2+
inju
ry in
bo
dy re
gion
All MAIS2+ occupants (n=409)
0%
10%
20%
30%
40%
50%
60%
Head Neck Arm Thorax Abdomen Pelvis Leg
Figure 5. Percentage of belted MAIS 2+ injured occupants with AIS 2+ injury to body region.
For CCIS this was closely followed by arm and leg injuries. For GIDAS this was closely followed by head, arm and leg injuries. It should be noted that for fatally injured occupants the CCIS analysis showed a high frequency of head injury. The arm injuries were often clavicle fractures. Other analysis found that: • As the overlap of the accidents increased the
proportion of injuries attributed to the ‘restraint system’ increased and the proportion caused by ‘contact with intrusion’ decreased.
• A higher proportion of older occupants sustained fatal and MAIS 2+ injuries compared with other occupants indicating that they have a greater risk of injury. This was particularly the case for elderly occupants (> 60 years old).
• Casualties in collisions with HGVs and objects sustained a higher proportion of fatal and MAIS 2+ injuries compared with other collisions such as car-to-car. This indicates the more injurious nature of HGV and object type collisions.
Detailed case analysis
In order to understand whether compatibility issues such as structural interaction and frontal force / compartment strength matching were still present in the current vehicle fleet, a detailed case analysis was necessary. This was because these types of compatibility problems can only be identified through a detailed analysis which includes examination of photographic evidence of both vehicles. The analysis was performed using CCIS data only because it was only for this data set that there were a sufficient number of relevant cases. The analysis was performed at an occupant level and divided into two parts, an analysis of fatal cases and an analysis of MAIS 2+ survived cases. For each part of the analysis, cases were divided into ones where intrusion was present and ones where intrusion was not present. The main reason for this was that it was only for the cases where there was intrusion present in at least one vehicle that it could be determined definitely whether or not a frontal force / compartment strength problem was present. This is because for cases with no intrusion in either vehicle it is known that the vehicles have absorbed the impact energy in their frontal structures. Hence the frontal force and compartment strength levels were not exceeded at least for that particular accident case. Similar arguments apply for structural interaction. When there is compartment intrusion it can be argued that improved structural interaction could increase the energy absorption efficiency of the front-end structures and consequently reduce the intrusion. When there is no intrusion, improved structural interaction will change the compartment deceleration pulse but it cannot be determined definitely if this would help mitigate occupant injury. The results of the fatal and the MAIS 2+ survived analyses are shown in Figure 6 and Figure 7 respectively. For fatal casualties, structural interaction problems were identified in 19 out of 48 cases (40 %). However, it is only in 12 of these cases where there was intrusion (25%) that it can be said definitely that improved structural
GIDAS
CCIS
Johannsen 5
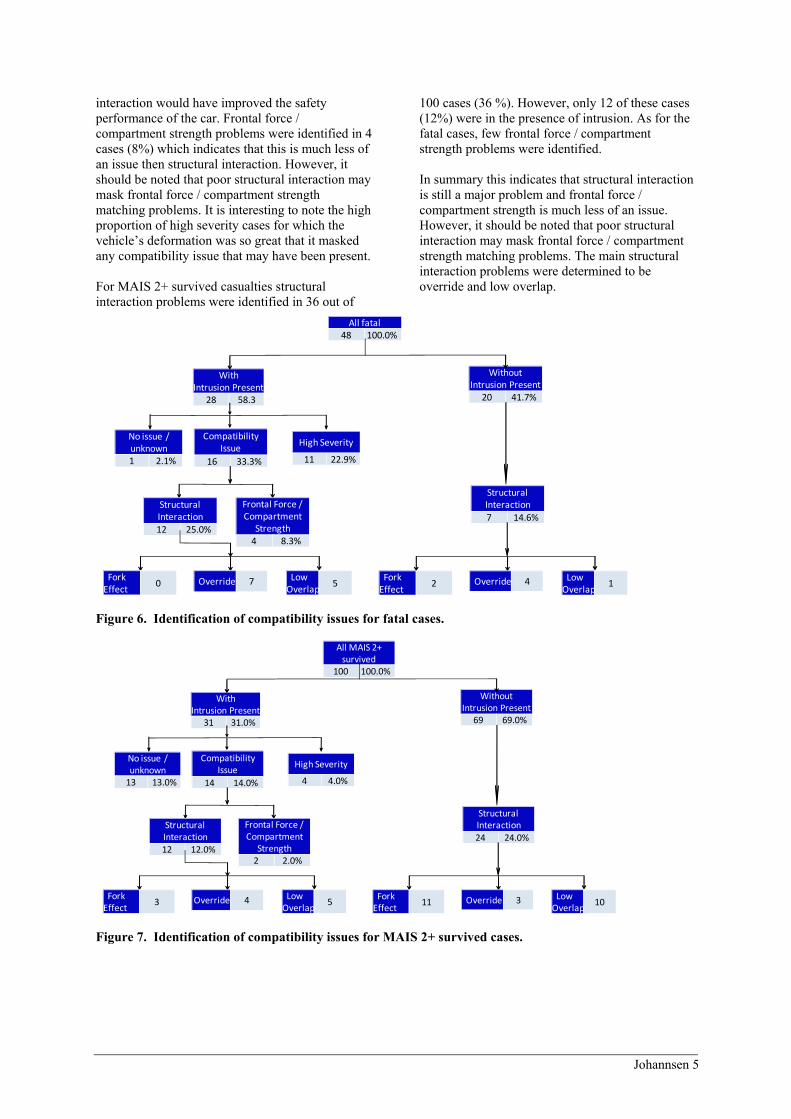
interaction would have improved the safety performance of the car. Frontal force / compartment strength problems were identified in 4 cases (8%) which indicates that this is much less of an issue then structural interaction. However, it should be noted that poor structural interaction may mask frontal force / compartment strength matching problems. It is interesting to note the high proportion of high severity cases for which the vehicle’s deformation was so great that it masked any compatibility issue that may have been present. For MAIS 2+ survived casualties structural interaction problems were identified in 36 out of
100 cases (36 %). However, only 12 of these cases (12%) were in the presence of intrusion. As for the fatal cases, few frontal force / compartment strength problems were identified. In summary this indicates that structural interaction is still a major problem and frontal force / compartment strength is much less of an issue. However, it should be noted that poor structural interaction may mask frontal force / compartment strength matching problems. The main structural interaction problems were determined to be override and low overlap.
AllMAIS 2+All fatal48 100.0%
With Intrusion Present
28 58.3
Compatibility Issue
16 33.3%
Structural Interaction 12 25.0%
Frontal Force / Compartment
Strength4 8.3%
High Severity
11 22.9%
ForkEffect
0 Override 7 LowOverlap
5
Without Intrusion Present
20 41.7%
Structural Interaction 7 14.6%
ForkEffect
2 Override 4 LowOverlap
1
No issue / unknown1 2.1%
Figure 6. Identification of compatibility issues for fatal cases.
AllMAIS 2+All MAIS 2+ survived
100 100.0%
With Intrusion Present
31 31.0%
Compatibility Issue
14 14.0%
Structural Interaction 12 12.0%
Frontal Force / Compartment
Strength2 2.0%
High Severity
4 4.0%
ForkEffect
3 Override 4 LowOverlap
5
Without Intrusion Present
69 69.0%
Structural Interaction 24 24.0%
ForkEffect
11 Override 3 LowOverlap
10
No issue / unknown
13 13.0%
Figure 7. Identification of compatibility issues for MAIS 2+ survived cases.

Johannsen 6
Conclusions from Accident Analysis
• Poor structural interaction between vehicles, in particular low overlap and over/underriding of car fronts, has been identified as an issue in the current vehicle fleet. o Identified in 40% of fatal and 36% of
MAIS 2+ injured cases. However, only in 25% of fatal and 12% of MAIS 2+ cases there was intrusion present and thus it can be said definitely that improved structural interaction would have improved the safety performance of the car.
• Frontal force / compartment strength mismatch between cars in the current fleet appears* to be less of an issue than poor structural interaction. *Note: structural interaction problems could be masking frontal force / compartment mismatch problems.
• Compartment strength of vehicles is still an issue in the current vehicle fleet especially in accidents with heavy good vehicles and objects. o Proportion of belted MAIS 2+ injured
occupants with AIS 2+ injuries caused by ‘contact with intrusion’ CCIS 25%, GIDAS 12%.
o When an occupant sustains an injury caused by ‘contact with intrusion’ in the majority of cases it is the most severe injury, often a leg or thorax injury but sometimes a head or arm injury.
• High proportion of fatal and MAIS2+ injuries in accidents with high overlap (>75%) o Proportion of injuries related to the
‘restraint’ increased with overlap whereas proportion of injuries caused by ‘contact with intrusion’ decreased.
FIMCAR PRIORITIES AND STRATEGIES
The general aim of FIMCAR is to develop a frontal impact assessment approach addressing self and partner protection in order to decrease the injury risks in single and multiple vehicle accidents. For compatibility it is expected that compatible vehicles will deform in a stable manner allowing the deformation zones to be exploited even when different vehicle sizes and masses are involved.
An assessment approach consists of one or more assessment procedures. For the FIMCAR project it is likely that the assessment approach consists of a full overlap and an off-set assessment procedure according to the decisions of previous research (i.e., VC-Compat [1] and EEVC WG15 [2], IHRA [3]).
The FIMCAR members reviewed the previous research and updated the results with the recent
accident analysis. As a result the priorities of the project were to address structural interaction, high overlap collision types, and the risk of injuries arising from acceleration loading.
In order to address the under/over riding aspect of structural interaction structural alignment is considered as an important parameter. To address structural interaction a common interaction zone is needed. The US voluntary commitment for the common vertical interaction zone is considered as the base line. When looking at the accident case with over riding involving two identical vehicles load spreading, related to the vertical arrangement of the loadpaths, is also important. Load spreading in the horizontal direction is also an important factor for addressing small overlap cases. Strong cross beams help provide good interaction in accidents with narrow objects and cross beams extending outboard from longitudinal members can improve structural interactions in cases with small overlap at the corners.
Energy absorption management is needed for two purposes: • To ensure that the impact energy is absorbed in
the car’s front-end structures without significant compartment intrusion
• To control the occupant compartment deceleration pulse.
The compartment integrity for single vehicle accidents and car-to-car accidents needs to remain in the current level. However, it is still unclear whether ECE R94 or Euro NCAP or both contribute to the current level of compartment integrity. It is likely that both contribute as ECE R94 tests the heaviest model of car whilst Euro NCAP tests the best-selling model but at a higher speed. According to the data analysed to date, there was no overrepresentation of intrusion cases with smaller vehicles. Thus it is not deemed critical to pay special attention on increasing compartment integrity for smaller cars, particularly if it creates additional test requirements.
In order to address the acceleration type injury issue a full overlap test in order to assess restraint capacity is proposed. In addition the combination of full frontal and off-set tests is meant to create two different pulses.
In summary the FIMCAR assessment approach shall aim at: • Detecting appropriate structures in the
common interaction zone • Promoting good load spreading by larger force
transmitting elements in the interaction zone and multiple load paths
• Keeping the compartment integrity at least at the current level

Johannsen 7
• Promoting favourable compartment deceleration pulses in vehicle-to-vehicle accidents
• Producing a more severe occupant restraint system test
• Presenting a variety of pulses for restraint system testing and triggering of safety devices
For the evaluation of the different test candidates, amongst others, the following criteria will be used: • Do the proposed metrics address the
compatibility issues described above? • Are appropriate pass / fail thresholds defined? • Does the assessment result reflect real world
performance?
ANALYSED TEST PROCEDURES
The previous work in compatibility has identified the need for both a full width and an offset test procedure. In FIMCAR full width, offset and offset Mobile Deformable Barrier (MDB) test and assessment procedures are being developed.
Full Frontal Test Procedures
In this chapter an overview of the status of current work to develop a full frontal test procedure is described. The main aim of this work is to develop a test procedure which can control a vehicle’s structural alignment and to provide a severe deceleration pulse for the assessment of the restraint system.
Two types of full width test are being investigated a Full Width Rigid Barrier (FWRB) test and a Full Width Deformable Barrier (FWDB) test. For both tests, the use of Load Cell Wall (LCW) data to control the structural interaction characteristics of a vehicle by controlling the measured force distri-bution is being investigated. The current defacto standard for a LCW is one that consists of 125 mm square elements with the bottom row mounted with an 80 mm ground clearance (Figure 8).
Figure 8. Overview of the specifications of the LCW (rows, columns, height of ground, Part 581 zone).
The FWRB test is conducted in many countries (USA, Canada, Japan, etc.) for both regulation and consumer testing programs. Test speeds range from 50 to 56 km/h. Instrumented Hybrid III dummies are typically used to measure occupant response.
The FWDB test has a 300 mm deformable element [4]. This barrier is currently only used in research applications and is not part of a regulation or consumer test procedure. Tests are conducted with Hybrid III dummies to assess occupant injury risk. Although essentially the same test configuration as the FWRB, the additional honeycomb is included to attenuate the initial contact with the barrier and introduce more shear forces within the vehicle structure. Past research shows that the deformable element reduces the influence of small, stiff structures such as protruding bolts, and the drive-train loads on the barrier.
The FWRB has several advantages over the FWDB such as the LCW measures vehicles forces directly, i.e. they are not filtered by a deformable element. Probably, the main advantage is that the FWRB is effectively already a defacto worldwide standard test. In contrast to this the FWDB has advantages over the FWRB test. These include that the FWDB is more representative of real world accident especially in initial stage of impact which is important for sensing of the crash for restraint system triggering. The engine dump loading is also attenuated, so it is easier to make an assessment of vehicle structural loading. Furthermore, the deformable face can help detect Secondary Energy Absorbing Structures (SEAS) and hence assess them because the deformable face ‘reaches’ into the vehicle and allows these structures to load the wall even though they may not be in direct contact with it. In addition items such as protruding bolts and towing eyes are less likely to influence LCW measurements. There is also the possibility to assess horizontal structures (bumper beams). On the other hand the possible risk of load spreading due to deformable face can be counted as a disadvantage.
For both the FWRB and FWDB tests metrics to assess a vehicle’s ability to apply loads in a common interaction zone are being developed. The main aim of these metrics is to enforce vertical structural alignment because this is a first basic step to increase the compatibility of car crash outcomes. After a common interaction zone is defined, issues such as horizontal distribution or frontal force can be addressed.
The concept on which this development is based incorporates aspects of the US voluntary commitment for the improvement of the geometric frontal impact compatibility of Light Trucks and Vans (LTVs) [5];and the current investigations by

Johannsen 8
Japan [6]. The concept was decided following the review of metrics developed previously, e.g. AHOF, homogeneity criterion. The aim of the US voluntary commitment is to ensure that LTVs have structure in alignment with a common interaction zone from 16 to 20 inches (406 – 508 mm), further named as “Part 581 zone”) measured vertically from the ground (Figure 8) to enable better interaction with cars. Current investigations by Japan are researching the feasibility of metrics which assess the forces measured in rows 3 and 4 of the load cell wall.
Metrics for FWRB tests Test data from JNCAP, NHTSA and previous European projects were used to develop the metric proposals. A total of 54 vehicles which were previously tested in a full width test at a speed of 56 km/h were used. The structural geometrical information for these vehicles was available, although some of the results had to be adjusted to account for the different LCW ground clearances.
The approach for development was that the metric should be able to identify vehicles which had structures which were in a vertical alignment with the ‘Part 581 zone’ and those which did not. The level of vertical geometric alignment was assessed based on the two parts of Option 1 of the US voluntary commitment [5] as shown in Figure 9.
Next metrics and associated performance limits were developed based on the LCW force measured in rows 3 and 4 to give the best correlation possible with the assessment of the vehicle made using the
US voluntary agreement approach ‘Option 1’ (PEAS alignment).
OPTION 1a: The light truck's primary frontal energy absorbing structure shall overlap at least 50 percent of the ‘Part 581 zone’.
OPTION 1b: AND at least 50 percent of the light truck's primary frontal energy-absorbing structure shall overlap the Part 581 zone.
OPTION 2: If a light truck does not meet the criteria of Option 1, there must be a secondary energy absorbing structure (SEAS), connected to the primary structure, whose lower edge shall be no higher than the bottom of the Part 581 bumper zone.
Figure 9. Options from the US voluntary commitment explained [5].
To ensure that the metrics assessed the vehicle’s structure only and not ‘engine dump’ loading, LCW data before the time when the engine loads the wall should be used. To fulfil this requirement, the metrics proposed were based on the loads measured in rows 3 and 4 of the LCW before the time when the LCW total force was 200 kN. For virtually all cars this approach ensured that there was little/no engine loading on the wall in the period of the impact that the metric assessed. In addition, this approach ensured that the metric developed was mass independent because all cars put at least 200 kN total load on the wall.
Figure 10. Geometry of longitudinal member, bumper beam and subframe height, geometrical assessment according to US voluntary commitment and FWRB metric assessment for 24 different vehicles.

Johannsen 9
The process for metric development is illustrated in Figure 10. The geometry of the longitudinal member, bumper beam and subframe height is shown for 24 vehicles in combination with a geometric assessment according to Option 1a (labeled as “50% part 581 zone”) and Option 1b (labeled as “50% PEAS”) of the US voluntary commitment. The values for the proposed FIMCAR metrics are shown (sum force of rows 3 and 4 shall exceed 100 kN before the time when the total LCW force is 200 kN, labeled “F3 + F4 > 100” and sum force of row 4 divided by the sum force of rows 3 and 4 shall be between 0.2 and 0.8 labeled as “F4/(F3+F4)”). It is seen that there was agreement between the geometric assessment and the metric assessment for all vehicles apart from vehicles 8 and 17 (marked with a yellow circle). However, these vehicles were borderline cases so it was deemed acceptable that there was not agreement in these cases.
Further analysis showed that the proposed metric was able to identify, in general, vehicle structures which had PEAS in alignment with the Part 581 zone and those that did not. However, some issues
were identified which require further investigation. These included that some of the tested vehicles were borderline in terms of the geometric vertical alignment performance and may fail, depending on impact accuracy. Furthermore front end items which were felt to have little influence on crash compatibility such as the towing hook may partially influence the results.
Proposals for metrics which reflect Option 2 of the US voluntary commitment (to assess SEAS) still need to be developed but some possibilities are shown in Figure 11. These include an Over-Ride Barrier (ORB) test, evaluation of LCW force values at a later stage of the impact or an assessment from the off-set procedure. However, another important point is if the second stage should be offered just for vehicles with high PEAS (e.g. off-road vehicles) or for all vehicles, i.e. should there be an eligibility assessment for the second stage.
Yes
NoF3+F4 > [180] kNF3 > [85] kNF4 > [85] kN
F3 > [100]kNF4 > [100]kN
NoFail
PassYes
Pass
Vehicle has high PEAS Yes
NoFail
Yes
NoF3 > [75] kNF4 > [75] kN Fail
Pass
Up to LCW force200kN
Up to 40ms
Up to 40ms
FWDB (1)
FWDB (2)
Yes
NoF3 + F4 > [100]kN0.2< F4/(F3+F4) >0.8 Fail
Pass
Yes
No
Pass
Stage 2 (to be determined)
Yes
NoFail
F3 + F4 > [100]kN0.2< F4/(F3+F4) >0.8
Yes
No Stage 2(to be determined)
NoFail
PassYes
Pass
Vehicle has high PEAS Yes
No
Fail
F3 + F4 > [100]kN0.2< F4/(F3+F4) >0.8
Up to LCW force200kN
Up to LCW force200kN
Up to LCW force200kN
Pass
FWRB (1)
FWRB (2)
FWRB (3)
Stage 1 Eligibility Assessment Stage 2Options for assessment of ‘Vehicle has high PEAS’ include:1. Vehicle category, e.g. Off-road2. Full width test LCW assessment3. Offset test assessment
Options for FWRB ‘Stage 2’ include:1. ORB test2. FWRB LCW assessment at later time3. Offset test assessment
Figure 11. Draft metrics for the FWRB and the FWDB test procedures.

Johannsen 10
Metrics for FWDB tests Data from VC-Compat, APROSYS, ACEA, BASt, DfT FWDB tests and associated structural geometric information were used to develop the metric (in total 17 tests). In general, the same approach was used as for the FWRB metrics. However, the advantage with the FWDB test is the attenuation of engine dump. Therefore metrics that assessed the vehicle at later stages of the impact could be developed (e.g. up to a time when the total LCW force is 400 kN or up to 40 ms).
Two different proposals for metrics have been made for the FWDB test (Figure 11). The first FWDB (1) consists of a two stage approach. In the first stage, up to the time when the total load cell wall experiences 400 kN, minimum forces of 180 kN are required to be measured in rows 3(F3) and 4 (F4). Additionally, a minimum force requirement of 85 kN in each of row 3 (F3) and 4 (F4) is required to assess the load distribution between rows 3 and 4. In the second stage, up to an impact time of 40 ms, the forces in rows 3 (F3) and 4 (F4) should be greater than 100 kN. This stage was developed to reflect the requirements of the US voluntary agreement ‘Option 2’ and check that if a vehicle’s main structures are not in alignment with the Part 581 zone, then a secondary structure is. It still has to be decided whether or not an eligibility assessment should be required for stage 2. Possibilities for an eligibility assessment include a restriction that only categories of vehicles with high PEAS, e.g. off-road vehicles, should be eligible for a stage 2 assessment. An eligibility assessment would ensure that a standard car would have to align its PEAS (main structure) to meet the requirements of the metric and could not meet the requirements with a low PEAS which could lead to it been over-ridden in an accident.
The second proposed metric, FWDB (2), has just one stage, which assesses up to an impact time of 40 ms. For both these metrics a high correlation with the geometric assessment was reached in the development process.
Load Cell Wall (LCW) specification and certification To use a LCW in a regulatory procedure specification and certification procedures are needed to ensure the LCW used is appropriate.
A collection of the specification data of LCWs used around the world has been performed to give an overview of the current status. From this minimum performance specifications will be defined. Examples these are overload capacity, off-axis error, non-linearity, hysteresis, cross axis sensitivity as well as resonant frequency and frequency response. Further specifications, e.g. the
determination of cross talk or the evaluation of wall flatness, are under discussion.
Calibration and certification methods will be based on existing protocols such as SAE J25-70 for load cell calibration. A static calibration method at the centre of the load cell to assess mean axis sensitivity, non-linearity and hysteresis will be proposed. In addition, the off-axis loading error will be assessed (Figure 12). However, at this stage it is considered unlikely that a dynamic test will be necessary.
Figure 12. Off-axis loading of a load cell.
Further investigations to complete the specification and certification procedures are ongoing. These will include investigation of issues such as whether or not the overall flatness of the LCW should be specified and if so what the limits should be.
Conclusion of Full Width Test Procedure Based on the concept of ‘force in a common interaction zone’ initial proposals for metrics to control a vehicle’s structural alignment have been developed for both the FWRB and FWDB tests. However, further work is required to develop these metrics further to choose the most appropriate one. This includes the choice of type of test, i.e. with a rigid or deformable face. In addition the test speed needs to be determined.
Work to develop a specification and certification procedure for a LCW suitable for regulatory purposes has begun.
Off-set Test Procedure
The main objectives of the off-set test procedure are to address structural alignment, load spreading issues, compartment integrity and the restraint system issues (different test pulses).
The current ECE R94 barrier face and the PDB (Progressive Deformable Barrier) as proposed by France in previous projects were the main candidates. Previous research indicated that load cell measurements in off-set tests do not result in appropriate assessment of the load distribution. Following that the decision was taken to

Johannsen 11
0
100
200
300
400
500
600
700
800
900
-1000 -900 -800 -700 -600 -500 -400 -300 -200 -100 0
GROUND
Vehicle W/2 - 100 mm
Lower area
Upper area
Middle area
0
100
200
300
400
500
600
700
800
900
-1000 -900 -800 -700 -600 -500 -400 -300 -200 -100 00
100
200
300
400
500
600
700
800
900
-1000 -900 -800 -700 -600 -500 -400 -300 -200 -100 0
GROUND
Vehicle W/2 - 100 mm
Lower area
Upper area
Middle area
concentrate on the PDB and to assess barrier face deformation.
The test severity needs to be defined taking into account sufficient compartment strength requirements. The best way to assess test severity for this aim is to use the deformation energy expressed by EES (energy equivalent speed). The proposed test procedure shall ensure a level of EES comparable to the today’s EES level (observed in ECE R94 and Euro NCAP test conditions), therefore the PDB test speed is fixed at 60 km/h. The details of the test procedure are described in [7].
The PDB test is a 50 percent overlap off-set test which uses measurements from a progressive deformable barrier to assess car’s compatibility in terms of partner and self protection [8]. This barrier is currently only used in research applications and is not part of a regulation or consumer test procedure.
Figure 13. R94 and PDB geometrical comparison.
The 50 percent overlap and the barrier characteristics allow the PDB to identity the main structures involved in the frontal crash. Geometrical data from previous European research projects shown that the main structures of the vehicles will interact with the PDB. Figure 13 shows the interaction areas for the PEAS and SEAS in both, R94 and PDB barriers.
The barrier stiffness increases with depth and has upper and lower load levels to represent an actual car structure. The progressive stiffness of the barrier has been designed so that the Equivalent Energy Speed (EES) for the vehicle should be independent of the vehicle’s mass. The use of a PDB barrier should thus harmonise the test severity among vehicles of different masses by encouraging lighter vehicles to be stronger without increasing the force levels of large vehicles.
The key data used in a PDB test is the post-crash deformations of the barrier. A 3-D image of the barrier is recorded in the computer and the depth and distribution of the deformations are used to assess the vehicle’s compatibility characteristics.
Metrics assessing the depth and distribution of the barrier deflections are under development in FIMCAR. Instrumented HIII dummies are used to record the risk for occupant injuries.
The barrier is divided in the following three zones, each with a defined objective for evaluation.
i) Upper [from 820 to 600 mm to the ground]: Area above the PEAS and SEAS structures. No significant longitudinal deformations are allowed in the zone.
ii) Middle [from 600 to 350 mm to the ground]: Area for the location of the PEAS. Deformations of the barrier are required in this zone. Promoting the homogeneous deformations and controlling the longitudinal ones.
iii) Lower [from 350 to 180 mm to the ground]: Area for the location of the SEAS. Deformations also allowed in this area. Promoting the homogeneous deformations of the zone and controlling the longitudinal ones.
The analysis within each zone does not consider the total width of the barrier, the extremities of the barrier are excluded. The zone width covers 150 mm from the barrier edge to a distance equal to the half of the vehicle width minus 100 mm (Figure 14).
Figure 14. Barrier areas.
The zones defined ensure the evaluation of the front structure over a wide range, taking into account compatibility issues such as small overlap. The following two criteria are obtained from the barrier digitalization. These parameters will be used to evaluate the partner protection of the vehicle. Longitudinal deformation (d): Robust statistics characterizing the deformation of the considered zone, taking a q-th percentile of the barrier longitudinal deformation (i.e. 99th percentile of the deformations).

Johannsen 12
i) Homogeneity (H): Estimation of the total amount of variation of an image, mathematically defined as the average length of contour lines of the image.
In a first stage the map (image) is filtered by an additional low-pass filter. Then, the map is normalized, so all images have the same dimension and only vertical and horizontal deformations are taken into account.
The gradient of the length is given the magnitude of change of slope. H is proportional to the sum of lengths of the gradient of the map at all points.
Figure 15. Barrier axis definition.
The metric The off-set test assessment procedure was supported by a database of 37 PDB_60 tests. The barrier deformations of these tests were analysed and taken as a reference for the further metric investigations.
The database is the result of previous research projects, e.g. VC Compat. In a first stage, the barriers were classified following a subjective approach, gathering the barriers that suggest a good performance in compatibility in a first group (G1), the barriers that suggested a bad compatibility performance in a separate group (G3) and finally the barriers between G1 and G3 were classified in G2.
In a second stage, the barriers in each group (G1, G2 and G3) were classified from best to worst performance also using subjective criteria.
The subjective classification described above was used as guidance for an initial stage of the development of the metric, a good correlation between the subjective classification and the initial proposals for metric (objective method) gives a good starting point for the development of the metric.
The proposed metric will give a single score (S), the score being the result of a formula which combines the longitudinal deformation and
homogeneity assessments for the lower, middle and upper areas, dU, dM, HM, dL, and HL.
Figure 16. Scoring formula.
di (i=U, M and L) and Hj (j= M and L) scores will be calculated from the longitudinal deformation and the homogeneity criteria respectively. A sliding scale system of points scoring will be used to calculate points for each measured criterion. This involves two limits for each parameter, a more demanding limit (higher performance), and a less demanding limit (lower performance).
The proposed limits to be used in the metric were also derived from the database tests, taking the objective classification as a reference.
Figure 17. Longitudinal deformation limits.
The score, including "weighting factors" for the different sub-scores, will be developed following the priorities to evaluate the frontal compatibility.
The main structures to contribute in the frontal crash are the PEAS, therefore dM and HM scores are considered to have a larger weight factor than the dL and HL, scores of the zone where the SEAS are located. Finally, the contribution of the dU score will depend on the level of relevance that will be considered for issues like over/under ride or eventually the aggressivity of the vehicle in a frontal/side crash.
Figure 18 shows an example of scoring formula that has been investigated in FIMCAR project, in this particular case the scores of the middle zone are sliding from 0 to 2 points and for the upper and lower from 0 to 1 point.
),,,,( LLMMU HdHddfS =

Johannsen 13
Figure 18. Example of scoring formula.
In the formula, the maximum score is 7 points and the two scores of the middle area represent the 57% of the total, lower area 29% and upper area 14%.
Scoring concepts like capping limits may be considered in the metric in order to address some relevant issues detected in compatibility. Exceeding a capping limit could indicate an unacceptable high risk of a specific issue in compatibility (i.e. over/under ride) which may lead to the loss of points for that part of the score.
Conclusion of Off-set Test Procedure The fundamentals of the assessment method using the PDB_60 off-set test have been defined. Different metrics have been investigated for assessing compatibility issues. The investigated metrics have shown a good correlation with a subjective assessment. The metric needs to be further developed and validated using the upcoming tests that will be performed in FIMCAR project.
During the testing activities of the project, the test severity will also be investigated and validated.
MDB Test Procedure
The main aims of the MDB (moveable deformable barrier) test procedure are to address structural alignment, load spreading issues, compartment integrity and the restraint system issues (different test pulses and increased challenge for lighter cars). Except for the increased challenge for lighter cars these aims are the same aims as for the off-set test procedure using a static barrier.
Although in principle MDB tests with off-set and full width are possible, FIMCAR decided early in the process to develop an off-set MDB test only. The deformable barrier face was selected based on a theoretical review of existing off-set barrier faces. The PDB was chosen because it offered the best possibilities. The Moving Progressive Deformable Barrier (MPDB) was originally tested in Australia and has been further developed in the Netherlands [9].
As for the PDB, the MPDB test severity needs to be defined taking into account sufficient compartment strength requirements. The best way to assess test severity for this aim is to use the deformation energy expressed by EES (energy equivalent speed). However, the test severity in an MDB test is defined by the closing speed of trolley
and test car and the weight relationship between both. In the initial step barrier mass was fixed at 1,500 kg and the closing speed was fixed at 100 km/h.
The mass of the trolley is based on a Swedish data showing the cumulative distribution of the vehicle fleet of Sweden in 2008 and the EU in 2005 [10].Both distributions are in-line and give an average vehicle mass of 1500kg. This is also backed up by the AE-MDB (Advanced European Moving Deformable Barrier) side impact trolley mass, which is also set to 1500kg [11].
The impact speed, angle and overlap are based on real word accident data and existing test procedures.
The baseline situation for the current R94 is a frontal car-to-car collision with both vehicles travelling at 50 km/h with an overlap of 50% and an impact angle of 0 degrees. To best represent this baseline situation, the single vehicle-to-barrier test was derived and set to 56 km/h, an overlap of 40% with an impact angle of zero degrees.
Figure 20 shows the closing speed of front-to-front car collisions based on recent accident data. A closing speed of 100km/h, in-line with the baseline test, will cover 90% of the frontal car-to-car collisions in terms of speed [Data from GIDAS, accidents from the Hannover and Dresden area in between 1999 to 2009 with no restriction on car model/age. Only front to front car to car crashes are included where the direction of force during the collision is in between 11, 12 and 1 o’clock. MAIS has been calculated on the basis of the maximum MAIS of all occupants of the subject car. Both cars are within 600 to 3500 kg curb weight and all collisions have closing speeds below 150 km/h].
Figure 19. Cumulative distribution of closing speed in front to front collisions.
The combination of MDB mass and closing speed was confirmed by a test with an Opel Astra to represent a desired severity level, expressed in
LLMMU HdHddS ++++=

Johannsen 14
EES, in mid-size cars. Currently, investigations, tests and simulations for heavy and light cars are ongoing in order to check whether or not the self protection level is sufficient for heavy cars and test severity is not too high for light cars, respectively.
Figure 20. MPDB test with Heavy Vehicle.
The needs to change the test parameters, such as trolley mass or closing speed for light or heavy vehicles to adjust the severity are part of the investigations.
The MPDB will have identical assessment procedures as the PDB with the difference of impact severity related to vehicle mass. A heavy (2300 kg) vehicle experienced a crash of similar severity as the R94 test while a 1400 kg vehicle experienced a much higher test severity, approaching Euro NCAP levels.
The main compatibility assessment will be the PDB deformation, the potential metric will be identical to the PDB metric. Investigations are on-going to develop additional metrics based on typical MPD parameters such as the trolley acceleration.
CONCLUSIONS / OUTLOOK
The FIMCAR project is developing a verification procedure to guide the final selection of test procedures. This program will specify the types of testing, simulation, and/or analysis that confirm the test procedures address specific aspects of compatibility. These procedures will be applied in the final year of the project to both select the candidates and finalize their assessment criteria.
The current proposal from FIMCAR is that a full width and offset test procedure will be developed together as a compatibility assessment approach. There is no clear answer yet as to which full width and offset candidate is best.
For the full width test promising metrics are available for both FWRB and FWDB to control structural alignment, which is the first and basic step towards compatibility. Next steps will be to decide on performance limits, validate with real world accident data and crash tests, confirm test severity and estimate the benefit. The development
of LCW specification and certification procedure is ongoing.
For the off-set test in principle a stationary PDB or an MPDB test are possible. Metric development for the PDB for the assessment of aggressive structures is promising. In case metric development for the PDB is not successful, the current ODB used in ECE Regulation 94 is a fall back solution. The final FIMCAR assessment approach proposal is expected to be published in Autumn 2012.
ACKNOWLEDGEMENTS
The paper is written on behalf of the members of the FIMCAR project. The FIMCAR project is co-funded by the European Commission under the 7th Framework Programme (Grant Agreement no. 234216). The members of the FIMCAR consortium are: Technische Universität Berlin, Bundesanstalt für Straßenwesen. Chalmers tekniska hoegskola AB, Centro Recerche Fiat S.C.p.A., Daimler AG, FIAT Group Automobiles Spa, Humanetics GmbH, IAT Ingenieurgesellschaft für Automobiltechnik mbH, IDIADA Automotive Technology SA, Adam Opel GmbH, Peugeot Citroën Automobiles SA, Renault s.a.s, TNO, TRL Limited, UTAC, Volvo Car Corporation, Volkswagen AG, TÜV Rheinland TNO Automotive International BV.
Further information is available at the FIMCAR web site www.fimcar.eu.
This paper used accident data from the United Kingdom Co-operative Crash Injury Study (CCIS) collected during the period 2000-2009. CCIS was managed by TRL Limited, on behalf of the DfT (Transport Technology and Standards Division) who funded the project along with Autoliv, Ford Motor Company, Nissan Motor Company and Toyota Motor Europe. Previous sponsors of CCIS have included Daimler Chrysler, LAB, Rover Group Ltd, Visteon, Volvo Car Corporation, Daewoo Motor Company Ltd and Honda R&D Europe (UK) Ltd. Data was collected by teams from the Birmingham Automotive Safety Centre of the University of Birmingham; the Transport Safety Research Centre at Loughborough University; TRL Limited and the Vehicle & Operator Services Agency of the DfT.
Further information on CCIS can be found at http://www.ukccis.org
The FIMCAR development of FWRB metrics was supported by JMLIT and Nagoya University by offering test data combined with the corresponding geometrical data of the respective cars. Members of the FIMCAR project want to thank JMLIT and Nagoya University for their contribution.

Johannsen 15
REFERENCES
1 Edwards, M. & de Coo, P. Final Report: Improvement of Vehicle Crash Compatibility through the Development of Crash Test Procedures, European Commission 5th Framework Project GRD2/2001/50083, 2007
2 EEVC Working Group 15, Car Crash Compatibility and Frontal Impact Enhanced European Vehicle-safety Committee, www.eevc.org, 2007
3 O’Reilly, P. Status Report of IHRA Compatibility and Frontal Impact Working Group Proceedings of the Enhanced Vehicle Safety Conference, No. 03- 402, 2003
4 Edwards M et al. (2003). ‘Development of Test Procedures and Performance Criteria to Improve Compatibility in Car Frontal Impacts’, Proceesings of the 18th ESV Conference, Nagoya, Japan, 2003.
5 Barbat, S., "Status Of Enhanced Front-To-Front Vehicle Compatibility Technical Working, Group Research And Commitments", 19th ESV conference Proceedings Paper Number 05-463, 2005
6 Yonezawa, H.; Mizuno, K.; Hirasawa, T.; Kanoshima, H.; Ichikawa, H.; Yamada, S.; Koga, H.; Yamaguchi, A.; Arai, Y.; Kikuchi, A.: Summary of Activities of the Compatibility Working Group in Japan (2009); ESV Conference 2009
7 Dellannoy, P.; Martin, T.; Meyerson, S.; Summers, L.; Wiacek, C.: ‘PDB Barrier Face Evaluation by DSCR and NHTSA’s Joint Research Program, ESV Conference 2007
8 Delannoy, P.; Faure, J.; Coulombier, D.; Zeitouni, R. & Martin, T. New Barrier Test and Assessment Protocol to Control Compatibility SAE Annual Conference, 2004
9 Schram, R. The Development of a mobile deformable test procedure. Proceedings of the Enhanced Vehicle Safety Conference, No. 07- 327, 2007 10 Sveriges officiella statistic (SIKA) 11 The development of an advanced European mobile deformable barrier face (AE-MDB); J.D. Ellway on behalf of EEVC WG13; paper number 05-0239