
film cooling paper
10
Hessam Babaee e-mail: hbabae1@lsu .edu Sumanta Acharya Professor e-mail: acharya@tiger s.lsu.edu Department of Mechanical Engineering, Louisiana State University, Baton Rouge, LA 70803 Xiaoliang Wan Assistant Professor Department of Mathematics, Louisiana State University, Baton Rouge, LA 70803 e-mail: [email protected] su.edu Optimization of Forcing Parameters of Film Cooling Effectiveness An optimization strategy is described that combines high-fidelit y simulation s with response surface construction, and is applied to pulsed film cooling for turbine blades. The response surface is constructed for the film cooling effectiveness as a function of duty cycle, in the range of DC between 0.05 and 1, and pulsation frequency St in the range of 0.2–2, using a pseudospectral projection method. The jet is fully modulated and the blow- ing ratio, when the jet is on, is 1.5 in all cases. Overall 73 direct numerical simulations (DNS) using spectral element method were performed to sample the film cooling effec- tivene ss on a Cl ens haw–Cur tis gri d in the des ign space. The geo met ry includes a 35-degree delivery tube and a plenum. It is observed that in the parameter space explored a global optimum exists, and in the present study, the best film cooling effectiveness is found at DC ¼ 0.14 and St ¼ 1.03. In the same range of DC and St, four other local opti- mums were found. The physical mechanisms leading to the forcing parameters of the glob al optimum are expl ored and inge stio n of the crossflo w into the deli very tube is observed to play an important role in this process. The gradient-based optimization algo- rithms are argued to be unsuitable for the current problem due to the nonconvexity of the objective function. [DOI: 10.1115/1.4025732] 1 Introd uct ion To enhance the thermal efficienc y of a gas turbine, higher rotor inlet temperat ures are desired requiring more effective cooling strat egies of the component s downst ream. Film cooling of the high pressure turbine is commonly employed in modern turbine designs [1]. The coolant flow is extracted from the compressor and is bled through discrete film holes on the surface of the blade. The role of the coolant layer is to protect the components on the hot gas path and therefore increases the life of these components. The interaction between the coolant air and the mainstream causes aerodynamic losses in the turbine stage. In addition, coolant air represents a loss of the process air available for power or thrust. For these reasons one of the main objectives in cooling design is to use coolant as minimally as possible while ensuring a proper coverage of the coolant on the hot gas path components. In order to improve cooling effectiveness, there have been a large number of studies that have explored hole shapes, blowing ratios (the ratio of the jet velocity to the crossflow velocity), cool- ant injection angles and other design parameters [ 1 – 3]. The major- ity of the studies that have explored parametric effects are either exper iment al or simulations that utili ze the Reynol ds-aver aged Navier–Stokes (RANS) equations and a turbulence model. How- ever, turbulence models in RANS have been shown to not capture the dynamics of the flow field accurately, and high-fidelity spa- tia lly and tempor all y res olved simula tio ns tha t do not req uir e models to capture the effects of the entire turbulent spectrum are needed [4]. Such techniques represented by direct numerical sim- ulations (DNS), which resolves the entire spectrum, or large eddy simulations (LES), that captures the energetic parts of the spec- trum, have indeed been recently employed in a number of film cooling studies [5 – 9]. Such high-fidelity simulations are used in the present work. In recent years, pulsation of the coolant air has been suggested as one of the strategies that can possibly increase the film cooling eff ect ive ness. Severa l researc her s have stud ied the imp act of pulsation on film cooling effectiv eness, but the reported results have been mixed with no clear conclusive outcomes. Some key studies are reviewed below in order to motivate the present work. Coulthard et al. [10] carried out an experimental study for an inclined jet with inclination angle of 35 deg. Their results show that the steady jet with BR of 0.5 resulted in the best film cooling effec tiven ess, and pulsat ions adverse ly impac ted cooling effec - tiveness. Ekkad et al. [11] performed an experimental study in which they investigated the effect of pulsation on the film cooling effectiveness on a leading edge model for a variety of forcing pa- rameters. At the lowest blowing ratio, BR ¼ 0:75, the effect of pulsation was negligible. However, at higher blowing ratios pulsa- tion had a positive effect on the film cooling effectiveness. They also observed that the pulsed jet outperformed the steady jet with the same time-averaged blowing ratio. El-Gabry and Rivir [ 12] studied the effect of pulsation on the leading edge film cooling on the same geometry [ 11], and observed that the film effectiveness of the pulsed cases were lower than that of steady jets with the same time-averaged blowing ratios. Muldoon and Acharya [13] performed direct numerical simula- tions for St in the range of 0.004 to 0.32 and DC of 0.25 and 0.5. The baseline simulation was a ste ady jet at BR ¼ 1:5. Pulse d cases at DC ¼ 0:5 improved the film cooling effectiveness com- pared to the baseline case. The pulsed jet also showed improved film cooling effectiveness than a steady jet with the same effective mass flow rate, i.e., BR ¼ 0:75. Recently Bidan et al. [ 14] carried out an experimental/numeri- cal study of a 35-deg jet in a crossflow. They observed that pulsa- tio n res ult ed in dec rea se of film coolin g per for mance whe n compared against steady jets at the same mass flow rate. However, pulsated jets showed improvement of film cooling effectiveness whe n compar ed wit h ste ady cas es wit h the same high blowin g ratio. It is cle ar from the studi es above [ 10 – 14] tha t the report ed results are not consistent with both positive and negative effects of coolant pulsations on film cooling. Further, in the experimental studies reported in the literature, there is a significant amount of devia tion between the desire d instan taneous blowi ng ratio and the actual delivered pulse form. This variability is usually more pronou nced at higher frequenci es. For insta nce, exper iment al Cont ribute d by the Intern ation al Gas Turbi ne Insti tute (IGTI) of ASME for publication in the JOURNAL OF TURBOMACHINERY . Manuscript received August 4, 2013; final manuscript received August 18, 2013; published online November 28, 2013. Editor: Ronald Bunker. Journal of Tu rbomachinery JUNE 2014, V ol. 136 / 061 016 -1 Copyright V C 2014 by ASME Downloaded From: http://turbomachinery.asmedigitalcollection.asme.org/ on 12/01/2013 Terms of Use: http://asme.org/terms
-
Upload
bahmankheradmandi -
Category
Documents
-
view
216 -
download
0
Transcript of film cooling paper
8/10/2019 film cooling paper
http://slidepdf.com/reader/full/film-cooling-paper 1/10

8/10/2019 film cooling paper
http://slidepdf.com/reader/full/film-cooling-paper 2/10
measurements of Ref. [ 10] shows 100 % deviation between thephased average blowing ratio at St ¼ 0:19 compared to thedesired blowing ratio. In the experimental studies carried out byRefs. [ 12] and [14], signicant amount of uncertainty, particularlyat high St in Ref. [ 14], is reported. This variability in deliveringthe desired blowing ratio for the pulsed lm cooling, however unavoidable, renders the task of comparing these studies cumber-some if not impossible, and this may, among other factors, explainthe mixed results in the literature. Moreover, the majority of thestudies to date have focused on preselecting the forcing frequencybased on available hardware or on natural time scales in the ow.Thus, the parametric window exploring the role of pulsations havebeen limited, and it is possible that the optimal forcing frequencymay be outside the preselected ranges considered.
Based on the results reported and the above arguments, it isclear that the role of pulsation on the cooling effectiveness needsto be better understood. In the current study, we perform con-
trolled numerical experiments using high-delity direct numericalsimulations for a wide range of pulsation frequencies(St 2 ½0:2; 2 ) and duty cycles (DC 2 ½0:05; 1 Þ. We extract theresponse surface of the system with respect to DC and St, andidentify global and local optimums in the DC St space. In all of our simulations plenum and the delivery tube are included,since these are recognized to play an important role on the lmcooling behavior [ 1 – 3]. To overcome the expensive computationalcost of such a problem, we employ an efcient discretization strat-egy in the design space by using fast-converging spectral polyno-mials along with a high-order spectral/hp element method to carryout the direct numerical simulations. Within the range of parame-ters considered, a key goal of the paper is to nd the optimal pul-sation parameters, and to understand the mechanisms leading tothe global optimal condition for lm cooling effectiveness. A
description of this optimization approach, and the correspondingresults obtained for the lm cooling cases are presented in thispaper.
2 MethodologyWe solve the incompressible Navier–Stokes equations without
any use of a turbulence model by resolving all time and spacescales. These equations in nondimensional form are
@ u@ t
þ ðu rÞ u ¼ r p þ 1Re
r 2u (1)
r u ¼ 0 (2)
where u ¼ uðx; t ; nÞ is the nondimensional velocity vector eldand p ¼ pðx; t ; nÞ is the nondimensional pressure eld in aspace( x)-time ( t ) domain and n ¼ ðn1 ; n2Þ is a two-dimensionalvector of design or control parameters . In the current study,design parameters are the duty cycle DC, and the nondimensionalpulsation period T p ¼ U 1 = Df , where U 1 is the crossowvelocity, D is the jet diameter and f is the dimensional pulsationfrequency. As it will be explained later in this section DC and T pare related to n1 and n2 through a linear mapping. The Reynoldsnumber is dened as Re ¼ U 1 D= , where is the kinematic vis-
cosity. In order to calculate the heat transfer on the blade surfacethe energy equation for the incompressible ow is solved. Thisequation is given by
@ h@ t
þ ðu rÞ h ¼ 1RePr
r 2h (3)
where h ¼ hðx; t ; nÞis the nondimensional temperature given by
h ¼ T T cT h T c
(4)
Here T c is the coolant temperature and T h is the hot gastemperature.
Figure 1 shows the schematic of the problem. The velocity sig-nal at the bottom of the plenum, g
ðt ; n
Þ, is xed by specifying the
design parameters (DC, T p) and the maximum and minimumplenum-inow velocity. In Fig. 2, the generic form of the signalgðt ; nÞ is shown. The amount of the time that the jet is on withineach full period is denoted by D t on and therefore DC ¼ D t on=T p.We also introduce s that shows the time percentage during acycle. Therefore s < DC represents the period that the jet is onand s > DC when the jet is off. When the jet is on, the vertical ve-locity at the bottom of the plenum is equal to aBR. Herea ¼ p D2=4 A p, with A p being the area of the bottom of the plenum,accounts for the ratio of the area of the delivery tube to that of theplenum. When the jet is off, it is turned completely off and duringthis time the net mass ow rate through any x2-section at theplenum or delivery tube is zero.
2.1 Optimization Problem. Our objective is to maximize thelm cooling effectiveness as a function of duty cycle and pulsa-tion period. To measure the effectiveness of lm cooling we rstdene the spanwise-averaged lm cooling effectiveness which isgiven by
gð x1 ; nÞ ¼ 1
wðt f t iÞð t f
t ið w=2
w=2ð1 hðx; t ; nÞÞj x2 ¼0dx3dt (5)
with w being the width of the cooled surface, t i and t f are the be-ginning and the end of the period over which the time-averagedquantities are calculated. In order to obtain an overall measure of the lm cooling effectiveness, we further calculate the streamwiseaverage of gð x1; nÞ. This results
~gðnÞ ¼ 1 x1e x1s ð
x1e
x1s
gð x1; nÞdx1 (6)
where x1s and x1e are the two ends of the interval in the stream-wise direction within which the average lm cooling effectivenessis calculated. The overall lm cooling effectiveness, ~gðnÞ, i s afunction of two independent variables DC and T p, with BR andgeometry xed. The goal is to nd the DC and T p at which the av-erage lm cooling effectiveness, ~gðnÞ, is globally maximum, andto understand the reasons that lead to this condition.
2.2 Discretization in Space-Time. We use spectral/hpelement method implemented in N ej T ar by Warburton [ 15] to
Fig. 1 Three-dimensional schematic of the jet in crossow
061016-2 / Vol. 136, JUNE 2014 Transactions of the ASME
wnloaded From: http://turbomachinery.asmedigitalcollection.asme.org/ on 12/01/2013 Terms of Use: http://asme.org/terms

8/10/2019 film cooling paper
http://slidepdf.com/reader/full/film-cooling-paper 3/10
8/10/2019 film cooling paper
http://slidepdf.com/reader/full/film-cooling-paper 4/10

8/10/2019 film cooling paper
http://slidepdf.com/reader/full/film-cooling-paper 5/10
freedom as that of with the spectral order three. The centerlinelm cooling effectiveness for all four simulations are shown inFig. 4. The comparisons are extended to also include the hole exit.The results show a consistent agreement in all cases considered.In the rest of this study, we use elements with spectral order threewhich provides proper resolution for the current problem.
3.3 Convergence in Design Space. To study the convergenceof the polynomial expansion for lm cooling effectiveness, weproject ~gðnÞ to the polynomial expansion given by Eq. (23) for increasing polynomial order, ranging from P ¼ 0 to P ¼ 8. Sincewe use equal polynomial order in n1 and n2 directions; therefore N ¼ ð P þ 1Þ2 1 and by varying P, N changes accordingly. Tomeasure the contribution by increasing polynomial order from P 1 to P, we calculate the modules mð PÞas in the following:
mð PÞ ¼ Xð Pþ 1Þ2
k ¼0
c2k b~g2
k X P2
k ¼0
c2k b~g2
k 0@ 1A
1=2
1 P 8
mð PÞ ¼ c0j
b~g0j P ¼ 0 (25)
Here the b~gk ’s are the expansion coefcients in overall coolingeffectiveness given by Eq. (24), and ck ’s are used as a normalizingfactor for the Legendre polynomials. The modules mð PÞversus Pis shown in Fig. 5. The most signicant contributions to theresponse surface are gained from polynomials in the range of P ¼ 0 to P ¼ 3. Larger polynomial contributions have modules of the same order, but almost one order smaller than those of lower polynomial orders. The main reason that the modules for thehigher-order polynomials do not decay as fast as those of lower-order is the nonmonotonic behavior of the average lm coolingeffectiveness versus DC and T p. However the improvement of theresponse surface by increasing the polynomial order is marginal(Oð10 3Þ) and the behavior of the surface is essentially the same.
Note that further increase in polynomial order requires prohibi-tively expensive DNS computations, while marginally modifyingthe response surface. In the rest of this study, we consider theresponse surface with polynomial order P ¼ 8.
4 Results and DiscussionsAs validation, we compare the results obtained from our direct
numerical simulation with the experimental measurements carriedout by Bidan et al. [ 21] for a 35-deg inclined jet in crossow. Thecomputational domain consists of a pipe with length of 7D with a35-deg angle with the crossow and a mainstream domain that
expands the volume of 21D in the streamwise direction, 10D inthe wall-normal direction and 6D in the spanwise direction. TheReynolds number based on the crossow velocity and the bound-ary layer thickness is Re 1 ¼ U 1 d= ¼ 1710. The crossow has alaminar boundary layer prole with a boundary layer thickness of 0:63D. At the pipe inlet uniform ow is superposed with 10 % tur-bulence, generated by employing the spectral synthesizer methodintroduced in Ref. [ 22]. A hexahedral grid with 121,700 elementswith a spectral polynomial degree of 4 is used. The comparisonsare made for a continuous case with BR ¼ 0:15. In Fig. 6, time-averaged streamwise velocity proles are compared with those of experimental measurements in Ref. [ 21] at three different stream-wise sections on the centerline plane. Overall good agreement isobtained. This along with the result of the convergence studies
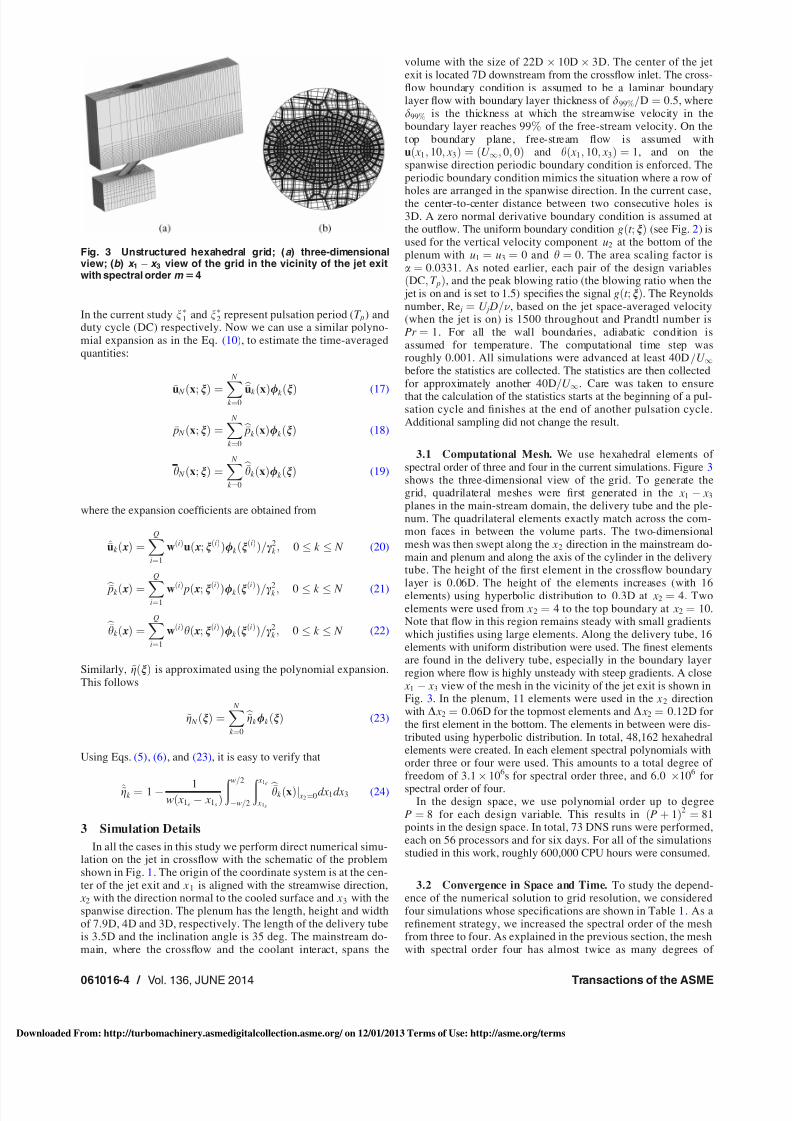
Table 1 Specication of the number of elements and polyno-mial order for cases considered in the grid study
Case I Case II Case III Case IV
Element size 48162 48162 48162 48162Spectral order 3 4 3 4T p 2.75 2.75 Steady SteadyDC 0.52 0.52 1 1
Fig. 4 Grid convergence study. The centerline lm coolingeffectiveness for cases shown in Table 1 are compared.
Fig. 5 Error convergence for ~gN ðnÞ with increasing polynomialorder
Fig. 6 Comparison of time-averaged u 1 velocity in the mid-plane with experimental data [ 21 ] at BR 5 0:15
Journal of Turbomachinery JUNE 2014, Vol. 136 / 061016-5
wnloaded From: http://turbomachinery.asmedigitalcollection.asme.org/ on 12/01/2013 Terms of Use: http://asme.org/terms

8/10/2019 film cooling paper
http://slidepdf.com/reader/full/film-cooling-paper 6/10
that was presented in the previous section give us condence incarrying out the computations with the current approach.
4.1 Effect of Pulsation on Film Cooling Performance. Inexamining these results, it is important to remember that the blow-ing ratio uctuates between 1.5, when the valve is open, and 0,when the valve is closed, and any comparisons with the steadyBR ¼ 1:5 case is, therefore, not at a constant coolant mass injec-tion rate when integrated over a time duration. For the pulsed
cases, the integrated coolant injection rates are lower, and anequal or greater cooling effectiveness than the baseline steady jetof BR ¼ 1:5 represents an improvement in the cooling strategy.We choose the pulsation period to be in the range of T p 2 ½0:5; 5 ,which corresponds to Strouhal number in the range of St 2 ½0:2; 2 , and duty cycle in the range of DC 2 ½0:05; 1 . All thesampling points with DC ¼ 1 correspond to a steady jet and,therefore, only one simulation was performed for these points.
Figure 7 shows the nondimensional temperature at the x2-planewhich represents the cooling effectiveness on the surface and theow temperature at the exit of the coolant hole. As noted earlier,the two control parameters being varied include the duty cycle(DC) and the time period of pulsation ( T p) which is inversely pro-portional to frequency or Strouhal number. The rightmost columnrepresents the steady blowing condition at a BR of 1.5. The signa-ture of the near-hole jet blow-off and the downstream spread of the coolant jet on the surface can be seen. Both duty cycle andtime period have important and signicant inuence on the cool-ing effectiveness. In Fig. 7, it is observed that the cooling effec-tiveness generally improves at a lower duty cycle (whichrepresents a lower amount of integrated coolant injection) andhigher frequencies, and that optimal conditions exist with globalmaximum in the lower left quadrant of the DC T p design spacewithin the range of design parameters considered. However, theintegrated values of the cooling effectiveness do not show any dis-tinct linear or monotonic behavior in the design space, and localmaxima or peaks are obtained at other points as shown later inFig. 14. More discussions on the mechanisms leading to the globalmaximum are discussed in the next section for the case withDC ¼ 0:09 and T p ¼ 1:16, which is a point close to the global-maximum condition. In Fig. 8 the temperature distributions at
T p ¼ 1.16 for increasing DC from 0.09 to 1 (steady injection) areshown. One can see that in the baseline condition (DC ¼ 1), thecoolant jet is characterized by unsteady vortical structures thatentrain and mix out the crossow. The crossow penetration tothe surface is clearly evident in the longitudinal structures at ele-vated temperatures near the surface. As DC is reduced from 1, theturbulent structures and the near-wall thermal eld are clearlyinuenced, with the lower duty cycles showing better organizedstructures and lower temperatures (presence of more coolant) near the wall. For DC larger than 0.34, the jet lift-off is observed im-mediately after entering the main domain resulting in poor cover-age of the surface; this can also be seen in Fig. 7 where both thelateral and streamwise coverage of the coolant is poor. As DC isfurther decreased the coolant remains close to the surface and thecrossow entrainment under the coolant jet and close to the sur-
face is reduced, and therefore lower coolant temperatures near thesurfaces are observed. Thus the lm cooling provides an effectivecoverage. These observations translate to higher cooling effective-ness as it is also observed in Fig. 7. Further discussions on whythe lower DC’s (where the integrated coolant mass ow rate islower) leads to improved cooling effectiveness is provided later,and is related to the interaction between the mainstream and thecoolant ow leaving the delivery tube. Figure 9 shows the instan-taneous temperature distribution in the vertical midplane ( x3 ¼ 0)at DC ¼ 0:52 with increasing time periods from 0.67 to 5. Athigher time periods of T p 1:89, the coolant jet exhibits discretevortex rings that are formed during the on-portion of the pulsationcycle. The same vortex structures were also recognized by Sauand Mahesh [ 23] for a pulsed vertical jet. These vortex rings are
responsible for carrying the coolant ow downstream of the jethole. The distance between successive vortex rings increases asthe pulsation frequency decreases or the time period increases.Note that the instantaneous blowing ratio during the on-portion of the cycle is BR ¼ 1:5 which roughly becomes the velocity atwhich the vortex rings are convected along the axis of the deliverytube (35 deg with x1). As a result, in Fig. 9, a distance of d ¼ 1:5T p can be observed between two successive vortex rings.Since BR and DC remain unchanged for all the cases shown in
Fig. 7 Time-averaged temperature contours for quadraturepoints on cooled surface ( x 2 5 0). Each row: constant T p ; eachcolumn: constant DC .
061016-6 / Vol. 136, JUNE 2014 Transactions of the ASME
wnloaded From: http://turbomachinery.asmedigitalcollection.asme.org/ on 12/01/2013 Terms of Use: http://asme.org/terms

8/10/2019 film cooling paper
http://slidepdf.com/reader/full/film-cooling-paper 7/10
8/10/2019 film cooling paper
http://slidepdf.com/reader/full/film-cooling-paper 8/10
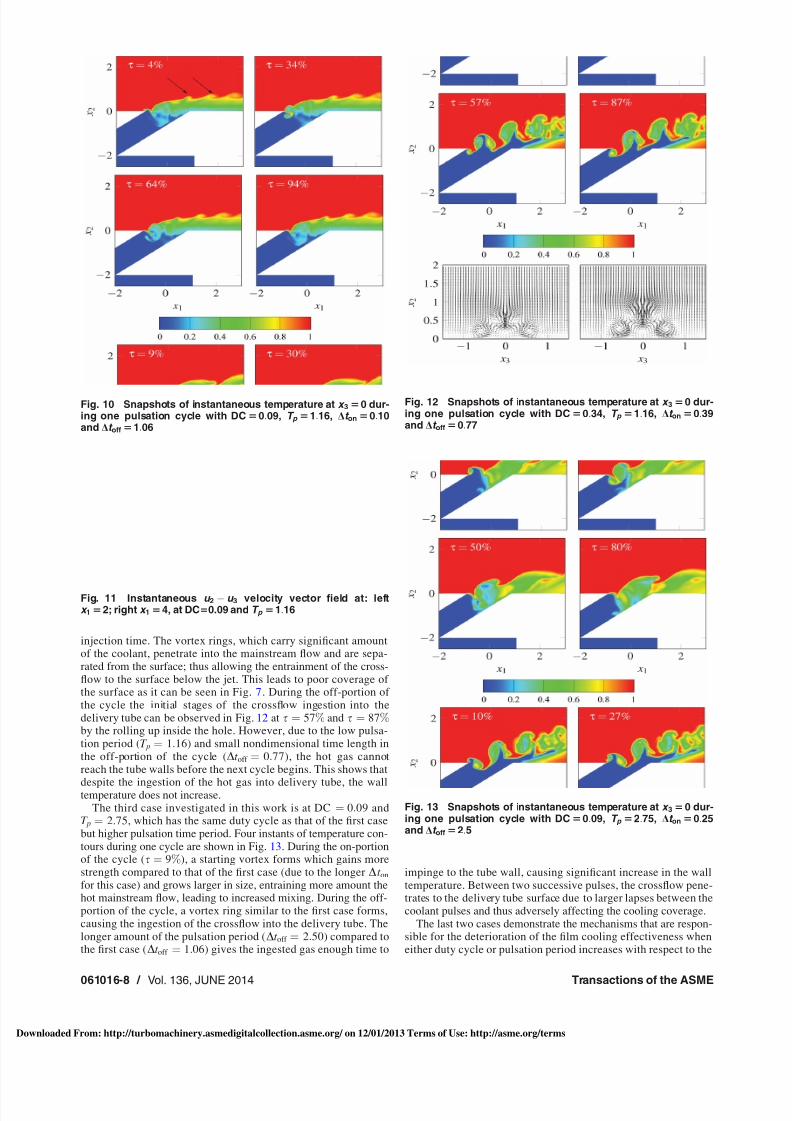
injection time. The vortex rings, which carry signicant amountof the coolant, penetrate into the mainstream ow and are sepa-rated from the surface; thus allowing the entrainment of the cross-ow to the surface below the jet. This leads to poor coverage of the surface as it can be seen in Fig. 7. During the off-portion of the cycle the initial stages of the crossow ingestion into thedelivery tube can be observed in Fig. 12 at s ¼ 57% and s ¼ 87%by the rolling up inside the hole. However, due to the low pulsa-tion period ( T p ¼ 1:16) and small nondimensional time length inthe off-portion of the cycle ( D t off ¼ 0:77), the hot gas cannotreach the tube walls before the next cycle begins. This shows that
despite the ingestion of the hot gas into delivery tube, the walltemperature does not increase.The third case investigated in this work is at DC ¼ 0:09 and
T p ¼ 2:75, which has the same duty cycle as that of the rst casebut higher pulsation time period. Four instants of temperature con-tours during one cycle are shown in Fig. 13. During the on-portionof the cycle ( s ¼ 9%), a starting vortex forms which gains morestrength compared to that of the rst case (due to the longer D t onfor this case) and grows larger in size, entraining more amount thehot mainstream ow, leading to increased mixing. During the off-portion of the cycle, a vortex ring similar to the rst case forms,causing the ingestion of the crossow into the delivery tube. Thelonger amount of the pulsation period ( D t off ¼ 2:50) compared tothe rst case ( D t off ¼ 1:06) gives the ingested gas enough time to
impinge to the tube wall, causing signicant increase in the walltemperature. Between two successive pulses, the crossow pene-trates to the delivery tube surface due to larger lapses between thecoolant pulses and thus adversely affecting the cooling coverage.
The last two cases demonstrate the mechanisms that are respon-sible for the deterioration of the lm cooling effectiveness wheneither duty cycle or pulsation period increases with respect to the
Fig. 10 Snapshots of instantaneous temperature at x 3 5 0 dur-ing one pulsation cycle with DC 5 0:09, T p 5 1:16, D t on 5 0:10and D t off 5 1:06
Fig. 11 Instantaneous u 2 u 3 velocity vector eld at: leftx 1 5 2; right x 1 5 4, at DC 5 0.09 and T p 5 1:16
Fig. 12 Snapshots of instantaneous temperature at x 3 5 0 dur-ing one pulsation cycle with DC 5 0:34, T p 5 1:16, D t on 5 0:39and D t off 5 0:77
Fig. 13 Snapshots of instantaneous temperature at x 3 5 0 dur-ing one pulsation cycle with DC 5 0:09, T p 5 2:75, D t on 5 0:25and D t off 5 2:5
061016-8 / Vol. 136, JUNE 2014 Transactions of the ASME
wnloaded From: http://turbomachinery.asmedigitalcollection.asme.org/ on 12/01/2013 Terms of Use: http://asme.org/terms
8/10/2019 film cooling paper
http://slidepdf.com/reader/full/film-cooling-paper 9/10
near-optimal case (DC ¼ 0:09 and T p ¼ 1:16). We also note thatfor pulsed cases with very small duty cycle (DC < 0:05), the lmcooling coverage is severely affected by the overwhelmingamount of the crossow compared to the coolant. Also for lower pulsation periods than T p ¼ 1:16 the overall lm cooling effec-tiveness slightly decreases, but the physical mechanisms in theow remain similar to the rst case. Thus clearly, optimal condi-tions exists for the pulsation parameters, and the mechanisms con-trolling this are related to the dynamics near the jet-hole exit.
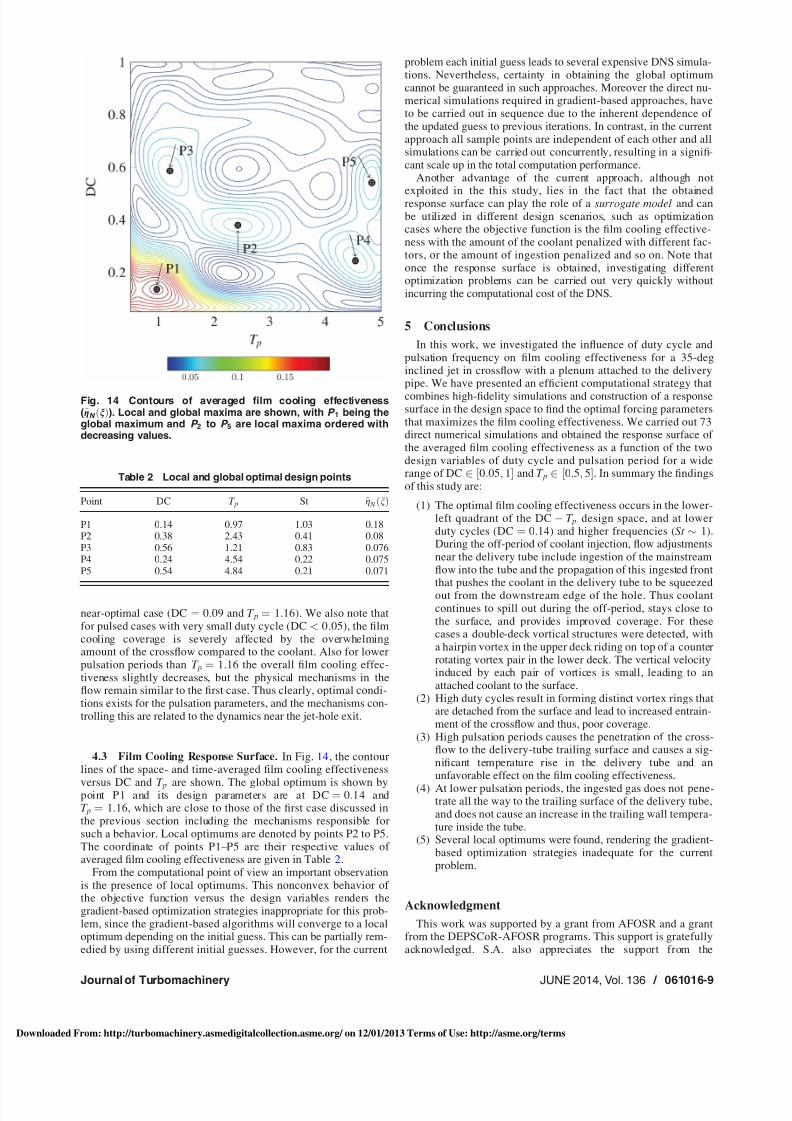
4.3 Film Cooling Response Surface. In Fig. 14 , the contour lines of the space- and time-averaged lm cooling effectiveness
versus DC and T p are shown. The global optimum is shown bypoint P1 and its design parameters are at DC ¼ 0:14 andT p ¼ 1:16, which are close to those of the rst case discussed inthe previous section including the mechanisms responsible for such a behavior. Local optimums are denoted by points P2 to P5.The coordinate of points P1–P5 are their respective values of averaged lm cooling effectiveness are given in Table 2.
From the computational point of view an important observationis the presence of local optimums. This nonconvex behavior of the objective function versus the design variables renders thegradient-based optimization strategies inappropriate for this prob-lem, since the gradient-based algorithms will converge to a localoptimum depending on the initial guess. This can be partially rem-edied by using different initial guesses. However, for the current
problem each initial guess leads to several expensive DNS simula-tions. Nevertheless, certainty in obtaining the global optimumcannot be guaranteed in such approaches. Moreover the direct nu-merical simulations required in gradient-based approaches, haveto be carried out in sequence due to the inherent dependence of the updated guess to previous iterations. In contrast, in the currentapproach all sample points are independent of each other and allsimulations can be carried out concurrently, resulting in a signi-cant scale up in the total computation performance.
Another advantage of the current approach, although not
exploited in the this study, lies in the fact that the obtainedresponse surface can play the role of a surrogate model and canbe utilized in different design scenarios, such as optimizationcases where the objective function is the lm cooling effective-ness with the amount of the coolant penalized with different fac-tors, or the amount of ingestion penalized and so on. Note thatonce the response surface is obtained, investigating differentoptimization problems can be carried out very quickly withoutincurring the computational cost of the DNS.
5 ConclusionsIn this work, we investigated the inuence of duty cycle and
pulsation frequency on lm cooling effectiveness for a 35-deginclined jet in crossow with a plenum attached to the deliverypipe. We have presented an efcient computational strategy thatcombines high-delity simulations and construction of a responsesurface in the design space to nd the optimal forcing parametersthat maximizes the lm cooling effectiveness. We carried out 73direct numerical simulations and obtained the response surface of the averaged lm cooling effectiveness as a function of the twodesign variables of duty cycle and pulsation period for a widerange of DC 2 ½0:05; 1 and T p 2 ½0:5; 5 . In summary the ndingsof this study are:
(1) The optimal lm cooling effectiveness occurs in the lower-left quadrant of the DC T p design space, and at lower duty cycles (DC ¼ 0:14) and higher frequencies ( St 1).During the off-period of coolant injection, ow adjustmentsnear the delivery tube include ingestion of the mainstreamow into the tube and the propagation of this ingested frontthat pushes the coolant in the delivery tube to be squeezedout from the downstream edge of the hole. Thus coolantcontinues to spill out during the off-period, stays close tothe surface, and provides improved coverage. For thesecases a double-deck vortical structures were detected, witha hairpin vortex in the upper deck riding on top of a counter rotating vortex pair in the lower deck. The vertical velocityinduced by each pair of vortices is small, leading to anattached coolant to the surface.
(2) High duty cycles result in forming distinct vortex rings thatare detached from the surface and lead to increased entrain-ment of the crossow and thus, poor coverage.
(3) High pulsation periods causes the penetration of the cross-ow to the delivery-tube trailing surface and causes a sig-nicant temperature rise in the delivery tube and anunfavorable effect on the lm cooling effectiveness.
(4) At lower pulsation periods, the ingested gas does not pene-trate all the way to the trailing surface of the delivery tube,and does not cause an increase in the trailing wall tempera-ture inside the tube.
(5) Several local optimums were found, rendering the gradient-based optimization strategies inadequate for the currentproblem.
AcknowledgmentThis work was supported by a grant from AFOSR and a grant
from the DEPSCoR-AFOSR programs. This support is gratefullyacknowledged. S.A. also appreciates the support from the
Table 2 Local and global optimal design points
Point DC T p St ~g N nð Þ
P1 0.14 0.97 1.03 0.18P2 0.38 2.43 0.41 0.08P3 0.56 1.21 0.83 0.076P4 0.24 4.54 0.22 0.075P5 0.54 4.84 0.21 0.071
Fig. 14 Contours of averaged lm cooling effectiveness(~gN ðnÞ). Local and global maxima are shown, with P 1 being theglobal maximum and P 2 to P 5 are local maxima ordered withdecreasing values.
Journal of Turbomachinery JUNE 2014, Vol. 136 / 061016-9
wnloaded From: http://turbomachinery.asmedigitalcollection.asme.org/ on 12/01/2013 Terms of Use: http://asme.org/terms

8/10/2019 film cooling paper
http://slidepdf.com/reader/full/film-cooling-paper 10/10
National Science Foundation (NSF) in the preparation of thismanuscript. The computations were performed on LouisianaOptical Network Initiative (LONI) systems at Louisiana StateUniversity.
NomenclatureBR ¼ blowing ratio D ¼ jet diameter
DC ¼ duty cycle p ¼ pressure
Pi ¼ polynomial order of the expansion in ni direction Pr ¼ Prandtl number
Q ¼ number of quadrature pointsRe ¼ Reynolds number St ¼ nondimensional pulsation frequencyT c ¼ coolant temperatureT h ¼ hot gas temperatureT p ¼ pulsation periodu ¼ velocity vector
U 1 ¼ crossow velocityw ¼ width of the blade
w ðiÞ ¼ ith quadrature weightx ¼ Cartesian coordinatec j ¼ L 2 -norm of Legendre polynomial
D t off ¼ time portion of the cycle that the jet in off D t on ¼ time portion of the cycle that the jet in on
g ¼ spanwise- and time-averaged lm coolingeffectiveness
~g ¼ overall lm cooling effectivenessh ¼ normalized temperature
H P ¼ one dimensional Clenshaw–Curtis grid with P þ 1nodes
H ð P1 ; P2Þ ¼ two dimensional Clenshaw–Curtis grid with P1 þ 1nodes in n1-direction and P2 þ 1 nodes in n2-direction
n ¼ design parameter nðiÞ ¼ ith quadrature point
s ¼ time percentage during a cycle/ iðnÞ ¼ univariate Legendre polynomial of degree i/ r ðnÞ ¼ multidimensional Legendre polynomial of degree r
ð; Þ ¼ inner productð:Þ ¼ Fourier coefcient in polynomial expansionð:Þ ¼ time-averaged
ð:Þ N ¼ projected to a space of polynomial of degree N ð:Þk k ¼ norm induced by inner product
c j L2 norm of Legendre polynomial
References
[1] Bogard, D. G., and Thole, K. A., 2006, “Gas Turbine Film Cooling,” J. Propul.Power , 22(2), pp. 249–270.
[2] Bunker, R. S., 2005, “A Review of Shaped Hole Turbine Film-Cooling Tech-nology,” ASME J. Heat Transfer , 127, pp. 441–453.
[3] Lutum, E., and Johnson, B. V., 1999, “Inuence of the Hole Length-to-Diame-ter Ratio on Film Cooling With Cylindrical Holes,” ASME J. Turbomach. ,121(2), pp. 209–216.
[4] Acharya, S., Tyagi, M., and Hoda, A., 2006, “Flow and Heat Transfer Predic-tions for Film Cooling,” Ann. N.Y. Acad. Sci. , 934(1), pp. 110–125.
[5] Acharya, S., and Tyagi, M., 2003, “Large Eddy Simulation of Film CoolingFlow From an Inclined Cylindrical Jet,” ASME Paper No. GT2003-38633.
[6] Iourokina, I., and Lele, S., 2005, “Towards Large Eddy Simulation of Film-Cooling Flows on a Model Turbine Blade With Free-Stream Turbulence,”AIAA Paper No. 2005-670.
[7] Peet, Y., and Lele, S. K., 2008, “Near Field of Film Cooling Jet Issued Into aFlat Plate Boundary Layer: LES Study,” ASME Paper No. GT2008-50420.
[8] Guo, X., Schroder, W., and Meinke, M., 2006, “Large-Eddy Simulations of Film Cooling Flows,” Comput. Fluids , 35(6), pp. 587–606.
[9] Renze, P., Schroder, W., and Meinke, M., 2008, “Large-Eddy Simulation of FilmCooling Flows at Density Gradients,” Int. J. Heat Fluid Flow , 29(1), pp. 18–34.
[10] Coulthard, S. M., Volino, R. J., and Flack, K. A., 2007, “Effect of Jet Pulsingon Film Cooling—Part I: Effectiveness and Flow-Field Temperature Results,”ASME J. Turbomach. , 129(2), pp. 232–246.
[11] Ekkad, S. V., Ou, S., and Rivir, R. B., 2006, “Effect of Jet Pulsation and DutyCycle on Film Cooling From a Single Jet on a Leading Edge Model,” ASME J.Turbomach. , 128(3), pp. 564–571.
[12] El-Gabry, L. A., and Rivir, R. B., 2012, “Effect of Pulsed Film Cooling on Lead-ing Edge Film Effectiveness,” ASME J. Turbomach. , 134(4), p. 041005.
[13] Muldoon, F., and Acharya, S., 2009, “DNS Study of Pulsed Film Cooling for Enhanced Cooling Effectiveness,” Int. J. Heat Mass Transfer , 52 (13–14), pp.3118–3127.
[14] Bidan, G., Vezier, C., and Nikitopoulos, D. E., 2013, “Study of Unforced andModulated Film-Cooling Jets Using Proper Orthogonal Decomposition—PartII: Forced Jets,” ASME J. Turbomach. , 135(2), p. 021038.
[15] Warburton, T., 1999, “Spectral/hp Methods on Polymorphic Multi-Domains:Algorithms and Applications,” Ph.D. thesis, Brown, Providence, RI.
[16] Karniadakis, G. E., Israeli, M., and Orszag, S. A., 1991, “High-Order SplittingMethods for the Incompressible Navier–Stokes Equations,” J. Comput. Phys. ,97(2), pp. 414–443.
[17] Karniadakis, G. E., and Sherwin, S. J., 2005, Spectral/hp Element Methods for Computational Fluid Dynamics , Oxford University Press, New York.
[18] Xiu, D., 2007, “Efcient Collocational Approach for Parametric UncertaintyAnalysis,” Comm. Comp. Phys., 2(2), pp. 293–309.
[19] Clenshaw, C. W., and Curtis, A. R., 1960, “A Method for Numerical Integrationon an Automatic Computer” Numerische Mathematik , 2(1), pp. 197–205.
[20] Battles, Z., and Trefethen, L., 2004, “An Extension of Matlab to ContinuousFunctions and Operators,” SIAM J. Comput. , 25(5), pp. 1743–1770.
[21] Bidan, G., Vezier, C., and Nikitopoulos, D. E., 2013, “Study of Unforced andModulated Film-Cooling Jets Using Proper Orthogonal Decomposition—Part I:
Unforced Jets,” ASME J. Turbomach. , 135(2), p. 021037.[22] Smirnov, A., Shi, S., and Celik, I., 2001, “Random Flow Generation Technique
for Large Eddy Simulations and Particle-Dynamics Modeling,” ASME J. FluidsEng. , 123(2), pp. 359–371.
[23] Sau, R., and Mahesh, K., 2008, “Dynamics and Mixing of Vortex Rings inCrossow,” J. Fluid Mech. , 604, pp. 389–409.
[24] Haven, B. A., and Kurosaka, M., 1997, “Kidney and Anti-Kidney Vortices inCrossow Jets,” J. Fluid Mech. , 352(1997), pp. 27–64.
061016-10 / Vol. 136, JUNE 2014 Transactions of the ASME