Figure 25.0 Fossil of a fish: perch. Figure 25.1 A gallery of fossils.
38
Figure 25.0 Fossil of a fish: perch
-
date post
19-Dec-2015 -
Category
Documents
-
view
216 -
download
3
Transcript of Figure 25.0 Fossil of a fish: perch. Figure 25.1 A gallery of fossils.
Figure 25.0 Fossil of a fish: perch
Figure 25.1 A gallery of fossils

Figure 25.1a Dinosaur National Monument

Figure 25.1b Skulls of Australopithecus and Homo erectus
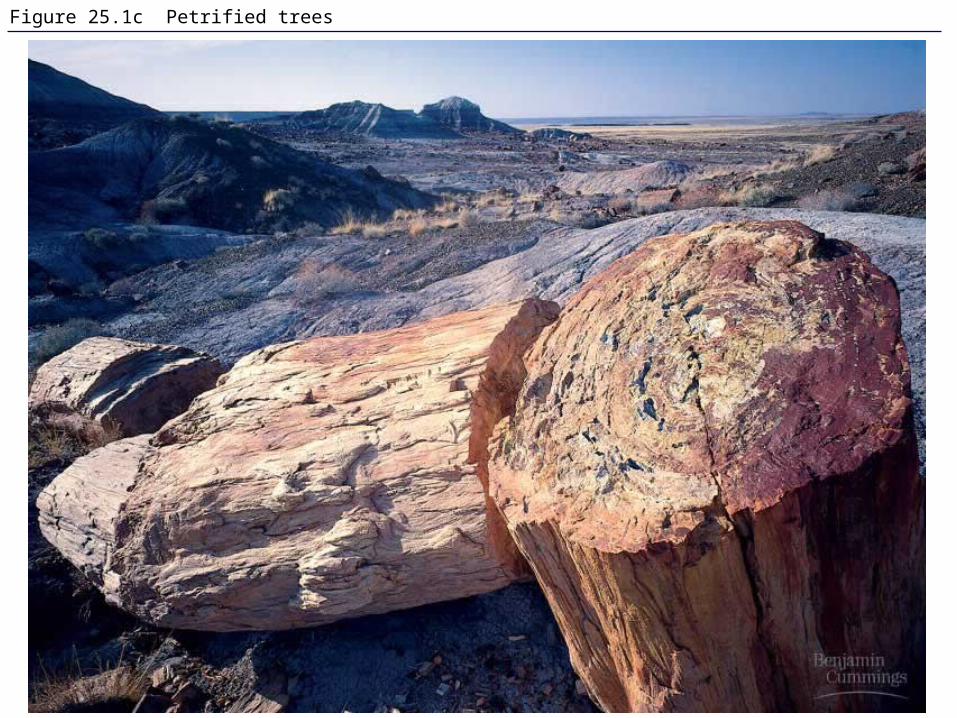
Figure 25.1c Petrified trees
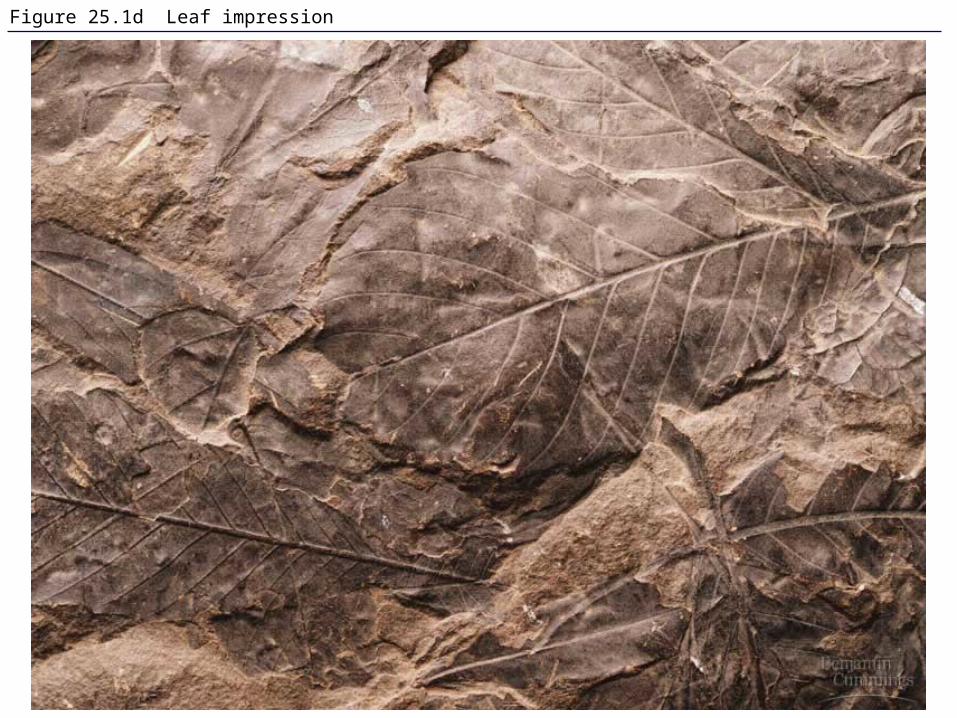
Figure 25.1d Leaf impression
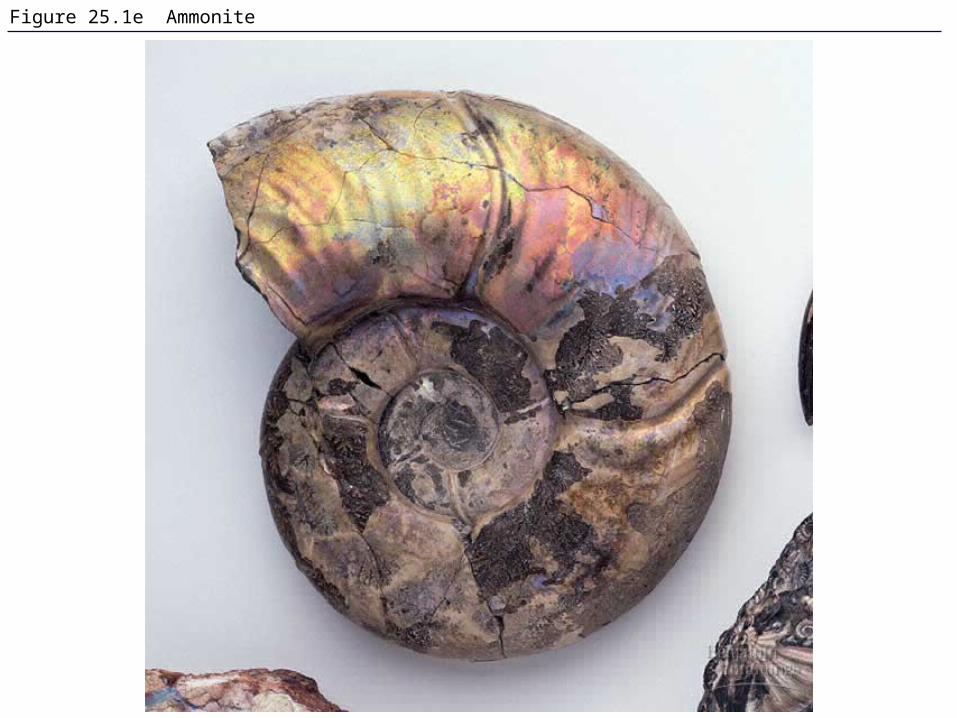
Figure 25.1e Ammonite
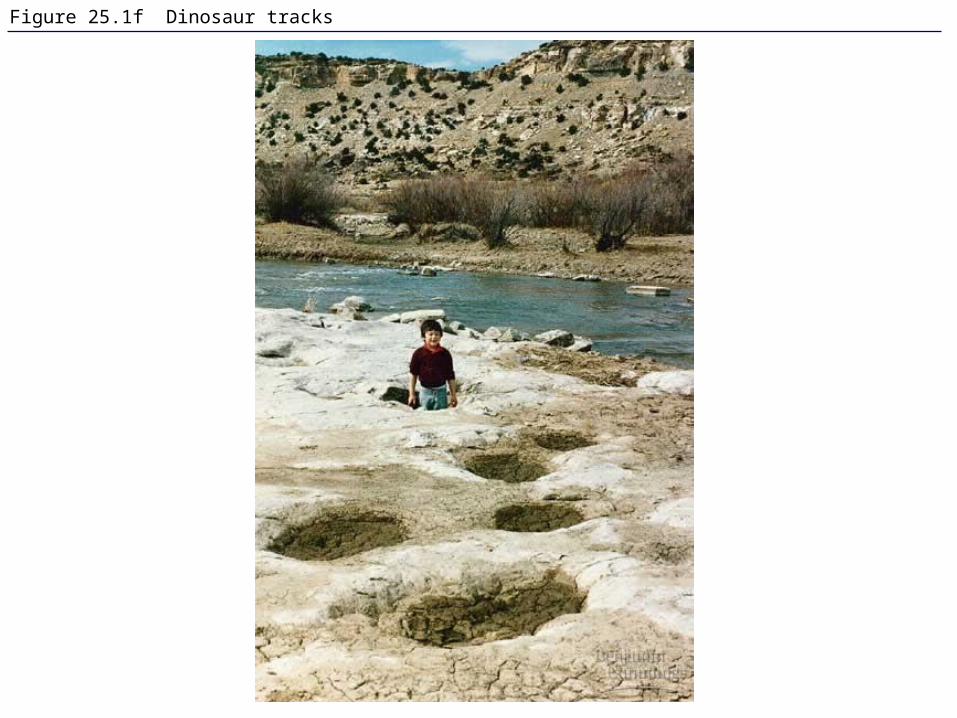
Figure 25.1f Dinosaur tracks

Figure 25.1g Scorpion in amber

Figure 25.1h Mammoth tusks

Figure 25.1x1 Sedimentary deposit
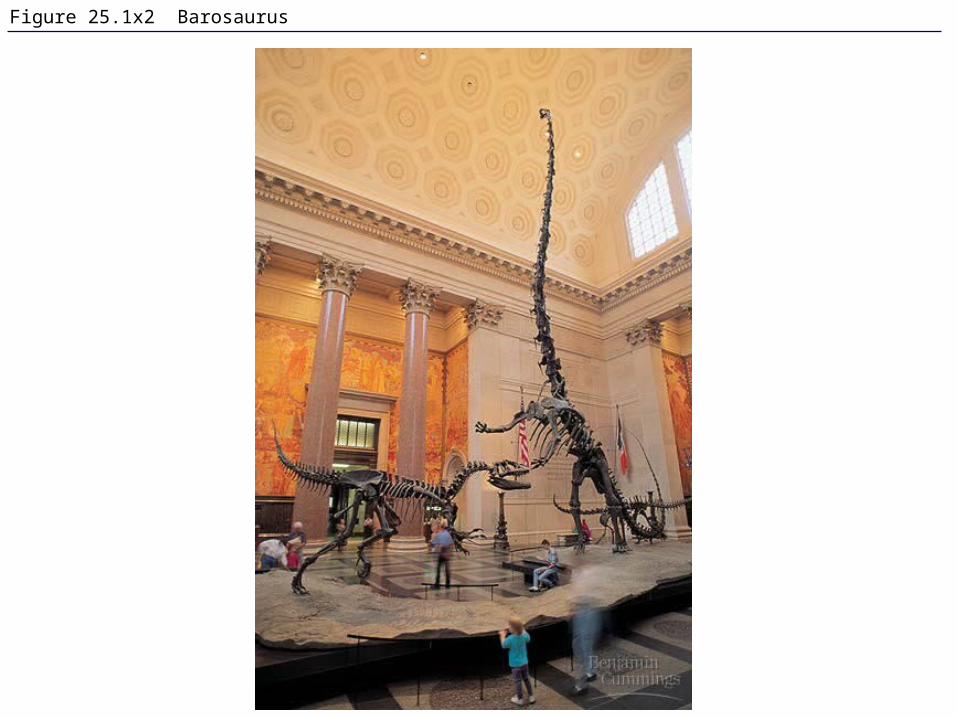
Figure 25.1x2 Barosaurus

Table 25.1 The Geologic Time Scale

Figure 25.2 Radiometric dating
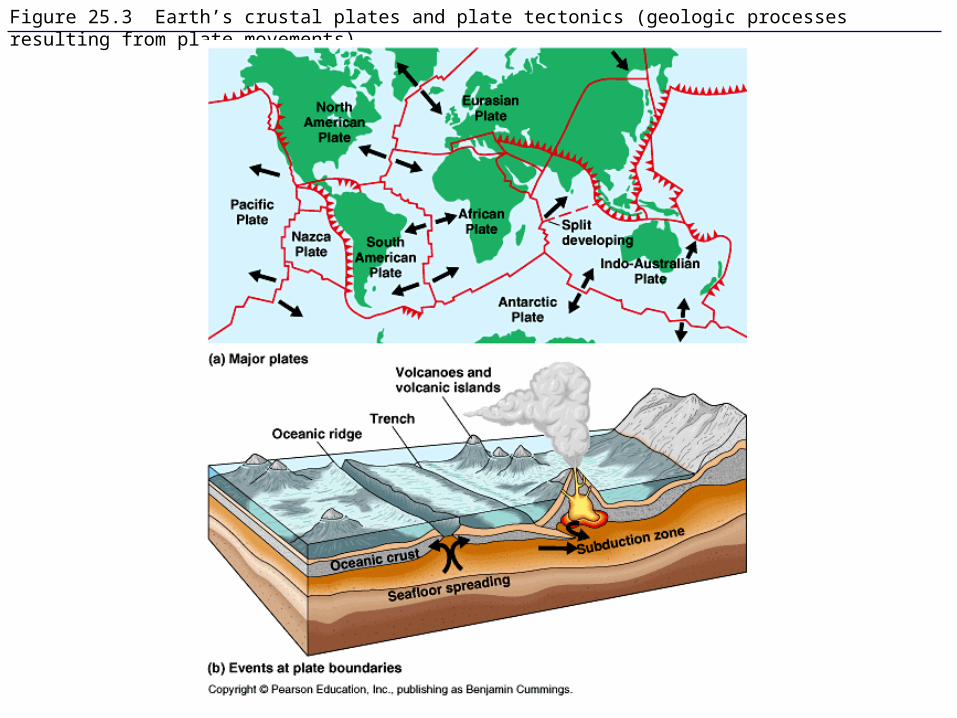
Figure 25.3 Earth’s crustal plates and plate tectonics (geologic processes resulting from plate movements)
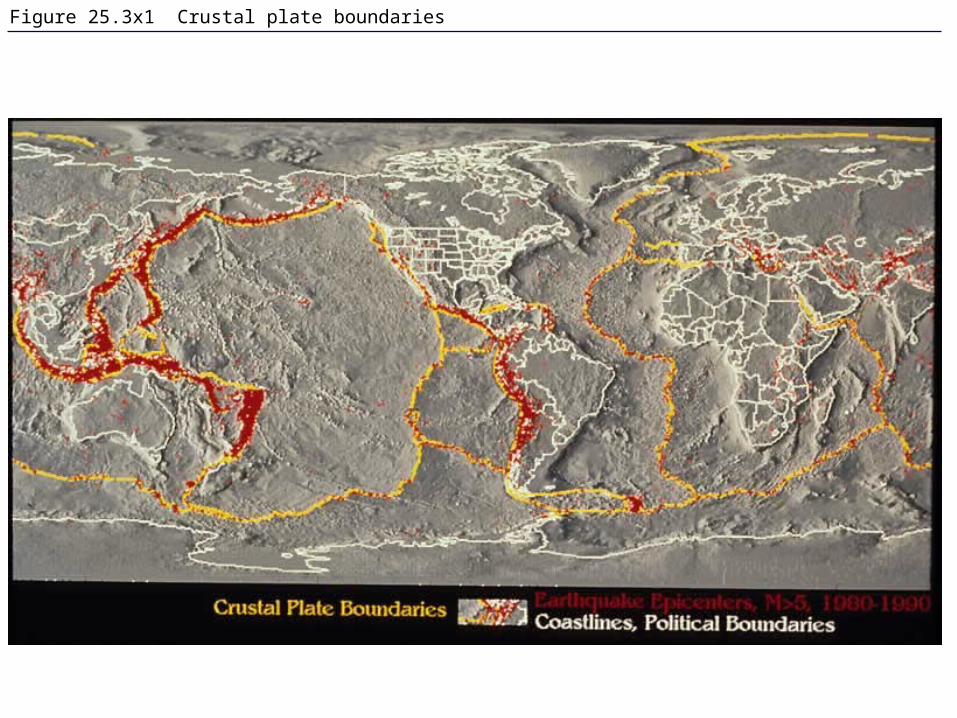
Figure 25.3x1 Crustal plate boundaries
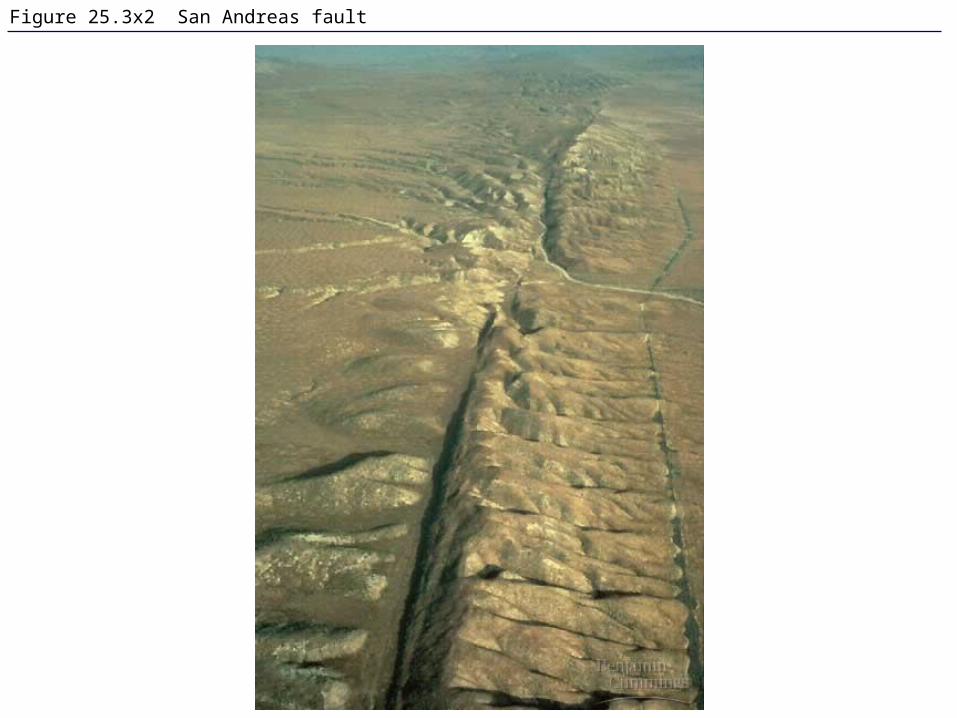
Figure 25.3x2 San Andreas fault

Figure 25.4 The history of continental drift

Figure 25.5 Diversity of life and periods of mass extinction
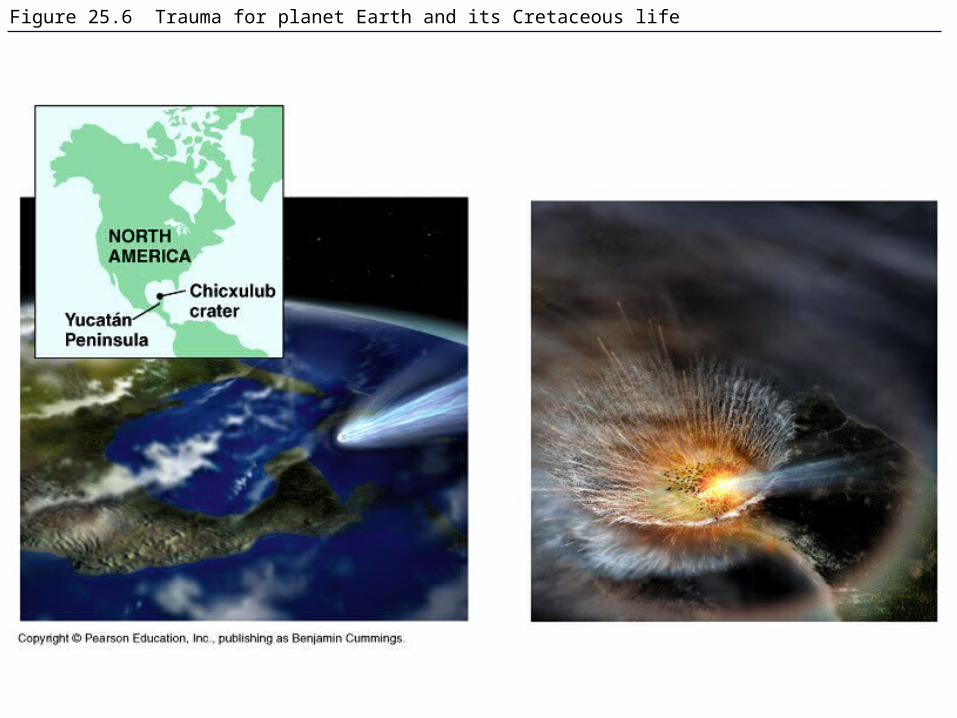
Figure 25.6 Trauma for planet Earth and its Cretaceous life

Figure 25.6x Chicxulub crater
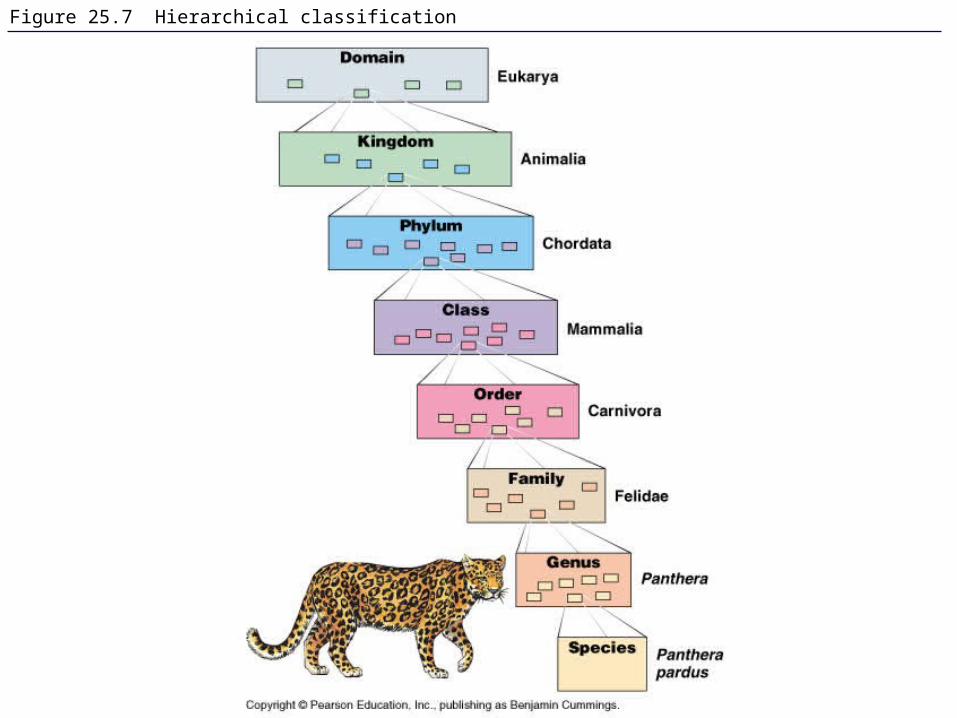
Figure 25.7 Hierarchical classification

Figure 25.8 The connection between classification and phylogeny
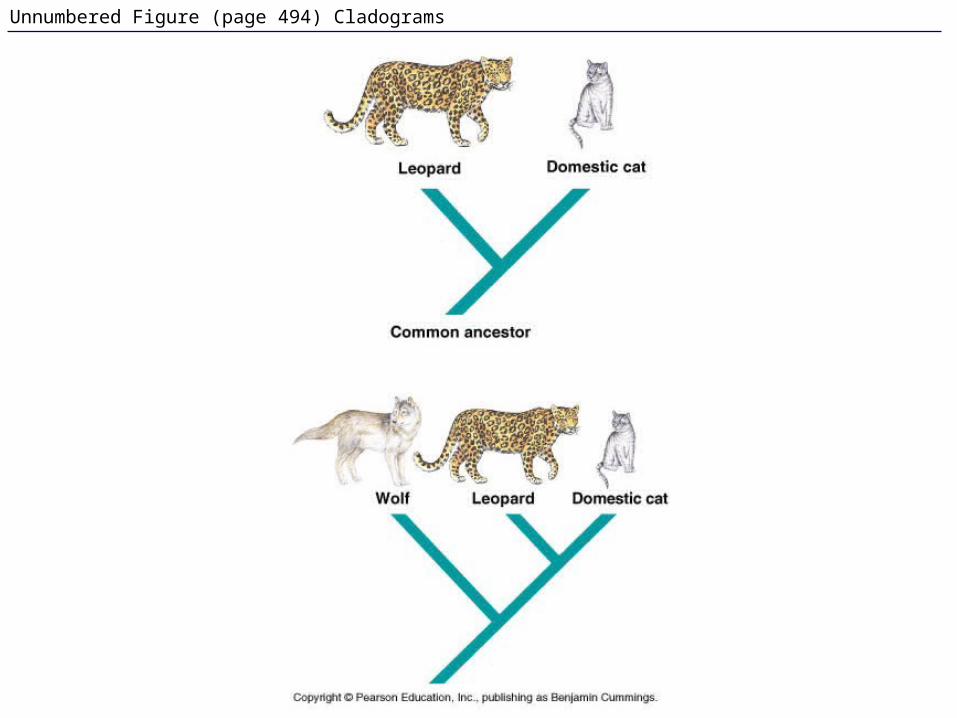
Unnumbered Figure (page 494) Cladograms

Figure 25.9 Monophyletic versus paraphyletic and polyphyletic groups
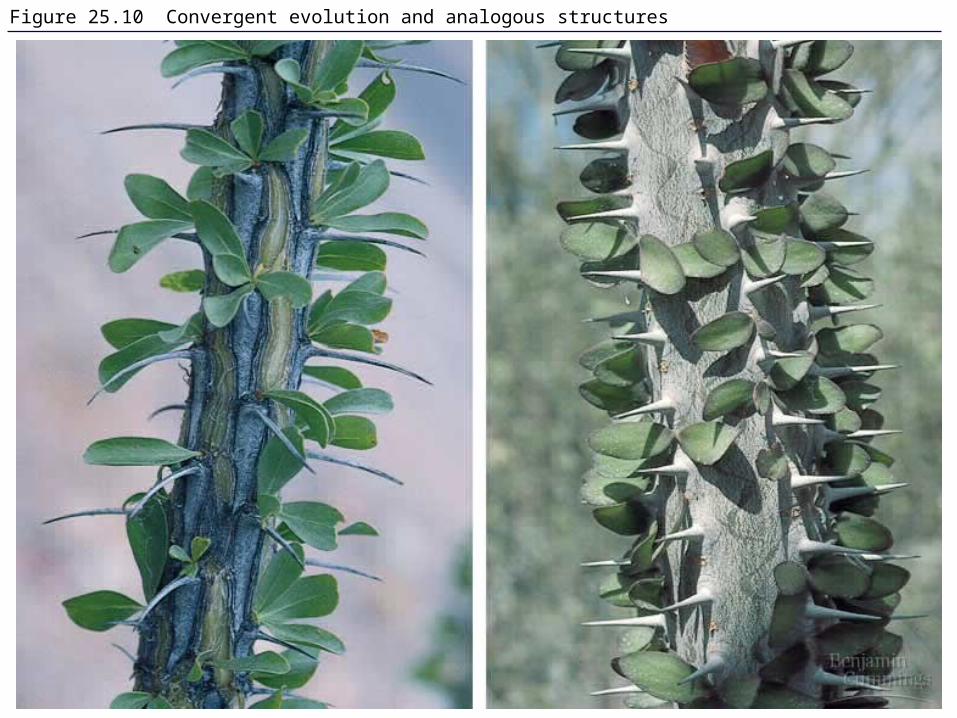
Figure 25.10 Convergent evolution and analogous structures
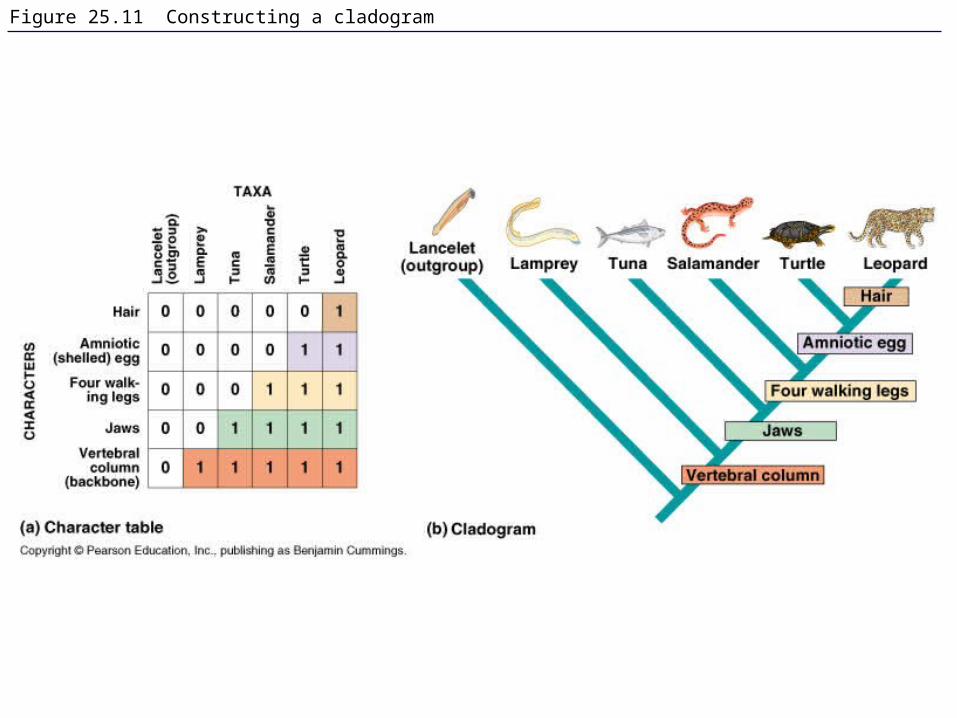
Figure 25.11 Constructing a cladogram

Figure 25.12 Cladistics and taxonomy

Figure 25.13 Aligning segments of DNA

Figure 25.14 Simplified versions of a four-species problem in phylogenetics

Figure 25.15a Parsimony and molecular systematics
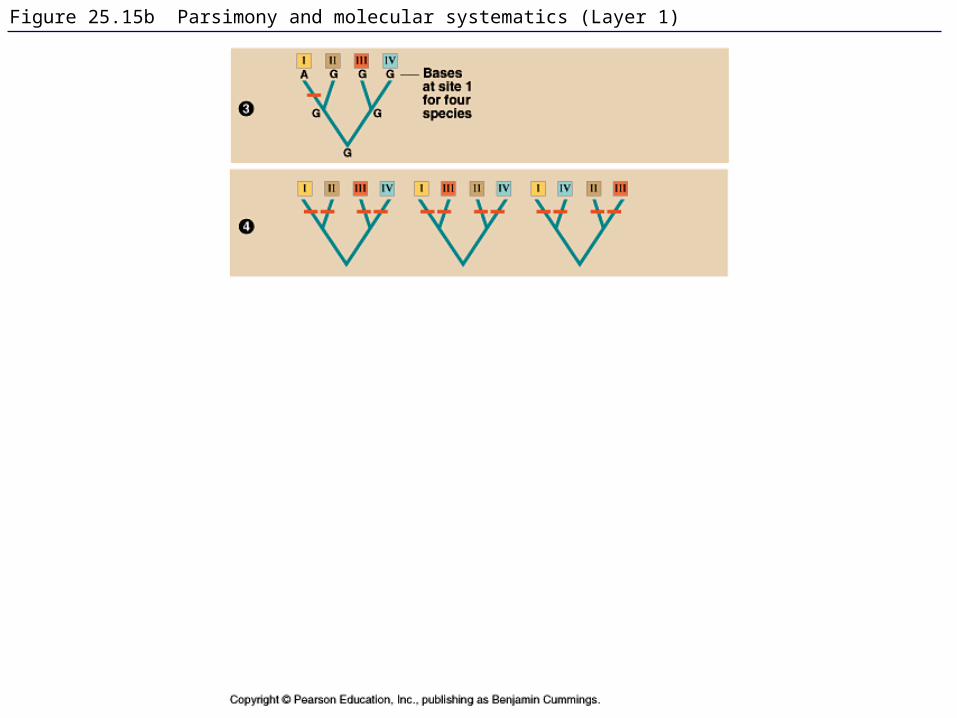
Figure 25.15b Parsimony and molecular systematics (Layer 1)

Figure 25.15b Parsimony and molecular systematics (Layer 2)
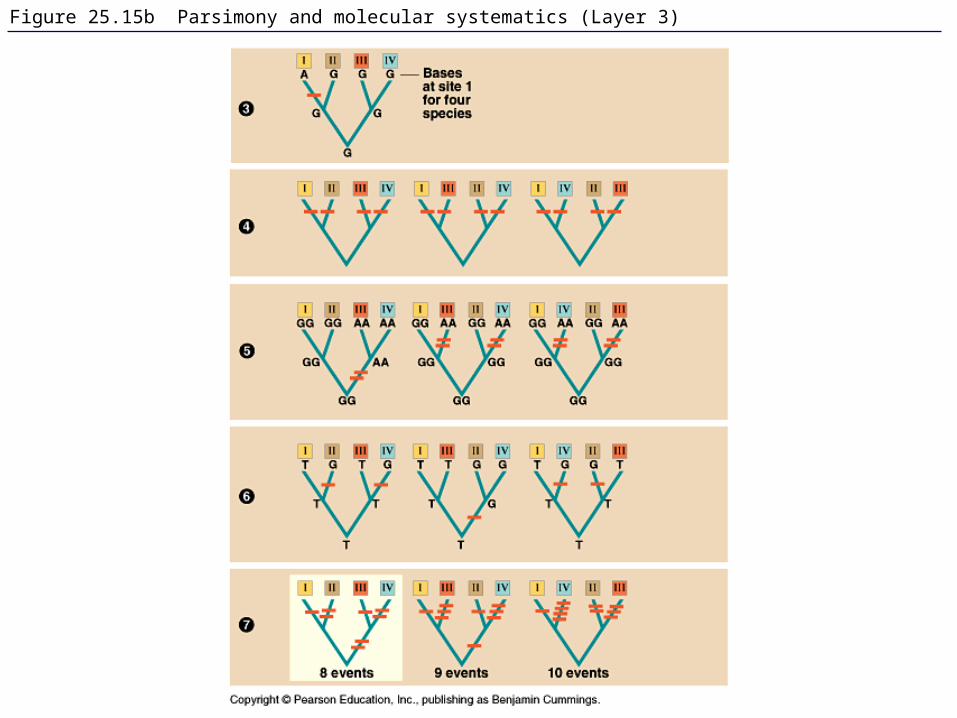
Figure 25.15b Parsimony and molecular systematics (Layer 3)

Figure 25.16 Parsimony and the analogy-versus-homology pitfall
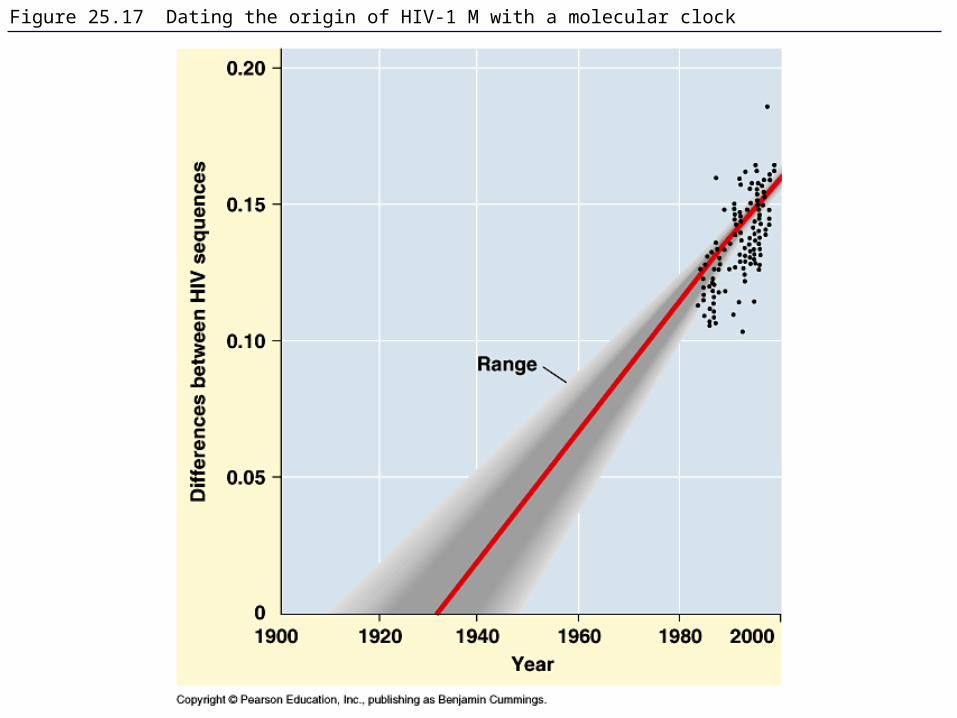
Figure 25.17 Dating the origin of HIV-1 M with a molecular clock

Figure 25.18 Modern systematics is shaking some phylogenetic trees

Figure 25.19 When did most major mammalian orders originate?