Field Testing of a Concrete Box Culvertonlinepubs.trb.org/Onlinepubs/trr/1989/1231/1231-005.pdf ·...
7
TRANSPORTATION RESEARCH RECORD 1231 49 Field Testing of a Concrete Box Culvert MAHER K. TADROS, JOSEPH v. BENAK, AHMAD M. ABDEL-KARIM, AND KAREN A. BEXTEN Field instrumentation and testing of a functional cast-in-place rein- forced concrete culvert in Sarpy County, Nebraska, are described in this paper. The culvert is a double-cell box on a 35° skew. Each cell's inside dimensions are 12 ft by 12 rt. Permanent soil fill height is 8.5 ft. Construction began in November 1987 and ended in April 1988. Measurements of soil pressures, strains, deflections, and settlements were recorded both during and after construction. The soil pressures observed to date resulting from soil and truck load- ing are reported, and comparisons of measurements, theory, and AASHTO specifications are provided. Cast-in-place reinforced concrete box culverts (RCBC) are widely used in Nebraska and across the United States to pro- vide safe and relatively economical drainage structures. The Nebraska Department of Roads (NDOR) alone constructs box culverts worth more than $2.5 million annually. Enhance- ment of the design criteria for these structures can result in appreciable savings in tax dollars nationwide. Development of new mathematical models that use computers to perform numerical solutions rapidly and efficiently leads to a com- pletely new look at the problem of culvert soil-structure inter- action. In particular, the finite element (FE) method has proven to be extremely powerful in treating a problem of such com- plexity. More realistic and uniform safety factors can be real- ized by using these models in designing RCBC, while keeping costs to a minimum. One of the most important aspects of analytical modeling, however, is obtaining the accurate field data necessary to verify the mathematical model. Load factors used in the design of cast-in-place RCBC are often based on the 1983 Standard Specifications for Highway Bridges and subsequent Interims (AASHTO). The relevant AASHTO provisions have recently become the subject of a reevaluation. Tadros et al. (J) compared the soil pressures allowed by AASHTO with field measurements and with the- oretically predicted values obtained through the use of FE analysis employing the CANDE-1980 program (2,3). These authors concluded that the AASHTO values were unconser- vative, especially with respect to the lateral earth pressures. AASHTO provisions concerning live load distribution through fill were also scrutinized. These provisions were found to lead to inconsistencies in evaluating the live load effects on the top slab of the box and, therefore, on final design and cost of the structure. The culvert research project currently under way at the University of Nebraska-Lincoln (UNL) consists of instrumenting and testing a functional double-cell box culvert under dead and live loads. The research is expected to gen- Department of Civil Engineering, University of Nebraska, Omaha, Neb. 68182-0178. erate valuable data that will be useful not only in verifying computer models but also in possibly modifying current AASHTO design provisions. The experimental work in the field is being supplemented by both field and laboratory deter- mination of material properties for use in FE analysis. CURRENT DESIGN PRACTICE FOR RCBC A survey regarding the current design practices for RCBC was conducted in 1984 (4). Of the 50 state highway depart- ments contacted, 30 responded. The results indicated that 10 states used the load factor design method (LFD) in designing RCBC. The remaining 20 states used the service load design method (SLD). Nevertheless, 7 of the 20 utilized LFD in certain situations. Regardless of the design method used, most states that responded applied load factors in accordance with AASHTO Group X loadings. Several states used a modified version of the Group X loads, however. Soil Loads When the survey was taken, AASHTO Specifications allowed the use of a vertical soil pressure of 0. 7 of 120 lb/ft 3 and a horizontal soil pressure of 30 lb/ft 3 equivalent fluid pressure. For computation of positive moments in top and bottom slabs, AASHTO allowed the horizontal soil pressure to be reduced by 50 percent, to 15 lb/ft 3 • Eleven states indicated that they used the AASHTO loads without modification. Three states used values other than 120 lb/ft 3 for vertical soil loads, and seven states used other than 30 lb/ft 3 for horizontal soil pres- sures. It should be noted that the 1987 AASHTO Interim specifications included revision of the lateral soil pressures to twice the previous values-to a band loading varying from 30 to 60 lb/ft3. Also, the 0.7 vertical pressure reduction factor was omitted. Traffic Loads Due to the three-dimensional nature of the problem of wheel- load distribution through fill, an accurate estimate of the live- load-induced pressures is difficult to obtain. The problem is further complicated by the presence of the pavement and the nature of the top slab of the culvert, which may act as a rigid base. Numerical solutions to the problem are available through the use of FE analysis. These solutions, however, require
Transcript of Field Testing of a Concrete Box Culvertonlinepubs.trb.org/Onlinepubs/trr/1989/1231/1231-005.pdf ·...
TRANSPORTATION RESEARCH RECORD 1231 49
Field Testing of a Concrete Box Culvert
MAHER K. TADROS, JOSEPH v. BENAK, AHMAD M. ABDEL-KARIM, AND
KAREN A. BEXTEN
Field instrumentation and testing of a functional cast-in-place reinforced concrete culvert in Sarpy County, Nebraska, are described in this paper. The culvert is a double-cell box on a 35° skew. Each cell's inside dimensions are 12 ft by 12 rt. Permanent soil fill height is 8.5 ft. Construction began in November 1987 and ended in April 1988. Measurements of soil pressures, strains, deflections, and settlements were recorded both during and after construction. The soil pressures observed to date resulting from soil and truck loading are reported, and comparisons of measurements, theory, and AASHTO specifications are provided.
Cast-in-place reinforced concrete box culverts (RCBC) are widely used in Nebraska and across the United States to provide safe and relatively economical drainage structures. The Nebraska Department of Roads (NDOR) alone constructs box culverts worth more than $2.5 million annually. Enhancement of the design criteria for these structures can result in appreciable savings in tax dollars nationwide. Development of new mathematical models that use computers to perform numerical solutions rapidly and efficiently leads to a completely new look at the problem of culvert soil-structure interaction. In particular, the finite element (FE) method has proven to be extremely powerful in treating a problem of such complexity. More realistic and uniform safety factors can be realized by using these models in designing RCBC, while keeping costs to a minimum. One of the most important aspects of analytical modeling, however, is obtaining the accurate field data necessary to verify the mathematical model.
Load factors used in the design of cast-in-place RCBC are often based on the 1983 Standard Specifications for Highway Bridges and subsequent Interims (AASHTO). The relevant AASHTO provisions have recently become the subject of a reevaluation. Tadros et al. (J) compared the soil pressures allowed by AASHTO with field measurements and with theoretically predicted values obtained through the use of FE analysis employing the CANDE-1980 program (2,3). These authors concluded that the AASHTO values were unconservative, especially with respect to the lateral earth pressures. AASHTO provisions concerning live load distribution through fill were also scrutinized. These provisions were found to lead to inconsistencies in evaluating the live load effects on the top slab of the box and, therefore, on final design and cost of the structure. The culvert research project currently under way at the University of Nebraska-Lincoln (UNL) consists of instrumenting and testing a functional double-cell box culvert under dead and live loads. The research is expected to gen-
Department of Civil Engineering, University of Nebraska, Omaha, Neb. 68182-0178.
erate valuable data that will be useful not only in verifying computer models but also in possibly modifying current AASHTO design provisions. The experimental work in the field is being supplemented by both field and laboratory determination of material properties for use in FE analysis.
CURRENT DESIGN PRACTICE FOR RCBC
A survey regarding the current design practices for RCBC was conducted in 1984 (4). Of the 50 state highway departments contacted, 30 responded. The results indicated that 10 states used the load factor design method (LFD) in designing RCBC. The remaining 20 states used the service load design method (SLD). Nevertheless, 7 of the 20 utilized LFD in certain situations. Regardless of the design method used, most states that responded applied load factors in accordance with AASHTO Group X loadings. Several states used a modified version of the Group X loads, however.
Soil Loads
When the survey was taken, AASHTO Specifications allowed the use of a vertical soil pressure of 0. 7 of 120 lb/ft3 and a horizontal soil pressure of 30 lb/ft3 equivalent fluid pressure. For computation of positive moments in top and bottom slabs, AASHTO allowed the horizontal soil pressure to be reduced by 50 percent, to 15 lb/ft3
• Eleven states indicated that they used the AASHTO loads without modification. Three states used values other than 120 lb/ft3 for vertical soil loads, and seven states used other than 30 lb/ft3 for horizontal soil pressures. It should be noted that the 1987 AASHTO Interim specifications included revision of the lateral soil pressures to twice the previous values-to a band loading varying from 30 to 60 lb/ft3. Also, the 0.7 vertical pressure reduction factor was omitted.
Traffic Loads
Due to the three-dimensional nature of the problem of wheelload distribution through fill, an accurate estimate of the liveload-induced pressures is difficult to obtain. The problem is further complicated by the presence of the pavement and the nature of the top slab of the culvert, which may act as a rigid base. Numerical solutions to the problem are available through the use of FE analysis. These solutions, however, require
50
considerable time and effort on the part of the designer, thus making them unsuitable for routine design \Vork.
At present, AASHTO suggests the following simplified procedure to account for live load effects:
1. when the depth of fill over the top slab is less than 2 ft, the wheel load shall be distributed as in concentrated loads on exposed slabs.
2. when the depth of fill is 2 ft or more, but does not meet the conditions in Stipulation 3 below, concentrated loads shall be distributed over a square whose sides are equal to 1.75 times the depth of fill.
3. when the depth of fill is more than 8 ft and exceeds the span length of a single span culvert or exceeds the distance bet.ween inner faces of outer walls of a multiple-span box, the effect of live load may be neglected.
These stipulations can result in contradictions at transitional fill heights. For example, the AASHTO specifications have been shown by the NDOR to result in an RCBC covered with 8 ft of fill requiring thicker walls and more reinforcement than one with 9 ft of fill (the latter being designed with live load fully ignored). For this reason, the NDOR currently uses a slightly modified version of the aforementioned procedures. In addition, AASHTO Specifications do not provide guidance for wheel load distribution due to pavement or for distribution within the top slab itself for fill depths greater than 2 ft.
Although the culvert had a skew angle of 35°, it was designed as a right angle culvert, thus ignoring the skew. The reinforcement was placed in mats parallel and perpendicular to the walls. This practice is common in Nebraska and does not appear to be unreasonable. The testing program included live load positions both along the roadway (at a skew angle) and perpendicular to the culvert. Analysis of these results is beyond the scope of this report.
THEORETICAL SOIL PRESSURES
Based on extensive finite element modeling of a large number of culverts of common sizes and shapes, the following soil pressure formulas were proposed (1).
For silty clay soil,
PT = (0.984 + 0.0063H) '{,H
Ps = 0.6 'fsH
PB = PT+ 2Hh (57 + 26.3 H,,)IW,,
For silty sand soil,
PT= (0.970 + 0.0067H) '{5 H
Ps = 0.567 'fsH
PB = PT+ 2Hb (114 + 16.2H,,)IW,,
(1)
(2)
(3)
(4)
(5)
(6)
In the above formulas, PT, Ps, and P8 are pressures on top slab, side walls, and bottom slab, respectively; '{, is the fill unit weight in lb/ft3; His the fill height in feet above the point considered; and H,, and Wb are the overall height and width of the culvert in feet. Equations 3 and 6 do not include the
TRANSPORTATION RESEARCH RECORD 1231
effect of the culvert weight, which must be considered in actual design. They do include, however, the frictional (drag) forces that develop due to the tendency of the soil on the culvert sides to settle more than do the culvert itself and the soil directly above it.
INSTALLATION DESCRIPTION
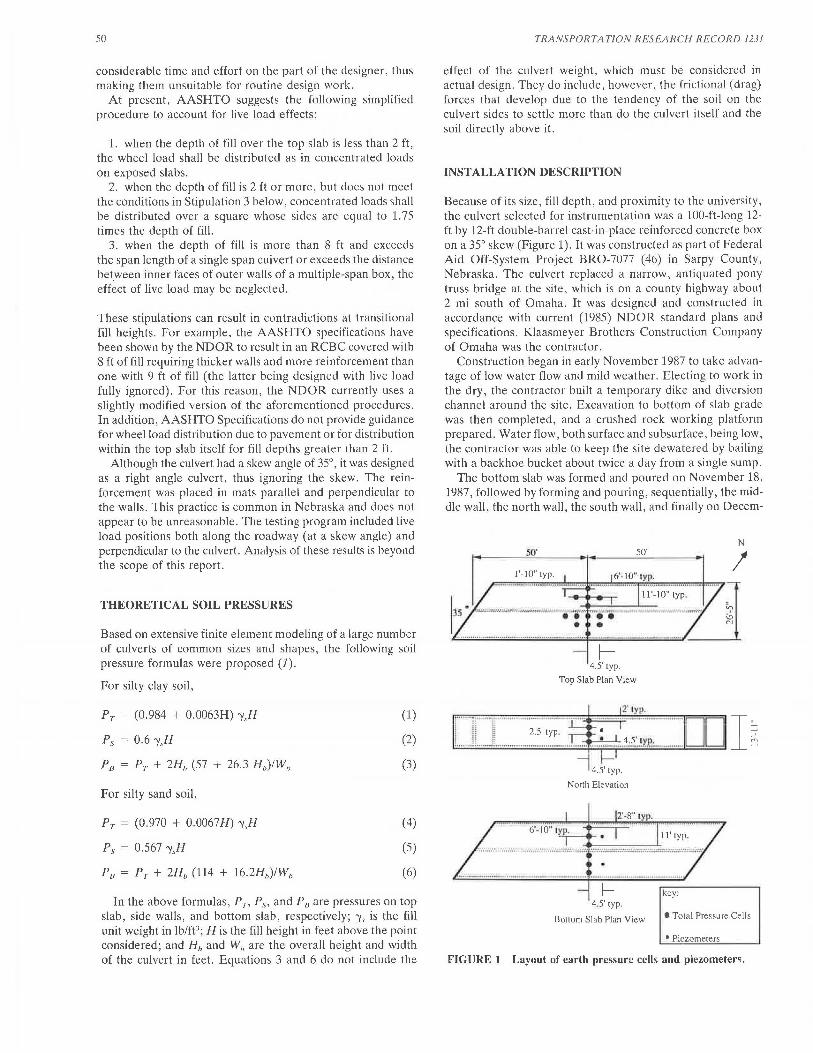
Because of its size, fill depth, and proximity to the university, the culvert selected for instrumentation was a 100-ft-long 12-ft by 12-ft double-barrel cast-in-place reinforced concrete box on a 35° skew (Figure 1). It was constructed as part of Federal Aid Off-System Project BRO-7077 ( 46) in Sarpy County, Nebraska. The culvert replaced a narrow, antiquated pony truss bridge at the site, which is on a county highway about 2 mi south of Omaha. It was designed and constructed in accordance with current (1985) NDOR standard plans and specifications. Klaasmeyer Brothers Construction Company of Omaha was the contractor.
Construction began in early November 1987 to take advantage of low water flow and mild weather. Electing to work in the dry, the contractor built a temporary dike and diversion channel around the site. Excavation to bottom of slab grade was then completed, and a crushed rock working platform prepared. Water flow, both surface and subsurface, being low, the contractor was able to keep the site dewatered by bailing with a backhoe bucket about twice a day from a single sump.
The bottom slab was formed and poured on November 18, 1987, followed by forming and pouring, sequentially, the middle wall, the north wall, the south wall, and finally on Decem-
N
4.5' typ.
Top Slab Plan View
4.5' typ.
North Elevation
••••-••-r---••...,... .. .,, •• ,~, •• ~ .. ~••••••••••••••-••••••••>1 • •···n-·-·-·--·-···---·--••
f- key: 4.5' typ.
Bottom Slab Plan View •Total Pressure Cells
1 Piezometers
FIGURE I Layout of earth pressure cells and piezometers.

Tadros et al.
ber 10 the top slab. After concrete forms and shoring were removed, backfilling and compaction along the sides commenced on December 14 with a track-type front-end loader (Caterpiller 955L). The dike was breached and the diversion channel backfilled on December 16. Sidewall backfilling continued until December 18 when the winter shutdown began. The fill at this time was within about 4 ft of the top of the culvert. Some of the excavated soil from the site, particularly glacial till (LL = 44, PI = 20), was used for the initial backfill on the north side. Because of the generally wet nature of the local alluvial soils, drier silty clay (loess) borrow material (LL = 37, PI = 14) was imported and used for the backfill on the south and later over the top of the structure. Both the till and loess are classified as CL material according to the Unified Classification System. Backfilling and compaction again commenced on April 7, 1988. After reaching a permanent fill depth of 8.5 ft over the top of the culvert, an additional 3.5-ft surcharge was placed to allow for special live load testing. After removal of the surcharge, gravel surfacing was placed on the roadway on April 18, 1988.
Compaction requirements under the roadway conformed to those for NDOR Class II embankments: (a) that the material be placed in 8-in. loose lifts with a minimum of two passes with approved equipment and (b) that moisture content of the soil be adjusted so that satisfactory compaction can be obtained.
Roadway fill material was spread and partially compacted with a track-type front-end loader. Final compaction was done with a vibratory pad foot roller (Bomag BW 142PD). Compaction in restricted areas was done with a gasoline-powered tamper. Dry unit weights of the fill material obtained from postconstruction, thin-wall tube specimens taken adjacent to the culvert ranged from about 95 to 108 lb/ft3 with mean of 102 lb/ft3 and standard deviation of about 5 lb/ft3
. Moisture contents ranged from about 17 to 25 percent with mean of approximately 21 percent and standard deviation of slightly more than 2 percent. The mean wet soil unit weight was 123 lb/ft3. Undrained triaxial compression tests of the fill material conducted at in situ water contents indicated shear strength parameters (<f.>,c) of 18° and 20 psi, respectively, for cell pressures in the range of 0 to 30 psi. Regression of u 1 on u 3 gave a sample correlation coefficient of 0. 99.
INSTRUMENTATION AND TESTING
The primary instrumentation consisted of 28 vibrating-wire earth pressure cells mounted in steel boxes and distributed as shown in Figure 1. The boxes allow recovery of the cells after completion of the project. Supplementing the earth pressure cells were 6 vibrating-wire piezometers to measure hydrostatic boundary water pressures (Figure 1) and 40 vibrating-wire strain gauges mounted on reinforcing bars (Figure 2) to measure moments and thrusts in the structure. Vibrating-wire instruments were monitored at the site by an automated data acquisition system consisting of a 64-channel multiplexer and a personal computer operated from the back of a station wagon.
Instrumentation to measure settlements, as well as longitudinal and transverse displacements, was also installed. This instrumentation consisted of settlement observation points located on the structure as well as in the adjacent fill and of
II' 10" I
~ 6' 10'1 lXQ· ~1 1-17" typ . 12"
t = = = = II II
7" typ.
II - II - 10" ;:,.,
II" 9" ~ - lyp,
3" II II" b 3" lyp. (o II
= = = = -I rn· ·~ t II" , ... j r ·I ; 11'0" l: . .
26'-5" typ.
FIGURE 2 Culvert dimensions and locations or reinforcing steel strain gauges.
Settlement Rods
FIGURE 3 Cross section showing transverse deflection points and settlement plates (note: gauges were placed in pairs at midlength or culvert).
Finished roadway
I
I I I .II /
I Offsite Benchmark 0
// I
FIGURE 4 Longitudinal deflection points.
51
~
horizontal and vertical measuring points inside the culvert (Figures 3 and 4). Second order survey techniques (5) were employed in connection with observations on these devices. Settlements and longitudinal displacements are considered to be accurate to within ± 0.003 ft. Transverse displacements were measured with a tape extensometer having a precision of 0.005 in.
52
Direction Parallel io the roa.dv1.ay
6'
~4 ·- ·-- - ·-·-·-·ri
T2·
Direction perpendicular Note : to the culvert
• Denotes the position of the centerline of the rear axle
Concrete median barriers
= 6'
,/ ~. ~ =-t 22,800 lb 4,200 lb
·r---14.1' -I T Test truck Tire Layout
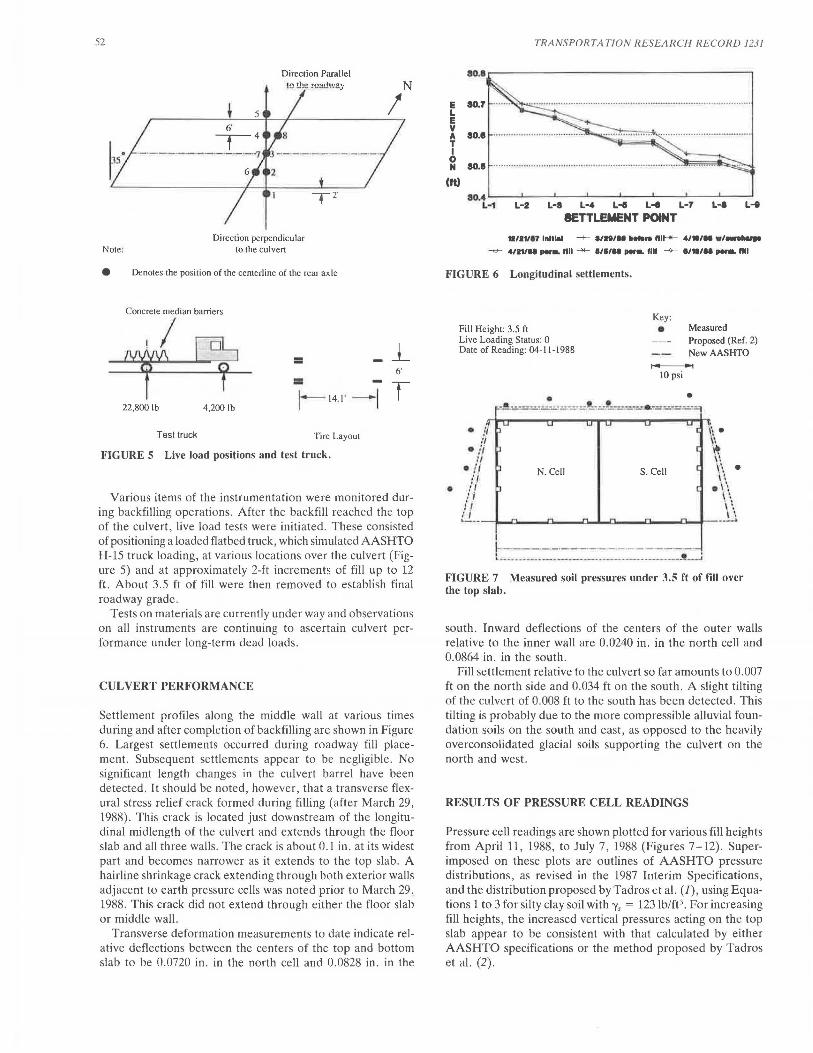
FIGURE S Live load positions and test truck.
Various items of the instrumentation were monitored during backfilling operations. After the backfill reached the top of the culvert, live load tests were initiated. These consisted of positioning a loaded flatbed truck , which simulated AASHTO H-15 truck loading, at various locations over the culvert (Figure 5) and at approximately 2-ft increments of fill up to 12 ft. About 3.5 ft of fill were then removed to establish final roadway grade .
Tests on materials are currently under way and observations on all instruments are continuing to ascertain culvert performance under long-term dead loads.
CULVERT PERFORMANCE
Settlement profiles along the middle wall at various times during and after completion of backfilling are shown in Figure 6. Largest settlements occurred during roadway fill placement . Subsequent settlements appear to be negligible. No significant length changes in the culvert barrel have been detected. It should be noted, however, that a transverse flexural stress relief crack formed during filling (after March 29, 1988). This crack is located just downstream of the longitudinal midlength of the culvert and extends through the floor slab and all three walls. The crack is about 0.1 in. at its widest part and becomes narrower as it extends to the top slab. A hairline shrinkage crack extending through both exterior walls adjacent to earth pressure cells was noted prior to March 29, 1988. This crack did not extend through either the floor slab or middle wall.
Transverse deformation measurements to date indicate relative deflections between the centers of the top and bottom slab to be 0.0720 in. in the north cell and 0.0828 in. in the
E 80.7 L E v 11 ao.e T I 0 N ao.11
(rt)
TRANSPORTATION R ESEA RCH RECORD 1231
80.4'---_,_-~.__-~-~--~-~--~-~
~ ~ W W W ~ ~ H ~
SETTLEMENT POINT
11111111 tnlli.I -+- 11n111 -.. rm-*- 41•111 •I......,.. -fr- 4111111 ...... 1111 --'*- .,., ........ 1111 -+- '""" ...... 1111
FIGURE 6 Longitudinal settlements.
•
Fill Height: 3.5 ft Live Loading Status: 0 Date of Reading: 04-11-1988
Key:
• Measured Proposed (Ref. 2)
NewAASHTO ,.. .., 10 psi
• • -· ==·=-===4 ,=:.' =-•::===-
1-- ---- ·- ·- ---·----- --·--l -- .. ·----·--·-·--·-··""---·-------,---·--_._ _ __;
FIGURE 7 Measured soil pressures under 3.5 ft of till over the top slab.
south. Inward deflections of the centers of the outer walls relative to the inner wall are 0.0240 in. in the north cell and 0.0864 in. in the south.
Fill settlement relative to the culvert so far amounts to 0.007 ft on the north side and 0.034 ft on the south. A slight tilting of the culvert of 0.008 ft to the south has been detected. This tilting is probably due to the more compressible alluvial foundation soils on the south and east, as opposed to the heavily overconsolidated glacial soils supporting the culvert on the north and west .
RESULTS OF PRESSURE CELL READINGS
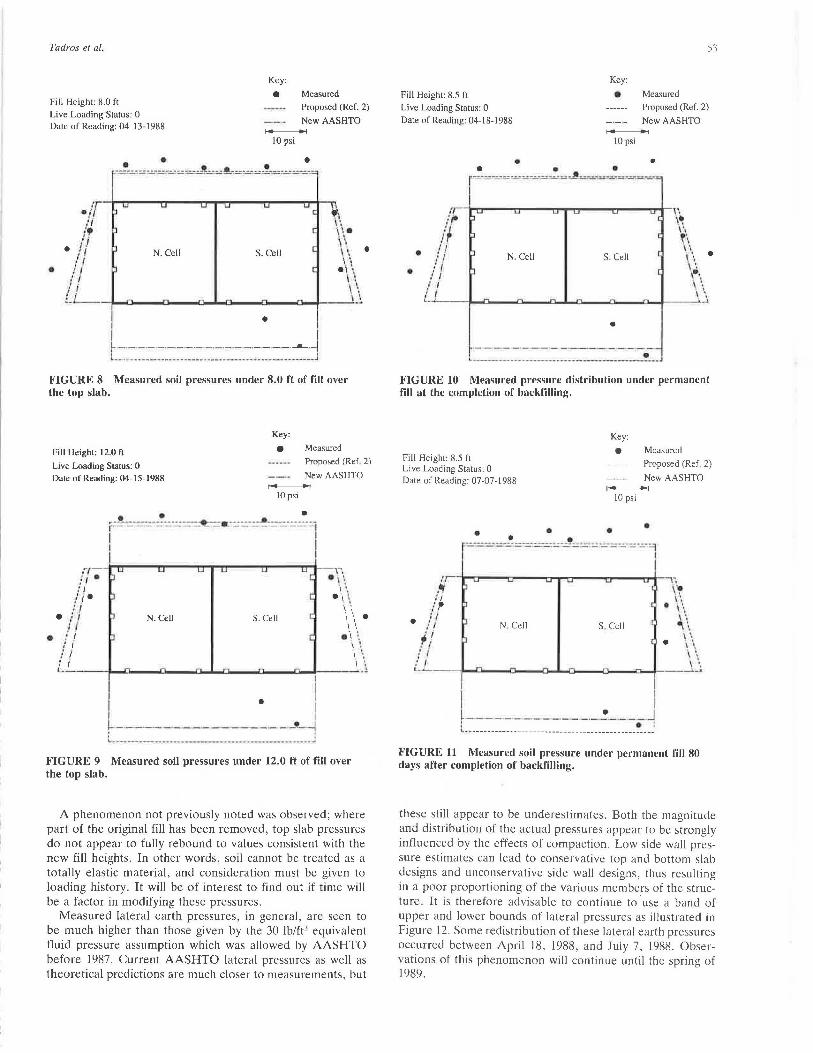
Pressure cell readings are shown plotted for various fill heights from April 11, 1988, to July 7, 1988 (Figures 7-12). Superimposed on these plots are outlines of AASHTO pressure distributions , as revised in the 1987 Interim Specifications, and the distribution proposed by Tadros et al. (J), using Equations 1to3 for silty clay soil with 'Is = 123 lb/ft3 • For increasing fill heights, the increased vertical pressures acting on the top slab appear to be consistent with that calculated by either AASHTO specifications or the method proposed by Tadros et al. (2).
Tadros et al.
Key:
Fill Height: 8.0 ft
Live Loading Status: 0 Date of Reading: 04-13-1988
• Measured
Proposed (Ref. 2)
NewAASHTO I.. lrl
10 psi
• • • ~===,=-=:.:=='--==~'==··=,!..===---"'
~ .. \ \. . \
S.Cell \\ I\
• •\\ I, \\ ' -~
I •
l·---·--·-·- ·-·--·-·- ·-·-·-·- ·-·-· --- ·~ ' ' L---... -----.~-- ---------·------·-----·-·-----------.1
FIGURE 8 Measured soil pressures under 8.0 ft of fill over the top slab.
Key:
e Measured
•
Fill Height: 12.0 ft
Live Loading Status: 0 Date of Reading: 04-15-1988
Proposed (Ref. 2)
New AASHTO
IO psi
• • r -~----···---e.···-_____.___· ····· ·· 1--------------- -----------1 I
I
. ~---~ . ' "'------·- .. ------~-~-~~----·--· .....
FIGURE 9 Measured soil pressures under 12.0 ft of fill over the top slab.
A phenomenon not previously noted was observed; where part of the original fill has been removed, top slab pressures do not appear to fully rebound to values consistent with the new fill heights. In other words, soil cannot be treated as a totally elastic material, and consideration must be given to loading history. It will be of interest to find out if time will be a factor in modifying these pressures.
Measured lateral earth pressures, in general, are seen to be much higher than those given by the 30 lb/ft3 equivalent fluid pressure assumption which was allowed by AASHTO before 1987. Current AASHTO lateral pressures as well as theoretical predictions are much closer to measurements, but
53
Key:
Fill Height: 8.5 ft
Live Loading Status: 0 • Measured
Proposed (Ref. 2)
NewAASHTO Date of Reading: 04-18-1988 I.. ..I
IO psi
• • • • • r=,=·=-====~=====,~
I /;. \'.
\'· /~ t\
• ! I \', • ,' I N. Cell S. Cell \" \ • : I 1\ .'I I I ; ! \ \
.l
•
• ---------------------- ---------~-
FIGURE 10 Measured pressure distribution under permanent fill at the completion of backfilling.
Key:
Fill Height: 8.5 ft • Measured
Proposed (Ref. 2)
New AASHTO Live Loading Status: 0 Date of Reading: 07-07-1988 ·-10 psi
• • • • -===~~~~=~-::!~=-=-.=====9
,--;.......,.--.,...--..,..,~--....... ..--....,., ...... ---, •. ~ ~ ti \'•, /,, . \
•• .1 11 n .. N. Cell S. Cell 9i : i \ ".
.~ f e I \\ : I
i I _ _:~~
I L--- , _____ .! ___ J I • :
L •• ----- ----- ------ - ---- ------ ----- ------ - ---- -___ J
FIGURE 11 Measured soil pressure under permanent fill 80 days after completion of backfilling.
these still appear to be underestimates. Both the magnitude and distribution of the actual pressures appear to be strongly influenced by the effects of compaction. Low side wall pressure estimates can lead to conservative top and bottom slab designs and unconservative side wall designs, thus resulting in a poor proportioning of the various members of the structure. It is therefore advisable to continue to 'use a band of upper and lower bounds of lateral pressures as illustrated in Figure 12. Some redistribution of these lateral earth pressures occurred between April 18, 1988, and July 7, 1988. Observations of this phenomenon will continue until the spring of 1989.

54
Determination of the bottom slab pressure distribution was hindered by temporary pressure cell malfunctioning. However, from the information available, some of the measured bottom slab pressures deviate considerably from the uniform distribution allowed by AASHTO and from that based on finite element analysis.
Fill Height: 8.0 ft Key: e Measured
Live Loading Status: 0 ~>..."<..> Proposed (Ref. 2) Date of Reading: 04-13-1988 77-L/. New AASHTO
~ OldAASHTO I.. •I
10 psi
• • • ~=::..:=.=:::.:..:=-J.::.:.=.~=:~.=:!~==-:-
N.Cell S.Cell
•
• I
-==--====:::.:::=.:=.=.==-:::: ... -:==:;:_~ I "·- -- -- ----- ·-- ------- ----- ----·- "*·--·-----'
FIGURE 12 Comparison of various bands of soil pressures at 8.0 ft of fill over the top slab .
.. 'O .... Dep lh of F ll I ov e r Top SI ob
~ ....
iii ~ .: • Q. ~ .....
• .: l ) Ill .. .. • .: it !8
ai
... Ill ei
? ei
I
1li
•
TRANSPORTA TION RESEARCH RECORD 1231
A three-dimensional plot of the pressure distribution on the top slab due to truck axle loading is presented in Figure 13. Orientation of the test vehicle is north, with the rear axle centered over the middle of the south cell (the point x = 0, y = 0 in the figure) . Comparison of measured and theoretical distributions is under way and will be fully reported later. Examples of comparisons of measured and allowed AASHTO pressures for truck loading at three fill heights are given in Figure 14; the dashed line represents the uniform AASHTO distribution mentioned earlier. At a fill height of 3.5 ft, the indicated negative measured pressures do not represent tensile stresses in soil, but rather a reduction in the pressure caused by soil weight alone .
CONCLUSIONS
Instrumentation and testing of a full-sized, functional culvert are described in this paper. Construction was intended to model actual rather than laboratory-controlled conditions. It was observed that soil pressures were generally higher than those specified by the 1986 and earlier editions of AASHTO . The 1987 revision by AASHTO, which removed the 0.7 coefficient from the calculation of soil pressure on top slab and which doubled the side wall pressure, is shown to be a significant step forward. Loading history and time-dependent behavior of soil appear to be significant due to the inelastic nature of soil. Details of this phenomenon as well as of field and theoretical effects of truck loading will be presented upon completion of this research project.
3.5 fl
.... -
FIGURE 13 Measured pressure distribution on the top slab due to axle loading.

Tadros et al.
o Measured: Direction of travel perpen. to culvert • Measured: Direction of travel parallel to roadway
- ·- New AASHTO
1-------l 1.0 psi
0
Fill height= 3.5 ft •
Fill height= 8.0 ft
• :--·---·-1 i I ! I
I Q
0
I • •
0
• • , .- - - ·-·- ·- ·--·- - ·___.!]
r-·- - -.-·-·-·-.- - - ....-- - - -.--- --. Fill height= 12.0 ft
I Position of rear axle • (see Fig. 4)
•
FIGURE 14 Top slab pressures caused by truck loading under 3.5, 8.0, and 12.0 ft of fill for live load positions 3 and 7 (normal and skew directions of travel, respectively).
ACKNOWLEDGMENT
Sponsors of the project are the Federal Highway Administration, the Nebraska Department of Roads, and the Uni-
55
versity of Nebraska-Lincoln. Many individuals have contributed to various phases of this project. Special thanks are due to Jim Holmes, George Schmid, Paul Koenig, Dalyce Ronnau, Wayne Horn, Tom Goodbarn, and Jerry Koloen, all of the Nebraska Department of Roads; Ron Rystrom, Sarpy County Engineer; and Keith Klaasmeyer and Bob Ulrich of Klaasmeyer Bros.
REFERENCES
1. M. K. Tadros, J. V. Benak, and M. K. Gilliland. Soil Pressure on Box Culverts. AC/ Structural Journal, Vol. 86, No. 4, 1989, pp. 439-450 .
2. M. G. Katona, P. D. Vittes, C.H. Lee, and H. T. Ho. CANDE-1980: Box Culverts and Soil Models. Report FHWA/RD-80/172. FHWA, U.S. Department of Transportation, May 1981.
3. M. G. Katona and J. M. Smith. CANDE User Manual. Report FHWA-RD-77-6. FHWA, U.S. Department of Transportation, 1976.
4. M. K. Tadros. Cost Effective Concrete Box Culvert Design. Project HRP83-3, Engineering Research Center, University of Nebraska, Omaha, 1986.
5. 1. Dunnicliff. Geotechnical Instrumentation for Monitoring Field Performance. John Wiley and Sons, New York, 1988 .
The contents of this report reflect the views of the authors who are responsible for the facts and the accuracy of the data. The contents do not necessarily reflect the official views or policies of the Nebraska Department of Roads, the Federal Highway Administration, or the University of Nebraska. This report does not constitute a standard, specification, or regulation.
Publication of this paper sponsored by Committee on Subsurface Soi/Structure Interaction.