Field Stream Classification (Poulin) for the Fort Nelson ... · Field Stream Classification...
54
Field Stream Classification (Poulin) for the Fort Nelson Forest District – testing an experimental Procedure for Risk Managing Streams V.A. Poulin & Associates Ltd. Prepared by: V.A. Poulin Prepared for: Slocan Forest Products Ltd., Fort Nelson, BC March 2004
Transcript of Field Stream Classification (Poulin) for the Fort Nelson ... · Field Stream Classification...

Field Stream Classification (Poulin) for the Fort Nelson Forest District – testing an experimental
Procedure for Risk Managing Streams V.A. Poulin & Associates Ltd.
Prepared by: V.A. PoulinPrepared for: Slocan Forest Products Ltd., Fort Nelson, BCMarch 2004

Field Stream Classification (Poulin) forthe Fort Nelson Forest District – testing
an experimental Procedure for RiskManaging Streams
Prepared by
V.A. PoulinV.A. Poulin & Associates Ltd.
2153 West 46th AvenueVancouver, BC
V6M 2L2
For
Slocan Forest Products Ltd.Fort Nelson Woodlands
R.R. #1, Mile 294 Alaska HighwayFort Nelson, BC
V0C 1R0
March, 2004
TABLE OF CONTENTS
TABLE OF CONTENT ...................................................................................................... ii
ACKNOWLEDGEMENTS ................................................................................................ iii
1. INTRODUCTION ........................................................................................................ 1
2. PURPOSE OF PROJECT ........................................................................................... 1
3. PROJECT DESCRIPTION .......................................................................................... 23.1 Scope of Work ............................................................................................... 23.2 Study Area ..................................................................................................... 43.3 Fish Species .................................................................................................. 4
4. METHODS ................................................................................................................... 84.1 FDIS Databases ............................................................................................ 84.2 Field Model and Testing ................................................................................ 84.3 Data Analysis ................................................................................................ 8
5. RESULTS AND DISCUSSION ................................................................................. 125.1 Habitat Card and Risk Model ...................................................................... 135.2 Field Tests ................................................................................................... 185.3 Discriminate Analysis .................................................................................. 21
6. CONCLUSIONS ........................................................................................................ 23
7. REFERENCES CITED ............................................................................................. 24
APPENDIX 1. LOCATION OF SAMPLE SITES ........................................................... 26
APPENDIX 2. EXAMPLE FIELD CARDS ..................................................................... 43
APPENDIX 3. 2004 FIELD CARD ................................................................................. 48

ACKNOWLEDGEMENTS
This project was funded by the Forest Investment Account on behalf of Slocan ForestProducts Ltd., Fort Nelson Woodlands, Fort Nelson, BC. I would like to thank KevinKuhn, Forestry Manager, for his continued project support and the help provided byKevin Charleston, Area Forester, throughout the field season. Dale Wright, ForsiteConsulting, provided project technical services. Dale coordinated the field equipment,did the electroshocking and over saw completion of the project requirements for dataentry into FDIS. The assistance of Jason Hart and Janice Dobson, Forsite Consulting, incompleting the data entry is appreciated. Emily Roberston, (Biometrics) brought adimension only a statistician could to the project. Emily completed the statisticalanalyses contained in the report. Her work allowed for independent analysis of theoriginal point scores and probability of use ratings. The patience and support providedby Tony Cheong, Inventory Branch, Victoria, made the project possible.

Page: 1
Field Classification (Poulin) for Fort Nelson Forest District VA Poulin & Associates Ltd. – March, 2004
1. INTRODUCTION
This project is a continuation of a study that began in 2002/2003 to develop a fieldmethodology for use by forest technicians to classify and stratify streams in the FortNelson Forest District. The intent of the project is to determine if standard fish streammeasurements, “habitat criteria” could allow them to identify streams with a lowprobability of use by fish. Enabling that determination would thereby make it possible forthem to eliminate the requirement for vast numbers of small streams that lack fishhabitat from subsequent survey by fisheries specialists. Conversely, the methodologywould provide the basis for determining which streams require sampling or where habitatvalues are so overwhelmingly high, that in all probability, further sampling was notnecessary. The benefit cost to forest operations would be immense. Foresttechnicians and staff already survey blocks. They cross each stream and completestream profiles that establish location and other facts concerning the potentialclassification of a stream. Past inventories found sport fish at 21% of sites sampled andof those, only 13% contained arctic grayling (Poulin 2003). Arctic grayling were the onlysport fish present in streams of the size encountered in operational areas. A fewmountain whitefish and bull trout appear in the inventory, but all occupied in the largeststreams sampled. These data suggest it is only reasonable that some methodologyshould allow forest technicians to isolate a large portion of the non-fish bearing streamsand thereby reduce the high cost of unnecessary fish stream surveys.
With the new Forest and Range Practices Act (FRPA) companies will soon operateunder Forest Stewardship Plans. These plans allow each company to manage landusing professional accountability and risk management. With FRPA, companies will workwith professionals to develop new procedures and practices that meet the stewardshipgoals of the Act. This project embodies in every respect the opportunities made possibleby FRPA. It is a stream classification tool developed by forest companies, for forestcompanies to risk manage streams.
The study is one of two projects of its kind; each conducted by V.A. Poulin & AssociatesLtd. The second project is underway in the Dawson Creek Forest District (Poulin et al.2003). The projects share the same objectives and methodology. However, they addressdifferent target fish species due to their geographical locations and employ slightlydifferent test models due to differences in the parameters that predict fish use. Theability to work in both Districts has contributed significantly to the success of eachproject.
2. PURPOSE OF PROJECT
The purpose of this project phase is to test and evaluate a stream classification modelthat uses the habitat parameters - stream order, stream width, channel depth, pooldepth, gradient, and habitat descriptors – morphology, bed material, stream pattern,confinement and crown closure to predict the probability of use by sport fish. Byproviding each with a weighted value equivalent to the strength of that parameter inpredicting the probability of use by fish, the sum total of values provide a measure of

Page: 2
Field Classification (Poulin) for Fort Nelson Forest District VA Poulin & Associates Ltd. – March, 2004
probability of use. By ranking that measure it is then possible to establish categories ofrisk such as Nil, Low-Nil, Moderate or High probability for fish occurring at any given site.In the field study, sites ranked Nil or Low-Nil are defined as those lacking adequatehabitat to support sport fish or be reasonably expected not to support fish. They arecandidates for S5 or S6 stream classification and management practice. Streams rankedModerate are those where sufficient habitat is present that it is not possible to determinefish presence without fish sampling. Such sites would require a traditional fish streamsurvey or defaulted to fish bearing in the absence of such a survey. Sites classified asHigh contain sufficient amounts of high quality habitat to virtually assure sport fish use. Asurvey is optional and likely done only in situations of questionable fish access.
3. PROJECT DESCRIPTION
The project contained the following elements:
1. Creation of a point score system that allowed the sum total of probabilities toprovide a risk rating of Nil, Low-Nil, Moderate, or High probability of use. Thisrequired decisions on which habitat criteria would most likely contribute to anability to score habitat. The 2002/2003 study provided draft criteria, butparameter intervals and weighted values were necessary for field-testing.
2. Development of a field data card for field data entry and tallying of point scores atsource. Scores are later checked with data entry tools using excel spreadsheets.
3. Field tests in the summer of 2003 and evaluation of the card at sample sites.4. Revisions of field card to reflect improved data entry, modified point scores for
weighted habitat values and new categories.5. Field data compilation and analysis leading to preparation of a final report.6. Inclusion of Stepwise Discriminant Statistical Analysis for evaluation of parameter
intervals, weighted values, and measure of statistical confidence.7. Data entry to FDIS to meet RIC standards.8. Final report
3.1 SCOPE OF WORKFifty-three individual streams are contained in the field survey. These include streamsand mainstem reaches located in the Fort Nelson River, Tsoo Creek, Odayin Creek andTorpid Creek watersheds (Appendix 1, Table 1). Sixty-five sites comprise this samplegroup. Field sampling commenced July 2003 and concluded September 2003.
Slocan selected the sample watersheds. Individual streams were choices made by thestudy team with sites selected primarily on access. The original project called for use oftrucks to access to sites, but after arriving for the first field episode heavy rain preventedtrucks on local roads. Slocan made the decision to have the sample team to work sharea helicopter with their layout people. This provided much broader access to sample sitesand allowed the team to work in areas close to operational blocks. The concept wasgood, but down time during the first sample week was high due to competing use of the

Page: 3
Field Classification (Poulin) for Fort Nelson Forest District VA Poulin & Associates Ltd. – March, 2004
machine. This made for an additional decision by Slocan to enable use of a helicopterfor the remaining field sampling periods (August and September).
Table 1. Watersheds containing streams sampled in the Fort Nelson Forest District, 2004.
Watershed Watershed Code No. Stream Sampled No. Sites Sampled
Fort Nelson River 212-444300 17 19Odayin Creek 210-364400-38000 13 15Torpid Creek 210-364400-33700 10 13Tsoo Creek 212-208400 13 18
total 53 65
Habitat criteria established in the 2002/2003 study, formed the basis for the field model.The model required final selection of parameters, determination of range of usecategories, draft scores and ratings established. Data from the inventories conducted bySlocan provided the basis for the field determinations. The information came through theReconnaissance Fish and Fish Habitat Inventory Program of the Ministry of SustainableResource Management to ensure data used in the study met standards for qualityassurance. Nine databases made up the original data files (Table 2).
Table 2. FDIS databases used to derive habitat criteria for field model. All data provided byMinistry of Sustainable Resource Management.
Name Year Project Description Watershed
1 07-SAHT-1000000392-1998 1998 Sahtaneh 212-490500-01400
2 07-DUNE-100000001-1998 1998 Lower Dunedin - Torpid Creek 210-364400-00000
3 07-DUNE-000001225-1999 1999 Mackenzie - Obole Etane 212-000000-00000
4 07-DUNE-000001224-1999 1999 Mackenzie - Steamboat 212-580800-20200-0550
5 07-DUNE-000001223-1999 1999 Mackenzie - Unnamed Creek 210-371400-00000
6 07-SAHT-1000000001-1998 1999 Sahtaneh_Snake 212-490500-00000
7 4477 2000 Tuchodi-BT-Boat 212-580800-40300
8 3676 2000 EDI - Fort Nelson 212-580800-20200
9 2004 2001 Rasp, Auke EDI 212-580800-19500

Page: 4
Field Classification (Poulin) for Fort Nelson Forest District VA Poulin & Associates Ltd. – March, 2004
3.2 STUDY AREAThe area to which this operational model applies falls within the operating area of SlocanForest Products Ltd. in Northeast British Columbia. It is entirely within the Fort NelsonForest District. The area lies within the Great Plains and Northern and Central Plateaus,and Mountains physiographic regions of British Columbia (Meidinger and Pojar 1991).The plains occupy the principal operating area and consist of gentle rolling to flattopography except where incised by rivers and streams. Soils in the region includemineral soils derived from glacial drift including outwash gravels, sands, and finetextured silts and clays, and organic soils produced from prolonged periods of mossaccumulation resulting in deep accumulations of peat. Mean annual precipitation is 450mm (Meidinger and Pojar 1991). Most precipitation comes in the form of rain duringMay-September (300 mm). Peak stream flows often coincide with spring snowmelt, butmay occur in July when up to 30% of summer precipitation falls.
All sample sites in the analysis fall within the Boreal White and Black Spruce (BWBS)zone. This zone is one of British Columbia’s largest and covers the vast majority of theDistrict. The Alpine Tundra and Spruce-Willow-Birch Zones are present, but are in theextreme western portion of the District. The Alpine Tundra Zone contains no operationalforests and occupies the higher elevations of the Northern Rocky Mountains. The Zoneforms a westerly geographic boundary for the District and the headwaters of streamsdraining east to the Plains. The Spruce-Willow-Birch Zone is contiguous with the AlpineZone and occurs on moderate to high elevations. The Zone is transitional to the BWBS.
The Boreal White and Black Spruce (BWBS) biogeoclimatic zone dominates the regionby extending from the footslopes of the Northern Rocky Mountains east across thePlains to the Alberta Plateau. The zone is a mixture of ecosystems that include uplandforests on elevated hillslopes to vast poorly drained muskeg, nutrient rich swamps andfens in lowlands. The most common forest types are mixed-wood stands of tremblingaspen and white spruce and mixed stands of lodgepole pine and black spruce(anonymous, MOF). Wetter sites give rise to communities of dense black spruce andmoss. White spruce and balsam poplar (black cottonwood) occur in well-drained riverbottoms. Peatlands of bogs and nutrient-poor fens cover extensive parts of the area.Small, shallow lakes and open-water wetlands occur throughout the zone.
Winters in the BWBS are long and extremely cold. Summers are warm, but the growingseason short. Precipitation is the least of the northern biogeoclimatic zones. Most smallstreams that arise on well-drained hillslopes dry in summer. All but moderate to largestreams or streams fed by groundwater freeze solid to the bottom in winter. Wildfires arefrequent, often intense enough to kill most trees over large areas. Riparian plantcommunities adjacent to streams include successional forests occupied by plantsadapted to recolonizing burned over habitats. The frequency of burning is so great thatthat the landscape is a mosaic of stands of various types and ages (anonymous, MOF).
3.3 FISH SPECIESSport fish documented by inventory sampling that occur in the study area include: arcticgrayling, bull trout, mountain whitefish, lake whitefish, walleye, northern pike and burbot.There are no identified or endangered fish species or regionally important fish species

Page: 5
Field Classification (Poulin) for Fort Nelson Forest District VA Poulin & Associates Ltd. – March, 2004
present in the study area with the exception of bull trout, which is designated as avulnerable or Blue Listed species, but is otherwise included as a sport fish.
Nearly 70% of the sport fish sampled in the Fort Nelson Forest District are arctic grayling(Poulin 2003). Their distribution is wide spread. They occur in streams of every sizeranging from rivers to small streams. No other sport fish occur in streams or habitatsfound in current operational areas not occupied by grayling (Figure 1). Lake whitefish,walleye, northern pike and to a lesser extent burbot, mountain whitefish and bull troutmade use of mainstem streams and rivers larger than 10 m wide. These habitats are notat risk of exclusion from a stream classification system created to identify streamshaving low – moderate habitat capability. For this reason, the model relies on arcticgrayling as the target species. As operations extend west bull trout will become animportant species requiring amendment to the current strategy.
Any habitat model that predicts the probability of use of a particular fish species requiresthe user understand the life history of that target species. For additional backgroundobtain a copy of the report prepared by Ford et al., for DFO 1995, “Review of the lifehistory and habitat requirements of sport fish that inhabit streams in the northeast”.
3.3.1 Arctic grayling (Thymallus arcticus)Lakes and streams in drainages that flow toward the Arctic Ocean contain arctic graylingincluding the Peace and Laird Rivers and their tributaries. Ford et al. (1995) showgrayling present in all major watersheds draining the Fort Nelson Forest District exceptHay River. Grayling exhibit two life history patterns – those that reside in lakes and thosethat reside in streams. Lake resident grayling use inlet or outlet streams for spawningand rearing. Grayling that originated from larger streams or rivers migrate into smallertributaries to spawn and rear (Scott and Crossman 1973). The latter pattern is the onethat gives rise to grayling use of forest streams.
Spawning and MigrationGrayling spawn in spring shortly after ice out. Most evidence shows adult grayling do notremain in spawning streams long. They usually spawn when water temperatures reach4˚ C and return to the larger streams and tributaries from which they came within weeksof entry. Juvenile grayling exhibit much the same migratory behavior as the adults, butsome remain in natal streams to rear. In one of the few studies of its type, a weir study inAlaska showed the majority of juvenile grayling entering a spawning stream left thestream within 2-3 weeks of the adults (Craig and Poulin, 1975). The remaining juvenilesremained in the stream until the onset of freeze-up. Grayling spawn over gravel or rockystream bottoms. Their eggs are slightly adhesive and broadcast spawned over thebottom of the stream (McPhail and Lindsey 1970). They do not dig a nest, making theeggs highly vulnerable to sedimentation and scour. It helps explain their preference forstable streams with clear flowing water and substrates relatively free of sand and silt. InFord et al., 1995, they report spawning in streams with up to 15-20% sand in theirsubstrates. This study found grayling in only 2 streams out of 33 sites where fines aredominant. The preferred substrate as indicated in the 2003 samples are gravel followedby boulders and cobbles.

Figure 1. Arctic grayling, Fort Nelson Forest District.
VAP/2003
Arctic grayling as typically found in streams within the Fort Nelson ForestDistrict. Grayling exceed the range of use exhibited by other sport fish inoperational areas, enabling themto act as target species for this stream classification procedure. No othersport fish occurred at sites sampledin 2003. Grayling account for 68% of sport fish in inventories. Bull trout andMountain whitefish make up 20% of theinventory sample, but did not occur inin streams less than 5 m wide. Thesespecies will become more important as operations extend westerly in the District.
Upper right: maturating male grayling captured at Odayin Creek (OT-2). At225 mm this fish had not previouslyspawned, but sufficiently developed tospawn in 2005. The largest graylingcaptured in the field study was 248 mmand a non-spawner. Middle right:182 mm, immature, female grayling from upper Tsoo Creek Mainstem. Lowerright: one of many juvenile graylingcaptured in the first reach of a small tributary stream (2.5 m wide) to lower Tsoo Creek (TST-4).

Page: 7
Field Classification (Poulin) for Fort Nelson Forest District VA Poulin & Associates Ltd. – March, 2004
Grayling eggs hatch within 8 to 22 days depending on stream temperature (Ford et al.,1995) placing them in streams soon after spawning. Unlike the adults and largerjuveniles, fry remain in natal streams to rear and are therefore an important indicator ofstream usage when sampled following hatching.
Habitat PreferencesGrayling prefer streams with abundant pools, glides (slower deeper water) and riffles(faster shallower water). Pools are the preferred instream habitat of yearling and largergrayling. They provide slower water velocities and deeper cover than riffles. Rifflesprovide migratory corridors for grayling, but they seldom use them for rearing (in Ford etal., 1995). Stuart (1979) found fry showed a strong preference for shallow silt free gravelriffles in side channels and tributary mainstems. Silt-free environments are not a luxuryenjoyed by grayling in the Fort Nelson area. Over half the boulder-dominated sitescontaining grayling in 2003 had fines as the subdominant substrate. Six out of 9 gravel-dominated sites had fines as the subdominant substrate. However, fines do limit graylinguse in area streams. As noted above, only two sites out of 33 where fines are thedominant substrate contained grayling.
Stream gradient and water velocity are preferences that limit the use of area streams bygrayling and thus an important indicator of stream use. Gradients preferred by graylingare low, but as seen in this study they will attempt to pass through some relatively steepsections of streams. The steepest site containing grayling in the 2003 samples had anaverage gradient of 10.2%. One point measurement within that sample reach measured15%. The habitat was step-pool and the fish blocked from further upstream movementby a log step barrier. All remaining average gradients containing grayling in the 2003samples are ≤5%.
Studies report grayling generally occupy point source water velocities of 0.21 to 0.8meters per second (in Ford et al.,). Dane (1978) gave the sustained swimming speed(that which can be maintained for up to 10 minutes) at 0.8 meters per second and burstspeed (that which can be maintained for 60 seconds) 2.1 – 4.3 meter per second(m/sec). Using swimming performance information from Hunter and Mayor (1986) andAlaska data, Mac McLean, ADF&G (personal communication), indicate a burst speed ofup to 5.44 m/sec is possible by grayling.
Food and GrowthGrayling are omnivorous, meaning they eat just about anything they can fit in theirmouths. They eat aquatic and terrestrial insects, small fish, eggs and crustaceans(clams, snails, amphipods). Average growth rates are about 60-80 mm per year withgrowth decreasing with age (Craig and Poulin 1975). Rate of growth is faster inpopulations that are more southerly. The short growing season and cooler temperaturesof the north slow growth. Grayling typically mature between the ages of 4-6 years innorthern British Columbia and generally at an average size of 270 – 300 mm (in Ford etal., 1995).

Page: 8
Field Classification (Poulin) for Fort Nelson Forest District VA Poulin & Associates Ltd. – March, 2004
4. METHODS
4.1 SAMPLINGField sampling followed the methodology outlined in the Reconnaissance (1:20,000) Fishand Fish Habitat Inventory Standards and Procedures (BC Ministry of Fisheries 1998)for all relevant parameters. Parameters measured included: stream width, wetted width,riffle crest depth, channel depth (also referred to as Wb-bankfull depth), pool depth,residual pool depth and stream gradient. Qualitative determinations followed RIC forparameters including: morphology, percent riffle-pool, bed material, stream pattern, andconfinement. Substrate size included D95 and D. Flow stage and cover were estimates.Crown closure was the only measurement that varied from RIC standards. Crownclosure as used in forestry is that closure created by layer 1a and 1b trees. Thismeasure provides a more accurate description of the riparian stand when combined witha forest cover label and became the procedure adopted. Forest cover labels followedstandard forestry nomenclature e.g. MFc/SBl (mature forest conifer with an overstory ofspruce and balsam). Stream order is not a RIC field measurement nor is it availablefrom the inventory without without extensive work. Stream order was determined in the field using the operational maps provided by Slocan.
4.2 FIELD MODEL AND TESTINGThe classification protocol required a field card for data entry and a method by whichfield measurements could derive a single risk rating leading to a determination of streamclass or a requirement of a fisheries survey. The model had to be applicable for use byforest technicians and work effectively as an operational screening tool which wassufficiently conservative as to allow foresters to safely risk manage streams. Four ratingsestablished the basis for levels of “probability of use”. These include Nil, Low-Nil,Moderate, and High. Nil captures streams that lack adequate habitat to support fish.These streams make up a high percentage of streams encountered by forest techniciansin operational areas. Low-Nil are streams where elements of habitat are lacking, andprobability of use low. It recognizes that there is a potential across a large number ofsuch streams to encounter a sport fish, but the chance is sufficiently rare as to allowmanagement as non-fish bearing waters. Moderate implies sufficient habitat is presentas to require a fisheries survey. In the absence of such a survey, the stream is defaultedto fish bearing. High indicates an abundance of preferred habitat for the target species.Fish presence assured unless the stream is located above an impasse or barrier and theupstream reaches lack perennial habitat. Each parameter measured in the field wasdivided into categories of quality of habitat and points assigned for each categoryaccording to its estimated value and weight in predicting the probability of fish use. Thesum of point scores for all parameters provided a single number estimating theprobability of use.
4.2.1 Model componentsThe parameters and weighted values used to derive the field-tested ratings came froman interpretive analysis of the data compiled in the 2002/2003 project. The analysis wasqualitative and completed in Excel by sorting the respective parameters and usinggraphs to depict the frequency distribution of use across the range of that parameter for

Page: 9
Field Classification (Poulin) for Fort Nelson Forest District VA Poulin & Associates Ltd. – March, 2004
sites with and without fish. Figure 2 provides an example of the data using stream width.The frequency at which fish occurred at or were absent from sample sites made it topossible to estimate thresholds of probability of use and to ascribe weighted values forany interval of that parameter. The sum total of weighted values gave a measure of“probability of use”.
Stream Width
0
5
10
15
20
25
30
<1 1-<2 2-<3 3-<4 4-<5 5-<6 6-<7 7-<8 8-<9 9-<10
10-<11
11-<12
12-<13
13-<14
14-<15
15-<20
20-225
Stream Width in 1 m Intervals
Nu
mb
er o
f F
ish
All Sport FishGrayling
Stream Width
0
20
40
60
80
100
120
140
160
Stream Width in intervals (m)
Nu
mb
er o
f S
ites
All Sport FishGRNon-Sport Fish
All Sport Fish 0 6 5 3 0 11 3 4 5 3 11 5 2 6 5 14 25
GR 0 6 5 3 0 10 3 4 5 3 10 5 2 5 2 12 14
Non-Sport Fish 148 78 53 24 21 14 9 8 8 3 6 8 4 1 2 4 14
<1 1-<2 2-<3 3-<4 4-<5 5-<6 6-<7 7-<8 8-<9 9-<10
10-<11
11-<12
12-<13
13-<14
14-<15
15-<20
20-225
Figure 2. Upper: Average stream width at inventory sites containing sport fish and arctic grayling(GR) in the Fort Nelson Forest District. Lower: Average stream width showing comparison withnon-sport fish sites and sites containing sport fish. Using similar outputs for each parametercategories with weighted values predicted probability of use. Field categories for width were splitin the field test as follows: <1 m (0 points), 1-≤2 (0.5 points), >2-≤3 (1 point), >3-≤5 (6 points) and>5 (10 points).

Page: 10
Field Classification (Poulin) for Fort Nelson Forest District VA Poulin & Associates Ltd. – March, 2004
The procedure provided the basis for the draft scoring scheme and enabled testing ofthe method in the field. The original scores did not involve statistics, but rather anintuitive process using the frequency display to determine logical breaks in the data,which equated to thresholds in use. Statistical analysis of the field data providedimprovement in the mathematical construct of the scoring scheme resulting in improvedaccuracy in identifying streams with or without potential for fish presence (4.3.2Multivariate Analyses).
Point scores ascribed to intervals of each parameter provide the framework for scoringindividual sites. Stream order, stream width, channel gradient, channel depth, residualpool depth, morphology, bed materials, channel pattern, confinement and crown closuredetermined the total point score for a site. Figure 2 provides an example site showinghow field data result in a total point score and rating. The categories of Nil, Low-Nil,Moderate and High – probability of use, established the ratings. The draft scoresestablished using the card provided the basis for field-testing. It was not possible withoutstatistical analysis to determine what values would work prior to commencement of thefield season. That applied as well to the individual weighted values given to eachinterval of parameter.
4.3 DATA ANALYSIS4.3.1 DatabasesDatabases used to establish the field model came from inventories provided to theproject by Lynn Blouw, Inventory Specialist, Aquatic Information Branch, Ministry ofSustainable Resource Management (MSRM), Prince George, in 2003 (Table 2). Theyinclude nine inventories conducted in the Fort Nelson Forest District. All the informationmet the standards for quality assurance established by the Ministry. The databasesrequired translation to Version 7.6 data structure and consolidation into a single MSAccess database for reporting and query. MSRM translated the older versions of theFDIS databases (those collected to 1997 standards) to the FDIS version 7.6 datastructure. Not all fish and site records were translatable due to issues with the databasestructure. The analysis ignored these orphaned records. All fish summary records werelinked to the sites through the use of watershed code, reach and site identifiers and/orILP, ILP map, reach and site number. Fish summary records not linked to site recordswere not included in the analysis.
4.3.2 FDIS EntryAll data collected by the field project entered the Field Data Information System (FDIS)for quality assurance, repository and public use.
4.3.3 Multivariate AnalysesThe database used for statistical exploration of the scoring scheme included the 2003field data, draft scores assigned to the habitat parameters and the ratings given to eachsite for probability of use based on the draft scores. Stepwise Discriminant Analysis (DA)on the field data enabled a statistical determination of the parameters most important indetermining ratings for Nil, Low-Nil, Moderate or High probability of use. The analysisestimated the approximate weight of each variable based on its statistical coefficient inthe dominant canonical variable determined by Discriminant Analysis.

STREAM NAME (gaz) FTN-11 Fort Nelson River (local)
SITE # 1 REACH # WATERSHED CODE
NID MAP # WP 292 UTM E 0526138 UTM N 6527703 Elev 278 m
DATE 09/12/03 TIME 0929 AGENCY CREW VAP/DW
C Width Wetted W Riffle C C Depth Pool D Res. Pool G %
1.4 0.8 .02 .17 .14 .12 10.5�
1.6 0.6 .05 .15 .13 .08 10.0
1.5 1.4 .05 .13 .13 .08 10.0
1.4 0.6 .06 .16 .17 .11 12.5�
1.5 1.0 .05 .16 .13 .08 12.0
2.1 1.5 .05 .15 .14 .09 12.0
Score: 7 (Nil Rating), Sample Result:
FTN-11 - no fish captured, habitat poorfor GR due to lack of residual pool,shallow channel depth, high gradient and abundant fines
DETERMINATION OF FPC STREAM or REACH - Working Draft for Ft. Nelson Forest District Only
The FPC defines a stream as a "reach", flowing on a perennial or seasonal basis having a continuous channel bed, whether or not the bed or banks of the reach are obscured by overhanging or bridging vegetation or soil. The bed must be scoured by water, or contain deposits of mineral alluvium. The channel may be perennial, ephemeral, or intermittent. Channel beds that are known to contain fish, flow directly into a fish stream or lake that is known to contain fish, or flows directly into a domestic water intake have no minimum length. All other channel beds must be ³100 m to be a reach . Watercourses with organic beds with no mineral alluvium, or scour down to mineral soil, are not included under the definition of a stream.
Non-classified Drainage (NCD's) are watercourses that do not satisfy the definition of a reach
VESSEL PRESENT Y N-NCD CHANNEL BED SCOURED TO MINERAL SOIL OR WITH ALLUVIUM Y N-ORGANIC BED - NCD
IF YES, obtain traverse data. WHERE channel bed is ³100 m, w atercourse is a reach (see exceptions above). Use field data to complete following:
PR
OB
AB
ILIT
Y O
F U
SE
RA
TIN
GS
STREAM CLASS DETERMINATION IN ABSENCE OF FISH SURVEY - STEP 4 (POULIN) for Fort Nelson Forest District only
1 0 2 1 3 4 3 Mainstem 6 ³4 10 1-2 FP 10 1-2 VF 2 1-3 ²4% 6 1-3 >Impass 0
PointsOrder
² 2 0 >2 >2-3 2 ³3-5 6 >5 10
PointsWidth
GR flat 2 0.5-<3 10 ³3-4 8 ³4-8 4 ³8-10.5 1 >10.5 -10
PointsGradient
<0.2 0 0.2-<0.3 1 0.3-<0.7 3 ³0.7 4
PointsCD*
<0.15 0 0.15-<0.3 2 ³0.3 6 .
PointsResPool
Points
Points
Points
Morphology
Bed
Pattern
Nil <20 S6/S5 Low-nil 20-<30 S6/S5 Moderate 30-<50 Survey High ²50 S1-S4
Risk of Use by Sport Fish*Impasses not present*
Example only, total points not yet established
Rating Total Points Class
Total points to establish estimated use by sport fish for each reach assessed. Values provided are for Ft. Nelson Forest District only. Habitat use varies with species and area. Non-sport fish streams have low values due to absence of usable or preferred habitat.
Where habitat is present within the usable range (moderate to high risk) undertake a fisheries survey or default stream class to a fish stream. Barriers impede upstream passage of fish. Assess barriers for passage. Undertake a fisheries inventory or default stream class to a fish stream if perennial habitat on moderate to high risk streams occurs above a barrier. Streams upstream of barriers with Nil and Low-nil risk of use and those that simultaneously dry or freeze solid in winter are classified S6/S5. All streams with an average gradient ³20% may be deem ed S6/S5.
large channel 1riffle-pool 5cascade-pool 3step-pool 1
straight 1sinuous 3irregular 3meander 2
fines/organic 0gravel 6cobble 10boulder 6rock 0
Points
Points
Bed
Crown C0% 41-20% 621-40% 241-70% 071-90% 0>90% 0
E 0C 2FC 3OC 3UC 2
1 2 3 3m ³4 1-3 > impasse
Turbid Murky Low Clear
LC RP CP SP
Type: Rock Falls Log/Root Step Gradient/chute-bedrock-channel BeavD Dewatering Overland
P1R9 P2R8 P3R7 P4R6 P5R5 P6R4
CHANNEL
Mainstem Direct 1-2 FP 1-2 VF 1-3 ² 4%
MORPHOLOGY
IMPASSE
COMMENTS small stream typical of sites found on side hills, example of reaches often encountered by forest technicians, steep, first order,
narrow channel widths with shallow depths and lacking residual pool
Photo No. 1739 (site photo)
BED MATERIAL Dominant: O F G C B R Subdominant: O F G C B R
D95 (cm) 30 D (cm) 9
PATTERN TM ME IM IR SI ST
CONFINEMENT EN CO FC OC UN NA
WATER CLARITY
RIPARIAN VEG. IN SH PS YF MF
FOREST COVER: MFdAcAtEPS
Type
Height (H)
Pool Depth (PD)
Riffle Crest (RC)
CD (Q1)
WSEL=plunge pool depth at time of survey
Type
Height (H)
Pool Depth (PD)
Riffle Crest (RC)
CD (Q1)
Type
Slope (%)
Length (m)
Dry Low >0-30% Wb Med 30-90% Wb High >90% Wb
Amount D SLarge woody debris (LWD)Small woody debris (SWD)Boulder (B)Undercuts (UT)Deep pool (DP)Overstream vegetation (OV)Instream vegetation (IV)N-none,T-trace (3-5%),M-moderate (5-20%),A-abundant(>20% of site),D-dominant,S-subdominant
ST
RE
AM
CO
VE
RMODIFIED SITE CARD FOR STEP 3, FIELD STREAM CLASSIFICATION (POULIN), V08/03, USE BACK FOR DETERMINATION OF FPC STREAM
Flow Stage
Crown Closure 0 1-20 21-40 41-70 71-90 >90
RATING
STREAM CLASS
TOTAL SCORE
% 30
Bank Height 0.7 m
TTTNNMN
D
NilGradient
18%
confluence
0
0
0
2��3
�1
0
��6
��
2
����
1
8
Surveyed 100 m El results:
Nil
Figure 3. Version 3 field card showing data fields, data entryand habitat model with data categories for determining streamclass and requirement for a fisheries survey.
STREAM ORDER
CO
VE
R

Page: 12
Field Classification (Poulin) for Fort Nelson Forest District VA Poulin & Associates Ltd. – March, 2004
Acknowledging that the variables are partially interdependent, and the data set small(n=65 reaches), the coefficients are not precise calculations, but rather best indicators ofrelative weight (importance). Discriminant Analysis also explored the original codescores to estimate the amount of distinguishing information possibly lost by reducing thefield measurements to scores. The result was a redesigned scoring system to whichDiscriminant Analysis further tested the ability of the new scores to improve accuracy inassigning probability of use categories.
For the variables selected by the stepwise analysis, the weights for each variableestablished the maximum number of points spread between the best (highest score) andworst (lowest score) for each variable. For example, if gradient determinedapproximately 50% of the 1st canonical variable then the range of stream gradientswould be coded in a way that the highest (best) gradient category would receive 50points more than the worst, and the worst might be assigned negative points ifconditions at that gradient cannot be tolerated by sports fish. Variables not selected bythe stepwise analysis have low (statistical) weight but were kept in the scoring schemebecause of their potential to flag unfavorable conditions for fish in a stream that mightscore well in the other variables.
There is no tested and proven statistical method to design a scoring scheme such asthis. The data and statistical methods support an inherently empirical approach.When the scoring system was adjusted this way, performance on the inventory streamswas back-tested. The accuracy of correctly distinguishing Nil, Low-Nil, Moderate andHigh streams was the measure of successful performance.
5. RESULTS AND DISCUSSIONThe 2002/2003 study concluded with a draft stream classification procedure consistingof four steps. Steps 1 and 2 lead to the determination of preliminary streamclassifications over an operational area based on stream order. They are followed bysteps 3 and 4 and provide the field verification of the preliminary classifications. Steps 1and 2 are not mandatory. It is possible to go directly to the field using the model to makea determination. This is what happened in this study. The four steps are:
Step One – Preliminary Mapping: a base map is prepared that contains all mappedstreams identified on 1:20 000 TRIM. Using the base map, streams segments areascribed a stream order beginning in the headwaters and continuing as far downstreamas needed to cover the area of interest.
Step Two – Gather Resource Information: including available information on thedistribution and size of sport fish in the subject watershed so that individuals areinformed of what species of fish may be present and their known distribution. They thenapply the following assumptions to determine a preliminary classification:
1. All mainstem habitats and primary tributaries containing third or greater orderstreams contain sport fish of a suspected species.

Page: 13
Field Classification (Poulin) for Fort Nelson Forest District VA Poulin & Associates Ltd. – March, 2004
2. Third and second order streams tributary to mainstem reaches or their primarytributaries may contain fish.
3. All first order TRIM reaches with mapped lengths less than 250 m contain novisible channel and are not streams.
4. All first order reaches or first and second order reaches with a sum total reachlength of less than 1.5 km are not fish bearing unless the reach comprises aportion of an active floodplain, or is situated on an accessible valley flatimmediately adjacent to a mainstem reach or primary tributary.
5. All areas upstream of known barriers on any first, second or third order tributaryis non-fish bearing unless lake headed.
Field confirmation of the respective determinations is required. Proceed as in Step 3.
Step Three – Field Survey/Map Confirmation: this is the primary content of theprocedure. It generates the information necessary to determine probability of use. Step 1is not essential and can be done in the field provided a map containing all TRIM streamsis available to determine the correct stream order of the reach being measured. Where apreliminary map is available, this step confirms or denies the preliminary map-basedclassifications. It is essential people have an understanding of the species of fish towhich the measurements apply prior to Step 3. Standard inventory methods apply withrespect to the parameters measured.
Step Four – Finalize Stream Classes/Revise Map: the preliminary classifications areaccepted or revised using the criteria provided or if classifications are determined for thefirst time in the field the outcome is as determined using the field model. For qualityassurance, all field determinations should enter an office-based spreadsheet to confirmfield calculations. The field cards provide the support backup in the event of acertification audit or other issue.
5.1 HABITAT CARD AND PROBABILITY OF USEThe classification protocol required a field card for data entry and a method (model) bywhich the habitat criteria could derive a single use rating leading to a determination ofstream class or the requirement of a fisheries survey.
5.1.1 Field CardThree versions of the field card resulted from the fieldwork. Version 1 originated from astandard RIC card. The objective was to provide similar data entry fields as those usedby RIC, but limited to only that information necessary to derive the point score requiredfor determining probability of use. Card testing during the first and second field episodesuggested several modifications to the original card. This resulted in a third version usedduring the last field trial in September (Figure 3). The stepwise Discriminant Analysismodified the categories and weighted habitat scores resulting in a more statisticallybalanced scoring. This resulted in a fourth card recommended for the 2004 field season(see Section 5.3).
The field card contains all the data fields necessary to derive a point score of probabilityof use. Easily annotated in the field, the card has sufficient space to accommodate thenecessary measurements. The most significant feature of the card is a reduced number

Page: 14
Field Classification (Poulin) for Fort Nelson Forest District VA Poulin & Associates Ltd. – March, 2004
Table 3. Information contained on field data card.
Location Morphologyname/ site location/ reach large channel
watershed code riffle-pool
UTM coordinates cascade-pool
date/time/crew step-pool
Stream Order dominant bed material
1, 2, 3, 3m, ≥4, 200 m rule subdominant bed material
Channel D95
stream width D
wetted width riffle/pool ratio
riffle crest depth Riparian Vegetationchannel depth crown closure
pool depth Stage
residual pool depth tree species
gradient CoverWater Clarity type and amount
turbid/murky/low/clear Impasses-BarriersFlow Stage type
low/moderate/high height
leap pool depth
channel depth
of data fields compared to a standard RIC card. Only information necessary to derive astream rating and site description is collected.
5.1.1.1 Data ContentTable 3 lists the information contained on the field card. The data require bothquantitative and qualitative determinations. All determinations and measurements are asspecified in Reconnaissance (1:20,000) Fish and Fish Habitat Inventory Standards andProcedures (BC Ministry of Fisheries 1998) and other FPC guidebooks.
Changes in the field card resulted in minor inconsistencies in data collection between thefirst and second field surveys. The original data card followed the RIC standard card withrespect to the data fields for channel width, wetted width, residual pool depth andchannel depth. RIC cards provide space for only four measurements of channel depthand no space provided for measurements of pool depth and riffle-crest depth, which areneeded to calculate residual pool depth. This requires a person to scratch note thesemeasurements on the card or do the calculations in their heads. Version 2 of the cardcorrected this problem by adding the appropriate columns for pool depth and riffle-crestdepth and placed them such that data entry flowed in a logical manner. Those changesallowed space for an additional two measurements of channel depth plus standardizedthe number of measurements to six for all measured channel parameters.

Page: 15
Field Classification (Poulin) for Fort Nelson Forest District VA Poulin & Associates Ltd. – March, 2004
Content - LocationGPS provided each site with a reference location. Reception varied depending onlocation, but generally good. Waypoints gave a means to confirm mapped locations, andidentify start and stop of surveys.
Content - Channel measurementsMeasurements of stream width, wetted width, riffle-crest depth, channel depth, pooldepth, residual pool depth and gradient are required for calculating probability of use.The measurements allow quantification of the amount and quality of habitat present.With the exception of stream width and gradient, they are not common measurementsused by forest technicians, but easily learned.
Content - Stream orderStream order is the relative position in which a stream channel or reach is present in awatershed. The first streams that arise in a watershed are numbered 1. The segment ofstream below the point where two first order channels come together is numbered 2.Order increases sequentially downstream as frequently as two reaches of the sameorder come together. Stream Order is map scale dependent, but operational maps nowuse TRIM to plot streams allowing a stream order determination to be relativelystandardized. The field project did not have the benefit of site selection prior to thefieldwork. Stream order determinations resulted from examination of the field maps andground-truthed where necessary to reflect actual conditions.
Content - Channel morphologyChannel morphology is the study of channel form and structure. Measurements anddeterminations of morphology help to describe channel characteristics used by fish. Withthe exception of determining the size of bed material, all of the determinations withrespect to morphology are qualitative. Only pool/riffle ratio applies to the risk rating. Theremaining determinations provide descriptive support to the site measurements.
Content - Riparian vegetationStand composition, stage and crown closure provide a description of the riparian standthat borders a site. The stand description refers to the vegetation plant communitypresent within the riparian management area (RMA) and given as a forest cover labelwhich includes the vegetation stage, and tree species composition.
Content - ImpassesBarriers to fish passage have a significant influence on the use of streams by fish.Passage is a function of the type of impasse, height of obstruction and water depth atthe time of migration. Channel measurements of these physical attributes allow forassessment of passage.
5.1.1.2 Probability of Use RatingsEach field site obtained a rating of Nil, Low-Nil, Moderate or High probability of use bysumming the total point scores for each parameter as in Figure 2. Sample results madefor several changes in the ratings and categories during the field project. These werefurther modified using the Discriminant Analysis.

Page: 16
Field Classification (Poulin) for Fort Nelson Forest District VA Poulin & Associates Ltd. – March, 2004
Stream orderMapped results of inventories completed in watersheds such as Obole and Etane Creekprovided the basis for selecting stream order as one of the predictors of probability ofuse. Only one Order 2 reach in Obole Creek contained sport fish. However, therelationship is not black and white. Some inventories show that arctic grayling will usefirst and second order streams where these streams are directly tributary to a mainstemchannel. Where this occurs it is usually within the first 100 to 200 m of that stream.The frequency at which this occurs is very low – only a few sites recorded. However, toaccount for this, several subcategories of stream order warranted inclusion in the model.All of these subcategories ultimately amalgamated into a single category presentlyreferred to as the “200 meter rule”. This rule ascribes points to a first or second orderreach directly tributary to a mainstem channel whose stream order is 3M (M-mainstem)or higher provided the 200 m segment contains a stream gradient within a specifiedrange.
Field results suggested a division in the Order 3 category as well. The change came asresult of sampling in the Dawson Creek Forest District where one-third of Order 3channels sampled in field tests contained sport fish, but if the Order 3 channel was amainstem reach the occurrence of fish was greater. Two out of 3 Order 3 segments inthat study contained sport fish (66%) compared to 27% of Order 3 segments comprisingtributary reaches. This resulted in the category 3M and given 2 additional points in thescoring matrix.
Stream widthThe probability of use by grayling diminishes with decreasing stream size. The smalleststream containing grayling in the inventory is 1.1 m wide. This stream is one of sixstreams out of 266 sites ≤2.0 m wide and sampled for fish. The next channel width inwhich grayling appear in the inventory is 2.4 m. The smallest streams containing graylingin the field study were 2.03 and 2.1 m. A third site at 2.5 m contained grayling, but thenext largest stream was 3.5 m. Grayling do not show with regularity in the inventory untilstream width is 5.0 or greater in size. However, this study found grayling at 45% of thesites sampled with widths less than 5 m in width. Sixty-six percent of those are ≤ 3.5 m.Five width categories established scores in the field model (Figure 2).
Stream gradientGradient has long been a predictor of fish use. The FPC allows streams greater than20% gradient defaulted to non-fish bearing. Early versions of coastal fish-forestryguidelines based stream classification and forest practices on stream gradient. Datacontained in the inventory showed grayling use diminished with gradient and ultimatelyprecluded their use. In the 20 field sites containing grayling, 19 had mean gradients of≤5%. Only one site had a larger mean gradient of 10%. Point measurements within thatsample reach contained step-pools with increments of channel slope up to 16%. The fishcaptured in that stream was in a low-velocity plunge pool beneath an impasse. Theresults show both the preference by grayling to occupy low to moderate gradients, aswell their capability to pass through steeper sections of streams to access upstreamhabitats. The highest recorded average gradient for grayling in the inventories is 14.5%.The single fish in the field study represents 5% of the field samples with grayling. In theinventory 3 out of 89 grayling sites had gradients >5% for a frequency of 3.3%. Fivecategories allowed for gradient splits in the model (Figure 2).

Page: 17
Field Classification (Poulin) for Fort Nelson Forest District VA Poulin & Associates Ltd. – March, 2004
Channel depth (also bankfull depth)Inventory data reflect a strong trend in fish use with increasing channel depth. Only twosites in the inventory contain fish where channel depths are less than 0.3 m deep. Bycomparison, 28 sites had depths of 0.3 – <0.7 m, and 59 sites ≥0.7 m deep. The valuesgave the model three categories (Figure 2).
Residual pool depth (RD)Grayling show a strong preference for pools, by nearly always captured in pools ratherthan riffles. The inventory data show grayling occupying streams with shallow pools, butwhen compared to streams lacking grayling a very high number of non-fish bearingstreams have residual pools of <0.15 m. These data gave rise to three categories of usein the model (Figure 2).
MorphologyMorphology is a visual assessment of stream type and includes key descriptors ofhabitat used by fish. Four channel types describe streams used by grayling includinglarge channel (LC), riffle-pool (RP), cascade-pool (CP) and step-pool (SP). Eighty-fourpercent of streams containing grayling in the inventory occupied streams with riffle-poolmorphology. That percentage dropped to 55 in the field study due to a higher percentageof streams with grayling containing cascade-pool morphologies. Grayling are noticeablyabsent from steep streams, thus steep-pool morphologies rank low in use by grayling.Large channel morphologies also tend not used by grayling, but two sites out of 20 in thefield survey had large channel morphologies. The occurrence shows range of use, butnot preference. The inventory data reflect a similar outcome with only 8% of graylingsites having LC morphology. This lack of use helps to explain why grayling are almostalways absent from stream habitats situated upstream of large beaver dam complexes.Not only do beaver dams block passage but also their formation alters channelmorphology by converting riffle-pool habitats to impoundments or slow moving streamswith attendant changes in substrate from gravel to fines.
Other descriptors of morphology isolate components of habitat are bed material, pattern,and confinement. Grayling show a strong preference for gravel, cobble and boulderbedded streams and appear least in streams where fines are the dominant bed material.Fines dominate the streambeds of the two streams containing grayling in the fieldsurvey. These same streams are of large-channel morphology. In the inventory sample,the outcome is about the same – 8% of sites having grayling classified as LCmorphology and fines dominated the substrate at those sites. Channel pattern describesthe path of a channel in relation to a straight line. Eighty percent of graying sites in theinventory had sinuous to irregular morphology. Only 5% of inventory sites containedgrayling when channels are straight. This relationship is even stronger when non-fishstreams are considered. Ninety-three percent of non-fish bearing streams have straightchannel forms. All channels with straight channel patterns in the field study are devoid ofgrayling. Confinement is in the field model, but never considered a strong parameter.Scores for confinement are less than 1/3 rd of those for the primary indicators. Refer toFigure 2 for splits given to each of the parameters for morphology.

Page: 18
Field Classification (Poulin) for Fort Nelson Forest District VA Poulin & Associates Ltd. – March, 2004
Crown closureInventory data gave a strong relationship with grayling use and decreasing crownclosure. Ninety-four percent of sites containing grayling in the inventory occurred at siteswith less than 21% crown closure. This goes to 99% when categories of 21-40% areconsidered. Crown closure as measured by RIC is the vegetation that overhangs and“shades” a stream course. Reconciling this definition with crown closure as measured inforestry poised an interesting problem. Given nearly all streams sampled had lowamounts of overhanging cover as defined by RIC, the inventory result appeared to havelittle practicable application in predicting probability of use despite the apparent outcome.In an attempt to make better use of crown closure, crown closure as measured in thefield project became the closure provided by the riparian stand. Six categories providefor crown closure in the field model (Figure 2).
5.2 FIELD TESTSFifty-three streams sampled in 2003 provided 65 sites to test and validate the draftmodel (Table 4). Field tests included streams in the Fort Nelson River, Torpid Creek,Tsoo Creek and Odayin Creek watersheds. Site locations and scores are in Appendix 1.The maps provide a geographical reference to the point scores. Figure 3 illustratesseveral of the sample sites, showing stream conditions rated Nil to High.
Sampling found no sport fish at any site rated Nil or Low-Nil. This is significant outcomeas the primary intent of the model was to establish ratings that would isolate streamshaving low or nil risk of being fish bearing. It was important that the channels scored Nilor Low-Nil be devoid of fish as was the case. In the moderate category, 12 out of 27sites contained grayling for an occurrence of 44%. This was another strong confirmationof the field model. With 44% of the sites containing fish and the remaining absent ofsport fish there’s an element of conservative decision making implied in the sample.Given more streams in this category are absent of fish than occupied by fish theargument can be made that the field scores adequately captured those streamsrequiring a fisheries sample. The lowest total score with grayling was 31 points.
Sites scored high invariably contained fish. Only one of the nine high sites lacked fish.This site is TOT-6 Site 2. It is located in a tributary to Torpid Creek where grayling arepresent at another High site (TOT-6 Site 1) situated upstream. Both sites are locatedabove extensive wetlands containing a gauntlet of beaver dam complexes. Thepresence of grayling in the upper reach was unexpected owing to the extensivealteration of the stream channel in the lower valley by beaver and wetland development.However, this was not lost on the model and it accurately predicted the possibility of use.Its not known if the grayling sampled are residents or spawn from grayling that migratedthrough the lower valley and over the beaver dam complexes. If the latter is the case, itwould demonstrate an amazing performance by any sport fish to access upstreamhabitat. Over 4.0 k of wetlands and no less than 10 beaver dams occupies the lowervalley. A more plausible scenario is they originated from within the stream and thestream contains overwintering capability.
Results indicate that forest technicians using the field model can isolate a very largeproportion of non-fish bearing streams. Streams ranked Nil or Low-Nil in the field study

Table 4. Total scores and ratings for field sites sampled in the Fort Nelson Forest District in 2003. Refer to Figure 2 for an example of how individual site parameters derive a total score and rating. Ratings are as used in the field test. N-Nil, L-N-Low-Nil, M-Moderate, H-High, EF-electrofishing,NFC-no fish caught, GR-grayling; O-order, CW-channel width, CD-channel depth, RP-residual pool depth, G-gradient, M-morphologh, P-pattern, C-crown, CC-crown closure
O CW CD RP G M B P C CC Score Rating Sample Method Stream Site0 0 0 0 0 1 0 1 2 2 6 N NFC EF TST7 10 0 0 0 0 1 0 1 2 2 6 N NFC EF FNT-11 10 0 0 0 0 1 0 1 2 6 10 N NFC EF TST8 10 0 0 0 4 3 0 1 2 0 10 N NFC DRY FNT-6-2 10 0 0 0 4 3 0 1 2 2 12 N NFC EF TST12 11 0 0 2 1 1 0 3 2 2 12 N NFC EF OT4 10 0 0 0 0 1 6 1 2 2 12 N NFC DRY FNT-6-1 10 0 0 0 4 1 0 1 0 6 12 N NFC EF FNT-9-1 10 0 3 2 2 1 0 2 2 2 14 N NFC EF TST5 20 0 0 0 4 3 0 3 2 2 14 N NFC EF TST13 10 0 0 0 8 5 0 1 0 0 14 N NFC EF DT2 11 0 0 0 0 1 6 3 2 2 15 N NFC EF OT10-1 11 2 0 0 1 1 6 3 2 0 16 N NFC EF TST3 10 2 3 0 2 1 0 2 2 4 16 N NFC EF TST15 11 0 1 0 2 1 0 2 3 6 16 N NFC EF FNT-3 14 0 1 0 2 1 0 3 2 4 17 N NFC EF TOT2-1* 11 0 3 0 2 1 0 2 2 6 17 N NFC EF FNT-2 11 0 0 0 4 5 0 3 3 2 18 N NFC EF TOT3-1 16 2 1 0 2 1 0 2 2 2 18 N NFC EF TOT5 21 6 1 0 0 1 6 1 2 2 20 L-N NFC EF FNT-15 21 0 0 0 10 5 0 3 2 0 21 L-N NFC EF TST2 11 0 0 0 8 5 0 3 3 2 22 L-N NFC EF TST11 20 0 0 0 8 5 0 1 3 6 23 L-N NFC DRY TST9 14 2 1 0 1 1 6 3 3 2 23 L-N NFC EF OT1 11 2 1 0 4 3 6 3 2 2 24 L-N NFC EF FNT-12 11 0 0 0 10 5 0 3 2 6 27 L-N NFC EF FNT-1-2 11 2 1 0 4 3 6 3 2 6 28 L-N NFC EF TST-1 11 0 3 0 4 3 10 3 2 2 28 L-N NFC EF OT5 11 0 0 2 10 5 0 3 2 6 29 L-N NFC EF FNT-1-1 10 0 1 6 10 5 0 3 3 2 30 M NFC EF TOT4 11 0 1 2 10 5 0 3 2 6 30 M NFC EF TST6 24 2 1 2 8 3 0 3 2 6 31 M NFC EF OT6 11 6 1 2 4 3 6 3 3 2 31 M GR EF FNT-15 16 2 0 6 10 1 0 3 2 2 32 M NFC EF OT9 14 6 3 0 4 3 6 3 2 2 33 M GR EF FNT-10 11 2 0 0 8 5 6 3 3 6 34 M GR EF TST11 11 6 1 2 4 1 10 1 2 6 34 M NFC EF OT8-1 14 6 1 2 10 5 0 3 2 2 35 M NFC EF OT3 14 6 1 2 10 1 0 3 2 6 35 M GR EF OT7 14 6 1 0 4 3 6 3 3 6 36 M GR EF FNT-1 14 10 3 0 1 1 6 3 2 6 36 M GR EF FNT-14 14 6 3 2 10 1 0 2 3 6 37 M NFC EF TOT3 26 2 1 2 8 3 10 3 3 2 40 M GR EF TST4 1
10 6 1 2 10 1 0 2 2 6 40 M GR EF TOT1 16 2 0 0 10 5 6 3 3 6 41 M GR EF TST11 14 6 3 6 10 5 0 3 3 2 42 M NFC EF TOT1-1 14 6 0 0 10 5 10 3 3 2 43 M NFC EF TOT5 14 6 1 6 10 5 0 3 2 6 43 M NFC EF TST5 14 6 1 0 8 3 10 3 3 6 44 M NFC EF OT2 14 6 1 0 10 5 10 3 3 2 44 M NFC EF TOT3 14 10 1 6 8 3 6 3 2 2 45 M NFC EF FNT-14 24 6 1 2 10 5 6 3 3 6 46 M GR EF OT2 24 6 3 6 10 5 0 3 3 6 46 M NFC EF TOT2-2 14 10 3 2 4 3 10 3 2 6 47 M NFC EF DT1 14 10 3 2 8 3 6 3 3 6 48 M GR EF TST6 14 10 3 2 8 3 6 3 3 6 48 M GR EF FNT-9 1
10 10 3 6 10 5 0 3 3 2 52 H NFC EF TOT6 210 10 1 6 10 5 6 3 3 2 56 H GR EF TOT6 110 10 3 6 10 5 6 3 3 2 58 H GR EF TOT2 110 10 3 2 10 5 6 3 3 6 58 H GR EF FNT-5 110 10 1 6 10 5 6 3 2 6 59 H GR EF FNT-13 110 10 1 6 10 5 6 3 3 6 60 H GR EF TS1 110 10 3 6 10 5 6 3 3 6 62 H GR EF OT8 110 10 3 6 10 5 10 3 3 6 66 H GR EF OT8 210 10 3 6 10 5 10 3 3 6 66 H GR EF FNT-4 1
N L-N M H TotalTotal 18 11 27 9 65NFC 18 11 12 8 49Percent NFC 100 100 44 89 75
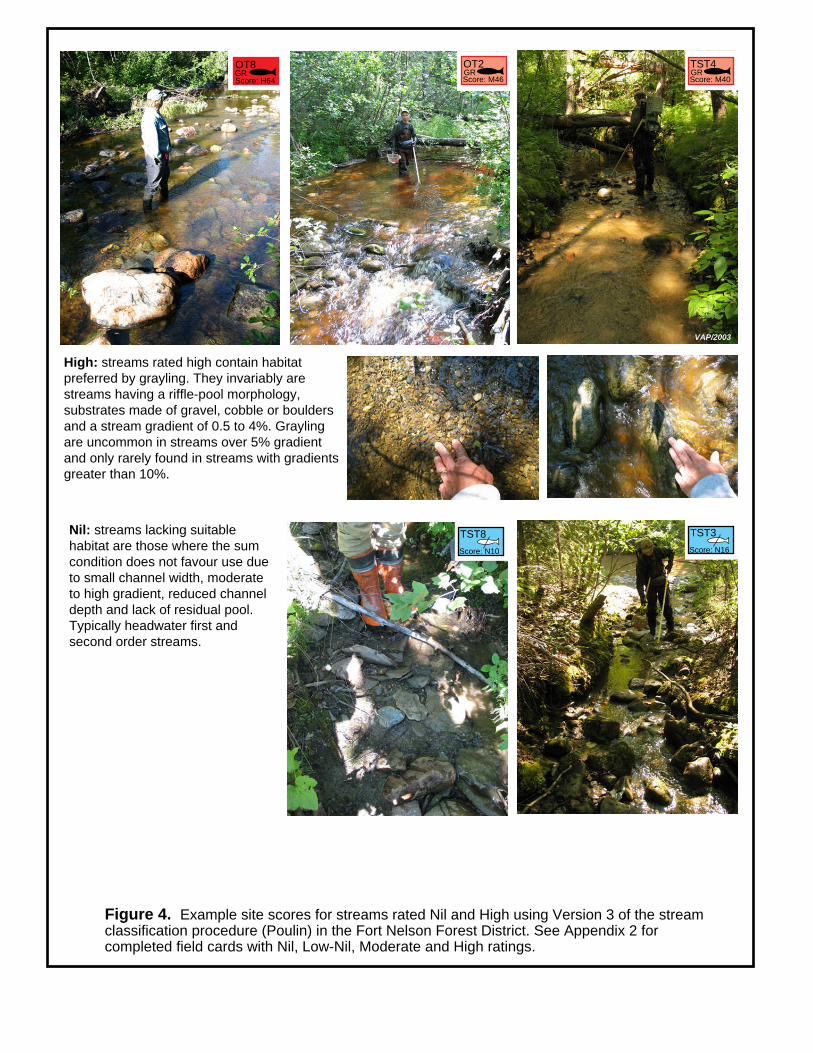
Figure 4. Example site scores for streams rated Nil and High using Version 3 of the stream classification procedure (Poulin) in the Fort Nelson Forest District. See Appendix 2 for completed field cards with Nil, Low-Nil, Moderate and High ratings.
High: streams rated high contain habitatpreferred by grayling. They invariably are streams having a riffle-pool morphology,substrates made of gravel, cobble or bouldersand a stream gradient of 0.5 to 4%. Graylingare uncommon in streams over 5% gradient and only rarely found in streams with gradientsgreater than 10%.
Nil: streams lacking suitablehabitat are those where the sum condition does not favour use due to small channel width, moderate to high gradient, reduced channel depth and lack of residual pool.Typically headwater first and second order streams.
GROT2Score: M46
GRTST4Score: M40
GROT8Score: H64
VAP/2003
TST3
Score: N16
TST8
Score: N10
Page: 21
Field Classification (Poulin) for Fort Nelson Forest District VA Poulin & Associates Ltd. – March, 2004
are often first and second order streams. They have channel widths of ≤3.2 m andgradients that from 0 to 16%. The majority is 1 to 7%. Nearly all lacked residual pools and they came in a variety of morphologies although straight channels tend to be mostcommon. They are usually confined and sometimes entrenched. These types ofchannels are by far the most common encountered by technicians within cut blocksmaking them most important to Slocan.
Streams ranked high are another important group. The model had little difficulty isolatingstreams with the best and most expected probability of use. This implies that streamsrated high need sampling only in special cases such as where sampling is necessary tocalibrate a fisheries stream survey or the site is suspected of being non-fish bearing dueto impasses or barriers. TOT6 is a good example of where sampling a high site hasmerit. The site is located above a large valley flat where numerous beaver damcomplexes obstruct passage. The likelihood of TOT6 being non-fish bearing is high. Inthis case, sampling proved otherwise.
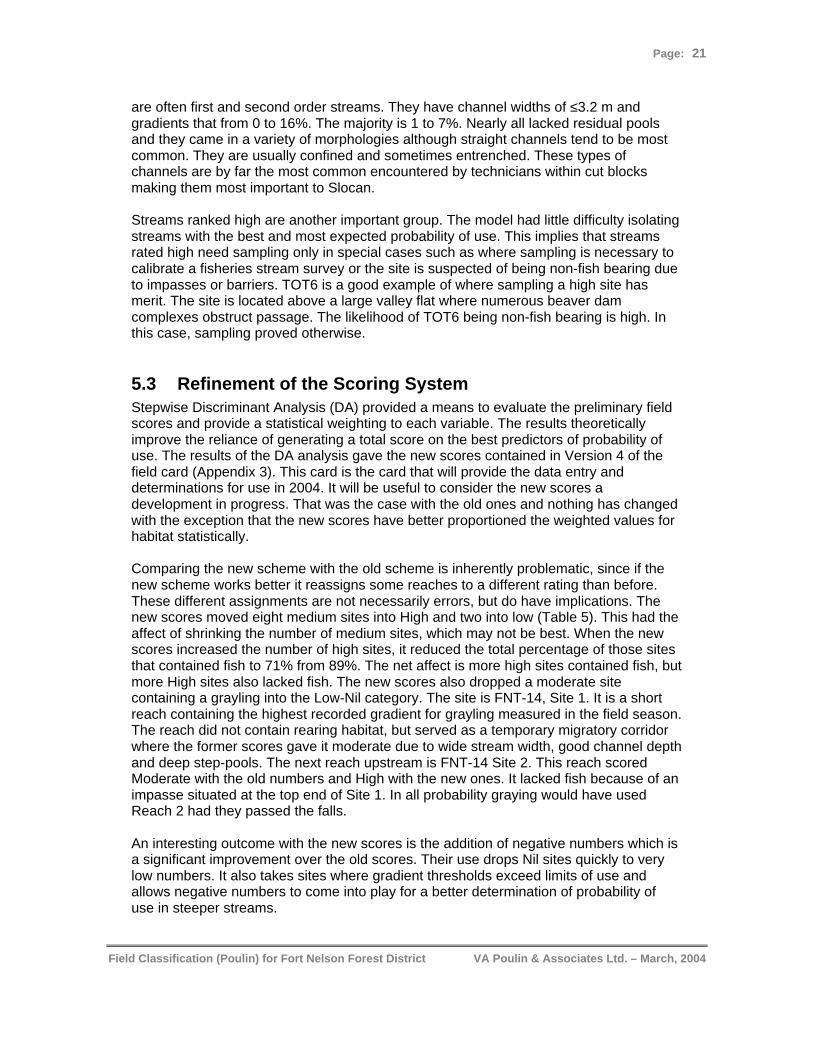
5.3 Refinement of the Scoring SystemStepwise Discriminant Analysis (DA) provided a means to evaluate the preliminary fieldscores and provide a statistical weighting to each variable. The results theoreticallyimprove the reliance of generating a total score on the best predictors of probability ofuse. The results of the DA analysis gave the new scores contained in Version 4 of thefield card (Appendix 3). This card is the card that will provide the data entry anddeterminations for use in 2004. It will be useful to consider the new scores adevelopment in progress. That was the case with the old ones and nothing has changedwith the exception that the new scores have better proportioned the weighted values forhabitat statistically.
Comparing the new scheme with the old scheme is inherently problematic, since if thenew scheme works better it reassigns some reaches to a different rating than before.These different assignments are not necessarily errors, but do have implications. Thenew scores moved eight medium sites into High and two into low (Table 5). This had theaffect of shrinking the number of medium sites, which may not be best. When the newscores increased the number of high sites, it reduced the total percentage of those sitesthat contained fish to 71% from 89%. The net affect is more high sites contained fish, butmore High sites also lacked fish. The new scores also dropped a moderate sitecontaining a grayling into the Low-Nil category. The site is FNT-14, Site 1. It is a shortreach containing the highest recorded gradient for grayling measured in the field season.The reach did not contain rearing habitat, but served as a temporary migratory corridorwhere the former scores gave it moderate due to wide stream width, good channel depthand deep step-pools. The next reach upstream is FNT-14 Site 2. This reach scoredModerate with the old numbers and High with the new ones. It lacked fish because of animpasse situated at the top end of Site 1. In all probability graying would have usedReach 2 had they passed the falls.
An interesting outcome with the new scores is the addition of negative numbers which isa significant improvement over the old scores. Their use drops Nil sites quickly to verylow numbers. It also takes sites where gradient thresholds exceed limits of use andallows negative numbers to come into play for a better determination of probability ofuse in steeper streams.

Page: 22
Field Classification (Poulin) for Fort Nelson Forest District VA Poulin & Associates Ltd. – March, 2004
Table 5. Comparison between scores derived with the original weighted values and thosederived using Stepwise Discriminant Analysis.
Nil Low-Nil Mod High Total
Original Scores 18 11 27 9 65
GR in Samples 0 0 12 8 20
% with GR 0 0 44 89
New Scores 12 15 21 17 65
GR in Samples 0 1 7 12 20
% with GR 0 0 33 71
Stepwise Discriminant Analysis ResultsThe initial scoring system (to convert field measurements to scores) represents anintuitive model of the relative importance of the selected parameters to predict probabilityof fish use. The mathematical construction of this model is a linear combination of pointsthat assigned to categories of habitat quality for each variable. The outcome andaccuracy of this kind of scoring system is influenced by design at 3 levels: 1) the choiceof variables to include, and their relative weights, 2) the number and accuracy of thedivisions into categories (cut points) within each variable, and 3) the points assigned toeach category. The 65 reaches’ data are only adequate to objectively evaluate thescoring scheme at the first level – the choice of variables and their relative weight. Thiswas pursued statistically using Discriminant Analysis (DA). Design at the second levelwas not changed from the preliminary model (based on biological knowledge of sportsfish distribution and field observations). At the third level, the maximum points assignedto each category were adjusted to reflect the relative weight of the variable compared toother variables; the distribution of points to each category was adjusted empirically. Thebiggest change at the third level was the decision to use negative points for physicalattributes that represented the worst habitat characteristics. Models that are ‘the sum oftheir parts’ fail to reflect the biological reality of limiting factors and threshold values thatcan exclude fish from reaches that might be quite suitable in all other respects.Assigning a large negative score to such features keeps the total score low.
Stepwise Discriminant Analysis was run on the original data (continuous variables) andthe scores assigned by the preliminary scoring system. From the original data, DAselected five variables for the best discrimination of the four rated habitat groups (Nil,Low-Nil, Moderate and High). The variables were channel width, residual pool depth,gradient, morphology, and bed material. These variables produced three canonicalvariables, which were very successful in assigning reaches to the right rating group asfollow
Group % Correct Number of Cases Classified into Group
Nil Low Mod High
Nil 85.7 12 2 0 0
Low 90.9Mod 100.0High 100.0
Total 92.3

Page: 23
Field Classification (Poulin) for Fort Nelson Forest District VA Poulin & Associates Ltd. – March, 2004
To see if equally good discrimination was possible with the information preserved inthese scores, the DA was repeated using the preliminary scores as proxies. The resultswere quite different: the five variables selected were order, width, gradient, morphologyand pattern, and assignment of reaches to the right rating group was less successful:
Group % Correct Number of Cases Classified into Group
Nil Low Mod High
Nil 78.6 11 3 0 0
Low 63.6 3 71 1 0
Mod 83.9 1 3 26 1
High 100.0 0 0 0 9
Total 81.5
This indicates that the information to accurately categorize reaches is available in thefield data, but some of that information was lost or distorted in the preliminary scoringscheme.
The DA’s first canonical variable defined the dimension of the greatest distance betweenrating groups. The standardized (by pooled within-group variances) coefficients of thefirst canonical variable provided estimates of the relative weights of the six variablesselected. The coefficients and the corresponding weights assigned were:
Variable Standadized Coefficient WeightWidth -0.77348 17ResPool -0.52300 11Grad 0.45594 50Morph -0.49916 11Bed -0.49182 11
The other five variables (Order, Depth, Pattern, Confinement and Crown Closure)obtained a weight of five. Each weight corresponded to the maximum number of pointspossible to assign a reach with optimum habitat attributes in each variable. Lower pointsaccrued to those with poorer quality attributes. For variables that had quality categoriesthat corresponded to conditions incompatible with fish use, such as channel depth lessthan 0.15 m, or gradients equal to or greater than 12% these categories are assigned -10 points.

Page: 24
Field Classification (Poulin) for Fort Nelson Forest District VA Poulin & Associates Ltd. – March, 2004
The new scoring scheme was as follows:
Order Score Channel Width Score1 -10 <1 -102 0 1-<2 03 5 2-<3 53M 6 3-<5 10≥4 10 >5 17200 m Rule 8
Channel Depth Score Residual Pool Score<0.2 -10 <0.15 -100.2-<0.3 0 0.15-<0.25 0≥0.3 5 0.25-,0.3 6
≥0.3 11
Gradient Score Morphology ScoreFlat 10 LC 00.5-<3 40 RP 113-<4.5 30 CP 64.5-<8 20 SP -108-<12 0≥12 -10
Bed Score Pattern ScoreF/O 0 ST -10G 6 SI 5C 11 IR 5B 6 TM ME MI 3R -10
Confinement Score CrownClose ScoreE -10 0% 5C 0 1-20% 5FC 5 21-40% 2CO 5 41-70% 0UN 2 71-90% 0
90-100% 0
When DA was run on the new points data assigned by these codes, the discrimination ofthe 4 rated groups was statistically better than it had been with the original coded data:

Page: 25
Field Classification (Poulin) for Fort Nelson Forest District VA Poulin & Associates Ltd. – March, 2004
Group % Correct Number of Cases Classified into Group
Nil Low Mod High
Nil 92.9 13 1 0 0
Low 100.0 3 11 0 0
Mod 77.4 0 2 24 1
High 100.0 0 0 0 9
Total 87.7
6. CONCLUSIONThe purpose of this stream classification procedure is to provide forest technicians withan operational screening tool that can classify non-fish bearing streams in the absenceof a formal fisheries stream survey. The procedure functions as a field model to predictthe probability of use by sport fish in streams using the amount and quality of habitat asa surrogate for electro-fishing. It predicts use of habitat based on the suitability of thathabitat to support fish given the conditions imposed on fish within stream environments.Biologists have long known fish exhibit preferences for habitat and as channels changewith stream width, depth, flow and gradient so does their ability to use streams. Themodel establishes thresholds of use for target species (grayling) within the Fort NelsonForest District.
Four rating categories allow for decision making when using the model. These includeNil, Low-Nil, Moderate, and High. Nil captures streams that lack adequate habitat tosupport fish. These streams make up a high percentage of streams encountered byforest technicians in operational areas found in the District. Low-Nil are streams whereelements of habitat are lacking, and probability of use low. They account for another verylarge component of operational streams. This category recognizes that there is apotential across a large number of streams classified as Low-Nil to encounter a sportfish, but the chance is sufficiently rare as to allow management as non-fish bearingwaters. Moderate implies sufficient habitat is present as to require a fisheries survey. Inthe absence of such a survey, the stream is defaulted to fish bearing. High indicates anabundance of preferred habitat for the target species. Fish presence is assured unless thestream is located above an impasse or barrier and the upstream reaches lack perennialhabitat.
Ratings derive from the total point score of individual weighted habitat parameters.Stream order, channel width, channel depth, residual pool depth, gradient, morphology,channel pattern, bed material, and crown closure are the factors used to quantify theamount and quality of fish habitat. All of the field decisions and measurements requiredare within the capability of trained forest technicians. A very large component of streamsin the Fort Nelson Forest District have little to no capability of supporting fish due toharsh climate, abundant fine textured soils, inhospitable terrain and intense competitionfor aquatic habitat by beaver. The field model should allow forest technicians to safelyclassify 80% or more of streams within Slocan’s operational areas. It is attributed to the
Page: 26
Field Classification (Poulin) for Fort Nelson Forest District VA Poulin & Associates Ltd. – March, 2004
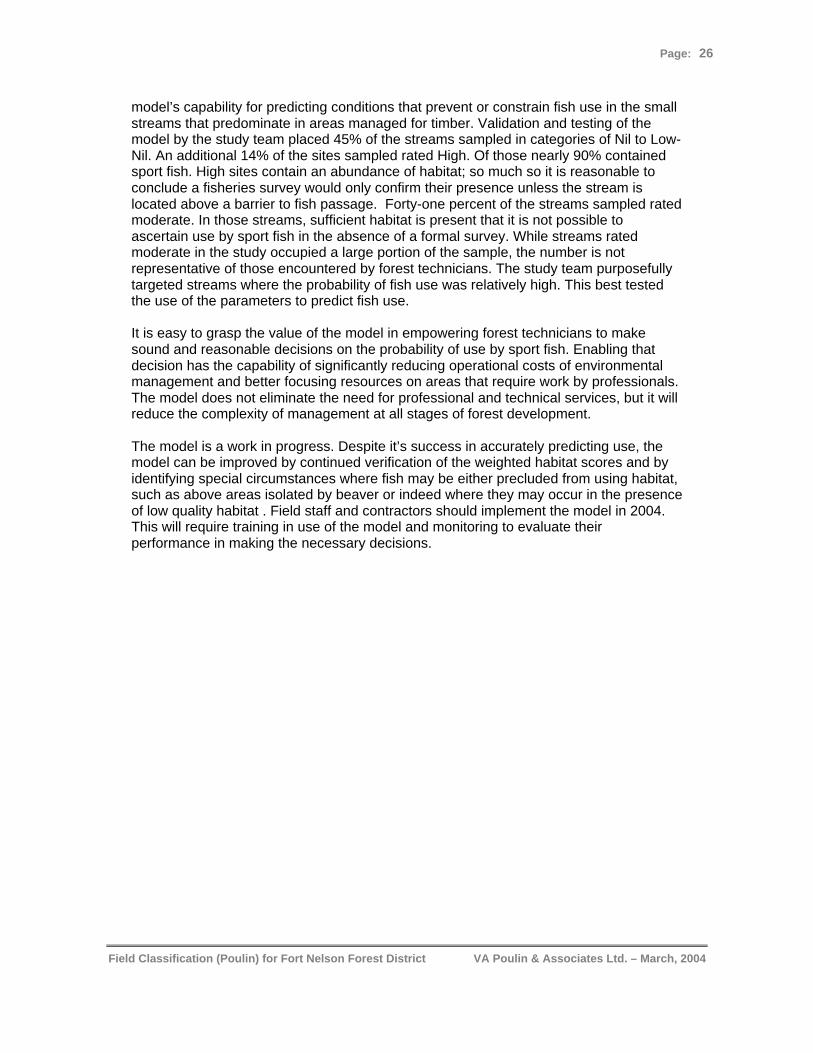
model’s capability for predicting conditions that prevent or constrain fish use in the smallstreams that predominate in areas managed for timber. Validation and testing of themodel by the study team placed 45% of the streams sampled in categories of Nil to Low-Nil. An additional 14% of the sites sampled rated High. Of those nearly 90% containedsport fish. High sites contain an abundance of habitat; so much so it is reasonable toconclude a fisheries survey would only confirm their presence unless the stream islocated above a barrier to fish passage. Forty-one percent of the streams sampled ratedmoderate. In those streams, sufficient habitat is present that it is not possible toascertain use by sport fish in the absence of a formal survey. While streams ratedmoderate in the study occupied a large portion of the sample, the number is notrepresentative of those encountered by forest technicians. The study team purposefullytargeted streams where the probability of fish use was relatively high. This best testedthe use of the parameters to predict fish use.
It is easy to grasp the value of the model in empowering forest technicians to makesound and reasonable decisions on the probability of use by sport fish. Enabling thatdecision has the capability of significantly reducing operational costs of environmentalmanagement and better focusing resources on areas that require work by professionals.The model does not eliminate the need for professional and technical services, but it willreduce the complexity of management at all stages of forest development.
The model is a work in progress. Despite it’s success in accurately predicting use, themodel can be improved by continued verification of the weighted habitat scores and byidentifying special circumstances where fish may be either precluded from using habitat,such as above areas isolated by beaver or indeed where they may occur in the presenceof low quality habitat . Field staff and contractors should implement the model in 2004.This will require training in use of the model and monitoring to evaluate theirperformance in making the necessary decisions.

Page: 27
Field Classification (Poulin) for Fort Nelson Forest District VA Poulin & Associates Ltd. – March, 2004
6. REFERENCES CITED
BC Fisheries Information Service Branch, 2001. Reconnaissance (1:20,000) Fish andFish Habitat Inventory Standards and Procedures. Resources InventoryCommittee, April 2001. Version 2.0. 170 p.
Craig, P.C. and V. A. Poulin 1974. Life history and movements of Arctic grayling(Thymallus arcticus) and juvenile Arctic char (Salvelinus alpinus) in a small tundrastream tributary to the Kvik River Alaska Canadian Arctic Gas Study Ltd.Biological Report Service, 20 (2):50.
Dane, B.G. 1978. Culvert guidelines: recommendations for the design and installation ofculverts in British Columbia to avoid conflict with anadromous fish. Fish. & MarineService Tech. Report No. 811. Department of Fisheries and Oceans, Vancouver,BC. 50 p.
Ford, B.S., P.S. Higgins, A.F. Lewis, K.L. Cooper, T.A. Watson, C.M. Gee, G.L. Ennisand R.L. Sweeting. 1995. Literature reviews of the life history, habitat requirementsand mitigation/compensation strategies for thirteen sport fish species in the Peace,Liard and Columbia River Drainages of British Columbia. Canadian Manuscript ofFisheries and Aquatic Sciences 2321. Eastern B.C. Habitat Unit, HabitatEnhancement Branch, Department of Fisheries and Oceans, Vancouver, BC. 342p.
Ministry of Forests, 2002. The ecology of the boreal white spruce and black spruce zone.Brochure 49. 6 p.
Meidinger, D. and J, Pojar. 1991. Chapter 3. Ecosystems of British Columbia. BC Ministry ofForests, Victoria, BC. 330 pp.
Poulin V.A. 2003. Review and analysis of reconnaissance fish and fish habitatinformation to develop criteria for predicting fish stream classification in theabsence of a fisheries inventory. FIA for Slocan Forest Products Ltd., Fort Nelson,BC. 66 p.
Poulin V.A. J. Hart, D. Wright, T. Pereira and J. Dobson 2003. Establishing criteria toeffectively reduce the need and cost of stream classification: working towards aDawson Creek Local Area Agreement. FIA for Louisiana-Pacific Corporation,Dawson Creek, BC. 46 p.
Scott, W.B. and E.J. Crossman. 1973. Freshwater fishes of Canada. Fish. Res. BoardCan, Bull. 184:966 p.
Stuart K.M. and G.R. Chislett 1979. Aspects of the Life History of Arctic Grayling in theSukunka Drainage. British Columbia Fish and Wildlife Branch. Whitehorse,Yukon Territory.

Page: 28
Field Classification (Poulin) for Fort Nelson Forest District VA Poulin & Associates Ltd. – March, 2004
Appendix 1. Site locations and scores derived using the original weighted valuesin watershed areas sampled in the Fort Nelson Forest District in 2003.

Fort Nelson
Fort Nelson River
Poulin
Appendix 1a. Location of Fort Nelson River near the community of Fort Nelson. Base map is from Fisheries Data Warehouse (Ministry of Water, Lands and Air Protection, Inventory Branch, Victoria, BC). Reference provided for location of Fort Nelson Maps 1, 2, 3, 4 and 5.
British Columbia
Map 4.
Map 3.
Map 2.Map 1.
Map 5.

Scale (1:50 000)1km500m N
Fort Nelson River Map 1 Area Locator: 94O.104
From: Slocan Forest Products BCGS series mapUTM Zone 10 NAD 83
NFC
167859
GR
FNT14
M36
M45
LP4014Site 1
FNT14Site 2
GR
GR
FNT15
FNT15
M31
Site 1
Site 2NFC
LN20
LP4015
LP4003
P4855
FNT3NFCN16
171590
1715901
FNT13M59
LP4013
FNT-1FNT1-1
sport fish captured (G-grayling)
sport fish not captured (NFC)
habitat or access limited for sport fish
primary stream site lable
primary tributary stream site lable
Order 1 stream
Order 2 stream
Order 3 stream
Order 4 and greater stream
beaver dam where noted
beaver dam complex (2 or more dams)
reference locator
reach rating and point score
moderate site with grayling
moderate site lacking grayling
LP4000
M42

GR
4855
4602
4601
4599
4598
4598
4854
4661
4662
4596
4595
4591
4590
4592
NVC/ncd
FNT1-1NFC
LN29
LP4002
FNT1-2NFC
LN27
NVC/ncdNVC/ncdNVC/ncd
GR
94O
.104
94O
.105
steep G
FNT1M36
LP4001
FNT2NFC
N17
LP4004
FNT4M66
Scale (1:50 000)1km
500mN
Fort Nelson River Map 2 Area Locator: 94O.104
From: Slocan Forest Products BCGS series mapUTM Zone 10 NAD 83
4901
NVC/ncd
floodplain dams below spring HW
FNT-1FNT1-1
sport fish captured (G-grayling)
sport fish not captured (NFC)
habitat or access limited for sport fish
primary stream site lable
primary tributary stream site lable
Order 1 stream
Order 2 stream
Order 3 stream
Order 4 and greater stream
beaver dam where noted
beaver dam complex (2 or more dams)
reference locator
reach rating and point score
moderate site with grayling
moderate site lacking grayling
LP4000
M42

4595
49014591
4592
grass slough
4593
GR
FNT5H58 LP4005
NVC/ncd
NVC/ncd
NVC/ncd
NVC/ncd
NVC/ncd
NVC/ncd
NVC/ncd
ponded
49054906
steep G
LP4004
Scale (1:50 000)1km
500mN
Fort Nelson River Map 3 Area Locator: 94O.104
From: Slocan Forest Products BCGS series mapUTM Zone 10 NAD 83
FNT6-1dry
LP4012 N12
FNT6-2dry
N12
N10
FN floodplaindewatered
SnakeRiver
Shataneh River
NVC/ncd
NFC
94O
.104
94O
.105
FNT-1FNT1-1
sport fish captured (G-grayling)
sport fish not captured (NFC)
habitat or access limited for sport fish
primary stream site lable
primary tributary stream site lable
Order 1 stream
Order 2 stream
Order 3 stream
Order 4 and greater stream
beaver dam where noted
beaver dam complex (2 or more dams)
reference locator
reach rating and point score
moderate site with grayling
moderate site lacking grayling
LP4000
M42
Fort Nelson River

94J.
124
94J.
125
LP4009
4962
NVC/ncd
NVC/ncd
5999
5998
Scale (1:50 000)1km
500mN
Fort Nelson River Map 4 Area Locator: 94J.124
From: Slocan Forest Products BCGS series mapUTM Zone 10 NAD 83
FNT12
LP4012
LN24
FNT9-1N12
Fort Nelson River
NFC
NFC
GR
FNT9M48
4910
4909
4958
4992
4954
NVC/ncd
steep/unstable gully
Snake M/L
large crossvalley dam
NVC/dewatered or dry floodplain
NVC/dewatered or dry floodplain
dry
steep
FNT-1FNT1-1
sport fish captured (G-grayling)
sport fish not captured (NFC)
habitat or access limited for sport fish
primary stream site lable
primary tributary stream site lable
Order 1 stream
Order 2 stream
Order 3 stream
Order 4 and greater stream
beaver dam where noted
beaver dam complex (2 or more dams)
reference locator
reach rating and point score
moderate site with grayling
moderate site lacking grayling
LP4000
M42

LP40010FNT10M33
4962
NVC/ncd
5999
5998
FNT12LP4012
LN24
Fort Nelson River
NFC
steep/unstable gully
Snake M/L
large crossvalley dam
Scale (1:50 000)1km
500mN
Fort Nelson River Map 5 Area Locator: 94J.124
From: Slocan Forest Products BCGS series mapUTM Zone 10 NAD 83
4961
NVC/confluence
FNT11LP4011
N6 NFC
GR
OT-1OT1-1
sport fish captured (G-grayling)
sport fish not captured (NFC)
habitat or access limited for sport fish
primary stream site lable
primary tributary stream site lable
Order 1 stream
Order 2 stream
Order 3 stream
Order 4 and greater stream
beaver dam where noted
beaver dam complex (2 or more dams)
reference locator
reach rating and point score
moderate site with grayling
moderate site lacking grayling
LP4000
M42
Fort Nelson River
Airport

Odayin CreekMap 1
Map 2
Map 3
Dunedin River
Poulin
Appendix 1b. Location of Odayin Creek in the Dunedin River watershed. Base map is from Fisheries Data Warehouse (Ministry of Water, Lands and Air Protection, Inventory Branch, Victoria, BC). Reference provided for location of Odayin Creek Maps 1, 2, and 3.
British Columbia

P5344
P5304
P5337
P5343
P5358
From: Slocan Forest Products BCGS series mapUTM Zone 10 NAD 83
P5360
P5336
P5362
LN23
LN28
LP3001
LP3002
LP2003
LP2001
LP2002
LP2004
LP005
LP006
sport fish captured (G grayling)sport fish not captured (NFC)
OT-1 site lable (primary stream)
OT-T1 site lable (primary tributary streamOrder 1 streamOrder 2 streamOrder 3 streamOrder 4 and greater streambeaver dam complex (2 or more dams)stream locator referencestream point score and ratingmoderate site with graylingmoderate site lacking grayling
LP1000
M42Scale (1:50 000)1km500m N
OT2
GR
Odayin Creek
Odayin Creek Area Locator: 94N.105 Map 1
M44
M35OT3NFC
OT1NFC
N12 NFC
Site 1
Site 2
OT4
DT1NFC
DT2
NFCOT5
NFCOT6
210-364400-38000
M47
N14
Dunedin River 210-364400
M46
M31
P5304
P5300
NFC

P5344
P5304
P5337
P5340/41
P5337
P5343
P5360
P5336
LP2010
LP2007
LP2009
sport fish captured (G grayling)
sport fish not captured (NFC)OT-1 site lable (primary stream)
OT-T1 site lable (primary tributary streamOrder 1 streamOrder 2 streamOrder 3 streamOrder 4 and greater streambeaver dam complex (2 or more dams)beaver dam where notedstream locator referencestream point score and ratingmoderate site with graylingmoderate site lacking grayling
LP1000
M42
GR
Odayin Creek
From: Slocan Forest Products BCGS series mapUTM Zone 10 NAD 83
Scale (1:50 000)1km500m N
Odayin Creek Area Locator: 94N.105 Map 2
M35OT7
210-364400-38000
GRangledno card
N15OT10-1OT10-1
NFC
steep
OT10H
OT9NFCM32

P5344
P5340/41
P5337
OT8-1
LP2010
LP2008
sport fish captured (G grayling)sport fish not captured (NFC)
OT-1 site lable (primary stream)
OT-T1 site lable (primary tributary streamOrder 1 streamOrder 2 streamOrder 3 streamOrder 4 and greater streambeaver dam complex (2 or more dams)beaver dam where notedstream locator referencestream point score and ratingmoderate site with graylingmoderate site lacking grayling
LP1000
M42Odayin Creek
From: Slocan Forest Products BCGS series mapUTM Zone 10 NAD 83
Scale (1:50 000)1km500m N
Odayin Creek Area Locator: 94N.105 Map 3
210-364400-38000
GRH62
OT8NFCGR
H66
OT8H34
LP2009OT9NFCM32
P5346
P5350
94O
101
P5347
Site 1
Site 2
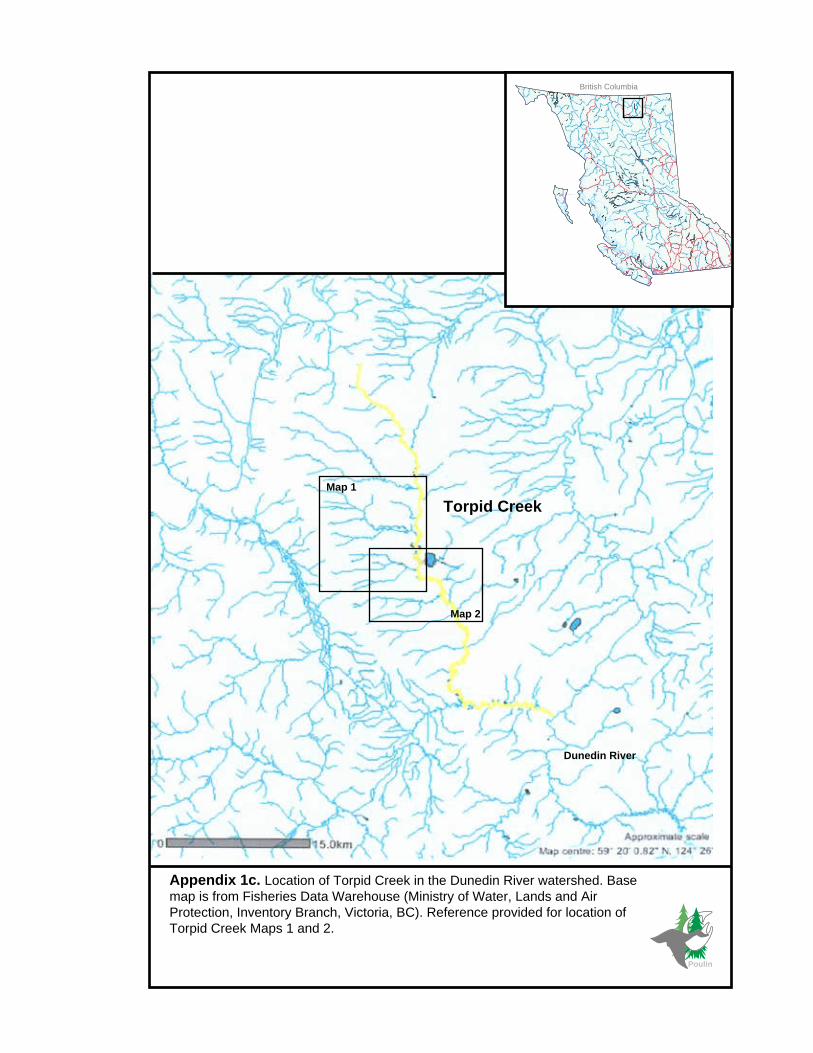
Map 1
Poulin
Appendix 1c. Location of Torpid Creek in the Dunedin River watershed. Base map is from Fisheries Data Warehouse (Ministry of Water, Lands and Air Protection, Inventory Branch, Victoria, BC). Reference provided for location ofTorpid Creek Maps 1 and 2.
British Columbia
Torpid Creek
Dunedin River
Map 2
Map 1

2083
From: Slocan Forest Products BCGS series mapUTM Zone 10 NAD 83
Torpid Creek Area Locator: 94N.109 Map 1
2082
LP6000
210-364400-3700-6000
H52
H56
TOT3NFC
M44
N187TOT3-1
TOT6 Site 2NFC
TOT6GR
Site 1
TO2Site 1
Site 1
Site 2
NFC
2081
2088
TOT1-1M42
2085
2084
Site 1 TO1
NFC
GRM40
LP1000
LP3000
Site 1
TOT3M37
Site 2NFC
Scale (1:50 000)1km500m N
TOT-1TO1-1
sport fish captured (G-grayling)
sport fish not captured (NFC)
habitat or access limited for sport fish
primary stream site lable
primary tributary stream site lable
Order 1 stream
Order 2 stream
Order 3 stream
Order 4 and greater stream
beaver dam where noted
beaver dam complex (2 or more dams)
reference locator
reach rating and point score
moderate site with grayling
moderate site lacking grayling
LP1000
M42

H58
TOT2GR
Site 1
Site 1
TOT4
2088
5312
5311
LP1000
TOT2-2M46
NFC
TOT2-1LN17 NFC
LP2000
NFC
M30 TOT5NFC
M43
LP4000
LP5000
Site 2
TOT5NFC
N18
From: Slocan Forest Products BCGS series mapUTM Zone 10 NAD 83
Torpid Creek Area Locator: 94N.109 Map 2
Scale (1:50 000)1km500m N
TO1TO1-1
sport fish captured (G-grayling)
sport fish not captured (NFC)
habitat or access limited for sport fish
primary stream site lable
primary tributary stream site lable
Order 1 stream
Order 2 stream
Order 3 stream
Order 4 and greater stream
beaver dam where noted
beaver dam complex (2 or more dams)
reference locator
reach rating and point score
moderate site with grayling
moderate site lacking grayling
LP1000
M42

Tsoo Creek
Fort Nelson River
Map 1
Map 2
Poulin
Appendix 1d. Location of Tsoo Creek in the Fort Nelson River watershed. Base map is from Fisheries Data Warehouse (Ministry of Water, Lands and Air Protection, Inventory Branch, Victoria, BC). Reference provided for location ofTsoo Creek Maps 1 and 2.
British Columbia

Luyben M/L
Luyben M/L
LN23
LP3001
Scale (1:50 000)1km500m N
GR
GR/GRtwo samples
Tsoo Creek
Upper Watershed
Tsoo Creek
Tsoo CreekMap 1 Area Locator: 94O.101/102
H60
M34/36
TS1
TST-1NFC Site 1
Site 1
212-08400
From: Slocan Forest Products BCGS series mapUTM Zone 10 NAD 83
LP3011
LN22
TST-11Site 2TST-11
NFC
N6
TST-7NFC
NFCN10
TST-8
LP3007
LP3008LP3006NFC
M30
TST-6
H51
TS6 Site 1
Site 2
GR
NFCLN23
TST-9 N12
TST-12NFC
LP3012
NCD
N14
TST-13NFC
LP3013
94O
.101
94O
.102
TST-1TST1-1
sport fish captured (G-grayling)
sport fish not captured (NFC)
habitat or access limited for sport fish
primary stream site lable
primary tributary stream site lable
Order 1 stream
Order 2 stream
Order 3 stream
Order 4 and greater stream
beaver dam where noted
beaver dam complex (2 or more dams)
reference locator
reach rating and point score
moderate site with grayling
moderate site lacking grayling
LP3000
M42

P995
Luyben M/L
Tsoo Creek
LN21NFC
NFC
TST2
212-08400
Scale (1:50 000)1km500m N
Tsoo CreekMap 2 Area Locator: 94O.102
From: Slocan Forest Products BCGS series mapUTM Zone 10 NAD 83
NVC/ncd
NVC/ncd
NVC/ncd
NVC
NCD
earthflow
TST3N16
GR
TST4 M40
P920
P916
P919
P918
P917
P922
P930
P929
2386 road
NVC/ncd
LP3002
LP3003
LP3004
NFCNVC/ncdTST5
N14
LP3005
NFCTST15LN16
LP30015
TST-1TST1-1
sport fish captured (G-grayling)
sport fish not captured (NFC)
habitat or access limited for sport fish
primary stream site lable
primary tributary stream site lable
Order 1 stream
Order 2 stream
Order 3 stream
Order 4 and greater stream
beaver dam where noted
beaver dam complex (2 or more dams)
reference locator
reach rating and point score
moderate site with grayling
moderate site lacking grayling
LP3000
M42
cabin
NFCTST5 Site 1
Site 2
M43

Page: 45
Field Classification (Poulin) for Fort Nelson Forest District VA Poulin & Associates Ltd. – March, 2004
Appendix 2. Completed field site cards showing examples for Low-Nil, Moderate andHigh ratings. Data table provided with individual measurements and scores.

STREAM NAME (gaz) FTN-10 Fort Nelson River (local)
SITE # 1 REACH # WATERSHED CODE
NID MAP # WP 291 UTM E 0526422 UTM N 6525791 Elev 278 m
DATE 09/12/03 TIME 0813 AGENCY CREW VAP/DW
C Width Wetted W Riffle C C Depth Pool D Res. Pool G %
4.4 2.3 .20 .35 .32 .12 5.0
3.9 3.6 .18 .29 .23 .05 5.0�
3.4 3.1 .18 .29 .29 .11 5.0�
4.3 3.2 .19 .30 .24 .05 5.0�
3.8 2.9 .3 .35 .37 .07 5.0�
4.1 2.8 .25 .27 .42 .17 5.0
Score: 37 (Moderate Rating), Sample Result: GR
Log step - 0.25 m @ highwater - not a barrier
FTN-10 - grayling captured in pools, habitat fair for GR due to lack of residual pools and moderate to highgradient througout
DETERMINATION OF FPC STREAM or REACH - Working Draft for Ft. Nelson Forest District Only
The FPC defines a stream as a "reach", flowing on a perennial or seasonal basis having a continuous channel bed, whether or not the bed or banks of the reach are obscured by overhanging or bridging vegetation or soil. The bed must be scoured by water, or contain deposits of mineral alluvium. The channel may be perennial, ephemeral, or intermittent. Channel beds that are known to contain fish, flow directly into a fish stream or lake that is known to contain fish, or flows directly into a domestic water intake have no minimum length. All other channel beds must be ³100 m to be a reach . Watercourses with organic beds with no mineral alluvium, or scour down to mineral soil, are not included under the definition of a stream.
Non-classified Drainage (NCD's) are watercourses that do not satisfy the definition of a reach
VESSEL PRESENT Y N-NCD CHANNEL BED SCOURED TO MINERAL SOIL OR WITH ALLUVIUM Y N-ORGANIC BED - NCD
IF YES, obtain traverse data. WHERE channel bed is ³100 m, w atercourse is a reach (see exceptions above). Use field data to complete following:
PR
OB
AB
ILIT
Y O
F U
SE
RA
TIN
GS
STREAM CLASS DETERMINATION IN ABSENCE OF FISH SURVEY - STEP 4 (POULIN) for Fort Nelson Forest District only
1 0 2 1 3 4 3 Mainstem 6 ³4 10 1-2 FP 10 1-2 VF 2 1-3 ²4% 6 1-3 >Impass 0
PointsOrder
² 2 0 >2 >2-3 2 ³3-5 6 >5 10
PointsWidth
GR flat 2 0.5-<3 10 ³3-4 8 ³4-8 4 ³8-10.5 1 >10.5 -10
PointsGradient
<0.2 0 0.2-<0.3 1 0.3-<0.7 3 ³0.7 4
PointsCD*
<0.15 0 0.15-<0.3 2 ³0.3 6 .
PointsResPool
Points
Points
Points
Morphology
Bed
Pattern
Nil <20 S6/S5 Low-nil 20-<30 S6/S5 Moderate 30-<50 Survey High ²50 S1-S4
Risk of Use by Sport Fish*Impasses not present*
Example only, total points not yet established
Rating Total Points Class
Total points to establish estimated use by sport fish for each reach assessed. Values provided are for Ft. Nelson Forest District only. Habitat use varies with species and area. Non-sport fish streams have low values due to absence of usable or preferred habitat.
Where habitat is present within the usable range (moderate to high risk) undertake a fisheries survey or default stream class to a fish stream. Barriers impede upstream passage of fish. Assess barriers for passage. Undertake a fisheries inventory or default stream class to a fish stream if perennial habitat on moderate to high risk streams occurs above a barrier. Streams upstream of barriers with Nil and Low-nil risk of use and those that simultaneously dry or freeze solid in winter are classified S6/S5. All streams with an average gradient ³20% may be deem ed S6/S5.
large channel 1riffle-pool 5cascade-pool 3step-pool 1
straight 1sinuous 3irregular 3meander 2
fines/organic 0gravel 6cobble 10boulder 6rock 0
Points
Points
Bed
Crown C0% 41-20% 621-40% 241-70% 071-90% 0>90% 0
E 0C 2FC 3OC 3UC 2
1 2 3 3m ³4 1-3 > impasse
Turbid Murky Low Clear
LC RP CP SP
Type: Rock Falls Log/Root Step Gradient/chute-bedrock-channel BeavD Dewatering Overland
P1R9 P2R8 P3R7 P4R6 P5R5 P6R4
CHANNEL
Mainstem Direct 1-2 FP 1-2 VF 1-3 ² 4%
MORPHOLOGY
IMPASSE
COMMENTS directly trib to FT. Nelson River, stable - boulders covered w/moss-algae, poor mouth/steep but goes to 5% above, OK passage
at high water, gradient constant, Photos: 1733-1738
Photo No. 1737 - stream to impasse, OK passage on side, not a barrier
BED MATERIAL Dominant: O F G C B R Subdominant: O F G C B R
D95 (cm) 35 D (cm) 12
PATTERN TM ME IM IR SI ST
CONFINEMENT EN CO FC OC UN NA
WATER CLARITY
RIPARIAN VEG. IN SH PS YF MF
FOREST COVER: MFm/SAcAtEP
Type
Height (H)
Pool Depth (PD)
Riffle Crest (RC)
CD (Q1)
WSEL=plunge pool depth at time of survey
Type
Height (H)
Pool Depth (PD)
Riffle Crest (RC)
CD (Q1)
Type
Slope (%)
Length (m)
Dry Low >0-30% Wb Med 30-90% Wb High >90% Wb
Amount D SLarge woody debris (LWD)Small woody debris (SWD)Boulder (B)Undercuts (UT)Deep pool (DP)Overstream vegetation (OV)Instream vegetation (IV)N-none,T-trace (3-5%),M-moderate (5-20%),A-abundant(>20% of site),D-dominant,S-subdominant
ST
RE
AM
CO
VE
R
MODIFIED SITE CARD FOR STEP 3, FIELD STREAM CLASSIFICATION (POULIN), V08/03, USE BACK FOR DETERMINATION OF FPC STREAM
Flow Stage
Crown Closure 0 1-20 21-40 41-70 71-90 >90
RATING
STREAM CLASS
TOTAL SCORE
% 20
Bank Height 1.1 m
TTATTMM-moss
D
S
LS
0.75
0.45
0.25
0.55
��4
��6 0
2��3
��3
��3
��6
��6
����4
37
Survey or default to S3, El results:13 GR - 70-150 mm, all in pools
Mod
STREAM ORDER
CO
VE
R

STREAM NAME (gaz) FTN-9 Fort Nelson River (local)
SITE # 1 REACH # WATERSHED CODE
NID MAP # WP 407 UTM E 0527831 UTM N 6536556 Elev 407 m
DATE 09/10/03 TIME 1407 AGENCY CREW VAP/DW
C Width Wetted W Riffle C C Depth Pool D Res. Pool G %
6.7 2.9 .10 .26 .52 .42 2
7.2 3.2 .10 .22 .21 .11 2
4.5 4.4 .15 .35 .24 .09 5
5.5 5.3 .10 .38 .38 .28 6
4.3 2.6 .12 .28 .24 .12 3
5.2 4.3 .17 .32 .31 .15 3
Score: 48 (Mod (H) Rating), Sample Result: GR captured
FTN-9 - sample stream withelements of fair to good grayling habitat, key features are streamwdith >5 m, favourable gradients and boulder substrates
DETERMINATION OF FPC STREAM or REACH - Working Draft for Ft. Nelson Forest District Only
The FPC defines a stream as a "reach", flowing on a perennial or seasonal basis having a continuous channel bed, whether or not the bed or banks of the reach are obscured by overhanging or bridging vegetation or soil. The bed must be scoured by water, or contain deposits of mineral alluvium. The channel may be perennial, ephemeral, or intermittent. Channel beds that are known to contain fish, flow directly into a fish stream or lake that is known to contain fish, or flows directly into a domestic water intake have no minimum length. All other channel beds must be ³100 m to be a reach . Watercourses with organic beds with no mineral alluvium, or scour down to mineral soil, are not included under the definition of a stream.
Non-classified Drainage (NCD's) are watercourses that do not satisfy the definition of a reach
VESSEL PRESENT Y N-NCD CHANNEL BED SCOURED TO MINERAL SOIL OR WITH ALLUVIUM Y N-ORGANIC BED - NCD
IF YES, obtain traverse data. WHERE channel bed is ³100 m, w atercourse is a reach (see exceptions above). Use field data to complete following:
PR
OB
AB
ILIT
Y O
F U
SE
RA
TIN
GS
STREAM CLASS DETERMINATION IN ABSENCE OF FISH SURVEY - STEP 4 (POULIN) for Fort Nelson Forest District only
1 0 2 1 3 4 3 Mainstem 6 ³4 10 1-2 FP 10 1-2 VF 2 1-3 ²4% 6 1-3 >Impass 0
PointsOrder
² 2 0 >2 >2-3 2 ³3-5 6 >5 10
PointsWidth
GR flat 2 0.5-<3 10 ³3-4 8 ³4-8 4 ³8-10.5 1 >10.5 -10
PointsGradient
<0.2 0 0.2-<0.3 1 0.3-<0.7 3 ³0.7 4
PointsCD*
<0.15 0 0.15-<0.3 2 ³0.3 6 .
PointsResPool
Points
Points
Points
Morphology
Bed
Pattern
Nil <20 S6/S5 Low-nil 20-<30 S6/S5 Moderate 30-<50 Survey High ²50 S1-S4
Risk of Use by Sport Fish*Impasses not present*
Example only, total points not yet established
Rating Total Points Class
Total points to establish estimated use by sport fish for each reach assessed. Values provided are for Ft. Nelson Forest District only. Habitat use varies with species and area. Non-sport fish streams have low values due to absence of usable or preferred habitat.
Where habitat is present within the usable range (moderate to high risk) undertake a fisheries survey or default stream class to a fish stream. Barriers impede upstream passage of fish. Assess barriers for passage. Undertake a fisheries inventory or default stream class to a fish stream if perennial habitat on moderate to high risk streams occurs above a barrier. Streams upstream of barriers with Nil and Low-nil risk of use and those that simultaneously dry or freeze solid in winter are classified S6/S5. All streams with an average gradient ³20% may be deem ed S6/S5.
large channel 1riffle-pool 5cascade-pool 3step-pool 1
straight 1sinuous 3irregular 3meander 2
fines/organic 0gravel 6cobble 10boulder 6rock 0
Points
Points
Bed
Crown C0% 41-20% 621-40% 241-70% 071-90% 0>90% 0
E 0C 2FC 3OC 3UC 2
1 2 3 3m ³4 1-3 > impasse
Turbid Murky Low Clear
LC RP CP SP
Type: Rock Falls Log/Root Step Gradient/chute-bedrock-channel BeavD Dewatering Overland
P1R9 P2R8 P3R7 P4R6 P5R5 P6R4
CHANNEL
Mainstem Direct 1-2 FP 1-2 VF 1-3 ² 4%
MORPHOLOGY
IMPASSE
COMMENTS stream width, gradient and substrate key features, pools variable (poor-good), channel depth fair-poor, fair P/R ratio, boulders
dominant, but fines very high - high moderate stream
Photo No. 1731/1730 (site photos)
BED MATERIAL Dominant: O F G C B R Subdominant: O F G C B R
D95 (cm) 38 D (cm) 12
PATTERN TM ME IM IR SI ST
CONFINEMENT EN CO FC OC UN NA
WATER CLARITY
RIPARIAN VEG. IN SH PS YF MF
FOREST COVER: MFm/SAcAtEp
Type
Height (H)
Pool Depth (PD)
Riffle Crest (RC)
CD (Q1)
WSEL=plunge pool depth at time of survey
Type
Height (H)
Pool Depth (PD)
Riffle Crest (RC)
CD (Q1)
Type
Slope (%)
Length (m)
Dry Low >0-30% Wb Med 30-90% Wb High >90% Wb
Amount D SLarge woody debris (LWD)Small woody debris (SWD)Boulder (B)Undercuts (UT)Deep pool (DP)Overstream vegetation (OV)Instream vegetation (IV)N-none,T-trace (3-5%),M-moderate (5-20%),A-abundant(>20% of site),D-dominant,S-subdominant
ST
RE
AM
CO
VE
R
MODIFIED SITE CARD FOR STEP 3, FIELD STREAM CLASSIFICATION (POULIN), V08/03, USE BACK FOR DETERMINATION OF FPC STREAM
Flow Stage
Crown Closure 0 1-20 21-40 41-70 71-90 >90
RATING
STREAM CLASS
TOTAL SCORE
% 15
Bank Height 1.0 m
TTATMMT-moss
D
D S
��4
��
10 2
3
��3
��
3
��3
��6
��6
���8
48
Survey or default to S2, El results:30 GR - 82-148 mm
Mod
STREAM ORDER
CO
VE
R

STREAM NAME (gaz) FTN-4 Fort Nelson River (local)
SITE # 1 REACH # WATERSHED CODE
NID MAP # WP 286 UTM E 0534912 UTM N 6555244 Elev 486 m
DATE 09/10/03 TIME 0838 AGENCY CREW VAP/DW
C Width Wetted W Riffle C C Depth Pool D Res. Pool G %
9.4 3.0 0.18 .33 .71 .53 1.2
7.2 4.0 .09 .28 >1.0 >0.5 1.0
11.9 11.3 .10 .28 .85 .75 1.0
as per above
Score: 62-66 (High Rating), Sample Result: GR captured
FTN-4 - sample stream with excellent grayling habitat, key features are widechannel, ³4th order stream, pool-riffle morphology, deep residual pools, cobble-boulder substrate and lack of fines
DETERMINATION OF FPC STREAM or REACH - Working Draft for Ft. Nelson Forest District Only
The FPC defines a stream as a "reach", flowing on a perennial or seasonal basis having a continuous channel bed, whether or not the bed or banks of the reach are obscured by overhanging or bridging vegetation or soil. The bed must be scoured by water, or contain deposits of mineral alluvium. The channel may be perennial, ephemeral, or intermittent. Channel beds that are known to contain fish, flow directly into a fish stream or lake that is known to contain fish, or flows directly into a domestic water intake have no minimum length. All other channel beds must be ³100 m to be a reach . Watercourses with organic beds with no mineral alluvium, or scour down to mineral soil, are not included under the definition of a stream.
Non-classified Drainage (NCD's) are watercourses that do not satisfy the definition of a reach
VESSEL PRESENT Y N-NCD CHANNEL BED SCOURED TO MINERAL SOIL OR WITH ALLUVIUM Y N-ORGANIC BED - NCD
IF YES, obtain traverse data. WHERE channel bed is ³100 m, w atercourse is a reach (see exceptions above). Use field data to complete following:
PR
OB
AB
ILIT
Y O
F U
SE
RA
TIN
GS
STREAM CLASS DETERMINATION IN ABSENCE OF FISH SURVEY - STEP 4 (POULIN) for Fort Nelson Forest District only
1 0 2 1 3 4 3 Mainstem 6 ³4 10 1-2 FP 10 1-2 VF 2 1-3 ²4% 6 1-3 >Impass 0
PointsOrder
² 2 0 >2 >2-3 2 ³3-5 6 >5 10
PointsWidth
GR flat 2 0.5-<3 10 ³3-4 8 ³4-8 4 ³8-10.5 1 >10.5 -10
PointsGradient
<0.2 0 0.2-<0.3 1 0.3-<0.7 3 ³0.7 4
PointsCD*
<0.15 0 0.15-<0.3 2 ³0.3 6 .
PointsResPool
Points
Points
Points
Morphology
Bed
Pattern
Nil <20 S6/S5 Low-nil 20-<30 S6/S5 Moderate 30-<50 Survey High ²50 S1-S4
Risk of Use by Sport Fish*Impasses not present*
Example only, total points not yet established
Rating Total Points Class
Total points to establish estimated use by sport fish for each reach assessed. Values provided are for Ft. Nelson Forest District only. Habitat use varies with species and area. Non-sport fish streams have low values due to absence of usable or preferred habitat.
Where habitat is present within the usable range (moderate to high risk) undertake a fisheries survey or default stream class to a fish stream. Barriers impede upstream passage of fish. Assess barriers for passage. Undertake a fisheries inventory or default stream class to a fish stream if perennial habitat on moderate to high risk streams occurs above a barrier. Streams upstream of barriers with Nil and Low-nil risk of use and those that simultaneously dry or freeze solid in winter are classified S6/S5. All streams with an average gradient ³20% may be deem ed S6/S5.
large channel 1riffle-pool 5cascade-pool 3step-pool 1
straight 1sinuous 3irregular 3meander 2
fines/organic 0gravel 6cobble 10boulder 6rock 0
Points
Points
Bed
Crown C0% 41-20% 621-40% 241-70% 071-90% 0>90% 0
E 0C 2FC 3OC 3UC 2
1 2 3 3m ³4 1-3 > impasse
Turbid Murky Low Clear
LC RP CP SP
Type: Rock Falls Log/Root Step Gradient/chute-bedrock-channel BeavD Dewatering Overland
P1R9 P2R8 P3R7 P4R6 P5R5 P6R4
CHANNEL
Mainstem Direct 1-2 FP 1-2 VF 1-3 ² 4%
MORPHOLOGY
IMPASSE
COMMENTS excellent stream with high habitat capability, deep, well defined pool-riffle breaks, moss covered bed (stable substrates). Boulder-
cobble with functional large woody debris. Water tea coloured, high cover factor
Photo No. 1719-/1720 (site photos)
BED MATERIAL Dominant: O F G C B R Subdominant: O F G C B R
D95 (cm) 60 D (cm) 15
PATTERN TM ME IM IR SI ST
CONFINEMENT EN CO FC OC UN NA
WATER CLARITY
RIPARIAN VEG. IN SH PS YF MF
FOREST COVER: MFc/S
Type
Height (H)
Pool Depth (PD)
Riffle Crest (RC)
CD (Q1)
WSEL=plunge pool depth at time of survey
Type
Height (H)
Pool Depth (PD)
Riffle Crest (RC)
CD (Q1)
Type
Slope (%)
Length (m)
Dry Low >0-30% Wb Med 30-90% Wb High >90% Wb
Amount D SLarge woody debris (LWD)Small woody debris (SWD)Boulder (B)Undercuts (UT)Deep pool (DP)Overstream vegetation (OV)Instream vegetation (IV)N-none,T-trace (3-5%),M-moderate (5-20%),A-abundant(>20% of site),D-dominant,S-subdominant
ST
RE
AM
CO
VE
R
MODIFIED SITE CARD FOR STEP 3, FIELD STREAM CLASSIFICATION (POULIN), V08/03, USE BACK FOR DETERMINATION OF FPC STREAM
Flow Stage
Crown Closure 0 1-20 21-40 41-70 71-90 >90
RATING
STREAM CLASS
TOTAL SCORE
% 20
Bank Height 1.0 m
MTMTAMM-moss
D
D
S
��
10
��
106
3
�5
��
3
��3
��10-6
��6
��10
62-66
S2, El results:GR all shallows
High
STREAM ORDER
CO
VE
R

Page: 49
Field Classification (Poulin) for Fort Nelson Forest District VA Poulin & Associates Ltd. – March, 2004
Appendix 3. Field card for 2004 field season with new scores for weighted parameters.This card applies to the Fort Nelson Forest District only.

STREAM NAME (gaz) (local)
SITE # REACH # WATERSHED CODE
NID MAP # WP UTM E UTM N Elev
DATE TIME AGENCY CREW
C Width Wetted W Riffle C C Depth Pool D Res. Pool G %
Figure 5. Version 4 site card for Field Stream Classification (Poulin) in the Fort Nelson Forest District.
DETERMINATION OF STREAM or REACH - Ft. Nelson Forest District Only
Non-classified Drainage (NCD's) are watercourses that do not satisfy the definition of a reach
VESSEL PRESENT Y N-NCD CHANNEL BED SCOURED TO MINERAL SOIL OR WITH ALLUVIUM Y N-ORGANIC BED - NCD
PR
OB
AB
ILIT
Y O
F U
SE
RA
TIN
GS
STREAM CLASS DETERMINATION IN ABSENCE OF FISH SURVEY (POULIN) for Fort Nelson Forest District only
1 -10 2 0 3 5 3 Mainstem 6 ³4 10 200m Rule 6
PointsOrder
<1 -10 1-<2 0 2-<3 5 3-<5 10 5 or > 17
PointsWidth flat 10 0.5-<3 40 ³3-4.5 30 ³4.5-8 20 ³8-12 0 >12 -10
PointsGradient
<0.2 -10 0.2-<0.3 0 0.3 or > 5
PointsCD*
<0.15 -10 0.15-<0.25 0 0.25-<0.3 6 0.3 or > 11
PointsResPool
Points
Points
Points
Morphology
Bed (dom)
Pattern
Nil <0 S6/S5 Low-Nil 0 - <40 S6/S5 Moderate 40 - <80 Survey High 80 or > Survey/S1-S4
Probability of Use by Sport Fish*Impasses not present*
Rating Total Points Class
Total points to establish estimated use by sport fish for each reach assessed. Habitat use varies with species and area. Card validated for use in the Ft. Nelson Forest District only.
Where habitat is present within the usable range (moderate to high risk) undertake a fisheries survey or default stream class to a fish stream. Barriers impede upstream passage of fish. Assess barriers for passage. Undertake a fisheries inventory or default stream class to a fish stream if perennial habitat on moderate to high probability streams occurs above a barrier. Streams upstream of barriers with Nil and Low-nil probability of use and those that simultaneously dry or freeze solid in winter are classified S6/S5. All streams with an average gradient ³20% may be deem ed S6/S5.
LC 0RP 11CP 6SP -10
ST -10SI 5IR 5TM ME IM 3
F/O 0G 6C 11B 6R -10
Points
Points
Bed
Crown C0% 51-20% 521-40% 241-70% 071-90% 0>90% -10
EN -10CO 0FC 5OC 5UC 2
1 2 3 3m 4 or > 1-3 > impasse
Turbid Murky Low Clear
LC RP CP SP
Type: Rock Falls Log/Root Step Gradient/chute-bedrock-channel BeavD Dewatering Overland
P1R9 P2R8 P3R7 P4R6 P5R5 P6R4
CHANNEL
MORPHOLOGY
IMPASSE
COMMENTS
Photo No.
BED MATERIAL Dominant: O F G C B R Subdominant: O F G C B R
D95 (cm) D (cm)
PATTERN TM ME IM IR SI ST
CONFINEMENT EN CO FC OC UN NA
WATER CLARITY
RIPARIAN VEG. IN SH PS YF MF
FOREST COVER:
Type
Height (H)
Pool Depth (PD)
Riffle Crest (RC)
CD (Q1)
WSEL=plunge pool depth at time of survey
Type
Height (H)
Pool Depth (PD)
Riffle Crest (RC)
CD (Q1)
Type
Slope (%)
Length (m)
Dry Low >0-30% Wb Med 30-90% Wb High >90% Wb
Amount D SLarge woody debris (LWD)Small woody debris (SWD)Boulder (B)Undercuts (UT)Deep pool (DP)Overstream vegetation (OV)Instream vegetation (IV)N-none,T-trace (3-5%),M-moderate (5-20%),A-abundant(>20% of site),D-dominant,S-subdominant
ST
RE
AM
CO
VE
R
Flow Stage
Crown Closure 0 1-20 21-40 41-70 71-90 >90
RATING
STREAM CLASS
TOTAL SCORE
%
Bank Height
200 m Rule: >1 m stream within 200 m of 3M or > channel and 0.5-<3% gradient
The FRPA defines a "stream" as a watercourse, including a watercourse that is obscured by overhanging or bridging vegetation or soil mats, that containswater on a perennial or seasonal basis, is scoured by water or contains observable deposits of mineral alluvium, and that has a continuous channel bed thatis 100 m or more in length, or flows directly into a fish stream or a fish-bearing lake or wetland, or a licensed waterworks.
Key for determination of a stream:
IF YES, obtain traverse data. WHERE channel bed is ³100 m, r each is a stream (see exceptions above). Use field data to complete following:
STREAM ORDER
CO
VE
RSITE CARD for FIELD STREAM CLASSIFICATION (POULIN), V04/04, Fort Nelson Forest District only