Fertilizer Granule Processing using Split-Online Granule Processing using... · 1 Fertilizer...
11
1 Fertilizer Processing using Split-Online ® Summary On May 12-13, 2003 Split Engineering preformed preliminary experimentation using the existing pellet processing library of the Split-Online system to measure pelletized fertilizer. The fertilizers used in the experiment came from four samples sent to us by potential clients interested in the merits of on-line real time process control of the manufacture of fertilizer. Three of the samples were opaquely coated and produced encouraging results. The fourth sample appeared to be uncoated and translucent, and was difficult to measure because of its poorly distinguishable pellet boundaries. Because of the difficulty we encountered imaging the uncoated sample, it was treated differently than the other three. For the three coated samples, we calibrated the Split-Online system using the two samples with a known SGN. After calibration we were able to accurately re-measure the samples to well within 1% with very high precision. It appears that the major engineering challenge to designing a system for coated fertilizer pellets will be in the arena of sample presentation. The samples seem very susceptible to size segregation when they are subjected to mechanical vibration, similar to those seen on a conveyor belt where we would typically install our system. However, this experiment has shown that if a representative sample can be prepared, we should be able to accurately measure the fertilizer size statistics. The challenge in building a system to monitor translucent fertilizer is in the image processing. We may have to experiment with other sampling environments and lighting methods to improve the discrimination ability of our existing delineation modules. Samples and Sizes For this experiment we adopted the sizing standards offered by our potential fertilizer clients. They seem to prefer using % retained instead of % passing, and the following two statistics are critical: SGN = Size Guide Number, size at which 50% material is retained, in mm (same as F50) UI = Uniformity index, [95% retained] / [10% retained] (same as F5 / F90) We received four fertilizer samples as follows. Each sample was approximately 2-3 gallons. The sieve analyses were provided by the suppliers and we did not perform any verification. Sample SGN UI ------------------------------------------ ------- -------- 1. DAP (Diammonium phosphate) 270 ? 2. DAP (Diammonium phosphate) 300 ? 3. MAP (Monoammo nium phosphate) ? ? 4. Ammonium sulfate 228 48.7 The two DAP samples (1 and 2) are identical except for their size. The pellets are brown and opaque. The MAP sample 3 is opaque with dark greenish hue, and the size was estimated by comparison to the DAP samples to be approximately SGN 295. The DAP and MAP pellets are coarse but roughly spherical overall. The ammonium sulfate in sample 4 is translucent brown with opacity increasing with pellet size. The pellets resemble stubby cylinders, their length approximately the same as the diameter, and with a more transparent center, like a bead but transparent where a bead is hollow. The clear centers complicate the image processing by providing false edges. An example image of each sample is shown below. They are all at the same scale; for reference, the largest pellet in sample 2 is approximately 5mm across.
Transcript of Fertilizer Granule Processing using Split-Online Granule Processing using... · 1 Fertilizer...
1
Fertilizer Processing using Split-Online®
Summary On May 12-13, 2003 Split Engineering preformed preliminary experimentation using the existing pellet processing library of the Split-Online system to measure pelletized fertilizer. The fertilizers used in the experiment came from four samples sent to us by potential clients interested in the merits of on-line real time process control of the manufacture of fertilizer. Three of the samples were opaquely coated and produced encouraging results. The fourth sample appeared to be uncoated and translucent, and was difficult to measure because of its poorly distinguishable pellet boundaries. Because of the difficulty we encountered imaging the uncoated sample, it was treated differently than the other three. For the three coated samples, we calibrated the Split-Online system using the two samples with a known SGN. After calibration we were able to accurately re-measure the samples to well within 1% with very high precision. It appears that the major engineering challenge to designing a system for coated fertilizer pellets will be in the arena of sample presentation. The samples seem very susceptible to size segregation when they are subjected to mechanical vibration, similar to those seen on a conveyor belt where we would typically install our system. However, this experiment has shown that if a representative sample can be prepared, we should be able to accurately measure the fertilizer size statistics. The challenge in building a system to monitor translucent fertilizer is in the image processing. We may have to experiment with other sampling environments and lighting methods to improve the discrimination ability of our existing delineation modules.
Samples and Sizes For this experiment we adopted the sizing standards offered by our potential fertilizer clients. They seem to prefer using % retained instead of % passing, and the following two statistics are critical: SGN = Size Guide Number, size at which 50% material is retained, in mm (same as F50) UI = Uniformity index, [95% retained] / [10% retained] (same as F5 / F90) We received four fertilizer samples as follows. Each sample was approximately 2-3 gallons. The sieve analyses were provided by the suppliers and we did not perform any verification.
Sample SGN UI ------------------------------------------ ------- -------- 1. DAP (Diammonium phosphate) 270 ? 2. DAP (Diammonium phosphate) 300 ? 3. MAP (Monoammo nium phosphate) ? ? 4. Ammonium sulfate 228 48.7
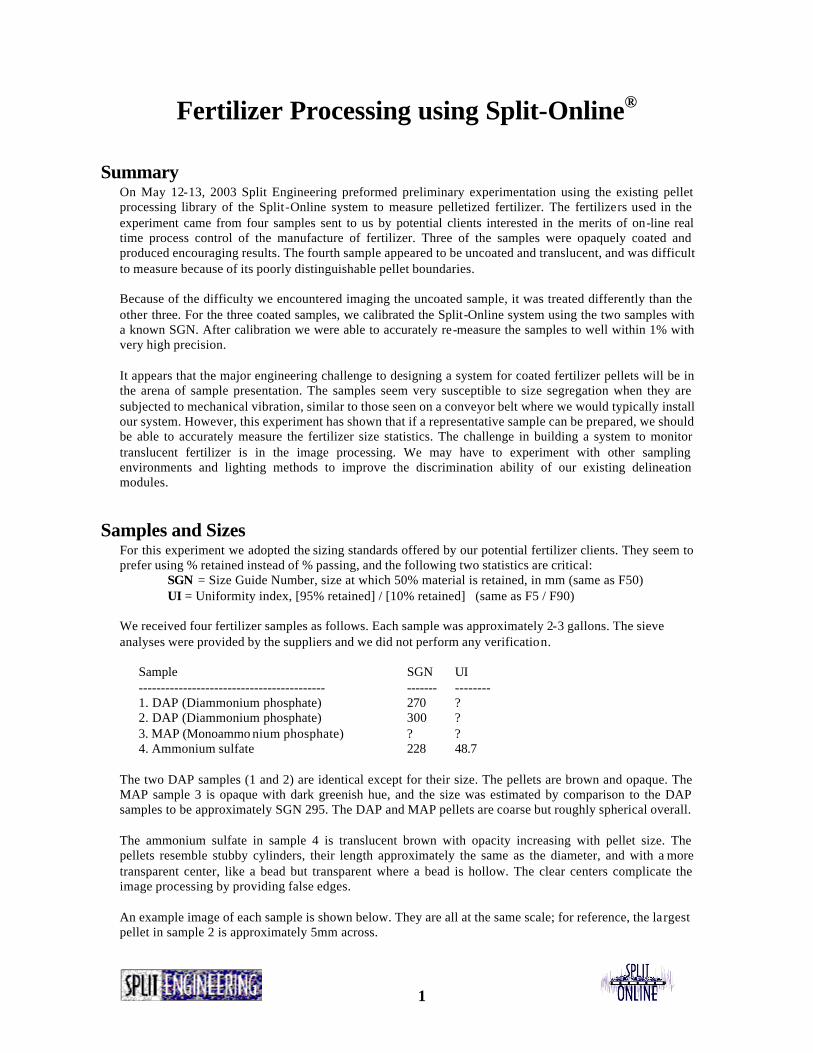
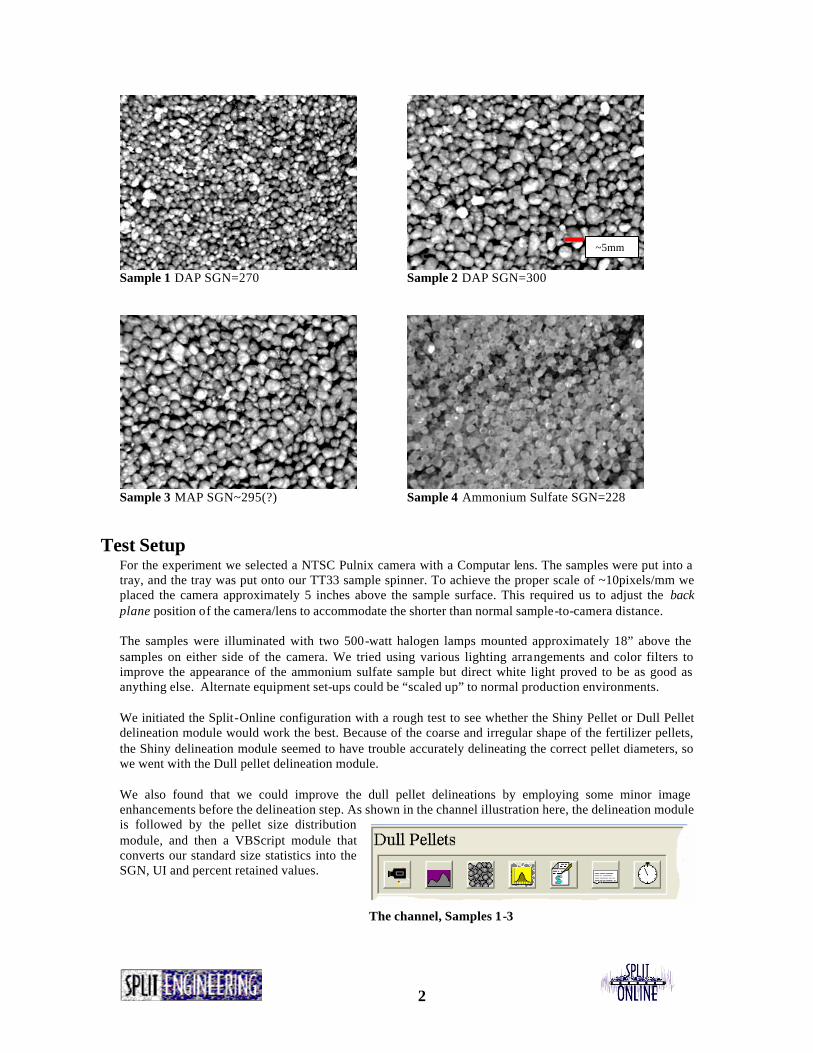
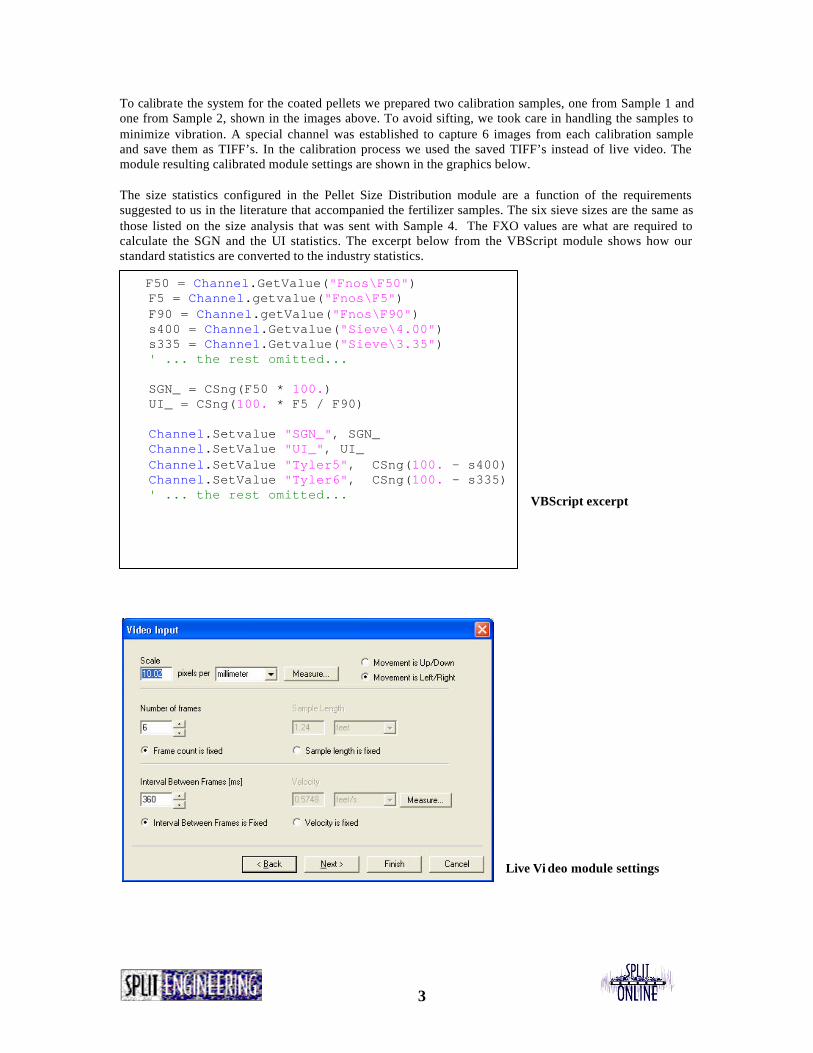
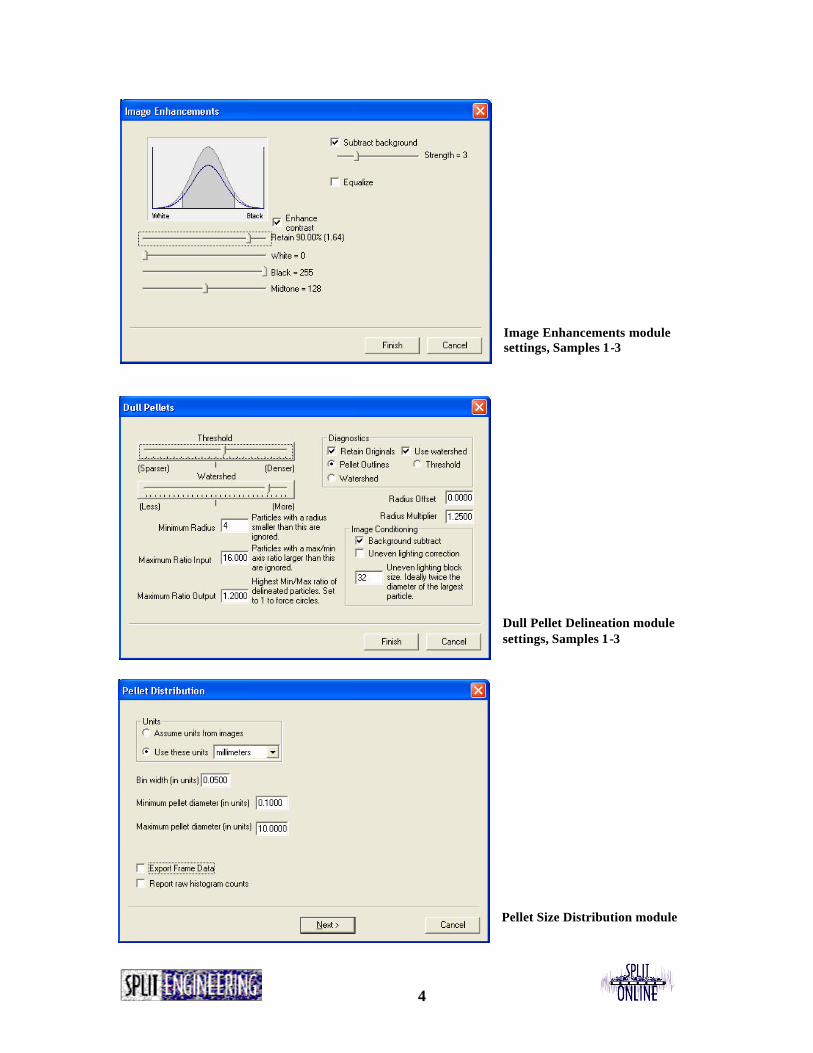
The two DAP samples (1 and 2) are identical except for their size. The pellets are brown and opaque. The MAP sample 3 is opaque with dark greenish hue, and the size was estimated by comparison to the DAP samples to be approximately SGN 295. The DAP and MAP pellets are coarse but roughly spherical overall. The ammonium sulfate in sample 4 is translucent brown with opacity increasing with pellet size. The pellets resemble stubby cylinders, their length approximately the same as the diameter, and with a more transparent center, like a bead but transparent where a bead is hollow. The clear centers complicate the image processing by providing false edges. An example image of each sample is shown below. They are all at the same scale; for reference, the largest pellet in sample 2 is approximately 5mm across.
2
Sample 1 DAP SGN=270 Sample 2 DAP SGN=300
Sample 3 MAP SGN~295(?) Sample 4 Ammonium Sulfate SGN=228
Test Setup For the experiment we selected a NTSC Pulnix camera with a Computar lens. The samples were put into a tray, and the tray was put onto our TT33 sample spinner. To achieve the proper scale of ~10pixels/mm we placed the camera approximately 5 inches above the sample surface. This required us to adjust the back plane position of the camera/lens to accommodate the shorter than normal sample-to-camera distance. The samples were illuminated with two 500-watt halogen lamps mounted approximately 18” above the samples on either side of the camera. We tried using various lighting arrangements and color filters to improve the appearance of the ammonium sulfate sample but direct white light proved to be as good as anything else. Alternate equipment set-ups could be “scaled up” to normal production environments. We initiated the Split-Online configuration with a rough test to see whether the Shiny Pellet or Dull Pellet delineation module would work the best. Because of the coarse and irregular shape of the fertilizer pellets, the Shiny delineation module seemed to have trouble accurately delineating the correct pellet diameters, so we went with the Dull pellet delineation module. We also found that we could improve the dull pellet delineations by employing some minor image enhancements before the delineation step. As shown in the channel illustration here, the delineation module is followed by the pellet size distribution module, and then a VBScript module that converts our standard size statistics into the SGN, UI and percent retained values.
The channel, Samples 1-3
~5mm
3
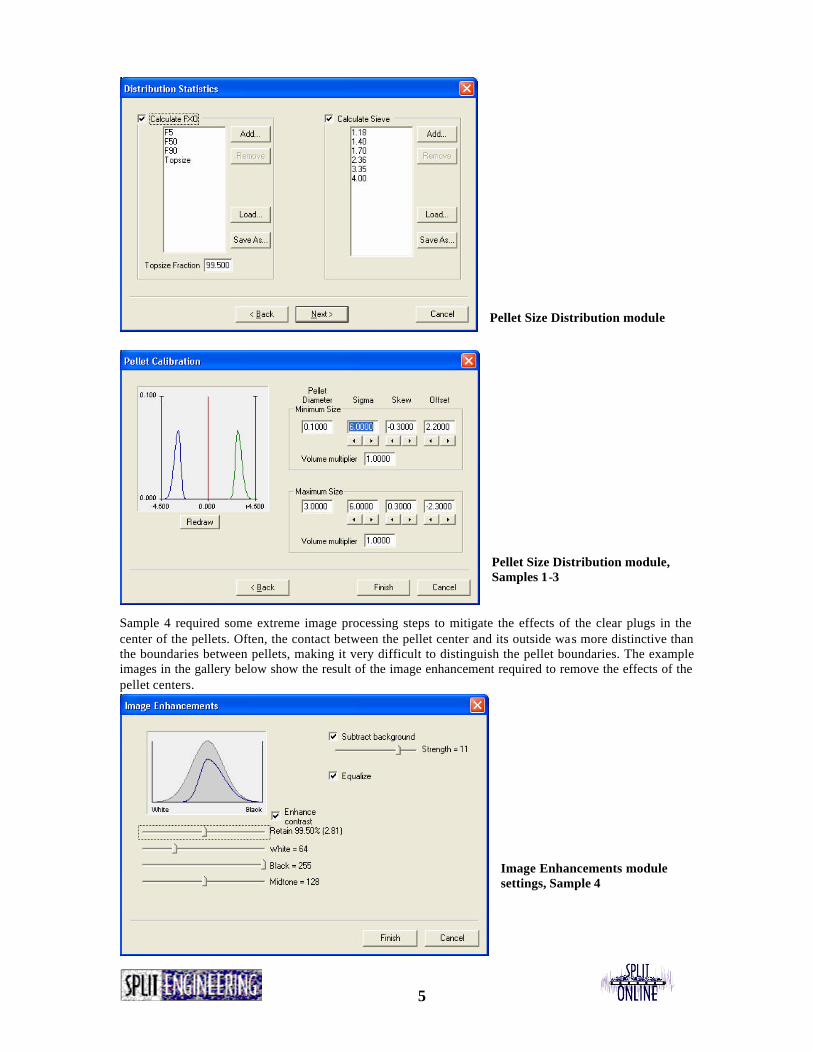
To calibrate the system for the coated pellets we prepared two calibration samples, one from Sample 1 and one from Sample 2, shown in the images above. To avoid sifting, we took care in handling the samples to minimize vibration. A special channel was established to capture 6 images from each calibration sample and save them as TIFF’s. In the calibration process we used the saved TIFF’s instead of live video. The module resulting calibrated module settings are shown in the graphics below. The size statistics configured in the Pellet Size Distribution module are a function of the requirements suggested to us in the literature that accompanied the fertilizer samples. The six sieve sizes are the same as those listed on the size analysis that was sent with Sample 4. The FXO values are what are required to calculate the SGN and the UI statistics. The excerpt below from the VBScript module shows how our standard statistics are converted to the industry statistics.
VBScript excerpt
Live Vi deo module settings
F50 = Channel.GetValue("Fnos\F50") F5 = Channel.getvalue("Fnos\F5") F90 = Channel.getValue("Fnos\F90") s400 = Channel.Getvalue("Sieve\4.00") s335 = Channel.Getvalue("Sieve\3.35") ' ... the rest omitted... SGN_ = CSng(F50 * 100.) UI_ = CSng(100. * F5 / F90) Channel.Setvalue "SGN_", SGN_ Channel.SetValue "UI_", UI_ Channel.SetValue "Tyler5", CSng(100. - s400) Channel.SetValue "Tyler6", CSng(100. - s335) ' ... the rest omitted...
4
Image Enhancements module settings, Samples 1-3
Dull Pellet Delineation module settings, Samples 1-3
Pellet Size Distribution module
5
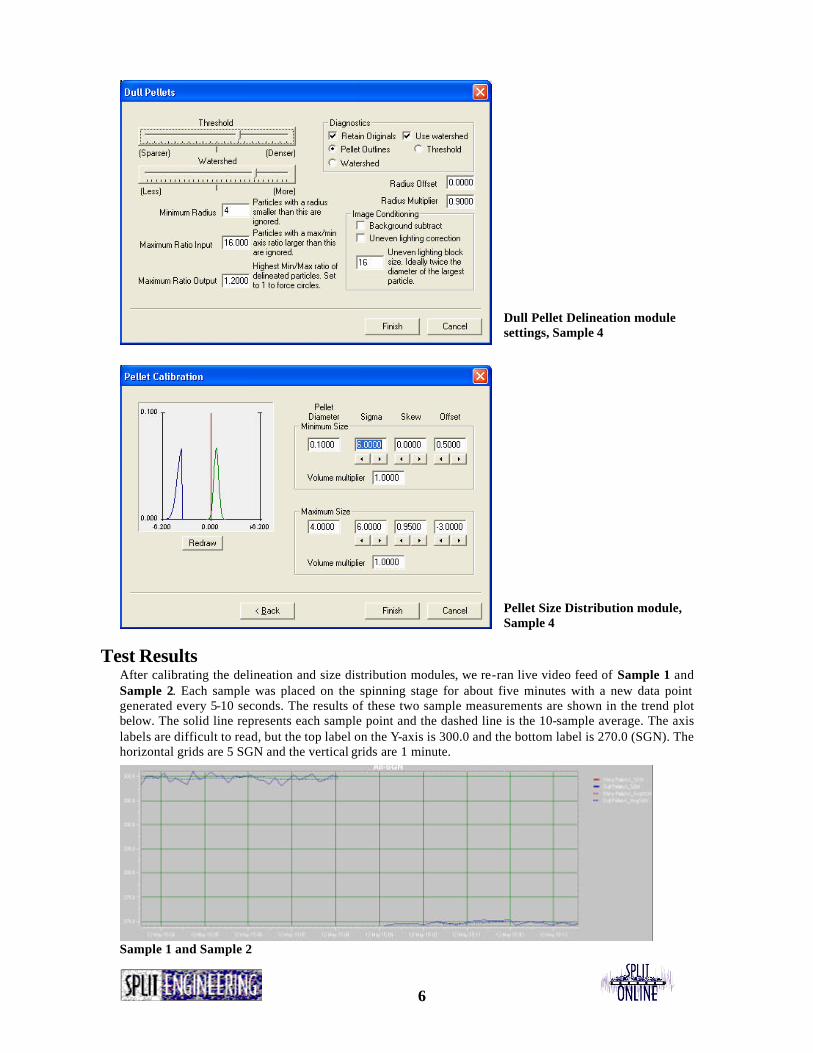
Pellet Size Distribution module Pellet Size Distribution module, Samples 1-3
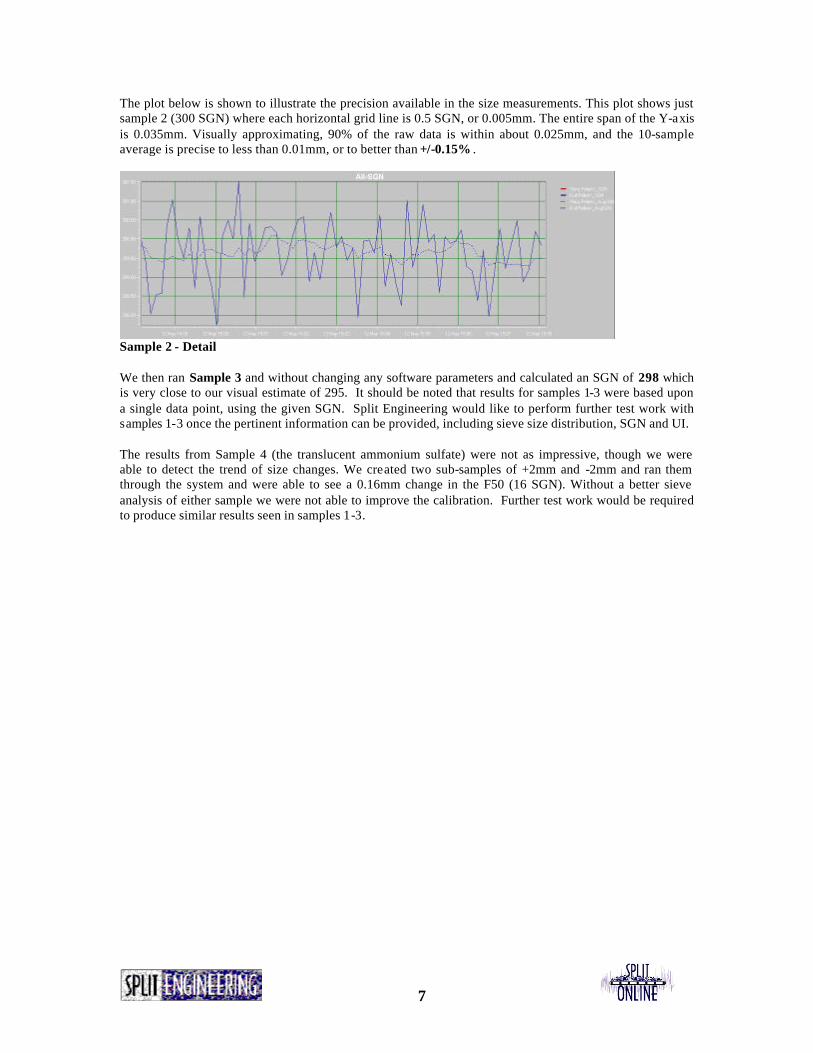
Sample 4 required some extreme image processing steps to mitigate the effects of the clear plugs in the center of the pellets. Often, the contact between the pellet center and its outside was more distinctive than the boundaries between pellets, making it very difficult to distinguish the pellet boundaries. The example images in the gallery below show the result of the image enhancement required to remove the effects of the pellet centers.
Image Enhancements module settings, Sample 4
6
Dull Pellet Delineation module settings, Sample 4 Pellet Size Distribution module, Sample 4
Test Results
After calibrating the delineation and size distribution modules, we re-ran live video feed of Sample 1 and Sample 2. Each sample was placed on the spinning stage for about five minutes with a new data point generated every 5-10 seconds. The results of these two sample measurements are shown in the trend plot below. The solid line represents each sample point and the dashed line is the 10-sample average. The axis labels are difficult to read, but the top label on the Y-axis is 300.0 and the bottom label is 270.0 (SGN). The horizontal grids are 5 SGN and the vertical grids are 1 minute.
Sample 1 and Sample 2
7
The plot below is shown to illustrate the precision available in the size measurements. This plot shows just sample 2 (300 SGN) where each horizontal grid line is 0.5 SGN, or 0.005mm. The entire span of the Y-axis is 0.035mm. Visually approximating, 90% of the raw data is within about 0.025mm, and the 10-sample average is precise to less than 0.01mm, or to better than +/-0.15% .
Sample 2 - Detail We then ran Sample 3 and without changing any software parameters and calculated an SGN of 298 which is very close to our visual estimate of 295. It should be noted that results for samples 1-3 were based upon a single data point, using the given SGN. Split Engineering would like to perform further test work with samples 1-3 once the pertinent information can be provided, including sieve size distribution, SGN and UI. The results from Sample 4 (the translucent ammonium sulfate) were not as impressive, though we were able to detect the trend of size changes. We created two sub-samples of +2mm and -2mm and ran them through the system and were able to see a 0.16mm change in the F50 (16 SGN). Without a better sieve analysis of either sample we were not able to improve the calibration. Further test work would be required to produce similar results seen in samples 1-3.
8
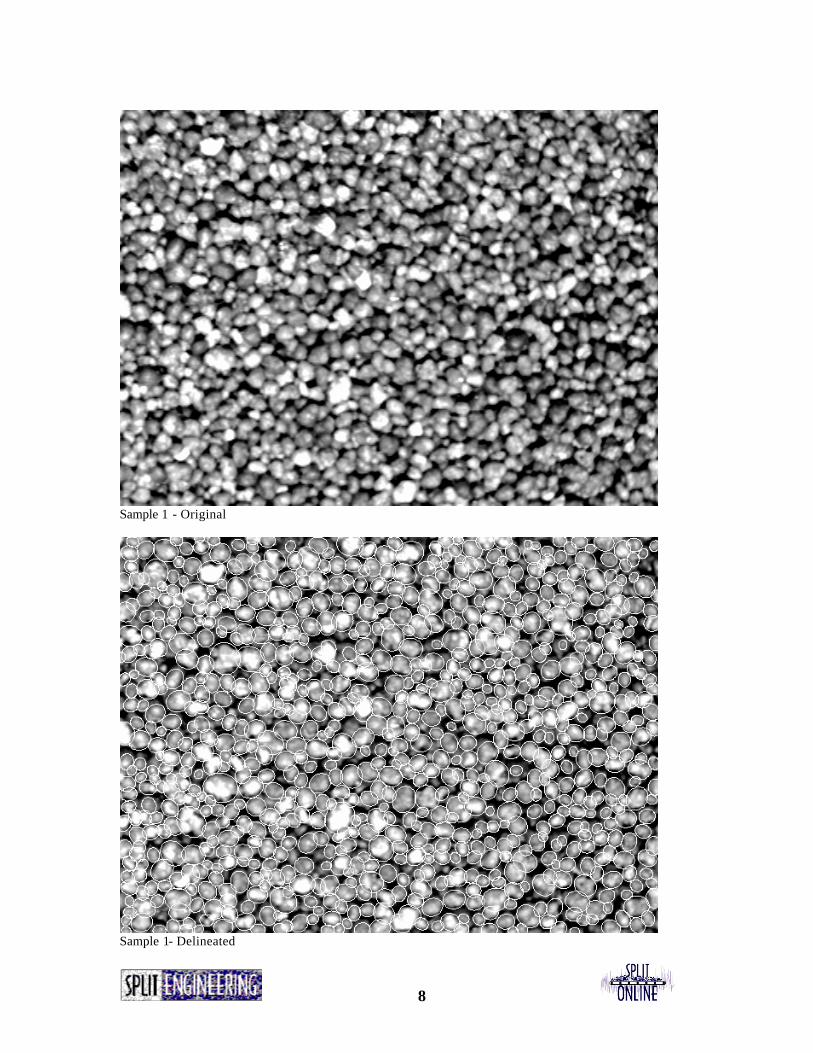
Sample 1 - Original
Sample 1- Delineated
9
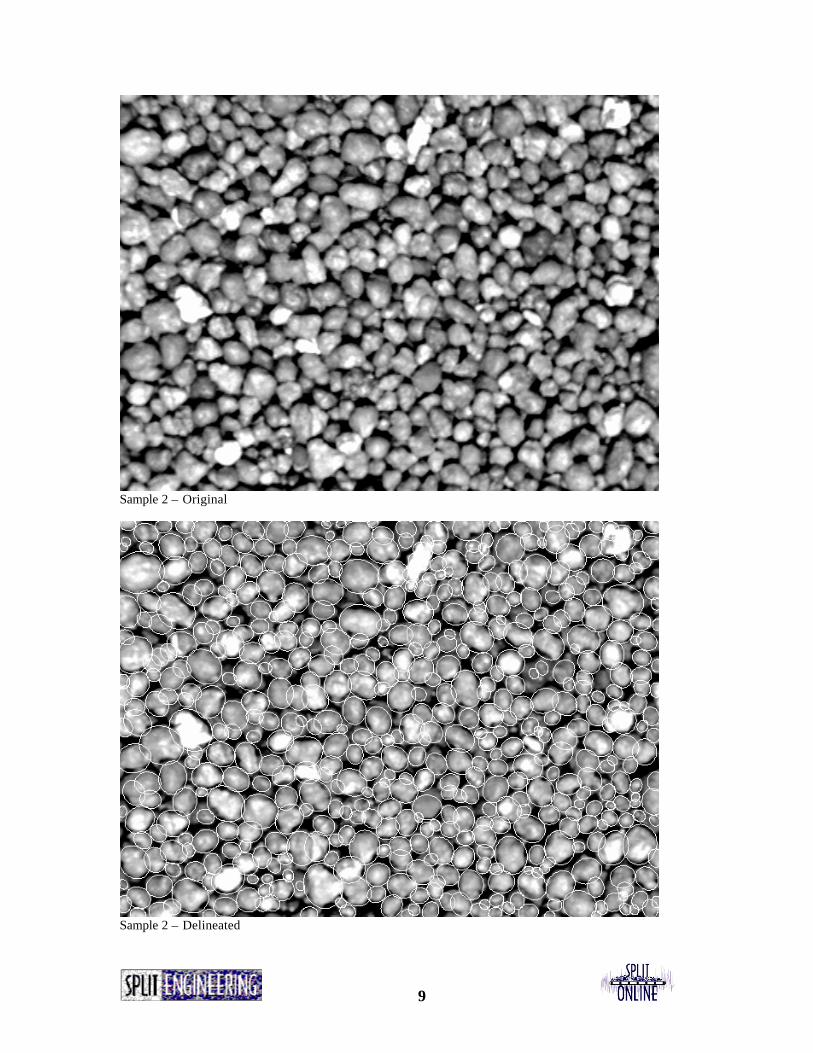
Sample 2 – Original
Sample 2 – Delineated
10
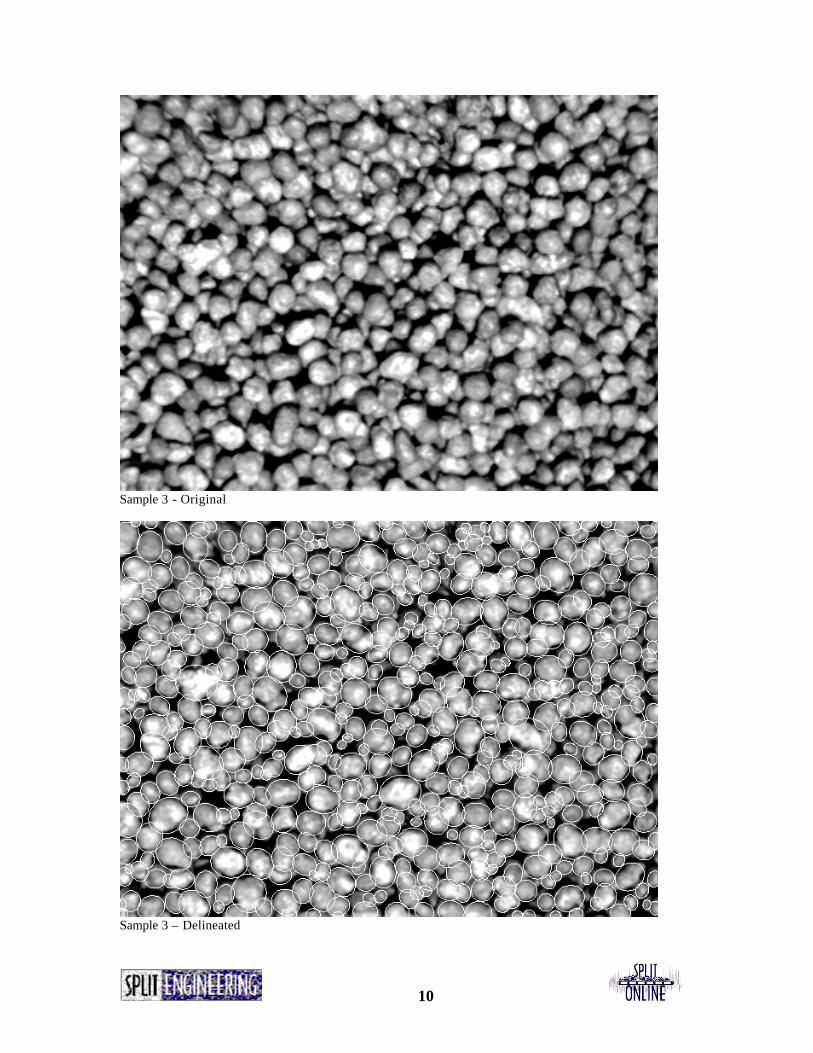
Sample 3 - Original
Sample 3 – Delineated

11
Sample 4 – Heavily processed original
Sample 4 - Delineated