FEDERAL RESERVE statistical release fileFEDERAL RESERVE statistical release * y
10
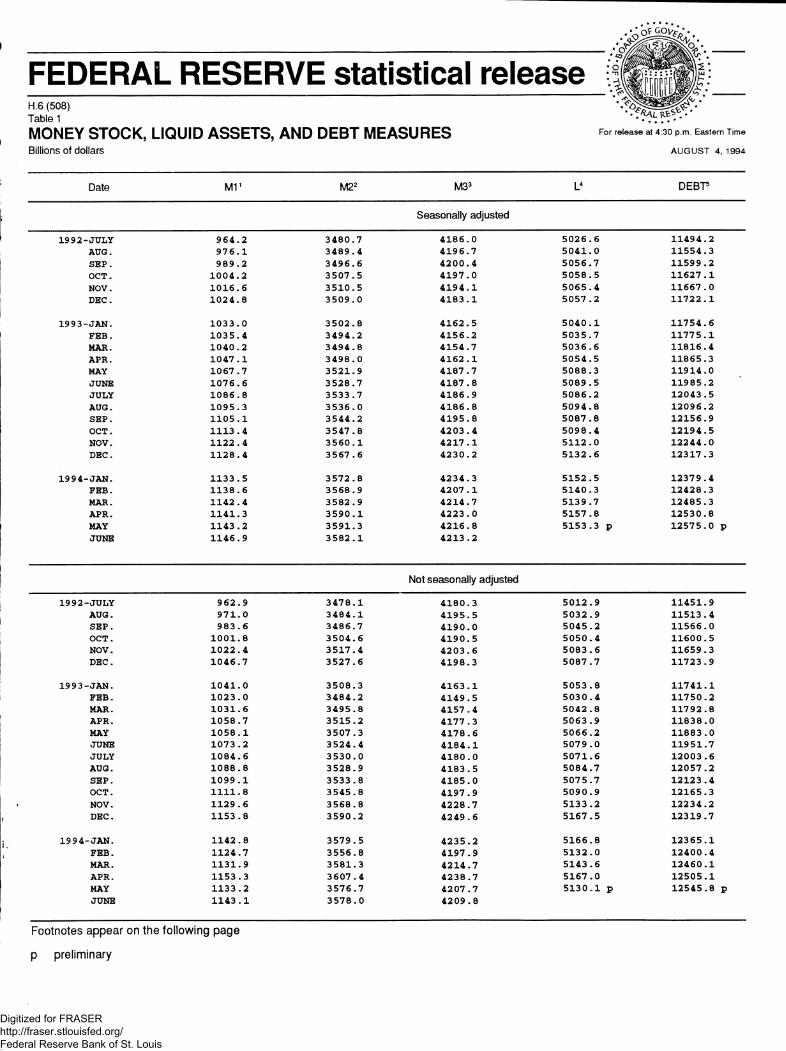
FEDERAL RESERVE statistical release * <o/ y H.6 (508) Table 1 MONEY STOCK, LIQUID ASSETS, AND DEBT MEASURES Billions of dollars For release at 4:30 p.m. Eastern Time AUGUST 4, 1994 Date M1 1 M2 2 M3 3 L 4 DEBT 5 Seasonally adjusted 1992-JULY 964.2 3480.7 4186.0 5026.6 11494.2 AUG. 976.1 3489.4 4196.7 5041.0 11554.3 SEP. 989.2 3496.6 4200.4 5056.7 11599.2 OCT. 1004.2 3507.5 4197.0 5058.5 11627.1 NOV. 1016.6 3510.5 4194.1 5065.4 11667.0 DEC. 1024.8 3509.0 4183.1 5057.2 11722.1 1993-JAN. 1033.0 3502.8 4162.5 5040.1 11754.6 FEB. 1035.4 3494.2 4156.2 5035.7 11775.1 MAR. 1040.2 3494.8 4154.7 5036.6 11816.4 APR. 1047.1 3498.0 4162.1 5054.5 11865.3 MAY 1067.7 3521.9 4187.7 5088.3 11914.0 JUNE 1076.6 3528.7 4187.8 5089.5 11985.2 JULY 1086.8 3533.7 4186.9 5086.2 12043.5 AUG. 1095.3 3536.0 4186.8 5094.8 12096.2 SEP. 1105.1 3544.2 4195.8 5087.8 12156.9 OCT. 1113.4 3547.8 4203.4 5098.4 12194.5 NOV. 1122.4 3560.1 4217.1 5112.0 12244.0 DEC. 1128.4 3567.6 4230.2 5132.6 12317.3 1994-JAN. 1133.5 3572.8 4234.3 5152.5 12379.4 FEB. 1138.6 3568.9 4207.1 5140.3 12428.3 MAR. 1142.4 3582.9 4214.7 5139.7 12485.3 APR. 1141.3 3590.1 4223.0 5157.8 12530.8 MAY 1143.2 3591.3 4216.8 5153.3 p 12575.0 p JUNE 1146.9 3582.1 4213.2 Not seasonally adjusted 1992-JULY AUG. SEP. OCT. NOV. DEC. 962.9 971.0 983.6 1001.8 1022.4 1046.7 3478.1 3484.1 3486.7 3504.6 3517.4 3527.6 4180.3 4195.5 4190.0 4190.5 4203.6 4198.3 5012.9 5032.9 5045.2 5050.4 5083.6 5087.7 11451.9 11513.4 11566.0 11600.5 11659.3 11723.9 1993-JAN. FEB. MAR. APR. MAY JUNE JULY AUG. SEP. OCT. NOV. DEC. 1041.0 1023.0 1031.6 1058.7 1058.1 1073.2 1084.6 1088.8 1099.1 1111.8 1129.6 1153.8 3508.3 3484.2 3495.8 3515.2 3507.3 3524.4 3530.0 3528.9 3533.8 3545.8 3568.8 3590.2 4163.1 4149.5 4157.4 4177.3 4178.6 4184 4180 4183 4185 4197 4228.7 4249.6 5053.8 5030.4 5042.8 5063.9 5066.2 5079.0 5071.6 5084.7 5075.7 5090.9 5133.2 5167.5 11741.1 11750.2 11792.8 11838.0 11883.0 11951.7 12003.6 12057.2 12123.4 12165.3 12234.2 12319.7 1994-JAN. FEB. MAR. APR. MAY JUNE 1142.8 1124.7 1131.9 1153.3 1133.2 1143.1 3579.5 3556.8 3581.3 3607.4 3576.7 3578.0 4235.2 4197.9 4214.7 4238.7 4207.7 4209.8 5166.8 5132.0 5143.6 5167.0 5130.1 p 12365.1 12400.4 12460.1 12505.1 12545.8 p Footnotes appear on the following page p preliminary Digitized for FRASER http://fraser.stlouisfed.org/ Federal Reserve Bank of St. Louis
Transcript of FEDERAL RESERVE statistical release fileFEDERAL RESERVE statistical release * y
FEDERAL RESERVE statistical release * <o/y
H.6 (508) Table 1 MONEY STOCK, LIQUID ASSETS, AND DEBT MEASURES Billions of dollars
For release at 4:30 p.m. Eastern Time
AUGUST 4, 1994
Date M11 M22 M33 L4 DEBT5
Seasonally adjusted
1 9 9 2 - J U L Y 9 6 4 . 2 3 4 8 0 . 7 4 1 8 6 . 0 5 0 2 6 . 6 1 1 4 9 4 . 2 AUG. 9 7 6 . 1 3 4 8 9 . 4 4 1 9 6 . 7 5 0 4 1 . 0 1 1 5 5 4 . 3 SEP. 9 8 9 . 2 3 4 9 6 . 6 4 2 0 0 . 4 5 0 5 6 . 7 1 1 5 9 9 . 2 OCT. 1 0 0 4 . 2 3 5 0 7 . 5 4 1 9 7 . 0 5 0 5 8 . 5 1 1 6 2 7 . 1 NOV. 1 0 1 6 . 6 3 5 1 0 . 5 4 1 9 4 . 1 5 0 6 5 . 4 1 1 6 6 7 . 0 DEC. 1 0 2 4 . 8 3 5 0 9 . 0 4 1 8 3 . 1 5 0 5 7 . 2 1 1 7 2 2 . 1
1 9 9 3 - J A N . 1 0 3 3 . 0 3 5 0 2 . 8 4 1 6 2 . 5 5 0 4 0 . 1 1 1 7 5 4 . 6 F E B . 1 0 3 5 . 4 3 4 9 4 . 2 4 1 5 6 . 2 5 0 3 5 . 7 1 1 7 7 5 . 1 MAR. 1 0 4 0 . 2 3 4 9 4 . 8 4 1 5 4 . 7 5 0 3 6 . 6 1 1 8 1 6 . 4 APR. 1 0 4 7 . 1 3 4 9 8 . 0 4 1 6 2 . 1 5 0 5 4 . 5 1 1 8 6 5 . 3 MAY 1 0 6 7 . 7 3 5 2 1 . 9 4 1 8 7 . 7 5 0 8 8 . 3 1 1 9 1 4 . 0 JUNE 1 0 7 6 . 6 3 5 2 8 . 7 4 1 8 7 . 8 5 0 8 9 . 5 1 1 9 8 5 . 2 JULY 1 0 8 6 . 8 3 5 3 3 . 7 4 1 8 6 . 9 5 0 8 6 . 2 1 2 0 4 3 . 5 AUG. 1 0 9 5 . 3 3 5 3 6 . 0 4 1 8 6 . 8 5 0 9 4 . 8 1 2 0 9 6 . 2 SEP. 1 1 0 5 . 1 3 5 4 4 . 2 4 1 9 5 . 8 5 0 8 7 . 8 1 2 1 5 6 . 9 OCT. 1 1 1 3 . 4 3 5 4 7 . 8 4 2 0 3 . 4 5 0 9 8 . 4 1 2 1 9 4 . 5 NOV. 1 1 2 2 . 4 3 5 6 0 . 1 4 2 1 7 . 1 5 1 1 2 . 0 1 2 2 4 4 . 0 DEC. 1 1 2 8 . 4 3 5 6 7 . 6 4 2 3 0 . 2 5 1 3 2 . 6 1 2 3 1 7 . 3
1 9 9 4 - J A N . 1 1 3 3 . 5 3 5 7 2 . 8 4 2 3 4 . 3 5 1 5 2 . 5 1 2 3 7 9 . 4 F E B . 1 1 3 8 . 6 3 5 6 8 . 9 4 2 0 7 . 1 5 1 4 0 . 3 1 2 4 2 8 . 3 MAR. 1 1 4 2 . 4 3 5 8 2 . 9 4 2 1 4 . 7 5 1 3 9 . 7 1 2 4 8 5 . 3 APR. 1 1 4 1 . 3 3 5 9 0 . 1 4 2 2 3 . 0 5 1 5 7 . 8 1 2 5 3 0 . 8 MAY 1 1 4 3 . 2 3 5 9 1 . 3 4 2 1 6 . 8 5 1 5 3 . 3 p 1 2 5 7 5 . 0 p JUNE 1 1 4 6 . 9 3 5 8 2 . 1 4 2 1 3 . 2
Not seasonally adjusted
1 9 9 2 - J U L Y AUG. S E P . OCT. NOV. DEC.
9 6 2 . 9 9 7 1 . 0 9 8 3 . 6
1 0 0 1 . 8 1 0 2 2 . 4 1 0 4 6 . 7
3 4 7 8 . 1 3 4 8 4 . 1 3 4 8 6 . 7 3 5 0 4 . 6 3 5 1 7 . 4 3 5 2 7 . 6
4 1 8 0 . 3 4 1 9 5 . 5 4 1 9 0 . 0 4 1 9 0 . 5 4 2 0 3 . 6 4 1 9 8 . 3
5 0 1 2 . 9 5 0 3 2 . 9 5 0 4 5 . 2 5 0 5 0 . 4 5 0 8 3 . 6 5 0 8 7 . 7
1 1 4 5 1 . 9 1 1 5 1 3 . 4 1 1 5 6 6 . 0 1 1 6 0 0 . 5 1 1 6 5 9 . 3 1 1 7 2 3 . 9
1 9 9 3 - J A N . F E B . MAR. APR. MAY JUNE JULY AUG. SEP. OCT. NOV. DEC.
1 0 4 1 . 0 1 0 2 3 . 0 1 0 3 1 . 6 1 0 5 8 . 7 1 0 5 8 . 1 1 0 7 3 . 2 1 0 8 4 . 6 1 0 8 8 . 8 1 0 9 9 . 1 1111.8 1 1 2 9 . 6 1 1 5 3 . 8
3 5 0 8 . 3 3 4 8 4 . 2 3 4 9 5 . 8 3 5 1 5 . 2 3 5 0 7 . 3 3 5 2 4 . 4 3 5 3 0 . 0 3 5 2 8 . 9 3 5 3 3 . 8 3 5 4 5 . 8 3 5 6 8 . 8 3 5 9 0 . 2
4 1 6 3 . 1 4 1 4 9 . 5 4 1 5 7 . 4 4 1 7 7 . 3 4 1 7 8 . 6 4 1 8 4 4 1 8 0 4 1 8 3 4 1 8 5 4 1 9 7 4 2 2 8 . 7 4 2 4 9 . 6
5 0 5 3 . 8 5 0 3 0 . 4 5 0 4 2 . 8 5 0 6 3 . 9 5 0 6 6 . 2 5 0 7 9 . 0 5 0 7 1 . 6 5 0 8 4 . 7 5 0 7 5 . 7 5 0 9 0 . 9 5 1 3 3 . 2 5 1 6 7 . 5
1 1 7 4 1 . 1 1 1 7 5 0 . 2 1 1 7 9 2 . 8 1 1 8 3 8 . 0 1 1 8 8 3 . 0 1 1 9 5 1 . 7 1 2 0 0 3 . 6 1 2 0 5 7 . 2 1 2 1 2 3 . 4 1 2 1 6 5 . 3 1 2 2 3 4 . 2 1 2 3 1 9 . 7
1 9 9 4 - J A N . F E B . MAR. APR. MAY JUNE
1 1 4 2 . 8 1 1 2 4 . 7 1 1 3 1 . 9 1 1 5 3 . 3 1 1 3 3 . 2 1 1 4 3 . 1
3 5 7 9 . 5 3 5 5 6 . 8 3 5 8 1 . 3 3 6 0 7 . 4 3 5 7 6 . 7 3 5 7 8 . 0
4 2 3 5 . 2 4 1 9 7 . 9 4 2 1 4 . 7 4 2 3 8 . 7 4 2 0 7 . 7 4 2 0 9 . 8
5 1 6 6 . 8 5 1 3 2 . 0 5 1 4 3 . 6 5 1 6 7 . 0 5 1 3 0 . 1 p
1 2 3 6 5 . 1 1 2 4 0 0 . 4 1 2 4 6 0 . 1 1 2 5 0 5 . 1 1 2 5 4 5 . 8 p
Footnotes appear on the following page
p preliminary
Digitized for FRASER http://fraser.stlouisfed.org/ Federal Reserve Bank of St. Louis
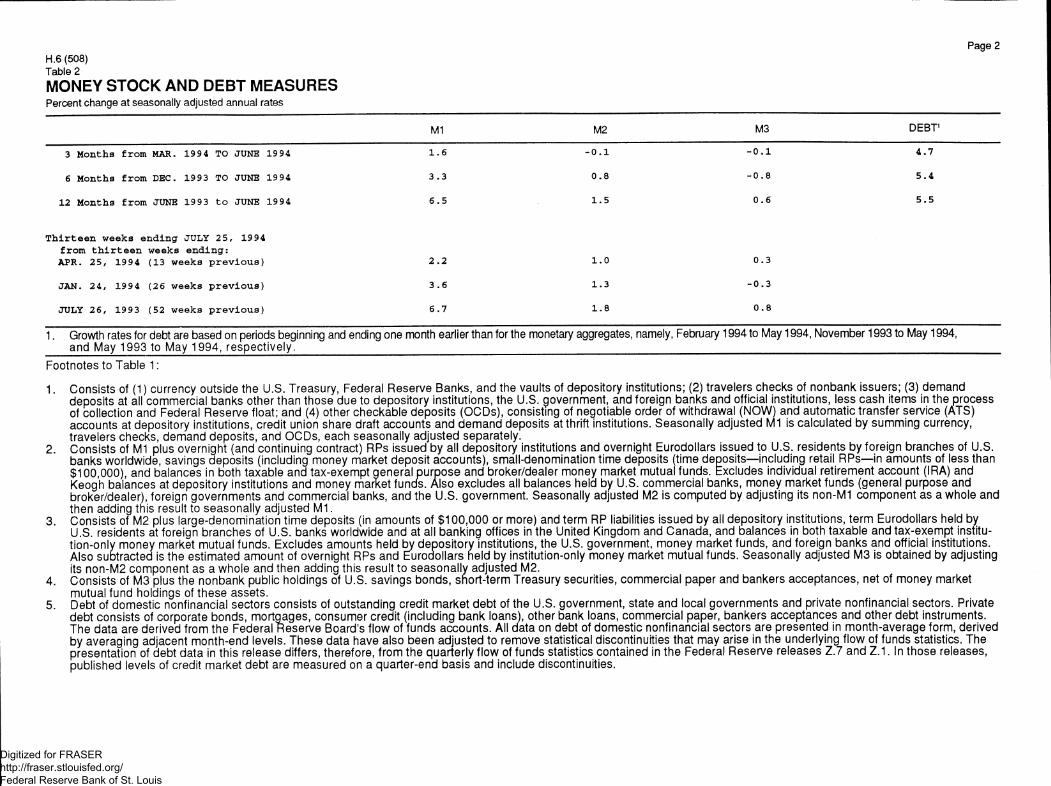
Page 2 H.6 (508) Table 2 MONEY STOCK AND DEBT MEASURES Percent change at seasonally adjusted annual rates
M1 M2 M3 DEBT1
3 M o n t h s f r o m MAR. 1994 TO JUNE 1994 1 . 6 - 0 . 1 - 0 . 1 4 . 7
6 M o n t h s f r o m DEC. 1993 TO JUNE 1994 3 . 3 0 . 8 CD
U1
12 M o n t h s f r o m JUNE 1993 t o JUNE 1994 6 . 5 1 . 5 0 . 6 5 . 5
T h i r t e e n w e e k s e n d i n g JULY 2 5 , 19 94 f r o m t h i r t e e n w e e k s e n d i n g :
APR. 2 5 , 1994 (13 w e e k s p r e v i o u s ) 2 . 2 1 . 0 0 . 3
JAN. 2 4 , 19 9 4 ( 2 6 w e e k s p r e v i o u s ) 3 . 6 1 . 3 - 0 . 3
JULY 2 6 , 19 93 (52 w e e k s p r e v i o u s ) 6 . 7 1 . 8 0 . 8
1. Growth rates for debt are based on periods beginning and ending one and May 1993 to May 1994, respectively.
month earlier than for the monetary aggregates, namely, February 1994 to May 1994, November 1993 to May 1994,
Footnotes to Table 1:
1. Consists of (1) currency outside the U.S. Treasury, Federal Reserve Banks, and the vaults of depository institutions; (2) travelers checks of nonbank issuers; (3) demand deposits at all commercial banks other than those due to depository institutions, the U.S. government, and foreign banks and official institutions, less cash items in the process of collection and Federal Reserve float; and (4) other checkable deposits (OCDs), consisting of negotiable order of withdrawal (NOW) and automatic transfer service (ATS) accounts at depository institutions, credit union share draft accounts and demand deposits at thrift institutions. Seasonally adjusted M1 is calculated by summing currency, travelers checks, demand deposits, and OCDs, each seasonally adjusted separately.
2. Consists of M1 plus overnight (and continuing contract) RPs issued by all depository institutions and overnight Eurodollars issued to U.S. residents by foreign branches of U.S. banks worldwide, savings deposits (including money market deposit accounts), small-denomination time deposits (time deposits—including retail RPs—in amounts of less than $100,000), and balances in both taxable and tax-exempt general purpose and broker/dealer money market mutual funds. Excludes individual retirement account (IRA) and Keogh balances at depository institutions and money market funds. Also excludes all balances held by U.S. commercial banks, money market funds (general purpose and broker/dealer), foreign governments and commercial banks, and the U.S. government. Seasonally adjusted M2 is computed by adjusting its non-Mi component as a whole and then adding this result to seasonally adjusted M1.
3. Consists of M2 plus large-denomination time deposits (in amounts of $100,000 or more) and term RP liabilities issued by all depository institutions, term Eurodollars held by U.S. residents at foreign branches of U.S. banks worldwide and at all banking offices in the United Kingdom and Canada, and balances in both taxable and tax-exempt institu-tion-only money market mutual funds. Excludes amounts held by depository institutions, the U.S. government, money market funds, and foreign banks and official institutions. Also subtracted is the estimated amount of overnight RPs and Eurodollars held by institution-only money market mutual funds. Seasonally adjusted M3 is obtained by adjusting its non-M2 component as a whole and then adding this result to seasonally adjusted M2.
4. Consists of M3 plus the nonbank public holdings of U.S. savings bonds, snort-term Treasury securities, commercial paper and bankers acceptances, net of money market mutual fund holdings of these assets.
5. Debt of domestic nonfinancial sectors consists of outstanding credit market debt of the U.S. government, state and local governments and private nonfinancial sectors. Private debt consists of corporate bonds, mortgages, consumer credit (including bank loans), other bank loans, commercial paper, bankers acceptances and other debt instruments. The data are derived from the Federal Reserve Board's flow of funds accounts. All data on debt of domestic nonfinancial sectors are presented in month-average form, derived by averaging adjacent month-end levels. These data have also been adjusted to remove statistical discontinuities that may arise in the underlying flow of funds statistics. The presentation of debt data in this release differs, therefore, from the quarterly flow of funds statistics contained in the Federal Reserve releases Z.7 and Z.1. In those releases, published levels of credit market debt are measured on a quarter-end basis and include discontinuities.
Digitized for FRASER http://fraser.stlouisfed.org/ Federal Reserve Bank of St. Louis
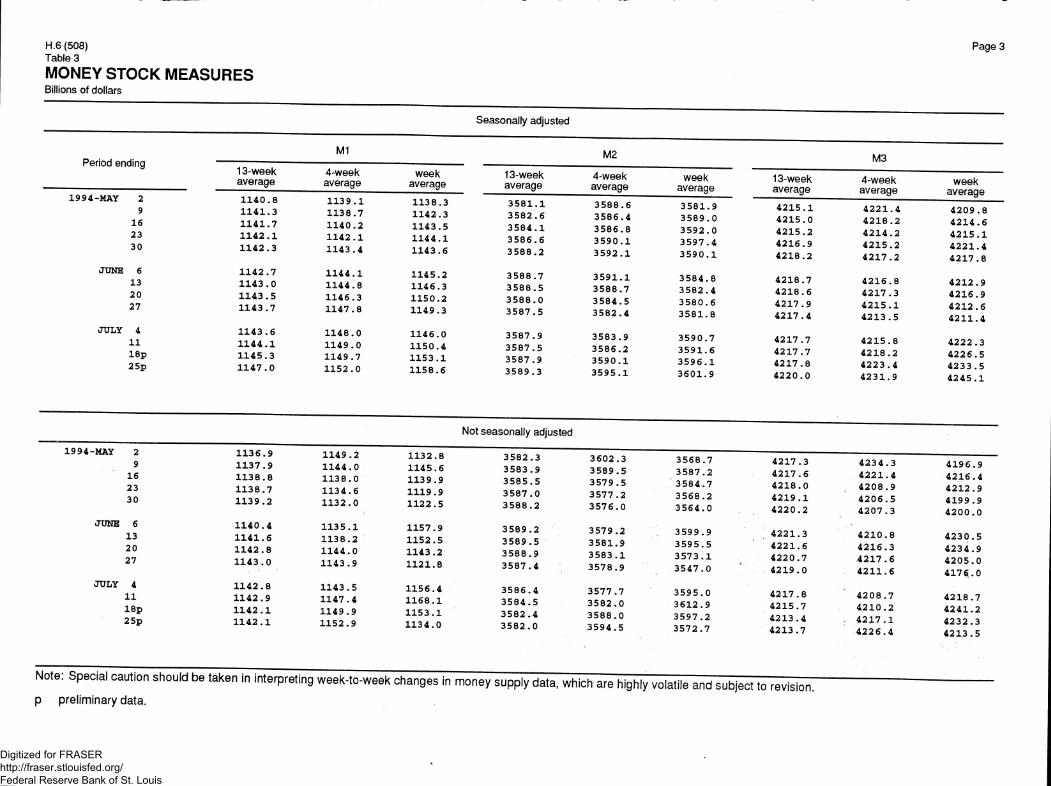
H.6 (508) Table 3
MONEY STOCK MEASURES Billions of dollars
Page3
Seasonally adjusted
M1 Period ending
1994-MAY 2 9
16 23 30
JUNE 6 13 20 27
JULY 4 11 18p 25p
13-week average
1 1 4 0 . 8 1 1 4 1 . 3 1 1 4 1 . 7 1 1 4 2 . 1 1 1 4 2 . 3
1 1 4 2 . 7 1 1 4 3 . 0 1 1 4 3 . 5 1 1 4 3 . 7
1 1 4 3 . 6 1 1 4 4 . 1 1 1 4 5 . 3 1 1 4 7 . 0
4-week average
1 1 3 9 . 1 1 1 3 8 . 7 1 1 4 0 . 2 1 1 4 2 . 1 1 1 4 3 . 4
1 1 4 4 . 1 1 1 4 4 . 8 1 1 4 6 . 3 1 1 4 7 . 8
1 1 4 8 . 0 1 1 4 9 . 0 1 1 4 9 . 7 1 1 5 2 . 0
week average
1 1 3 8 . 3 1 1 4 2 . 3 1 1 4 3 . 5 1 1 4 4 . 1 1 1 4 3 . 6
1 1 4 5 . 2 1 1 4 6 . 3 1 1 5 0 . 2 1 1 4 9 . 3
1 1 4 6 . 0 1 1 5 0 . 4 1 1 5 3 . 1 1 1 5 8 . 6
13-week average
3 5 8 1 . 1 3 5 8 2 . 6 3 5 8 4 . 1 3 5 8 6 . 6 3 5 8 8 . 2
3 5 8 8 . 7 3 5 8 8 . 5 3 5 8 8 . 0 3 5 8 7 . 5
3 5 8 7 . 9 3 5 8 7 . 5 3 5 8 7 . 9 3 5 8 9 . 3
M2
4-week average
3 5 8 8 . 6 3 5 8 6 . 4 3 5 8 6 . 8 3 5 9 0 . 1 3 5 9 2 . 1
3 5 9 1 . 1 3 5 8 8 . 7 3 5 8 4 . 5 3 5 8 2 . 4
3 5 8 3 . 9 3 5 8 6 . 2 3 5 9 0 . 1 3 5 9 5 . 1
week average
3 5 8 1 . 9 3 5 8 9 . 0 3 5 9 2 . 0 3 5 9 7 . 4 3 5 9 0 . 1
3 5 8 4 . 8 3 5 8 2 . 4 3 5 8 0 . 6 3 5 8 1 . 8
3 5 9 0 . 7 3 5 9 1 . 6 3 5 9 6 . 1 3 6 0 1 . 9
13-week average
4 2 1 5 . 1 4 2 1 5 . 0 4 2 1 5 . 2 4 2 1 6 . 9 4 2 1 8 . 2
4 2 1 8 . 7 4 2 1 8 . 6 4 2 1 7 . 9 4 2 1 7 . 4
4 2 1 7 . 7 4 2 1 7 . 7 4 2 1 7 . 8 4 2 2 0 . 0
M3
4-week average
4 2 2 1 . 4 4 2 1 8 . 2 4 2 1 4 . 2 4 2 1 5 . 2 4 2 1 7 . 2
4 2 1 6 . 8 4 2 1 7 . 3 4 2 1 5 . 1 4 2 1 3 . 5
4 2 1 5 . 8 4 2 1 8 . 2 4 2 2 3 . 4 4 2 3 1 . 9
week average
4 2 0 9 . 8 4 2 1 4 . 6 4 2 1 5 . 1 4 2 2 1 . 4 4 2 1 7 . 8
4 2 1 2 . 9 4 2 1 6 . 9 4 2 1 2 . 6 4 2 1 1 . 4
4 2 2 2 . 3 4 2 2 6 . 5 4 2 3 3 . 5 4 2 4 5 . 1
Not seasonally adjusted
1994-MAY 2 9
16 23 30
JUNE 6 13 20 27
JULY 4 11 18p 25p
1 1 3 6 . 9 1 1 3 7 . 9 1 1 3 8 . 8 1 1 3 8 . 7 1 1 3 9 . 2
1 1 4 0 . 4 1 1 4 1 . 6 1 1 4 2 . 8 1 1 4 3 . 0
1 1 4 2 . 8 1 1 4 2 . 9 1 1 4 2 . 1 1 1 4 2 . 1
1 1 4 9 . 2 1 1 4 4 . 0 1 1 3 8 . 0 1 1 3 4 . 6 1 1 3 2 . 0
1 1 3 5 . 1 1 1 3 8 . 2 1 1 4 4 . 0 1 1 4 3 . 9
1 1 4 3 . 5 1 1 4 7 . 4 1 1 4 9 . 9 1 1 5 2 . 9
1 1 3 2 . 8 1 1 4 5 . 6 1 1 3 9 . 9 1 1 1 9 . 9 1 1 2 2 . 5
1 1 5 7 . 9 1 1 5 2 . 5 1 1 4 3 . 2 1121.8
1 1 5 6 . 4 1168.1 1 1 5 3 . 1 1 1 3 4 . 0
3 5 8 2 . 3 3 5 8 3 . 9 3 5 8 5 . 5 3 5 8 7 . 0 3 5 8 8 . 2
3 5 8 9 . 2 3 5 8 9 . 5 3 5 8 8 . 9 3 5 8 7 . 4
3 5 8 6 . 4 3 5 8 4 . 5 3 5 8 2 . 4 3 5 8 2 . 0
3 6 0 2 . 3 3 5 8 9 . 5 3 5 7 9 . 5 3 5 7 7 . 2 3 5 7 6 . 0
3 5 7 9 . 2 3 5 8 1 . 9 3 5 8 3 . 1 3 5 7 8 . 9
3 5 7 7 . 7 3 5 8 2 . 0 3 5 8 8 . 0 3 5 9 4 . 5
3 5 6 8 . 7 3 5 8 7 . 2 3 5 8 4 . 7 3 5 6 8 . 2 3 5 6 4 . 0
3 5 9 9 . 9 3 5 9 5 . 5 3 5 7 3 . 1 3 5 4 7 . 0
3 5 9 5 . 0 3 6 1 2 . 9 3 5 9 7 . 2 3 5 7 2 . 7
4 2 1 7 . 3 4 2 1 7 . 6 4 2 1 8 . 0 4 2 1 9 . 1 4 2 2 0 . 2
4 2 2 1 . 3 4 2 2 1 . 6 4 2 2 0 . 7 4 2 1 9 . 0
4 2 1 7 . 8 4 2 1 5 . 7 4 2 1 3 . 4 4 2 1 3 . 7
4 2 3 4 . 3 4 2 2 1 . 4 4 2 0 8 . 9 4 2 0 6 . 5 4 2 0 7 . 3
4 2 1 0 . 8 4 2 1 6 . 3 4 2 1 7 . 6 4 2 1 1 . 6
4 2 0 8 . 7 4 2 1 0 . 2 4 2 1 7 . 1 4 2 2 6 . 4
4 1 9 6 . 9 4 2 1 6 . 4 4 2 1 2 . 9 4 1 9 9 . 9 4 2 0 0 . 0
4 2 3 0 . 5 4 2 3 4 . 9 4 2 0 5 . 0 4 1 7 6 . 0
4 2 1 8 . 7 4 2 4 1 . 2 4 2 3 2 . 3 4 2 1 3 . 5
Note: Special caution should be taken in interpreting week-to-week changes in money supply data, which are highly volatile and subject to revision
p preliminary data.
Digitized for FRASER http://fraser.stlouisfed.org/ Federal Reserve Bank of St. Louis
Page 4
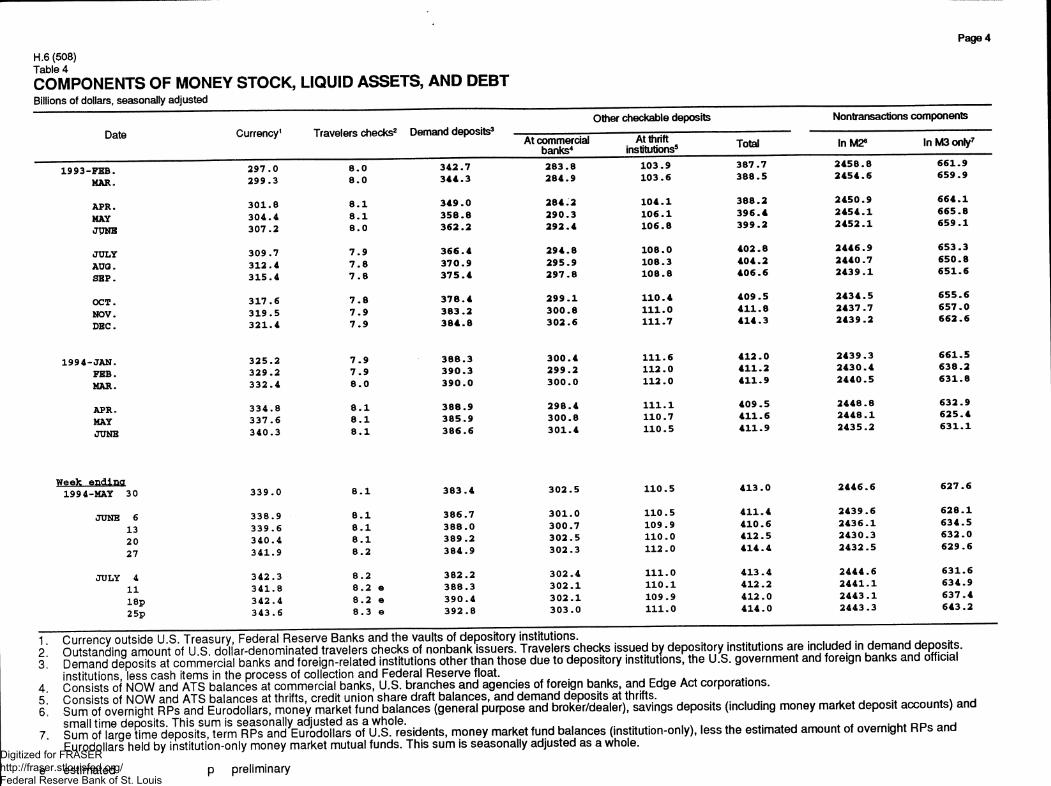
H.6 (508) Table 4 COMPONENTS OF MONEY STOCK, LIQUID ASSETS, AND DEBT Billions of dollars, seasonally adjusted
Date
Other checkable deposits Currency1 Travelers checks2 Demand deposits3
At commercial At thrift Total
Nontransactions components
In M26 In M3 only7
1993-FEB. MAR.
2 9 7 . 0 2 9 9 . 3
8 . 0 8 . 0
3 4 2 . 7 3 4 4 . 3
2 8 3 . 8 2 8 4 . 9
103 .9 1 0 3 . 6
3 8 7 . 7 3 8 8 . 5
2 4 5 8 . 8 2 4 5 4 . 6
6 6 1 . 9 6 5 9 . 9
APR. MAY JUNE
3 0 1 . 8 3 0 4 . 4 3 0 7 . 2
8 . 1 8 . 1 8 . 0
3 4 9 . 0 3 5 8 . 8 3 6 2 . 2
2 8 4 . 2 2 9 0 . 3 2 9 2 . 4
1 0 4 . 1 1 0 6 . 1 1 0 6 . 8
3 8 8 . 2 3 9 6 . 4 3 9 9 . 2
2 4 5 0 . 9 2 4 5 4 . 1 2 4 5 2 . 1
6 6 4 . 1 6 6 5 . 8 6 5 9 . 1
JULY AUG. SEP.
3 0 9 . 7 3 1 2 . 4 3 1 5 . 4
7 . 9 7 . 8 7 . 8
3 6 6 . 4 3 7 0 . 9 3 7 5 . 4
2 9 4 . 8 2 9 5 . 9 2 9 7 . 8
1 0 8 . 0 108 .3 1 0 8 . 8
4 0 2 . 8 4 0 4 . 2 4 0 6 . 6
2 4 4 6 . 9 2 4 4 0 . 7 2 4 3 9 . 1
6 5 3 . 3 6 5 0 . 8 6 5 1 . 6
OCT. NOV. DEC.
3 1 7 . 6 3 1 9 . 5 3 2 1 . 4
7 . 8 7 . 9 7 . 9
3 7 8 . 4 3 8 3 . 2 3 8 4 . 8
2 9 9 . 1 3 0 0 . 8 3 0 2 . 6
1 1 0 . 4 1 1 1 . 0 1 1 1 . 7
4 0 9 . 5 4 1 1 . 8 4 1 4 . 3
2 4 3 4 . 5 2 4 3 7 . 7 2 4 3 9 . 2
6 5 5 . 6 6 5 7 . 0 6 6 2 . 6
1994-JAN. FEB. MAR.
3 2 5 . 2 3 2 9 . 2 3 3 2 . 4
7 . 9 7 . 9 8 . 0
3 8 8 . 3 3 9 0 . 3 3 9 0 . 0
3 0 0 . 4 2 9 9 . 2 3 0 0 . 0
1 1 1 . 6 1 1 2 . 0 1 1 2 . 0
4 1 2 . 0 4 1 1 . 2 4 1 1 . 9
2 4 3 9 . 3 2 4 3 0 . 4 2 4 4 0 . 5
6 6 1 . 5 6 3 8 . 2 6 3 1 . 8
APR. MAY JUNE
3 3 4 . 8 3 3 7 . 6 3 4 0 . 3
8 . 1 8 . 1 8 . 1
3 8 8 . 9 3 8 5 . 9 3 8 6 . 6
2 9 8 . 4 3 0 0 . 8 3 0 1 . 4
1 1 1 . 1 1 1 0 . 7 1 1 0 . 5
4 0 9 . 5 4 1 1 . 6 4 1 1 . 9
2 4 4 8 . 8 2 4 4 8 . 1 2 4 3 5 . 2
6 3 2 . 9 6 2 5 . 4 6 3 1 . 1
WeeH e n d i n g 199 4-MAY 30 3 3 9 . 0 8 . 1 3 8 3 . 4 3 0 2 . 5 1 1 0 . 5 4 1 3 . 0 2 4 4 6 . 6 6 2 7 . 6
JUNE 6 13 20 27
3 3 8 . 9 3 3 9 . 6 3 4 0 . 4 3 4 1 . 9
8 . 1 8 . 1 8 . 1 8 . 2
3 8 6 . 7 3 8 8 . 0 3 8 9 . 2 3 8 4 . 9
3 0 1 . 0 3 0 0 . 7 3 0 2 . 5 3 0 2 . 3
1 1 0 . 5 109 .9 1 1 0 . 0 1 1 2 . 0
4 1 1 . 4 4 1 0 . 6 4 1 2 . 5 4 1 4 . 4
2 4 3 9 . 6 2 4 3 6 . 1 2 4 3 0 . 3 2 4 3 2 . 5
6 2 8 . 1 6 3 4 . 5 6 3 2 . 0 6 2 9 . 6
JULY 4 11 18p 25p
3 4 2 . 3 3 4 1 . 8 3 4 2 . 4 3 4 3 . 6
8 . 2 8 . 2 e 8 . 2 e 8 . 3 e
3 8 2 . 2 3 8 8 . 3 3 9 0 . 4 3 9 2 . 8
3 0 2 . 4 3 0 2 . 1 3 0 2 . 1 3 0 3 . 0
1 1 1 . 0 1 1 0 . 1 109 .9 1 1 1 . 0
4 1 3 . 4 4 1 2 . 2 4 1 2 . 0 4 1 4 . 0
2 4 4 4 . 6 2 4 4 1 . 1 2 4 4 3 . 1 2 4 4 3 . 3
6 3 1 . 6 6 3 4 . 9 6 3 7 . 4 6 4 3 . 2
1, 2 . 3 ,
4 , 5, 6,
7,
inst i tu t ions, less c a s h i tems in t he p rocess of co l lec t ion a n d Fede ra l R e s e r v e f loat . „ Cons i s t s of N O W a n d A T S b a l a n c e s at c o m m e r c i a l banks , U .S . b r a n c h e s a n d a g e n c i e s of fo re ign banks , a n d Edge Ac t co rpo ra t i ons .
RPs "dSSSSM Sly deposits (including money market deposit a<*»unts) and
S u m o f T a r g e t irnedeposits" tomSRRs°and1Eurod^arsof U .S . residents, m o n e y market fund balances (institution-only), less the estimated amount ot overnight R P s and Eurodo l la rs he ld by ins t i tu t ion-on ly m o n e y m a r k e t mu tua l f unds . Th i s s u m is seasona l l y ad j us ted as a w h o l e .
es t ima ted p p re l im inary Digitized for FRASER http://fraser.stlouisfed.org/ Federal Reserve Bank of St. Louis
H.6 (508) Table 4 - continued
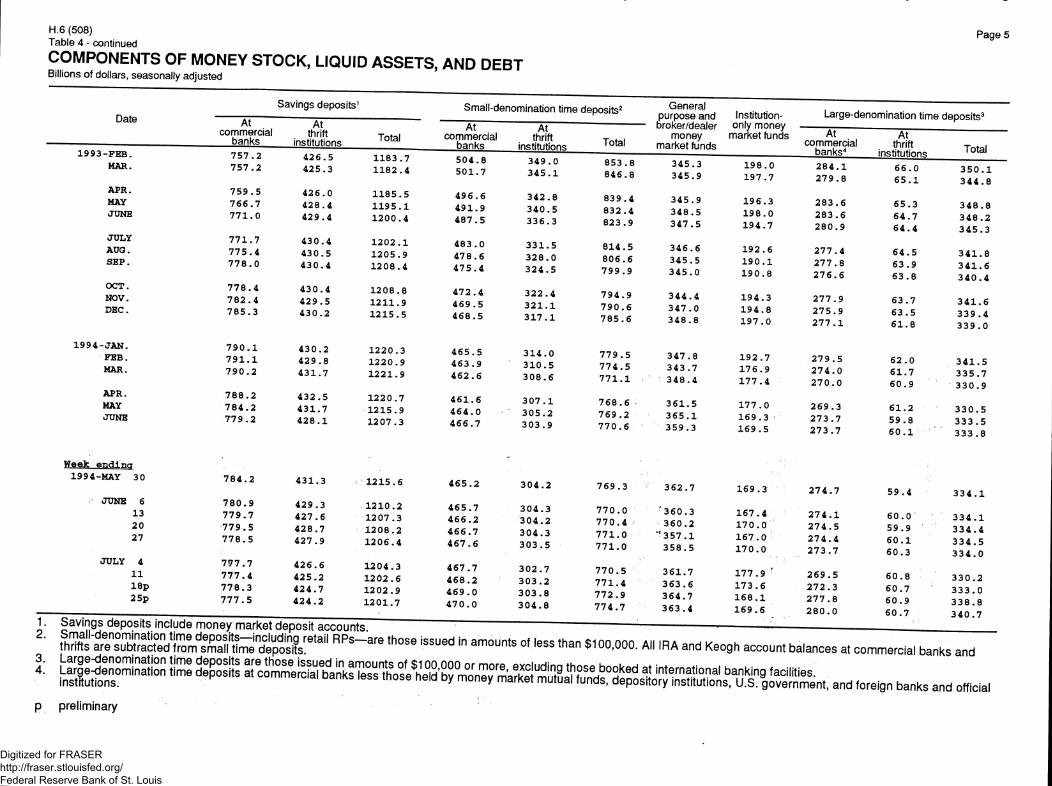
COMPONENTS OF MONEY STOCK, LIQUID ASSETS, AND DEBT Billions of dollars, seasonally adjusted
Page 5
Date Small-denomination time deposits2
JULY AUG. SEP.
OCT. NOV. DEC.
1 9 9 4 - J A N . FEB. MAR.
APR. MAY JUNE
General purpose and Institution-broKer/dAAlAr onlv monev
Large-denomination time deposits3
At commercial
banks At
commercial banks institutions commercial institutions banks4 institutions 1 9 9 3 - F E B . 757 .2 4 2 6 . 5 1183 .7 5 0 4 . 8 3 4 9 . 0 853 .8 3 4 5 . 3 1 9 8 . 0 2 8 4 . 1 MAR. 7 5 7 . 2 4 2 5 . 3 66.C 3 5 0 . 1 1182 .4 3 4 5 . 1 8 4 6 . 8 3 4 5 . 9 1 9 7 . 7 279 .8 6 5 . 1 3 4 4 . 8
APR. 759 . 5 4 2 6 . 0 1 1 8 5 . 5 1 1 9 5 . 1 1 2 0 0 . 4
7 6 6 . 7 4 2 8 . 4 JUNE 7 7 1 . 0 4 2 9 . 4
7 7 1 . 7 7 7 5 . 4 7 7 8 . 0
7 7 8 . 4 7 8 2 . 4 7 8 5 . 3
4 3 0 . 4 4 3 0 . 5 4 3 0 . 4
4 3 0 . 4 4 2 9 . 5 4 3 0 . 2
1 2 0 2 . 1 1 2 0 5 . 9 1 2 0 8 . 4
1208.8 1 2 1 1 . 9 1 2 1 5 . 5
4 8 3 . 0 4 7 8 . 6 4 7 5 . 4
4 7 2 . 4 4 6 9 . 5 4 6 8 . 5
7 9 0 . 1 430 .2 1220 .3 465 .5 7 9 1 . 1 429 .8 1220 .9 463 .9 7 9 0 . 2 431 , .7 1221 , .9 462 .6
7 8 8 . 2 4 3 2 . .5 1 2 2 0 . .7 4 6 1 . .6 7 8 4 . 2 4 3 1 . ,7 1 2 1 5 . 9 4 6 4 . .0 7 7 9 . 2 4 2 8 . 1 1 2 0 7 . 3 4 6 6 . 7
3 3 1 . 5 3 2 8 . 0 3 2 4 . 5
3 2 2 . 4 3 2 1 . 1 3 1 7 . 1
3 1 4 . 0 3 1 0 . 5 3 0 8 . 6
3 0 7 . 1 3 0 5 . 2 3 0 3 . 9
839 . 4 345 .9 1 9 6 . 3 283 .6 832 . 4 348 .5 1 9 8 . 0 283 . 6 823 .9 347 .5 1 9 4 . 7 280 .9
814 . 5 346 .6 1 9 2 . 6 277 . 4 806 . 6 345 .5 1 9 0 . 1 277 .8 799 .9 345 . 0 1 9 0 . 8 276 . 6
794 .9 344 .4 1 9 4 . 3 277 .9 790 .6 347 .0 1 9 4 . 8 275 , .9 785 , .6 3 4 8 . .8 1 9 7 . 0 2 7 7 . . 1
7 7 9 . 5 3 4 7 . 8 1 9 2 . 7 2 7 9 . 5 7 7 4 . 5 3 4 3 . 7 1 7 6 . 9 2 7 4 . 0 7 7 1 . 1 3 4 8 . 4 1 7 7 . 4 2 7 0 . 0
7 6 8 . 6 3 6 1 . 5 1 7 7 . 0 2 6 9 . 3 7 6 9 . 2 3 6 5 . 1 1 6 9 . 3 2 7 3 . 7 7 7 0 . 6 3 5 9 . 3 1 6 9 . 5 2 7 3 . 7
6 2 . 0 6 1 . 7 6 0 . 9
61.2 5 9 . 8 60.1
3 4 1 . 8 3 4 1 . 6 3 4 0 . 4
3 4 1 . 6 3 3 9 . 4 3 3 9 . 0
3 4 1 . 5 3 3 5 . 7 3 3 0 . 9
3 3 0 . 5 3 3 3 . 5 3 3 3 . 8
1. 2.
3. 4.
3 3 0 . 2 3 3 3 , 0 3 3 8 . 8 3 4 0 . 7
Sayings deposits include money market deposit accounts.
thrifts a % S S % % % a » % % o s & ! ° ' " ' ' R P 3 — a r e l h 0 S e l s s " e d a m o u n l s 0 1 l e s s , h a n $ 100,000. All IRA and Keogh account balances at commercial banks and
p preliminary
Digitized for FRASER http://fraser.stlouisfed.org/ Federal Reserve Bank of St. Louis
Page 6
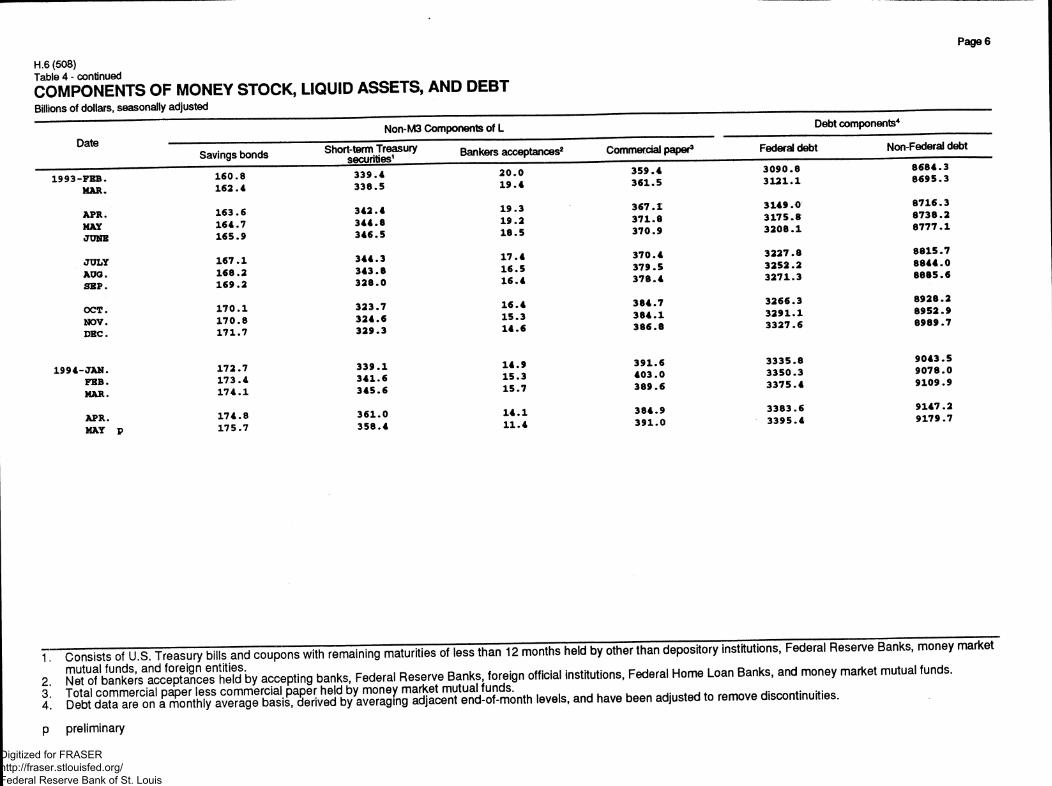
H.6 (508) Table4- continued _ _ _ _ _ COMPONENTS OF MONEY STOCK, LIQUID ASSETS, AND DEBT Billions of dollars, seasonally adjusted
Date Non-M3 Components of L Debt components4
Savings bonds Short-term Treasury securities1 Bankers acceptances2 Commercial paper3
339 .4 2 0 . 0 359 .4 338 .5 19 .4 361 .5
342 .4 19 .3 3 6 7 . 1 344 .8 19 .2 371 .8 346 .5 18 .5 370 .9
344 .3 17 .4 370 .4 343 .8 16 .5 379 .5 3 2 8 . 0 16 .4 3 7 8 . 4
323 .7 1 6 . 4 384 .7 3 2 4 . 6 15 .3 3 8 4 . 1 329 .3 14 .6 386 .8
3 3 9 . 1 14 .9 391 .6 3 4 1 . 6 15 .3 4 0 3 . 0 3 4 5 . 6 15 .7 389 .6
3 6 1 . 0 1 4 . 1 384 .9 358 .4 11 .4 3 9 1 . 0
Federal debt Non-Federal debt
1993-FBB. MAR.
APR. MAY JUNE
JULY AUG. SEP.
OCT. NOV. DEC.
1994-JAN. FEB. MAR.
APR. MAY p
160.8 162 .4
163 .6 164 .7 165 .9
1 6 7 . 1 168.2 1 6 9 . 2
1 7 0 . 1 1 7 0 . 8 171 .7
172 .7 173 .4 1 7 4 . 1
1 7 4 . 8 175 .7
3090 .8 3 1 2 1 . 1
3149 .0 3175 .8 3 2 0 8 . 1
3227 .8 3252 .2 3271 .3
3266 .3 3 2 9 1 . 1 3327 .6
3335 .8 3350 .3 3375 .4
3383 .6 3395 .4
8684 .3 8695 .3
8716 .3 8738 .2 8 7 7 7 . 1
8815 .7 8844 .0 8885 .6
8928 .2 8952 .9 8989 .7
9043 .5 9078 .0 9109 .9
9147 .2 9179 .7
1, Cons is ts of U.S. T reasury bil ls and c o u p o n s w i th remain ing matur i t ies of less t h a n 12 months he ld by other t han depos i to ry inst i tut ions, Federa l Reserve Banks , m o n e y marke t
2 N e t o f b a n S ^ accep t ing banks , Federa l Reserve Banks fore ign off icial inst i tut ions. Federa l H o m e Loan Banks , and money marke t mu tua l funds .
I ' e v e K = " d have been a * s , e d ,= remove d , s c o n c e s .
p pre l iminary
Digitized for FRASER http://fraser.stlouisfed.org/ Federal Reserve Bank of St. Louis
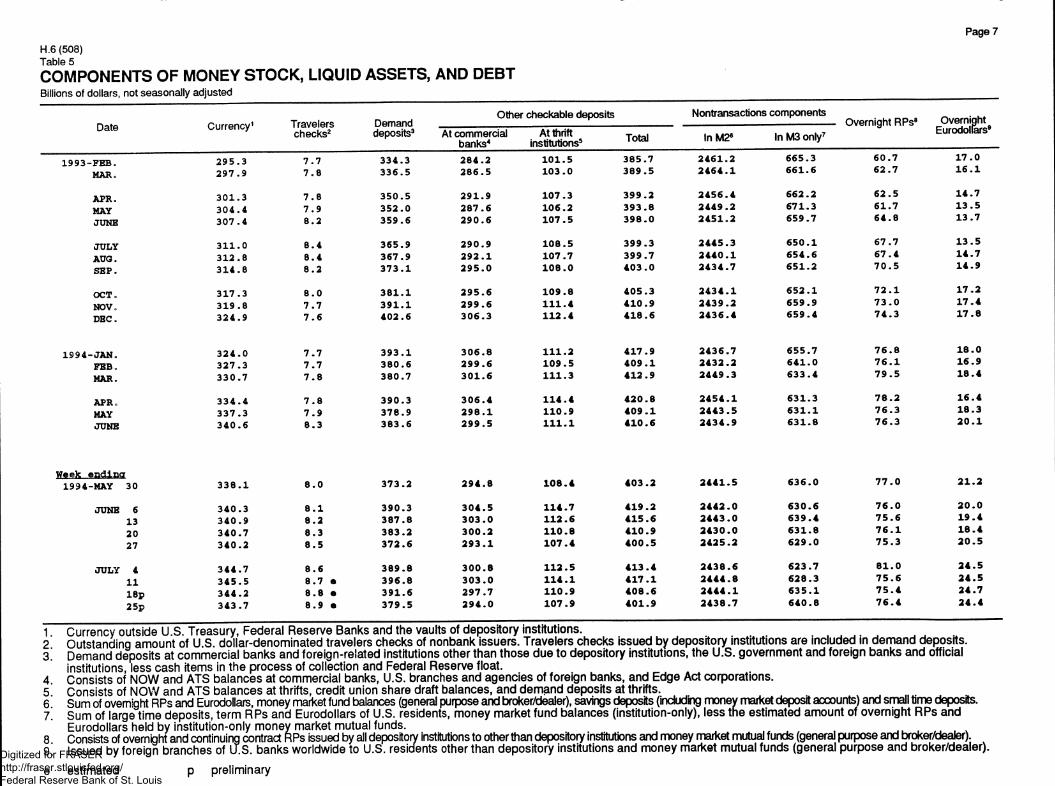
Page 7 H.6 (508) Table 5 COMPONENTS OF MONEY STOCK, LIQUID ASSETS, AND DEBT Billions of dollars, not seasonally adjusted
Date Currency1 Travelers checks2
Demand deposits3
Other checkable deposits At commercial At thrift
banks4 institutions5 Total
Nontransactions components
In M26 In M3 only7 Overnight RPs8 Overnight
Eurodollars9
1993-FEB. 2 9 5 . 3 7 . 7 334 .3 2 8 4 . 2 1 0 1 . 5 3 8 5 . 7 2 4 6 1 . 2 6 6 5 . 3 6 0 . 7 1 7 . 0
MAR. 2 9 7 . 9 7 . 8 3 3 6 . 5 2 8 6 . 5 1 0 3 . 0 3 8 9 . 5 2 4 6 4 . 1 6 6 1 . 6 6 2 . 7 1 6 . 1
APR. 3 0 1 . 3 7 . 8 3 5 0 . 5 2 9 1 . 9 1 0 7 . 3 3 9 9 . 2 2 4 5 6 . 4 6 6 2 . 2 6 2 . 5 1 4 . 7
MAY 3 0 4 . 4 7 . 9 3 5 2 . 0 2 8 7 . 6 1 0 6 . 2 3 9 3 . 8 2 4 4 9 . 2 6 7 1 . 3 6 1 . 7 1 3 . 5
JUNE 3 0 7 . 4 8 . 2 3 5 9 . 6 2 9 0 . 6 1 0 7 . 5 3 9 8 . 0 2 4 5 1 . 2 659 .7 6 4 . 8 1 3 . 7
JULY 3 1 1 . 0 8 . 4 365 .9 2 9 0 . 9 1 0 8 . 5 3 9 9 . 3 2 4 4 5 . 3 6 5 0 . 1 6 7 . 7 1 3 . 5
AUG. 3 1 2 . 8 8 . 4 367 .9 2 9 2 . 1 1 0 7 . 7 3 9 9 . 7 2 4 4 0 . 1 6 5 4 . 6 6 7 . 4 1 4 . 7
SEP. 3 1 4 . 8 8 . 2 3 7 3 . 1 2 9 5 . 0 1 0 8 . 0 4 0 3 . 0 2 4 3 4 . 7 6 5 1 . 2 7 0 . 5 1 4 . 9
OCT. 3 1 7 . 3 8 . 0 3 8 1 . 1 2 9 5 . 6 1 0 9 . 8 4 0 5 . 3 2 4 3 4 . 1 6 5 2 . 1 7 2 . 1 1 7 . 2
NOV. 3 1 9 . 8 7 . 7 3 9 1 . 1 2 9 9 . 6 1 1 1 . 4 4 1 0 . 9 2 4 3 9 . 2 6 5 9 . 9 7 3 . 0 1 7 . 4
DEC. 3 2 4 . 9 7 . 6 4 0 2 . 6 3 0 6 . 3 1 1 2 . 4 4 1 8 . 6 2 4 3 6 . 4 6 5 9 . 4 7 4 . 3 1 7 . 8
1994-JAN. 3 2 4 . 0 7 . 7 3 9 3 . 1 3 0 6 . 8 1 1 1 . 2 4 1 7 . 9 2 4 3 6 . 7 6 5 5 . 7 7 6 . 8 1 8 . 0
FEB. 3 2 7 . 3 7 . 7 3 8 0 . 6 2 9 9 . 6 1 0 9 . 5 4 0 9 . 1 2 4 3 2 . 2 6 4 1 . 0 7 6 . 1 1 6 . 9
MAR. 3 3 0 . 7 7 . 8 3 8 0 . 7 3 0 1 . 6 1 1 1 . 3 4 1 2 . 9 2 4 4 9 . 3 6 3 3 . 4 7 9 . 5 1 8 . 4
APR. 3 3 4 . 4 7 . 8 3 9 0 . 3 3 0 6 . 4 1 1 4 . 4 4 2 0 . 8 2 4 5 4 . 1 6 3 1 . 3 7 8 . 2 1 6 . 4
MAY 3 3 7 . 3 7 . 9 3 7 8 . 9 2 9 8 . 1 1 1 0 . 9 4 0 9 . 1 2 4 4 3 . 5 6 3 1 . 1 7 6 . 3 1 8 . 3
JUNE 3 4 0 . 6 8 . 3 3 8 3 . 6 2 9 9 . 5 111.1 4 1 0 . 6 2 4 3 4 . 9 6 3 1 . 8 7 6 . 3 2 0 . 1
Week endlncr 7 7 . 0 2 1 . 2 1994-MAY 30 3 3 8 . 1 8 . 0 3 7 3 . 2 2 9 4 . 8 1 0 8 . 4 4 0 3 . 2 2 4 4 1 . 5 6 3 6 . 0 7 7 . 0 2 1 . 2
JUNE 6 3 4 0 . 3 8 . 1 3 9 0 . 3 3 0 4 . 5 1 1 4 . 7 4 1 9 . 2 2 4 4 2 . 0 6 3 0 . 6 7 6 . 0 2 0 . 0
13 3 4 0 . 9 8 . 2 3 8 7 . 8 3 0 3 . 0 1 1 2 . 6 4 1 5 . 6 2 4 4 3 . 0 6 3 9 . 4 7 5 . 6 1 9 . 4
20 3 4 0 . 7 8 . 3 3 8 3 . 2 3 0 0 . 2 1 1 0 . 8 4 1 0 . 9 2 4 3 0 . 0 6 3 1 . 8 7 6 . 1 1 8 . 4
27 3 4 0 . 2 8 . 5 3 7 2 . 6 2 9 3 . 1 1 0 7 . 4 4 0 0 . 5 2 4 2 5 . 2 6 2 9 . 0 7 5 . 3 2 0 . 5
JULY 4 3 4 4 . 7 8 . 6 3 8 9 . 8 3 0 0 . 8 1 1 2 . 5 4 1 3 . 4 2 4 3 8 . 6 6 2 3 . 7 8 1 . 0 2 4 . 5
1 1 3 4 5 . 5 8 . 7 e 3 9 6 . 8 3 0 3 . 0 1 1 4 . 1 4 1 7 . 1 2 4 4 4 . 8 6 2 8 . 3 7 5 . 6 2 4 . 5
18p 3 4 4 . 2 8 . 8 e 3 9 1 . 6 2 9 7 . 7 1 1 0 . 9 4 0 8 . 6 2 4 4 4 . 1 6 3 5 . 1 7 5 . 4 2 4 . 7
25p 3 4 3 . 7 8 . 9 e 3 7 9 . 5 2 9 4 . 0 1 0 7 . 9 4 0 1 . 9 2 4 3 8 . 7 6 4 0 . 8 7 6 . 4 2 4 . 4
1. Currency outside U.S. Treasury, Federal Reserve Banks and the vaults of depository institutions. . 2 Outstanding amount of U.S. dollar-denominated travelers checks of nonbank issuers. Travelers checks issued by depository institutions are included in demand deposits. 3. Demand deposits at commercial banks and foreign-related institutions other than those due to depository institutions, the U.S. government and foreign banks and official
institutions, less cash items in the process of collection and Federal Reserve float. 4. Consists of NOW and ATS balances at commercial banks, U.S. branches and agencies of foreign banks, and Edge Act corporations. 5 Consists of NOW and ATS balances at thrifts, credit union share draft balances, and demand deposits at thrifts. 6 Sum of overnight RPs and Eurodollars, money market fund balances (general purpose and broker/dealer), savings deposits (including money market deposit accounts) and small time deposits. 7. Sum of large time deposits, term RPs and Eurodollars of U.S. residents, money market fund balances (institution-only), less the estimated amount of overnight RPs and
Eurodollars held by institution-only money market mutual funds. 8 Consists of overnight and continuing contract RPs issued by all depository institutions to other than depository institutions and money market mutual funds (general purpose and broker/dealer), g] issued by foreign branches of U.S. banks worldwide to U.S. residents other than depository institutions and money market mutual funds (general purpose and broker/dealer).
e estimated p preliminary Digitized for FRASER http://fraser.stlouisfed.org/ Federal Reserve Bank of St. Louis
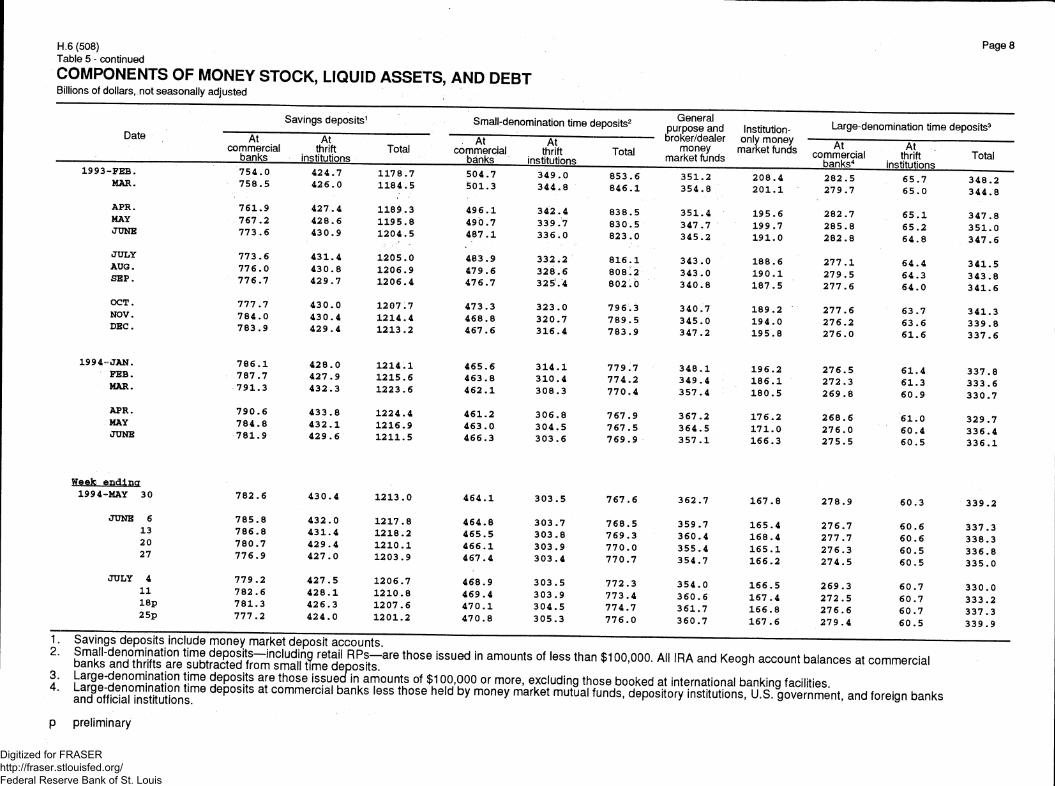
H.6 (508) Table 5 - continued
COMPONENTS OF MONEY STOCK, LIQUID ASSETS, AND DEBT Billions of dollars, not seasonally adjusted
Paged
Date Savings deposits1
Small-denomination time deposits2
At commercial
At thrift Total
At commercial
At thrift Total
General purpose and broker/dealer
money
Institution-only money
market funds
Large-denomination time deposits3
At commercial
At thrift Total
1 9 9 3 - F E B . MAR.
7 5 4 . 0 7 5 8 . 5
4 2 4 . 7 4 2 6 . 0
1 1 7 8 . 7 1 1 8 4 . 5
5 0 4 . 7 5 0 1 . 3
II IS 11IUHUMS 3 4 9 . 0 3 4 4 . 8
8 5 3 . 6 8 4 6 . 1
3 5 1 . 2 3 5 4 . 8
2 0 8 . 4 2 0 1 . 1
bank 282 279
;s4
. 5
.7
institutions 6 5 . 7 6 5 . 0
3 4 8 . 2 3 4 4 . 8
APR. MAY JUNE
7 6 1 . 9 7 6 7 . 2 7 7 3 . 6
4 2 7 . 4 4 2 8 . 6 4 3 0 . 9
1 1 8 9 . 3 1 1 9 5 . 8 1 2 0 4 . 5
4 9 6 . 1 4 9 0 . 7 4 8 7 . 1
3 4 2 . 4 339 . 7 3 3 6 . 0
8 3 8 . 5 8 3 0 . 5 8 2 3 . 0
3 5 1 . 4 3 4 7 . 7 3 4 5 . 2
1 9 5 . 6 1 9 9 . 7 1 9 1 . 0
282 285 282
.7
. 8
. 8
6 5 . 1 6 5 . 2 6 4 . 8
3 4 7 . 8 3 5 1 . 0 3 4 7 . 6
JULY AUG. SEP.
7 7 3 . 6 7 7 6 . 0 7 7 6 . 7
4 3 1 . 4 4 3 0 . 8 4 2 9 . 7
1 2 0 5 . 0 1 2 0 6 . 9 1 2 0 6 . 4
4 8 3 . 9 4 7 9 . 6 4 7 6 . 7
3 3 2 . 2 3 2 8 . 6 3 2 5 . 4
8 1 6 . 1 808 .2 8 0 2 . 0
3 4 3 . 0 3 4 3 . 0 3 4 0 . 8
1 8 8 . 6 1 9 0 . 1 1 8 7 . 5
277 279 277
. 1
.5
. 6
6 4 . 4 6 4 . 3 6 4 . 0
3 4 1 . 5 3 4 3 . 8 3 4 1 . 6
OCT. NOV. DEC.
7 7 7 . 7 7 8 4 . 0 7 8 3 . 9
4 3 0 . 0 4 3 0 . 4 4 2 9 . 4
1 2 0 7 . 7 1 2 1 4 . 4 1 2 1 3 . 2
4 7 3 . 3 4 6 8 . 8 4 6 7 . 6
3 2 3 . 0 3 2 0 . 7 3 1 6 . 4
7 9 6 . 3 7 8 9 . 5 7 8 3 . 9
3 4 0 . 7 3 4 5 . 0 3 4 7 . 2
1 8 9 . 2 1 9 4 . 0 1 9 5 . 8
277 276 276
. 6
.2
.0
6 3 . 7 6 3 . 6 6 1 . 6
3 4 1 . 3 3 3 9 . 8 3 3 7 . 6
1 9 9 4 - J A N . FEB. MAR.
7 8 6 . 1 7 8 7 . 7 7 9 1 . 3
4 2 8 . 0 4 2 7 . 9 4 3 2 . 3
1 2 1 4 . 1 1 2 1 5 . 6 1 2 2 3 . 6
4 6 5 . 6 4 6 3 . 8 4 6 2 . 1
3 1 4 . 1 3 1 0 . 4 3 0 8 . 3
7 7 9 . 7 7 7 4 . 2 7 7 0 . 4
3 4 8 . 1 3 4 9 . 4 3 5 7 . 4
1 9 6 . 2 1 8 6 . 1 1 8 0 . 5
276 272 269
.5
.3
.8
6 1 . 4 6 1 . 3 6 0 . 9
3 3 7 . 8 3 3 3 . 6 3 3 0 . 7
APR. MAY JUNE
7 9 0 . 6 7 8 4 . 8 7 8 1 . 9
4 3 3 . 8 4 3 2 . 1 4 2 9 . 6
1 2 2 4 . 4 1 2 1 6 . 9 1 2 1 1 . 5
4 6 1 . 2 4 6 3 . 0 4 6 6 . 3
3 0 6 . 8 3 0 4 . 5 3 0 3 . 6
7 6 7 . 9 7 6 7 . 5 7 6 9 . 9
3 6 7 . 2 3 6 4 . 5 3 5 7 . 1
1 7 6 . 2 1 7 1 . 0 1 6 6 . 3
2 6 8 , 2 7 6 . 2 7 5 ,
.6
.0
.5
6 1 . 0 6 0 . 4 6 0 . 5
3 2 9 . 7 3 3 6 . 4 3 3 6 . 1
Week e n d l p g 1994-MAY 30 7 8 2 . 6 4 3 0 . 4 1 2 1 3 . 0 4 6 4 . 1 3 0 3 . 5 7 6 7 . 6 3 6 2 . 7 1 6 7 . 8 2 7 8 . ,9 6 0 . 3 3 3 9 . 2
JUNE 6 13 20 27
7 8 5 . 8 7 8 6 . 8 7 8 0 . 7 7 7 6 . 9
4 3 2 . 0 4 3 1 . 4 4 2 9 . 4 4 2 7 . 0
1 2 1 7 . 8 1 2 1 8 . 2 1 2 1 0 . 1 1 2 0 3 . 9
4 6 4 . 8 4 6 5 . 5 4 6 6 . 1 4 6 7 . 4
3 0 3 . 7 3 0 3 . 8 3 0 3 . 9 3 0 3 . 4
7 6 8 . 5 7 6 9 . 3 7 7 0 . 0 7 7 0 . 7
3 5 9 . 7 3 6 0 . 4 3 5 5 . 4 3 5 4 . 7
1 6 5 . 4 1 6 8 . 4 1 6 5 . 1 1 6 6 . 2
2 7 6 . 2 7 7 . 2 7 6 . 2 7 4 .
7 7 3 5
6 0 . 6 6 0 . 6 6 0 . 5 6 0 . 5
3 3 7 . 3 3 3 8 . 3 3 3 6 . 8 3 3 5 . 0
JULY 4 1 1 18p 25p
1 RavinnQ r l onnc i t c i n r l n r
7 7 9 . 2 7 8 2 . 6 7 8 1 . 3 7 7 7 . 2
Ho m n n o u m d r l / o t
4 2 7 . 5 4 2 8 . 1 4 2 6 . 3 4 2 4 . 0
1 2 0 6 . 7 1 2 1 0 . 8 1 2 0 7 . 6 1 2 0 1 . 2
4 6 8 . 9 4 6 9 . 4 4 7 0 . 1 4 7 0 . 8
3 0 3 . 5 3 0 3 . 9 3 0 4 . 5 3 0 5 . 3
7 7 2 . 3 7 7 3 . 4 7 7 4 . 7 7 7 6 . 0
3 5 4 . 0 3 6 0 . 6 3 6 1 . 7 3 6 0 . 7
1 6 6 . 5 1 6 7 . 4 1 6 6 . 8 1 6 7 . 6
2 6 9 . 2 7 2 . 2 7 6 . 2 7 9 .
3 5 6 4
6 0 . 7 6 0 . 7 6 0 . 7 6 0 . 5
3 3 0 . 0 3 3 3 . 2 3 3 7 . 3 3 3 9 . 9
2 ' baTks ? n S I t e t o m & ^ t t l ! i u n n d l £ 5 t e 4 , e 0 1 l e s s , h a n $1 "0,000. All IRA and Keogh account balances at commercial 3. 4.
and9!ftoal°instimtioVsme ^ c ° m m e r c i a ? b a i S b j m o n ™ T O S and foreign banks and official institutions,
p preliminary
Digitized for FRASER http://fraser.stlouisfed.org/ Federal Reserve Bank of St. Louis
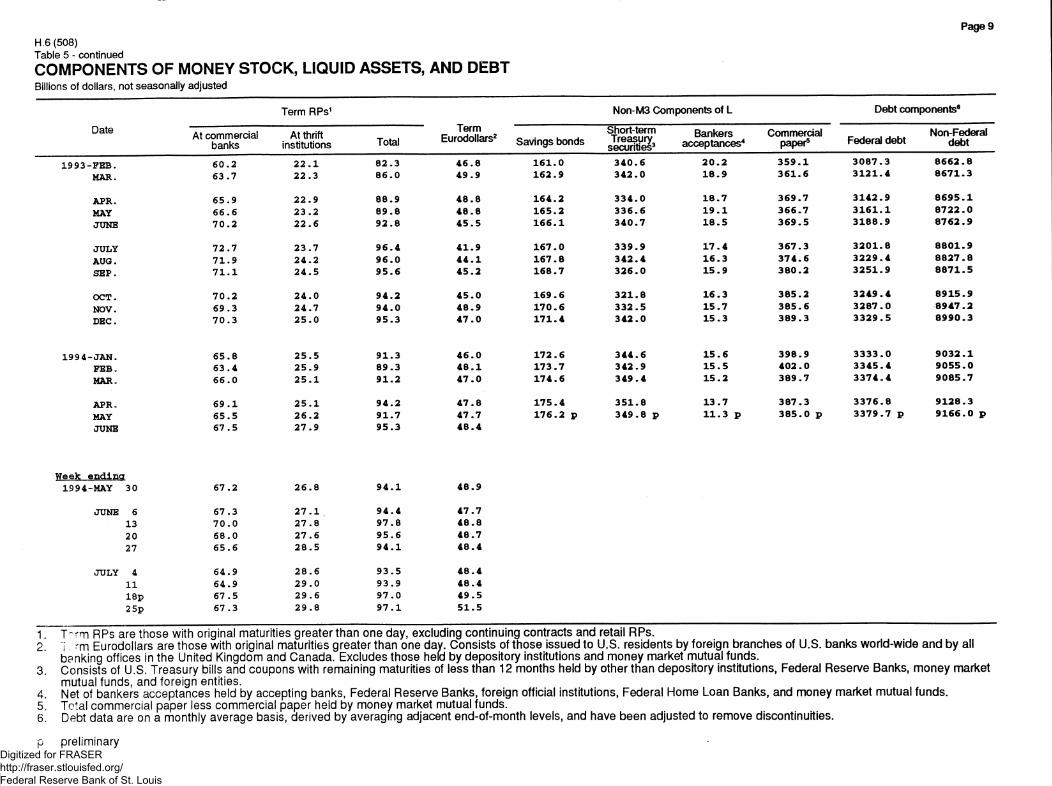
Page 9 H,6 (508) Table 5 - continued COMPONENTS OF MONEY STOCK, LIQUID ASSETS, AND DEBT Billions of dollars, not seasonally adjusted
Date Term RPs1 Non-M3 Components of L Debt components6
Date At commercial banks
At thrift institutions Total
Term Eurodollars2
Savings bonds Short-term Treasury
securities3 Bankers
acceptances4 Commercial
paper5 Federal debt Non-Federal
debt
1 9 9 3 - F E B . 60 . .2 2 2 . 1 8 2 . 3 4 6 . 8 1 6 1 . 0 3 4 0 . 6 2 0 . 2 3 5 9 . 1 3 0 8 7 . 3 8 6 6 2 . 8
MAR. 6 3 . 7 2 2 . 3 8 6 . 0 4 9 . 9 1 6 2 . 9 3 4 2 . 0 1 8 . 9 3 6 1 . 6 3 1 2 1 . 4 8 6 7 1 . 3
APR. 65 , .9 2 2 . 9 8 8 . 9 4 8 . 8 1 6 4 . 2 3 3 4 . 0 1 8 . 7 3 6 9 . 7 3 1 4 2 . 9 8 6 9 5 . 1
MAY 66, .6 2 3 . 2 8 9 . 8 4 8 . 8 1 6 5 . 2 3 3 6 . 6 1 9 . 1 3 6 6 . 7 3 1 6 1 . 1 8 7 2 2 . 0
JUNE 70 , .2 2 2 . 6 9 2 . 8 4 5 . 5 1 6 6 . 1 3 4 0 . 7 1 8 . 5 3 6 9 . 5 3 1 8 8 . 9 8 7 6 2 . 9
JULY 72 .7 2 3 . 7 9 6 . 4 4 1 . 9 1 6 7 . 0 3 3 9 . 9 1 7 . 4 3 6 7 . 3 3 2 0 1 . 8 8 8 0 1 . 9
AUG. 7 1 .9 2 4 . 2 9 6 . 0 4 4 . 1 1 6 7 . 8 3 4 2 . 4 1 6 . 3 3 7 4 . 6 3 2 2 9 . 4 8 8 2 7 . 8
SEP o 7 1 . 1 2 4 . 5 9 5 . 6 4 5 . 2 1 6 8 . 7 3 2 6 . 0 1 5 . 9 3 8 0 . 2 3 2 5 1 . 9 8 8 7 1 . 5
OCT. 7 0 . 2 2 4 . 0 9 4 . 2 4 5 . 0 1 6 9 . 6 3 2 1 . 8 1 6 . 3 3 8 5 . 2 3 2 4 9 . 4 8 9 1 5 . 9
NOV. 69 .3 2 4 . 7 9 4 . 0 4 8 . 9 1 7 0 . 6 3 3 2 . 5 1 5 . 7 3 8 5 . 6 3 2 8 7 . 0 8 9 4 7 . 2
DEC. 70 .3 2 5 . 0 9 5 . 3 4 7 . 0 1 7 1 . 4 3 4 2 . 0 1 5 . 3 3 8 9 . 3 3 3 2 9 . 5 8 9 9 0 . 3
1 9 9 4 - J A N . 65 .8 2 5 . 5 9 1 . 3 4 6 . 0 1 7 2 . 6 3 4 4 . 6 1 5 . 6 3 9 8 . 9 3 3 3 3 . 0 9 0 3 2 . 1
FEB. 63 .4 2 5 . 9 8 9 . 3 4 8 . 1 1 7 3 . 7 3 4 2 . 9 1 5 . 5 4 0 2 . 0 3 3 4 5 . 4 9 0 5 5 . 0
MAR. 66 .0 2 5 . 1 9 1 . 2 4 7 . 0 1 7 4 . 6 3 4 9 . 4 1 5 . 2 3 8 9 . 7 3 3 7 4 . 4 9 0 8 5 . 7
APR = 69 . 1 2 5 . 1 9 4 . 2 4 7 . 8 1 7 5 . 4 3 5 1 . 8 1 3 . 7 3 8 7 . 3 3 3 7 6 . 8 9 1 2 8 . 3
MAY 65 .5 2 6 . 2 9 1 . 7 4 7 . 7 1 7 6 . 2 p 3 4 9 . 8 p 1 1 . 3 p 3 8 5 . 0 p 3 3 7 9 . 7 p 9 1 6 6 . 0 p
JUNE 67 .5 2 7 . 9 9 5 . 3 4 8 . 4
Week e n d i n a 1994-MAY 30 67 .2 2 6 . 8 9 4 . 1 4 8 . 9
JUNE 6 67 .3 2 7 . 1 . 9 4 . 4 4 7 . 7 13 70 . 0 2 7 . 8 9 7 . 8 4 8 . 8 20 68 . 0 2 7 . 6 9 5 . 6 4 8 . 7 27 65 .6 2 8 . 5 9 4 . 1 4 8 . 4
JULY 4 64 .9 2 8 . 6 9 3 . 5 4 8 . 4 1 1 64 .9 2 9 . 0 9 3 . 9 4 8 . 4 18p 67 . 5 2 9 . 6 9 7 . 0 4 9 . 5 2 5p 67 .3 2 9 . 8 9 7 . 1 5 1 . 5
1 T~rm RPs are those with original maturities greater than one day, excluding continuing contracts and retail RPs. 2 "i -m Eurodollars are those with original maturities greater than one day. Consists of those issued to U.S. residents by foreign branches of U.S. banks world-wide and by all
banking offices in the United Kingdom and Canada. Excludes those held by depository institutions and money market mutual funds. 3. Consists of U.S. Treasury bills and coupons with remaining maturities of less than 12 months held by other than depository institutions, Federal Reserve Banks, money market
mutual funds, and foreign entities. 4. Net of bankers acceptances held by accepting banks, Federal Reserve Banks, foreign official institutions, Federal Home Loan Banks, and money market mutual funds. 5. Total commercial paper less commercial paper held by money market mutual funds. 6. Debt data are on a monthly average basis, derived by averaging adjacent end-of-month levels, and have been adjusted to remove discontinuities.
p preliminary Digitized for FRASER http://fraser.stlouisfed.org/ Federal Reserve Bank of St. Louis
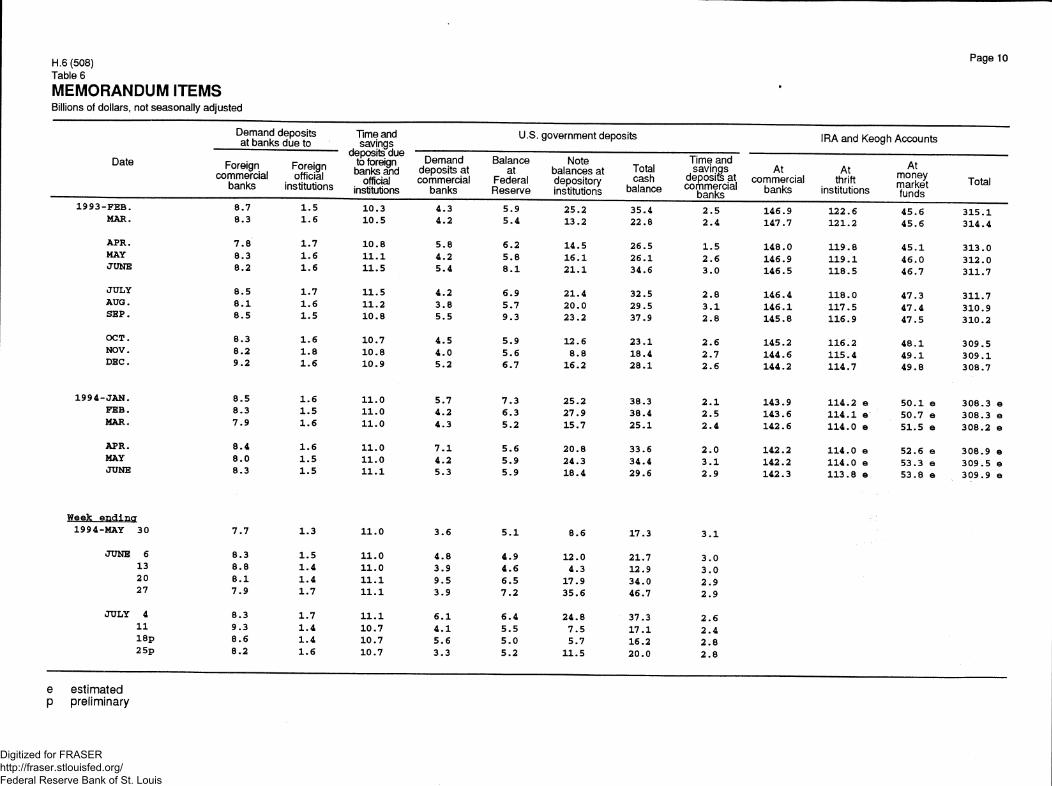
H.6 (508) Page 10 Table 6 MEMORANDUM ITEMS Billions of dollars, not seasonally adjusted
Date
Demand deposits at banks due to
Time and savings
deposits due to foreign banks and
official institutions
U.S. government deposits IRA and Keogh Accounts
Date Foreign commercial
banks
Foreign official
institutions
Time and savings
deposits due to foreign banks and
official institutions
Demand deposits at commercial
banks
Balance at
Federal Reserve
Note balances at depository institutions
Total cash
balance
Time and savings
deposits at commercial
banks
At commercial
banks
At thrift
institutions
At money market funds
Total
1 9 9 3 - F B B . 8 . 7 1 . 5 1 0 . 3 4 . 3 5 . 9 2 5 . 2 3 5 . 4 2 .5 146. .9 122 .6 45, .6 3 1 5 . 1 MAR. 8 . 3 1 . 6 1 0 . 5 4 . 2 5 . 4 1 3 . 2 2 2 . 8 2 .4 147. .7 1 2 1 .2 45, .6 3 1 4 . 4
APR. 7 . 8 1 . 7 1 0 . 8 5 . 8 6 . 2 1 4 . 5 2 6 . 5 1 .5 148. .0 119, .8 45 . 1 3 1 3 . 0 MAY 8 . 3 1 . 6 n . i 4 . 2 5 . 8 1 6 . 1 2 6 . 1 2 .6 146. .9 119, . 1 46. .0 3 1 2 . 0 JUNE 8 . 2 1 . 6 1 1 . 5 5 . 4 8 . 1 2 1 . 1 3 4 . 6 3 .0 146. .5 118. .5 46, .7 3 1 1 . 7
JULY 8 . 5 1 . 7 1 1 . 5 4 . 2 6 . 9 2 1 . 4 3 2 . 5 2 .8 146. .4 118. .0 47. .3 3 1 1 . 7 AUG. 8 . 1 1 . 6 1 1 . 2 3 . 8 5 . 7 2 0 . 0 2 9 . 5 3 . 1 146. . 1 117. .5 47. .4 3 1 0 . 9 SEP. 8 . 5 1 . 5 1 0 . 8 5 . 5 9 . 3 2 3 . 2 37 .9 2 .8 145. .8 116. .9 47. .5 3 1 0 . 2
OCT. 8 . 3 1 . 6 1 0 . 7 4 . 5 5 . 9 1 2 . 6 2 3 . 1 2 .6 145. .2 116. .2 48. . 1 3 0 9 . 5 NOV. 8 . 2 1 . 8 1 0 . 8 4 . 0 5 . 6 8 . 8 18 .4 2 .7 144. .6 115. .4 49. . 1 3 0 9 . 1 DEC. 9 . 2 1 . 6 1 0 . 9 5 . 2 6 . 7 1 6 . 2 2 8 . 1 2 .6 144. ,2 114. .7 49. .8 3 0 8 . 7
1 9 9 4 - J A N . 8 . 5 1 . 6 1 1 . 0 5 . 7 7 . 3 2 5 . 2 38 .3 2 . 1 143. .9 114. ,2 e 50. . 1 e 3 0 8 . 3 e FEB. 8 . 3 1 . 5 1 1 . 0 4 . 2 6 . 3 2 7 . 9 3 8 . 4 2 .5 143. .6 114. . 1 e 50. 7 e 3 0 8 . 3 e MAR. 7 . 9 1 . 6 1 1 . 0 4 . 3 5 . 2 1 5 . 7 2 5 . 1 2. .4 142. 6 114. ,0 e 51. 5 e 3 0 8 . 2 e
APR. 8 . 4 1 . 6 1 1 . 0 7 . 1 5 . 6 2 0 . 8 3 3 . 6 2 . .0 142. 2 114. 0 e 52. 6 e 3 0 8 . 9 e MAY 8 . 0 1 . 5 1 1 . 0 4 . 2 5 . 9 2 4 . 3 3 4 . 4 3. . 1 142. 2 114. 0 e 53. 3 e 3 0 9 . 5 e JUNE 8 . 3 1 . 5 1 1 . 1 5 . 3 5 . 9 1 8 . 4 2 9 . 6 2 . .9 142. 3 113. 8 e 53. 8 e 3 0 9 . 9 e
Week; e i j d i n g 1994-MAY 30 7 . 7 1 . 3 1 1 . 0 3 . 6 5 . 1 8 . 6 17 .3 3 . , 1
JUNE 6 8 . 3 1 . 5 1 1 . 0 4 . 8 4 . 9 1 2 . 0 21 .7 3 . ,0 13 8 . 8 1 . 4 1 1 . 0 3 . 9 4 . 6 4 . 3 12 .9 3 . 0 20 8 . 1 1 . 4 1 1 . 1 9 . 5 6 . 5 1 7 . 9 3 4 . 0 2 . 9 27 7 . 9 1 . 7 1 1 . 1 3 . 9 7 . 2 3 5 . 6 46 .7 2 . 9
JULY 4 8 . 3 1 . 7 1 1 . 1 6 . 1 6 . 4 2 4 . 8 37 .3 2 . 6 1 1 9 . 3 1 . 4 1 0 . 7 4 . 1 5 . 5 7 . 5 1 7 . 1 2 . 4 1 8 p 8 . 6 1 . 4 1 0 . 7 5 . 6 5 . 0 5 . 7 16 .2 2 . 8 2 5 p 8 . 2 1 . 6 1 0 . 7 3 . 3 5 . 2 1 1 . 5 2 0 . 0 2 . 8
e estimated p preliminary
Digitized for FRASER http://fraser.stlouisfed.org/ Federal Reserve Bank of St. Louis


![CENSUS 2011 - Statistical Release [P030142011]](https://static.fdocuments.us/doc/165x107/577cdaf31a28ab9e78a6f8f6/census-2011-statistical-release-p030142011.jpg)