FEDERAL RESERVE statistical release · PDF fileFEDERAL RESERVE statistical release H.8...
22
FEDERAL RESERVE statistical release H.8 Selected Assets and Liabilities of Commercial Banks in the United States 1 For use at 4:15 p.m. Eastern Time Percent change at break adjusted, seasonally adjusted, annual rate April 27, 2018 Account 2013 2014 2015 2016 2017 2016 2017 2017 2017 2017 2018 2017 2018 2018 2018 Q4 Q1 Q2 Q3 Q4 Q1 Dec Jan Feb Mar ASSETS 1 Bank credit 1.6 6.5 7.3 6.9 2.8 5.4 2.4 2.9 2.9 3.0 2.2 3.9 2.2 -0.1 2.1 2 Securities in bank credit 2 -1.9 6.8 6.1 8.0 1.7 6.3 2.7 2.0 0.6 1.5 -1.5 4.4 0.0 -10.0 -5.6 3 Treasury and agency securities 3 -5.8 11.3 8.9 10.1 2.6 9.9 3.0 2.2 2.5 2.7 -2.4 4.3 -2.7 -10.3 -2.2 6 Other securities 6.9 -2.3 -0.5 2.7 -0.8 -2.9 1.8 1.2 -4.8 -1.5 0.9 4.5 7.4 -9.3 -14.7 9 Loans and leases in bank credit 8 3.0 6.4 7.8 6.5 3.3 5.1 2.3 3.3 3.8 3.6 3.6 3.7 3.1 3.7 4.9 10 Commercial and industrial loans 6.9 12.0 10.6 6.5 0.7 5.4 -0.9 0.4 2.1 1.2 2.4 1.2 2.5 1.6 9.4 11 Real estate loans -1.0 2.4 5.3 6.5 3.6 5.4 3.4 3.8 3.8 3.3 3.6 4.2 3.2 2.9 4.2 12 Residential real estate loans -4.6 -0.7 1.3 3.3 1.4 2.5 -0.7 1.0 2.8 2.7 2.4 3.5 2.2 1.3 3.1 13 Revolving home equity loans -8.1 -4.0 -4.2 -6.2 -7.5 -8.0 -8.8 -7.3 -7.4 -7.4 -7.4 -5.3 -7.2 -7.3 -12.4 14 Closed-end residential loans 9 -3.5 0.3 2.8 5.8 3.6 5.1 1.2 2.9 5.1 4.9 4.5 5.4 4.2 3.1 6.3 15 Commercial real estate loans 4.5 6.8 10.5 10.3 6.1 8.7 8.0 6.9 4.7 4.0 4.8 4.9 4.3 4.6 5.4 20 Consumer loans 3.2 4.9 5.9 7.0 4.2 5.2 4.1 2.6 4.0 5.8 4.5 3.4 4.2 4.6 3.9 21 Credit cards and other revolving plans 1.1 3.3 5.7 6.3 5.1 4.6 3.9 3.8 5.4 6.8 4.6 2.8 4.1 4.7 3.6 22 Other consumer loans 5.8 6.9 6.2 7.7 3.1 5.9 4.3 1.2 2.2 4.8 4.3 4.0 4.3 4.5 4.5 25 All other loans and leases 13.7 14.8 14.6 6.0 5.5 3.3 1.9 6.9 6.6 6.0 4.8 6.7 2.2 8.5 0.8 28 LESS: Allowance for loan and lease losses -15.4 -12.4 -3.8 2.8 0.4 1.5 0.4 -2.6 0.4 3.3 0.0 -1.1 2.2 0.0 -1.1 29 Cash assets 18 54.4 12.2 -7.9 -14.4 7.8 -24.5 20.8 -7.0 10.4 6.6 -15.3 25.6 -37.9 -21.6 -41.0 30 Total federal funds sold and reverse RPs 19 -12.1 6.4 -0.4 3.2 8.3 -9.8 -22.6 16.9 17.8 21.9 28.1 17.6 25.5 10.0 83.8 31 Loans to commercial banks 20 8.8 -16.9 9.7 17.7 -3.0 -14.5 9.0 0.0 -5.9 -14.9 12.4 18.7 0.0 36.9 26.9 32 Other assets including trading assets 21 -9.1 2.3 -1.7 2.0 1.4 -2.5 -10.4 5.8 3.6 7.0 2.5 -3.0 5.1 4.3 -7.4 33 TOTAL ASSETS 6.7 7.3 3.5 2.8 3.6 -0.1 3.2 2.1 4.4 4.4 0.4 6.9 -2.8 -2.4 -2.5 LIABILITIES 34 Deposits 6.5 6.4 4.9 4.4 4.5 2.6 5.7 4.4 4.2 3.4 1.6 2.2 3.1 -1.3 2.3 35 Large time deposits 5.5 5.7 0.5 -11.0 7.0 -16.8 5.7 9.2 8.2 4.4 -3.5 -12.5 6.8 -10.2 -12.0 36 Other deposits 6.6 6.5 5.8 7.2 4.1 5.8 5.6 3.7 3.6 3.3 2.4 4.5 2.6 0.1 4.4 37 Borrowings -0.4 15.1 6.4 4.3 3.3 -1.2 2.2 1.2 8.3 1.4 0.3 8.8 3.1 -2.0 -29.1 39 Other liabilities including trading liabilities 22 -15.1 3.5 -5.7 -0.4 -8.5 -19.9 -32.9 9.9 -4.8 -5.9 13.1 -20.5 48.6 10.8 -10.7 40 TOTAL LIABILITIES 8.1 7.6 3.1 2.7 3.5 -0.8 3.2 2.6 4.1 4.0 0.4 2.5 -0.3 -1.6 -3.7 Percent changes are at a simple annual rate and have been adjusted to remove the effects of nonbank structure activity of $5 billion or more, as well as the estimated effects of the initial consolidation of certain variable interest entities (FIN 46) and off-balance-sheet vehicles (FAS 166/167). Figures reported in the H.8 Notes on the Data are generally used to make these adjustments. For information on how the data were constructed, see www.federalreserve.gov/releases/h8/about.htm. Line numbers on this page correspond to those used in the remainder of the release. Percent changes for other series shown on the release are available for customizable download through the Federal Reserve Board’s Data Download Program (DDP). Footnotes appear on the last page of the release.
Transcript of FEDERAL RESERVE statistical release · PDF fileFEDERAL RESERVE statistical release H.8...

FEDERAL RESERVE statistical release
H.8
Selected Assets and Liabilities of Commercial Banks in the United States1 For use at 4:15 p.m. Eastern Time
Percent change at break adjusted, seasonally adjusted, annual rate April 27, 2018
Account 2013 2014 2015 2016 20172016 2017 2017 2017 2017 2018 2017 2018 2018 2018
Q4 Q1 Q2 Q3 Q4 Q1 Dec Jan Feb Mar
ASSETS
1 Bank credit 1.6 6.5 7.3 6.9 2.8 5.4 2.4 2.9 2.9 3.0 2.2 3.9 2.2 -0.1 2.1
2 Securities in bank credit2 -1.9 6.8 6.1 8.0 1.7 6.3 2.7 2.0 0.6 1.5 -1.5 4.4 0.0 -10.0 -5.6
3 Treasury and agency securities3 -5.8 11.3 8.9 10.1 2.6 9.9 3.0 2.2 2.5 2.7 -2.4 4.3 -2.7 -10.3 -2.2
6 Other securities 6.9 -2.3 -0.5 2.7 -0.8 -2.9 1.8 1.2 -4.8 -1.5 0.9 4.5 7.4 -9.3 -14.7
9 Loans and leases in bank credit8 3.0 6.4 7.8 6.5 3.3 5.1 2.3 3.3 3.8 3.6 3.6 3.7 3.1 3.7 4.9
10 Commercial and industrial loans 6.9 12.0 10.6 6.5 0.7 5.4 -0.9 0.4 2.1 1.2 2.4 1.2 2.5 1.6 9.4
11 Real estate loans -1.0 2.4 5.3 6.5 3.6 5.4 3.4 3.8 3.8 3.3 3.6 4.2 3.2 2.9 4.2
12 Residential real estate loans -4.6 -0.7 1.3 3.3 1.4 2.5 -0.7 1.0 2.8 2.7 2.4 3.5 2.2 1.3 3.1
13 Revolving home equity loans -8.1 -4.0 -4.2 -6.2 -7.5 -8.0 -8.8 -7.3 -7.4 -7.4 -7.4 -5.3 -7.2 -7.3 -12.4
14 Closed-end residential loans9 -3.5 0.3 2.8 5.8 3.6 5.1 1.2 2.9 5.1 4.9 4.5 5.4 4.2 3.1 6.3
15 Commercial real estate loans 4.5 6.8 10.5 10.3 6.1 8.7 8.0 6.9 4.7 4.0 4.8 4.9 4.3 4.6 5.4
20 Consumer loans 3.2 4.9 5.9 7.0 4.2 5.2 4.1 2.6 4.0 5.8 4.5 3.4 4.2 4.6 3.9
21 Credit cards and other revolving plans 1.1 3.3 5.7 6.3 5.1 4.6 3.9 3.8 5.4 6.8 4.6 2.8 4.1 4.7 3.6
22 Other consumer loans 5.8 6.9 6.2 7.7 3.1 5.9 4.3 1.2 2.2 4.8 4.3 4.0 4.3 4.5 4.5
25 All other loans and leases 13.7 14.8 14.6 6.0 5.5 3.3 1.9 6.9 6.6 6.0 4.8 6.7 2.2 8.5 0.8
28 LESS: Allowance for loan and lease losses -15.4 -12.4 -3.8 2.8 0.4 1.5 0.4 -2.6 0.4 3.3 0.0 -1.1 2.2 0.0 -1.1
29 Cash assets18 54.4 12.2 -7.9 -14.4 7.8 -24.5 20.8 -7.0 10.4 6.6 -15.3 25.6 -37.9 -21.6 -41.0
30 Total federal funds sold and reverse RPs19 -12.1 6.4 -0.4 3.2 8.3 -9.8 -22.6 16.9 17.8 21.9 28.1 17.6 25.5 10.0 83.8
31 Loans to commercial banks20 8.8 -16.9 9.7 17.7 -3.0 -14.5 9.0 0.0 -5.9 -14.9 12.4 18.7 0.0 36.9 26.9
32 Other assets including trading assets21 -9.1 2.3 -1.7 2.0 1.4 -2.5 -10.4 5.8 3.6 7.0 2.5 -3.0 5.1 4.3 -7.4
33 TOTAL ASSETS 6.7 7.3 3.5 2.8 3.6 -0.1 3.2 2.1 4.4 4.4 0.4 6.9 -2.8 -2.4 -2.5
LIABILITIES
34 Deposits 6.5 6.4 4.9 4.4 4.5 2.6 5.7 4.4 4.2 3.4 1.6 2.2 3.1 -1.3 2.3
35 Large time deposits 5.5 5.7 0.5 -11.0 7.0 -16.8 5.7 9.2 8.2 4.4 -3.5 -12.5 6.8 -10.2 -12.0
36 Other deposits 6.6 6.5 5.8 7.2 4.1 5.8 5.6 3.7 3.6 3.3 2.4 4.5 2.6 0.1 4.4
37 Borrowings -0.4 15.1 6.4 4.3 3.3 -1.2 2.2 1.2 8.3 1.4 0.3 8.8 3.1 -2.0 -29.1
39 Other liabilities including trading liabilities22 -15.1 3.5 -5.7 -0.4 -8.5 -19.9 -32.9 9.9 -4.8 -5.9 13.1 -20.5 48.6 10.8 -10.7
40 TOTAL LIABILITIES 8.1 7.6 3.1 2.7 3.5 -0.8 3.2 2.6 4.1 4.0 0.4 2.5 -0.3 -1.6 -3.7
Percent changes are at a simple annual rate and have been adjusted to remove the effects of nonbank structure activity of $5 billion or more, as well as the estimated effects of the initial consolidation of certain
variable interest entities (FIN 46) and off-balance-sheet vehicles (FAS 166/167). Figures reported in the H.8 Notes on the Data are generally used to make these adjustments. For information on how the data were
constructed, see www.federalreserve.gov/releases/h8/about.htm. Line numbers on this page correspond to those used in the remainder of the release. Percent changes for other series shown on the release are
available for customizable download through the Federal Reserve Board’s Data Download Program (DDP). Footnotes appear on the last page of the release.

H.8 Page 2
Assets and Liabilities of Commercial Banks in the United States1
Seasonally adjusted, billions of dollars April 27, 2018
Account2017 2017 2017 2017 2017 2018 2018 2018 Week ending
Mar Sep Oct Nov Dec Jan Feb Mar Mar 28 Apr 4 Apr 11 Apr 18
ASSETS
1 Bank credit 12,183.5 12,376.1 12,434.7 12,483.6 12,543.1 12,566.3 12,570.6 12,592.2 12,618.0 12,595.8 12,612.1 12,631.2
2 Securities in bank credit2 3,356.9 3,374.9 3,387.3 3,404.5 3,435.9 3,435.8 3,408.1 3,392.3 3,390.2 3,380.1 3,374.0 3,386.0
3 Treasury and agency securities3 2,440.8 2,471.2 2,488.9 2,498.1 2,526.2 2,520.5 2,499.5 2,494.9 2,498.2 2,496.4 2,493.7 2,504.3
4 Mortgage-backed securities (MBS)4 1,703.2 1,772.5 1,782.7 1,791.0 1,816.5 1,806.8 1,792.0 1,795.2 1,801.1 1,798.2 1,796.0 1,803.1
5 Non-MBS5 737.6 698.7 706.2 707.1 709.7 713.7 707.6 699.7 697.1 698.2 697.7 701.2
6 Other securities 916.2 903.7 898.4 906.4 909.7 915.3 908.5 897.4 892.1 883.6 880.3 881.7
7 Mortgage-backed securities (MBS)6 91.9 86.5 85.7 83.2 81.6 84.1 84.5 82.0 80.3 80.2 80.2 80.3
8 Non-MBS7 824.3 817.2 812.7 823.1 828.1 831.2 824.0 815.4 811.8 803.4 800.1 801.4
9 Loans and leases in bank credit8 8,826.6 9,001.2 9,047.3 9,079.1 9,107.2 9,130.5 9,162.5 9,199.9 9,227.7 9,215.7 9,238.2 9,245.2
10 Commercial and industrial loans 2,084.2 2,114.4 2,113.7 2,112.4 2,114.6 2,119.0 2,122.0 2,138.6 2,151.3 2,156.7 2,160.8 2,162.5
11 Real estate loans 4,155.1 4,232.3 4,257.6 4,271.5 4,286.4 4,297.9 4,312.2 4,327.4 4,335.5 4,328.8 4,337.6 4,339.6
12 Residential real estate loans 2,149.7 2,177.7 2,190.7 2,194.6 2,201.0 2,205.1 2,209.6 2,215.3 2,221.0 2,216.4 2,222.4 2,221.2
13 Revolving home equity loans 402.4 387.9 385.8 383.3 381.6 379.2 377.1 373.2 372.2 371.4 370.7 370.6
14 Closed-end residential loans9 1,747.4 1,789.8 1,804.9 1,811.3 1,819.4 1,825.8 1,832.5 1,842.1 1,848.8 1,845.1 1,851.6 1,850.6
15 Commercial real estate loans 2,005.4 2,054.6 2,066.8 2,076.9 2,085.4 2,092.9 2,102.6 2,112.0 2,114.5 2,112.4 2,115.2 2,118.4
16 Construction and land development loans10 305.8 317.3 319.6 321.9 323.5 325.3 327.2 329.4 329.8 329.6 329.5 330.4
17 Secured by farmland11 94.5 97.1 97.5 97.8 98.2 98.4 98.8 99.3 99.4 99.6 99.7 99.8
18 Secured by multifamily properties12 316.6 322.2 327.0 329.2 331.2 333.1 335.1 337.9 338.9 337.8 338.4 339.7
19 Secured by nonfarm nonresidential properties13 1,288.5 1,318.0 1,322.7 1,328.1 1,332.6 1,336.0 1,341.5 1,345.4 1,346.4 1,345.4 1,347.7 1,348.5
20 Consumer loans 1,366.6 1,392.7 1,408.0 1,421.8 1,425.8 1,430.8 1,436.3 1,441.0 1,442.0 1,445.5 1,445.7 1,446.0
21 Credit cards and other revolving plans 717.0 736.2 748.6 760.3 762.1 764.7 767.7 770.0 769.9 771.4 771.4 771.3
22 Other consumer loans 649.6 656.5 659.4 661.5 663.7 666.1 668.6 671.1 672.1 674.1 674.3 674.7
23 Automobile loans14 412.4 416.8 418.4 418.9 419.9 420.8 421.8 422.0 422.1 423.2 423.2 423.0
24 All other consumer loans15 237.2 239.6 241.0 242.6 243.8 245.4 246.8 249.1 250.0 250.9 251.1 251.8
25 All other loans and leases 1,220.6 1,261.8 1,268.0 1,273.4 1,280.5 1,282.8 1,292.0 1,292.9 1,299.0 1,284.7 1,294.0 1,297.1
26 Loans to nondepository financial institutions16 412.4 434.6 436.2 439.0 438.3 437.8 442.3 445.0 450.1 446.5 449.2 453.0
27 All loans not elsewhere classified17 808.2 827.3 831.8 834.4 842.2 845.0 849.7 847.9 848.9 838.2 844.8 844.1
28 LESS: Allowance for loan and lease losses 109.5 109.2 110.0 109.9 109.9 110.1 110.1 110.0 110.0 110.2 110.2 110.4
Footnotes appear on the last page.
H.8 Page 3
Assets and Liabilities of Commercial Banks in the United States1
Seasonally adjusted, billions of dollars (continued) April 27, 2018
Account2017 2017 2017 2017 2017 2018 2018 2018 Week ending
Mar Sep Oct Nov Dec Jan Feb Mar Mar 28 Apr 4 Apr 11 Apr 18
ASSETS (CONTINUED)
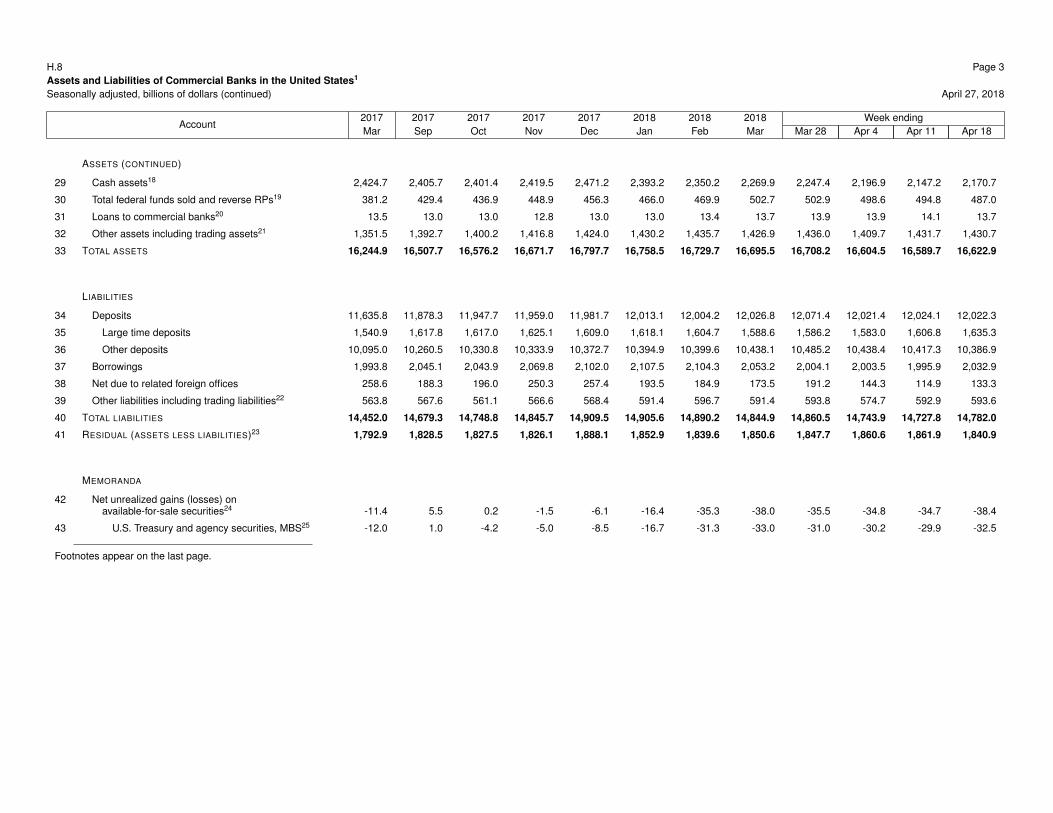
29 Cash assets18 2,424.7 2,405.7 2,401.4 2,419.5 2,471.2 2,393.2 2,350.2 2,269.9 2,247.4 2,196.9 2,147.2 2,170.7
30 Total federal funds sold and reverse RPs19 381.2 429.4 436.9 448.9 456.3 466.0 469.9 502.7 502.9 498.6 494.8 487.0
31 Loans to commercial banks20 13.5 13.0 13.0 12.8 13.0 13.0 13.4 13.7 13.9 13.9 14.1 13.7
32 Other assets including trading assets21 1,351.5 1,392.7 1,400.2 1,416.8 1,424.0 1,430.2 1,435.7 1,426.9 1,436.0 1,409.7 1,431.7 1,430.7
33 TOTAL ASSETS 16,244.9 16,507.7 16,576.2 16,671.7 16,797.7 16,758.5 16,729.7 16,695.5 16,708.2 16,604.5 16,589.7 16,622.9
LIABILITIES
34 Deposits 11,635.8 11,878.3 11,947.7 11,959.0 11,981.7 12,013.1 12,004.2 12,026.8 12,071.4 12,021.4 12,024.1 12,022.3
35 Large time deposits 1,540.9 1,617.8 1,617.0 1,625.1 1,609.0 1,618.1 1,604.7 1,588.6 1,586.2 1,583.0 1,606.8 1,635.3
36 Other deposits 10,095.0 10,260.5 10,330.8 10,333.9 10,372.7 10,394.9 10,399.6 10,438.1 10,485.2 10,438.4 10,417.3 10,386.9
37 Borrowings 1,993.8 2,045.1 2,043.9 2,069.8 2,102.0 2,107.5 2,104.3 2,053.2 2,004.1 2,003.5 1,995.9 2,032.9
38 Net due to related foreign offices 258.6 188.3 196.0 250.3 257.4 193.5 184.9 173.5 191.2 144.3 114.9 133.3
39 Other liabilities including trading liabilities22 563.8 567.6 561.1 566.6 568.4 591.4 596.7 591.4 593.8 574.7 592.9 593.6
40 TOTAL LIABILITIES 14,452.0 14,679.3 14,748.8 14,845.7 14,909.5 14,905.6 14,890.2 14,844.9 14,860.5 14,743.9 14,727.8 14,782.0
41 RESIDUAL (ASSETS LESS LIABILITIES)23 1,792.9 1,828.5 1,827.5 1,826.1 1,888.1 1,852.9 1,839.6 1,850.6 1,847.7 1,860.6 1,861.9 1,840.9
MEMORANDA
42 Net unrealized gains (losses) onavailable-for-sale securities24 -11.4 5.5 0.2 -1.5 -6.1 -16.4 -35.3 -38.0 -35.5 -34.8 -34.7 -38.4
43 U.S. Treasury and agency securities, MBS25 -12.0 1.0 -4.2 -5.0 -8.5 -16.7 -31.3 -33.0 -31.0 -30.2 -29.9 -32.5
Footnotes appear on the last page.

H.8 Page 4
Assets and Liabilities of Commercial Banks in the United States1
Not seasonally adjusted, billions of dollars April 27, 2018
Account2017 2017 2017 2017 2017 2018 2018 2018 Week ending
Mar Sep Oct Nov Dec Jan Feb Mar Mar 28 Apr 4 Apr 11 Apr 18
ASSETS
1 Bank credit 12,149.5 12,371.5 12,449.0 12,520.6 12,603.5 12,589.2 12,556.2 12,550.6 12,568.3 12,579.8 12,582.6 12,605.3
2 Securities in bank credit2 3,358.4 3,368.2 3,389.6 3,423.7 3,446.2 3,437.0 3,411.2 3,391.3 3,386.1 3,381.8 3,377.7 3,385.8
3 Treasury and agency securities3 2,443.8 2,462.9 2,487.9 2,513.9 2,534.4 2,522.7 2,505.3 2,496.2 2,495.8 2,500.2 2,496.7 2,505.2
4 Mortgage-backed securities (MBS)4 1,698.1 1,772.9 1,788.2 1,804.7 1,821.6 1,805.4 1,789.0 1,788.5 1,793.6 1,796.2 1,790.1 1,798.3
5 Non-MBS5 745.8 689.9 699.6 709.2 712.8 717.3 716.2 707.7 702.2 704.0 706.6 706.9
6 Other securities 914.6 905.3 901.7 909.8 911.9 914.4 905.9 895.1 890.3 881.6 881.0 880.6
7 Mortgage-backed securities (MBS)6 91.5 86.4 85.6 82.9 81.2 83.6 84.0 81.7 79.9 80.7 81.2 80.5
8 Non-MBS7 823.1 818.9 816.1 826.9 830.6 830.7 821.9 813.5 810.3 800.9 799.8 800.0
9 Loans and leases in bank credit8 8,791.1 9,003.3 9,059.4 9,096.9 9,157.3 9,152.2 9,145.0 9,159.3 9,182.2 9,197.9 9,204.9 9,219.6
10 Commercial and industrial loans 2,091.8 2,104.0 2,110.7 2,109.9 2,113.4 2,112.6 2,124.1 2,145.4 2,153.9 2,164.0 2,164.2 2,178.7
11 Real estate loans 4,139.2 4,237.0 4,264.5 4,280.5 4,292.9 4,300.6 4,303.7 4,309.8 4,315.1 4,318.2 4,325.4 4,320.3
12 Residential real estate loans 2,137.7 2,182.9 2,197.0 2,201.8 2,205.8 2,205.8 2,202.4 2,202.1 2,204.6 2,208.5 2,212.8 2,204.3
13 Revolving home equity loans 400.8 388.7 386.7 384.1 382.7 379.5 376.1 371.7 370.7 369.6 369.2 369.8
14 Closed-end residential loans9 1,736.9 1,794.2 1,810.3 1,817.7 1,823.1 1,826.3 1,826.3 1,830.4 1,833.9 1,838.9 1,843.7 1,834.5
15 Commercial real estate loans 2,001.6 2,054.2 2,067.5 2,078.7 2,087.1 2,094.8 2,101.3 2,107.7 2,110.5 2,109.7 2,112.6 2,116.0
16 Construction and land development loans10 306.2 316.6 320.5 324.1 323.9 325.9 328.8 330.0 330.3 328.8 328.9 330.2
17 Secured by farmland11 94.0 97.5 97.8 97.8 98.3 98.2 98.4 98.8 99.0 99.2 99.3 99.4
18 Secured by multifamily properties12 315.4 322.1 326.6 329.0 332.1 333.3 334.1 336.7 337.8 337.9 338.6 339.8
19 Secured by nonfarm nonresidential properties13 1,285.9 1,317.9 1,322.6 1,327.9 1,332.7 1,337.3 1,340.0 1,342.3 1,343.4 1,343.7 1,345.8 1,346.6
20 Consumer loans 1,348.3 1,396.8 1,410.0 1,429.0 1,456.2 1,451.6 1,435.6 1,421.4 1,424.5 1,426.6 1,427.5 1,428.8
21 Credit cards and other revolving plans 702.4 736.9 747.2 765.0 790.8 783.7 767.8 754.1 756.6 757.1 757.4 757.7
22 Other consumer loans 645.9 659.9 662.9 664.0 665.4 667.9 667.7 667.3 667.9 669.5 670.1 671.2
23 Automobile loans14 410.3 418.7 420.2 420.2 420.9 421.4 420.5 419.8 420.1 421.0 421.1 420.9
24 All other consumer loans15 235.6 241.2 242.7 243.8 244.5 246.5 247.3 247.5 247.8 248.5 249.0 250.3
25 All other loans and leases 1,211.7 1,265.5 1,274.3 1,277.5 1,294.9 1,287.4 1,281.6 1,282.7 1,288.6 1,289.1 1,287.8 1,291.8
26 Loans to nondepository financial institutions16 406.1 437.8 441.6 445.0 446.4 436.6 435.0 437.6 442.8 449.1 445.4 449.7
27 All loans not elsewhere classified17 805.6 827.7 832.7 832.4 848.5 850.8 846.6 845.1 845.8 839.9 842.4 842.0
28 LESS: Allowance for loan and lease losses 109.7 109.3 110.0 110.3 110.3 109.8 110.2 110.2 109.8 109.9 109.9 109.9
Footnotes appear on the last page.
H.8 Page 5
Assets and Liabilities of Commercial Banks in the United States1
Not seasonally adjusted, billions of dollars (continued) April 27, 2018
Account2017 2017 2017 2017 2017 2018 2018 2018 Week ending
Mar Sep Oct Nov Dec Jan Feb Mar Mar 28 Apr 4 Apr 11 Apr 18
ASSETS (CONTINUED)
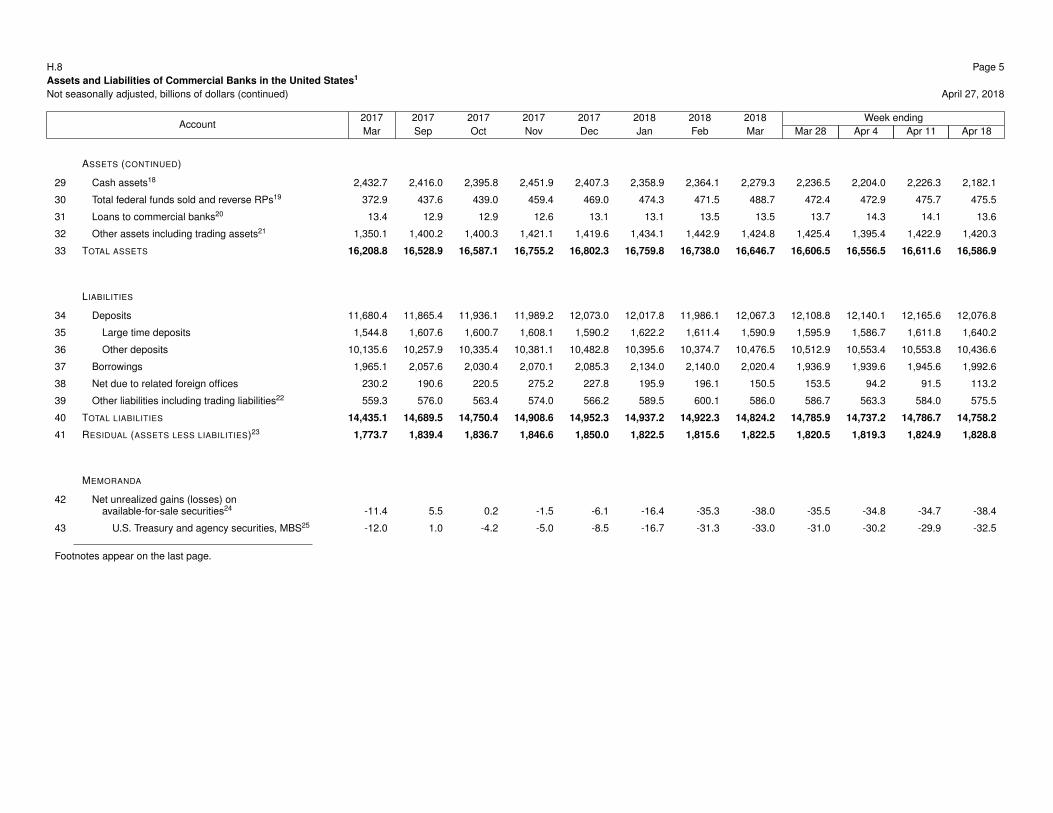
29 Cash assets18 2,432.7 2,416.0 2,395.8 2,451.9 2,407.3 2,358.9 2,364.1 2,279.3 2,236.5 2,204.0 2,226.3 2,182.1
30 Total federal funds sold and reverse RPs19 372.9 437.6 439.0 459.4 469.0 474.3 471.5 488.7 472.4 472.9 475.7 475.5
31 Loans to commercial banks20 13.4 12.9 12.9 12.6 13.1 13.1 13.5 13.5 13.7 14.3 14.1 13.6
32 Other assets including trading assets21 1,350.1 1,400.2 1,400.3 1,421.1 1,419.6 1,434.1 1,442.9 1,424.8 1,425.4 1,395.4 1,422.9 1,420.3
33 TOTAL ASSETS 16,208.8 16,528.9 16,587.1 16,755.2 16,802.3 16,759.8 16,738.0 16,646.7 16,606.5 16,556.5 16,611.6 16,586.9
LIABILITIES
34 Deposits 11,680.4 11,865.4 11,936.1 11,989.2 12,073.0 12,017.8 11,986.1 12,067.3 12,108.8 12,140.1 12,165.6 12,076.8
35 Large time deposits 1,544.8 1,607.6 1,600.7 1,608.1 1,590.2 1,622.2 1,611.4 1,590.9 1,595.9 1,586.7 1,611.8 1,640.2
36 Other deposits 10,135.6 10,257.9 10,335.4 10,381.1 10,482.8 10,395.6 10,374.7 10,476.5 10,512.9 10,553.4 10,553.8 10,436.6
37 Borrowings 1,965.1 2,057.6 2,030.4 2,070.1 2,085.3 2,134.0 2,140.0 2,020.4 1,936.9 1,939.6 1,945.6 1,992.6
38 Net due to related foreign offices 230.2 190.6 220.5 275.2 227.8 195.9 196.1 150.5 153.5 94.2 91.5 113.2
39 Other liabilities including trading liabilities22 559.3 576.0 563.4 574.0 566.2 589.5 600.1 586.0 586.7 563.3 584.0 575.5
40 TOTAL LIABILITIES 14,435.1 14,689.5 14,750.4 14,908.6 14,952.3 14,937.2 14,922.3 14,824.2 14,785.9 14,737.2 14,786.7 14,758.2
41 RESIDUAL (ASSETS LESS LIABILITIES)23 1,773.7 1,839.4 1,836.7 1,846.6 1,850.0 1,822.5 1,815.6 1,822.5 1,820.5 1,819.3 1,824.9 1,828.8
MEMORANDA
42 Net unrealized gains (losses) onavailable-for-sale securities24 -11.4 5.5 0.2 -1.5 -6.1 -16.4 -35.3 -38.0 -35.5 -34.8 -34.7 -38.4
43 U.S. Treasury and agency securities, MBS25 -12.0 1.0 -4.2 -5.0 -8.5 -16.7 -31.3 -33.0 -31.0 -30.2 -29.9 -32.5
Footnotes appear on the last page.
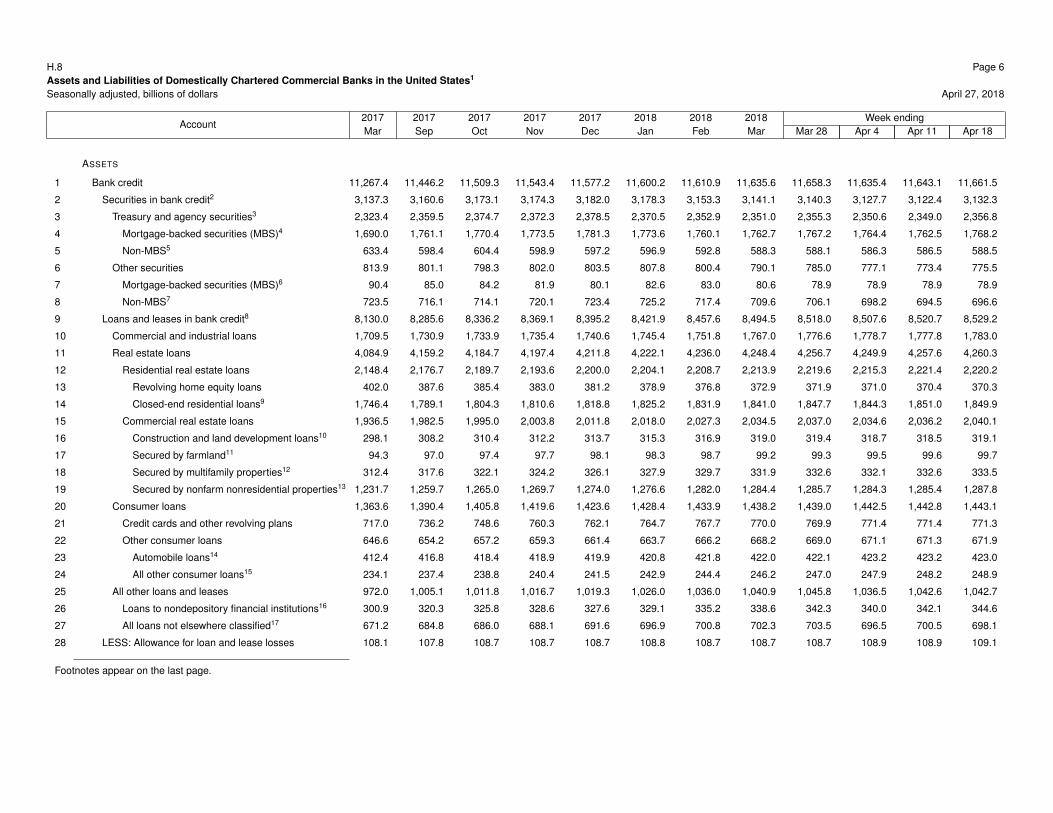
H.8 Page 6
Assets and Liabilities of Domestically Chartered Commercial Banks in the United States1
Seasonally adjusted, billions of dollars April 27, 2018
Account2017 2017 2017 2017 2017 2018 2018 2018 Week ending
Mar Sep Oct Nov Dec Jan Feb Mar Mar 28 Apr 4 Apr 11 Apr 18
ASSETS
1 Bank credit 11,267.4 11,446.2 11,509.3 11,543.4 11,577.2 11,600.2 11,610.9 11,635.6 11,658.3 11,635.4 11,643.1 11,661.5
2 Securities in bank credit2 3,137.3 3,160.6 3,173.1 3,174.3 3,182.0 3,178.3 3,153.3 3,141.1 3,140.3 3,127.7 3,122.4 3,132.3
3 Treasury and agency securities3 2,323.4 2,359.5 2,374.7 2,372.3 2,378.5 2,370.5 2,352.9 2,351.0 2,355.3 2,350.6 2,349.0 2,356.8
4 Mortgage-backed securities (MBS)4 1,690.0 1,761.1 1,770.4 1,773.5 1,781.3 1,773.6 1,760.1 1,762.7 1,767.2 1,764.4 1,762.5 1,768.2
5 Non-MBS5 633.4 598.4 604.4 598.9 597.2 596.9 592.8 588.3 588.1 586.3 586.5 588.5
6 Other securities 813.9 801.1 798.3 802.0 803.5 807.8 800.4 790.1 785.0 777.1 773.4 775.5
7 Mortgage-backed securities (MBS)6 90.4 85.0 84.2 81.9 80.1 82.6 83.0 80.6 78.9 78.9 78.9 78.9
8 Non-MBS7 723.5 716.1 714.1 720.1 723.4 725.2 717.4 709.6 706.1 698.2 694.5 696.6
9 Loans and leases in bank credit8 8,130.0 8,285.6 8,336.2 8,369.1 8,395.2 8,421.9 8,457.6 8,494.5 8,518.0 8,507.6 8,520.7 8,529.2
10 Commercial and industrial loans 1,709.5 1,730.9 1,733.9 1,735.4 1,740.6 1,745.4 1,751.8 1,767.0 1,776.6 1,778.7 1,777.8 1,783.0
11 Real estate loans 4,084.9 4,159.2 4,184.7 4,197.4 4,211.8 4,222.1 4,236.0 4,248.4 4,256.7 4,249.9 4,257.6 4,260.3
12 Residential real estate loans 2,148.4 2,176.7 2,189.7 2,193.6 2,200.0 2,204.1 2,208.7 2,213.9 2,219.6 2,215.3 2,221.4 2,220.2
13 Revolving home equity loans 402.0 387.6 385.4 383.0 381.2 378.9 376.8 372.9 371.9 371.0 370.4 370.3
14 Closed-end residential loans9 1,746.4 1,789.1 1,804.3 1,810.6 1,818.8 1,825.2 1,831.9 1,841.0 1,847.7 1,844.3 1,851.0 1,849.9
15 Commercial real estate loans 1,936.5 1,982.5 1,995.0 2,003.8 2,011.8 2,018.0 2,027.3 2,034.5 2,037.0 2,034.6 2,036.2 2,040.1
16 Construction and land development loans10 298.1 308.2 310.4 312.2 313.7 315.3 316.9 319.0 319.4 318.7 318.5 319.1
17 Secured by farmland11 94.3 97.0 97.4 97.7 98.1 98.3 98.7 99.2 99.3 99.5 99.6 99.7
18 Secured by multifamily properties12 312.4 317.6 322.1 324.2 326.1 327.9 329.7 331.9 332.6 332.1 332.6 333.5
19 Secured by nonfarm nonresidential properties13 1,231.7 1,259.7 1,265.0 1,269.7 1,274.0 1,276.6 1,282.0 1,284.4 1,285.7 1,284.3 1,285.4 1,287.8
20 Consumer loans 1,363.6 1,390.4 1,405.8 1,419.6 1,423.6 1,428.4 1,433.9 1,438.2 1,439.0 1,442.5 1,442.8 1,443.1
21 Credit cards and other revolving plans 717.0 736.2 748.6 760.3 762.1 764.7 767.7 770.0 769.9 771.4 771.4 771.3
22 Other consumer loans 646.6 654.2 657.2 659.3 661.4 663.7 666.2 668.2 669.0 671.1 671.3 671.9
23 Automobile loans14 412.4 416.8 418.4 418.9 419.9 420.8 421.8 422.0 422.1 423.2 423.2 423.0
24 All other consumer loans15 234.1 237.4 238.8 240.4 241.5 242.9 244.4 246.2 247.0 247.9 248.2 248.9
25 All other loans and leases 972.0 1,005.1 1,011.8 1,016.7 1,019.3 1,026.0 1,036.0 1,040.9 1,045.8 1,036.5 1,042.6 1,042.7
26 Loans to nondepository financial institutions16 300.9 320.3 325.8 328.6 327.6 329.1 335.2 338.6 342.3 340.0 342.1 344.6
27 All loans not elsewhere classified17 671.2 684.8 686.0 688.1 691.6 696.9 700.8 702.3 703.5 696.5 700.5 698.1
28 LESS: Allowance for loan and lease losses 108.1 107.8 108.7 108.7 108.7 108.8 108.7 108.7 108.7 108.9 108.9 109.1
Footnotes appear on the last page.
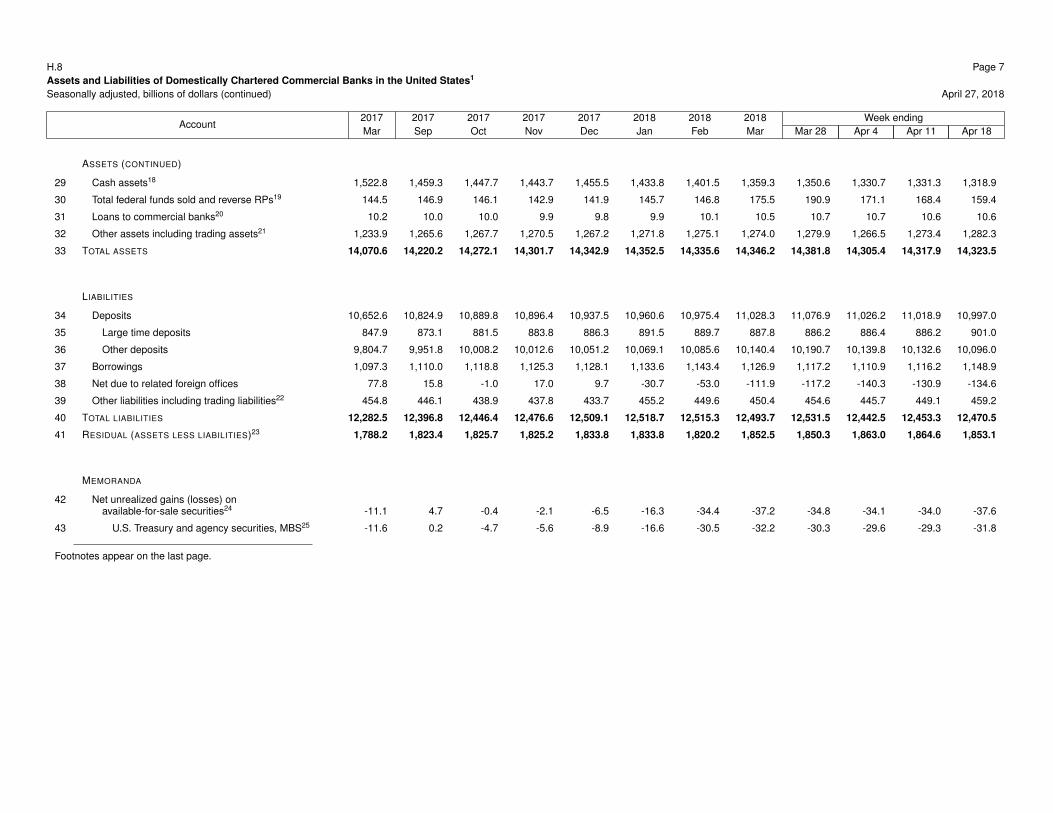
H.8 Page 7
Assets and Liabilities of Domestically Chartered Commercial Banks in the United States1
Seasonally adjusted, billions of dollars (continued) April 27, 2018
Account2017 2017 2017 2017 2017 2018 2018 2018 Week ending
Mar Sep Oct Nov Dec Jan Feb Mar Mar 28 Apr 4 Apr 11 Apr 18
ASSETS (CONTINUED)
29 Cash assets18 1,522.8 1,459.3 1,447.7 1,443.7 1,455.5 1,433.8 1,401.5 1,359.3 1,350.6 1,330.7 1,331.3 1,318.9
30 Total federal funds sold and reverse RPs19 144.5 146.9 146.1 142.9 141.9 145.7 146.8 175.5 190.9 171.1 168.4 159.4
31 Loans to commercial banks20 10.2 10.0 10.0 9.9 9.8 9.9 10.1 10.5 10.7 10.7 10.6 10.6
32 Other assets including trading assets21 1,233.9 1,265.6 1,267.7 1,270.5 1,267.2 1,271.8 1,275.1 1,274.0 1,279.9 1,266.5 1,273.4 1,282.3
33 TOTAL ASSETS 14,070.6 14,220.2 14,272.1 14,301.7 14,342.9 14,352.5 14,335.6 14,346.2 14,381.8 14,305.4 14,317.9 14,323.5
LIABILITIES
34 Deposits 10,652.6 10,824.9 10,889.8 10,896.4 10,937.5 10,960.6 10,975.4 11,028.3 11,076.9 11,026.2 11,018.9 10,997.0
35 Large time deposits 847.9 873.1 881.5 883.8 886.3 891.5 889.7 887.8 886.2 886.4 886.2 901.0
36 Other deposits 9,804.7 9,951.8 10,008.2 10,012.6 10,051.2 10,069.1 10,085.6 10,140.4 10,190.7 10,139.8 10,132.6 10,096.0
37 Borrowings 1,097.3 1,110.0 1,118.8 1,125.3 1,128.1 1,133.6 1,143.4 1,126.9 1,117.2 1,110.9 1,116.2 1,148.9
38 Net due to related foreign offices 77.8 15.8 -1.0 17.0 9.7 -30.7 -53.0 -111.9 -117.2 -140.3 -130.9 -134.6
39 Other liabilities including trading liabilities22 454.8 446.1 438.9 437.8 433.7 455.2 449.6 450.4 454.6 445.7 449.1 459.2
40 TOTAL LIABILITIES 12,282.5 12,396.8 12,446.4 12,476.6 12,509.1 12,518.7 12,515.3 12,493.7 12,531.5 12,442.5 12,453.3 12,470.5
41 RESIDUAL (ASSETS LESS LIABILITIES)23 1,788.2 1,823.4 1,825.7 1,825.2 1,833.8 1,833.8 1,820.2 1,852.5 1,850.3 1,863.0 1,864.6 1,853.1
MEMORANDA
42 Net unrealized gains (losses) onavailable-for-sale securities24 -11.1 4.7 -0.4 -2.1 -6.5 -16.3 -34.4 -37.2 -34.8 -34.1 -34.0 -37.6
43 U.S. Treasury and agency securities, MBS25 -11.6 0.2 -4.7 -5.6 -8.9 -16.6 -30.5 -32.2 -30.3 -29.6 -29.3 -31.8
Footnotes appear on the last page.
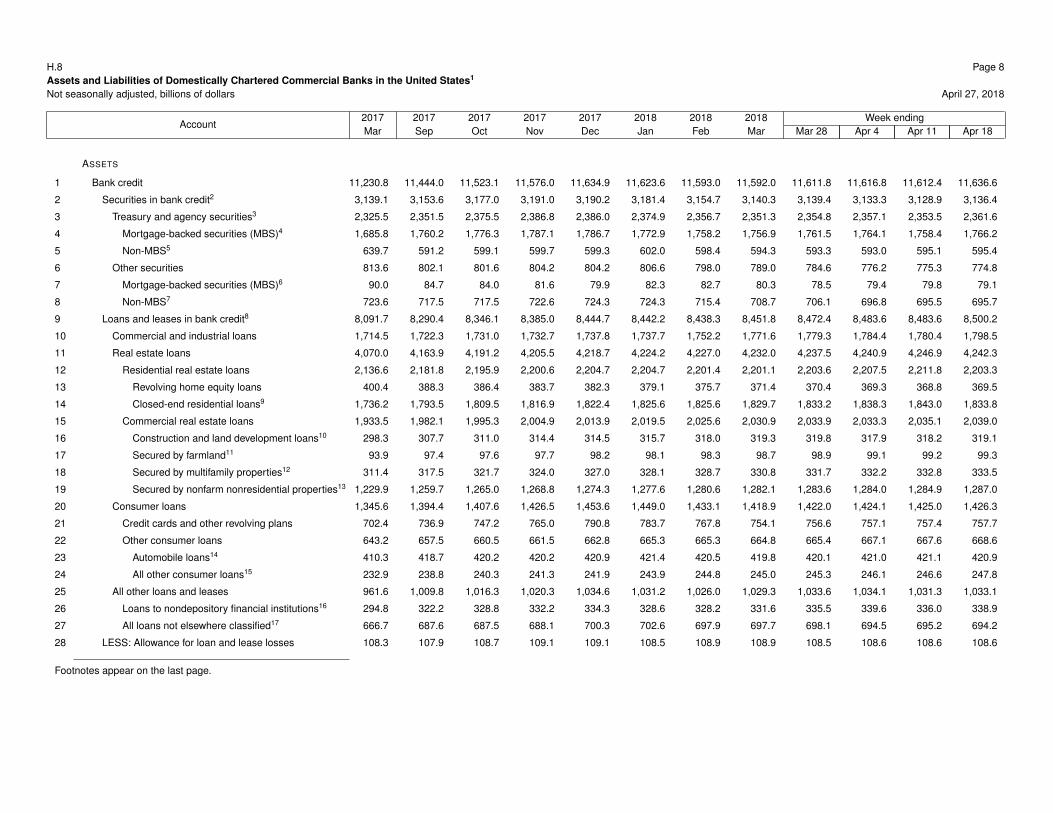
H.8 Page 8
Assets and Liabilities of Domestically Chartered Commercial Banks in the United States1
Not seasonally adjusted, billions of dollars April 27, 2018
Account2017 2017 2017 2017 2017 2018 2018 2018 Week ending
Mar Sep Oct Nov Dec Jan Feb Mar Mar 28 Apr 4 Apr 11 Apr 18
ASSETS
1 Bank credit 11,230.8 11,444.0 11,523.1 11,576.0 11,634.9 11,623.6 11,593.0 11,592.0 11,611.8 11,616.8 11,612.4 11,636.6
2 Securities in bank credit2 3,139.1 3,153.6 3,177.0 3,191.0 3,190.2 3,181.4 3,154.7 3,140.3 3,139.4 3,133.3 3,128.9 3,136.4
3 Treasury and agency securities3 2,325.5 2,351.5 2,375.5 2,386.8 2,386.0 2,374.9 2,356.7 2,351.3 2,354.8 2,357.1 2,353.5 2,361.6
4 Mortgage-backed securities (MBS)4 1,685.8 1,760.2 1,776.3 1,787.1 1,786.7 1,772.9 1,758.2 1,756.9 1,761.5 1,764.1 1,758.4 1,766.2
5 Non-MBS5 639.7 591.2 599.1 599.7 599.3 602.0 598.4 594.3 593.3 593.0 595.1 595.4
6 Other securities 813.6 802.1 801.6 804.2 804.2 806.6 798.0 789.0 784.6 776.2 775.3 774.8
7 Mortgage-backed securities (MBS)6 90.0 84.7 84.0 81.6 79.9 82.3 82.7 80.3 78.5 79.4 79.8 79.1
8 Non-MBS7 723.6 717.5 717.5 722.6 724.3 724.3 715.4 708.7 706.1 696.8 695.5 695.7
9 Loans and leases in bank credit8 8,091.7 8,290.4 8,346.1 8,385.0 8,444.7 8,442.2 8,438.3 8,451.8 8,472.4 8,483.6 8,483.6 8,500.2
10 Commercial and industrial loans 1,714.5 1,722.3 1,731.0 1,732.7 1,737.8 1,737.7 1,752.2 1,771.6 1,779.3 1,784.4 1,780.4 1,798.5
11 Real estate loans 4,070.0 4,163.9 4,191.2 4,205.5 4,218.7 4,224.2 4,227.0 4,232.0 4,237.5 4,240.9 4,246.9 4,242.3
12 Residential real estate loans 2,136.6 2,181.8 2,195.9 2,200.6 2,204.7 2,204.7 2,201.4 2,201.1 2,203.6 2,207.5 2,211.8 2,203.3
13 Revolving home equity loans 400.4 388.3 386.4 383.7 382.3 379.1 375.7 371.4 370.4 369.3 368.8 369.5
14 Closed-end residential loans9 1,736.2 1,793.5 1,809.5 1,816.9 1,822.4 1,825.6 1,825.6 1,829.7 1,833.2 1,838.3 1,843.0 1,833.8
15 Commercial real estate loans 1,933.5 1,982.1 1,995.3 2,004.9 2,013.9 2,019.5 2,025.6 2,030.9 2,033.9 2,033.3 2,035.1 2,039.0
16 Construction and land development loans10 298.3 307.7 311.0 314.4 314.5 315.7 318.0 319.3 319.8 317.9 318.2 319.1
17 Secured by farmland11 93.9 97.4 97.6 97.7 98.2 98.1 98.3 98.7 98.9 99.1 99.2 99.3
18 Secured by multifamily properties12 311.4 317.5 321.7 324.0 327.0 328.1 328.7 330.8 331.7 332.2 332.8 333.5
19 Secured by nonfarm nonresidential properties13 1,229.9 1,259.7 1,265.0 1,268.8 1,274.3 1,277.6 1,280.6 1,282.1 1,283.6 1,284.0 1,284.9 1,287.0
20 Consumer loans 1,345.6 1,394.4 1,407.6 1,426.5 1,453.6 1,449.0 1,433.1 1,418.9 1,422.0 1,424.1 1,425.0 1,426.3
21 Credit cards and other revolving plans 702.4 736.9 747.2 765.0 790.8 783.7 767.8 754.1 756.6 757.1 757.4 757.7
22 Other consumer loans 643.2 657.5 660.5 661.5 662.8 665.3 665.3 664.8 665.4 667.1 667.6 668.6
23 Automobile loans14 410.3 418.7 420.2 420.2 420.9 421.4 420.5 419.8 420.1 421.0 421.1 420.9
24 All other consumer loans15 232.9 238.8 240.3 241.3 241.9 243.9 244.8 245.0 245.3 246.1 246.6 247.8
25 All other loans and leases 961.6 1,009.8 1,016.3 1,020.3 1,034.6 1,031.2 1,026.0 1,029.3 1,033.6 1,034.1 1,031.3 1,033.1
26 Loans to nondepository financial institutions16 294.8 322.2 328.8 332.2 334.3 328.6 328.2 331.6 335.5 339.6 336.0 338.9
27 All loans not elsewhere classified17 666.7 687.6 687.5 688.1 700.3 702.6 697.9 697.7 698.1 694.5 695.2 694.2
28 LESS: Allowance for loan and lease losses 108.3 107.9 108.7 109.1 109.1 108.5 108.9 108.9 108.5 108.6 108.6 108.6
Footnotes appear on the last page.

H.8 Page 9
Assets and Liabilities of Domestically Chartered Commercial Banks in the United States1
Not seasonally adjusted, billions of dollars (continued) April 27, 2018
Account2017 2017 2017 2017 2017 2018 2018 2018 Week ending
Mar Sep Oct Nov Dec Jan Feb Mar Mar 28 Apr 4 Apr 11 Apr 18
ASSETS (CONTINUED)
29 Cash assets18 1,549.2 1,470.3 1,430.2 1,463.7 1,499.2 1,401.6 1,399.2 1,384.6 1,370.5 1,384.2 1,411.9 1,329.9
30 Total federal funds sold and reverse RPs19 143.0 154.5 149.0 143.1 151.9 147.4 145.0 172.7 194.9 166.5 154.9 148.6
31 Loans to commercial banks20 9.8 10.0 9.9 9.8 10.0 10.0 10.1 10.2 10.4 11.1 10.5 10.4
32 Other assets including trading assets21 1,233.5 1,269.1 1,269.8 1,273.6 1,265.6 1,279.0 1,280.0 1,272.8 1,269.0 1,256.0 1,266.7 1,274.7
33 TOTAL ASSETS 14,058.1 14,239.9 14,273.3 14,357.1 14,452.5 14,353.1 14,318.5 14,323.5 14,348.1 14,326.1 14,347.9 14,291.5
LIABILITIES
34 Deposits 10,687.9 10,812.2 10,888.2 10,934.7 11,048.0 10,969.1 10,953.8 11,061.7 11,104.0 11,143.4 11,153.2 11,048.3
35 Large time deposits 844.4 867.6 872.7 876.4 885.7 898.5 892.3 884.3 884.5 885.3 885.0 900.2
36 Other deposits 9,843.6 9,944.6 10,015.5 10,058.3 10,162.4 10,070.6 10,061.5 10,177.5 10,219.5 10,258.1 10,268.1 10,148.1
37 Borrowings 1,087.9 1,120.3 1,112.1 1,110.0 1,114.8 1,142.6 1,162.8 1,118.3 1,104.2 1,080.3 1,076.8 1,116.2
38 Net due to related foreign offices 61.5 20.8 -2.7 27.3 8.0 -32.0 -59.3 -119.2 -121.4 -150.5 -142.1 -140.5
39 Other liabilities including trading liabilities22 451.7 452.3 444.0 444.7 434.9 456.8 451.5 445.8 445.7 438.1 439.3 443.1
40 TOTAL LIABILITIES 12,289.0 12,405.6 12,441.5 12,516.6 12,605.7 12,536.5 12,508.8 12,506.6 12,532.5 12,511.3 12,527.2 12,467.0
41 RESIDUAL (ASSETS LESS LIABILITIES)23 1,769.0 1,834.3 1,831.8 1,840.5 1,846.7 1,816.6 1,809.7 1,816.9 1,815.6 1,814.8 1,820.7 1,824.5
MEMORANDA
42 Net unrealized gains (losses) onavailable-for-sale securities24 -11.1 4.7 -0.4 -2.1 -6.5 -16.3 -34.4 -37.2 -34.8 -34.1 -34.0 -37.6
43 U.S. Treasury and agency securities, MBS25 -11.6 0.2 -4.7 -5.6 -8.9 -16.6 -30.5 -32.2 -30.3 -29.6 -29.3 -31.8
Footnotes appear on the last page.

H.8 Page 10
Assets and Liabilities of Large Domestically Chartered Commercial Banks in the United States1
Seasonally adjusted, billions of dollars April 27, 2018
Account2017 2017 2017 2017 2017 2018 2018 2018 Week ending
Mar Sep Oct Nov Dec Jan Feb Mar Mar 28 Apr 4 Apr 11 Apr 18
ASSETS
1 Bank credit 7,183.2 7,251.0 7,275.2 7,285.2 7,302.3 7,297.5 7,291.5 7,299.3 7,312.8 7,288.1 7,287.3 7,299.8
2 Securities in bank credit2 2,223.5 2,237.4 2,250.7 2,253.5 2,259.3 2,252.1 2,231.5 2,223.4 2,222.7 2,208.5 2,202.4 2,208.3
3 Treasury and agency securities3 1,684.9 1,708.7 1,722.8 1,723.1 1,729.6 1,721.8 1,706.0 1,704.6 1,708.1 1,701.4 1,699.5 1,704.7
4 Mortgage-backed securities (MBS)4 1,227.9 1,284.4 1,292.1 1,295.5 1,303.2 1,295.2 1,282.3 1,286.5 1,290.8 1,286.2 1,283.8 1,288.3
5 Non-MBS5 457.0 424.3 430.8 427.6 426.4 426.6 423.7 418.1 417.4 415.2 415.7 416.4
6 Other securities 538.6 528.7 527.8 530.4 529.7 530.4 525.5 518.8 514.6 507.1 503.0 503.6
7 Mortgage-backed securities (MBS)6 77.3 71.1 70.6 68.9 66.8 66.0 66.7 64.3 62.8 62.9 62.5 62.8
8 Non-MBS7 461.3 457.5 457.2 461.6 462.8 464.4 458.9 454.5 451.8 444.2 440.5 440.9
9 Loans and leases in bank credit8 4,959.7 5,013.6 5,024.6 5,031.8 5,043.1 5,045.4 5,059.9 5,075.9 5,090.0 5,079.6 5,084.9 5,091.5
10 Commercial and industrial loans 1,137.5 1,142.6 1,142.5 1,142.0 1,144.4 1,145.2 1,148.6 1,161.0 1,169.3 1,170.4 1,168.5 1,173.4
11 Real estate loans 2,100.3 2,111.8 2,115.5 2,113.7 2,120.3 2,114.5 2,117.2 2,117.6 2,118.8 2,113.4 2,118.0 2,119.1
12 Residential real estate loans 1,408.7 1,417.3 1,421.5 1,420.9 1,428.2 1,424.2 1,426.8 1,427.0 1,428.7 1,424.9 1,428.8 1,429.2
13 Revolving home equity loans 281.8 266.1 263.5 261.0 259.0 256.6 254.2 250.9 250.0 249.2 248.6 248.4
14 Closed-end residential loans9 1,126.9 1,151.2 1,158.0 1,159.8 1,169.2 1,167.6 1,172.6 1,176.0 1,178.7 1,175.7 1,180.2 1,180.8
15 Commercial real estate loans 691.6 694.5 694.0 692.9 692.1 690.4 690.5 690.6 690.1 688.5 689.2 689.9
16 Construction and land development loans10 107.5 108.7 109.2 109.5 109.5 109.7 110.0 110.6 110.2 109.4 108.8 108.4
17 Secured by farmland11 8.9 8.8 8.8 8.7 8.7 8.7 8.7 8.7 8.7 8.7 8.6 8.6
18 Secured by multifamily properties12 141.4 142.5 142.3 141.9 142.2 142.2 142.6 143.8 144.0 143.7 143.7 144.3
19 Secured by nonfarm nonresidential properties13 433.8 434.4 433.7 432.8 431.8 429.8 429.2 427.6 427.2 426.7 428.0 428.5
20 Consumer loans 996.3 1,013.9 1,018.5 1,022.7 1,024.4 1,026.5 1,029.9 1,029.5 1,029.2 1,030.8 1,030.2 1,030.2
21 Credit cards and other revolving plans 550.1 569.2 572.3 575.4 576.6 577.4 579.3 577.9 577.4 577.3 576.7 576.7
22 Other consumer loans 446.1 444.7 446.2 447.2 447.8 449.1 450.6 451.6 451.8 453.5 453.4 453.5
23 Automobile loans14 337.0 340.1 341.5 342.0 342.7 343.7 344.7 345.0 344.9 345.9 345.9 345.7
24 All other consumer loans15 109.1 104.6 104.6 105.2 105.0 105.4 105.9 106.7 107.0 107.6 107.6 107.8
25 All other loans and leases 725.7 745.3 748.1 753.4 753.9 759.1 764.2 767.8 772.7 764.9 768.3 768.7
26 Loans to nondepository financial institutions16 256.7 270.3 274.1 278.4 276.3 277.7 280.7 284.7 287.8 286.9 287.7 290.0
27 All loans not elsewhere classified17 469.0 475.0 474.1 474.9 477.6 481.4 483.6 483.1 484.9 477.9 480.6 478.7
28 LESS: Allowance for loan and lease losses 69.5 68.8 69.4 69.2 69.2 69.0 68.8 68.6 68.6 68.7 68.7 68.8
Footnotes appear on the last page.
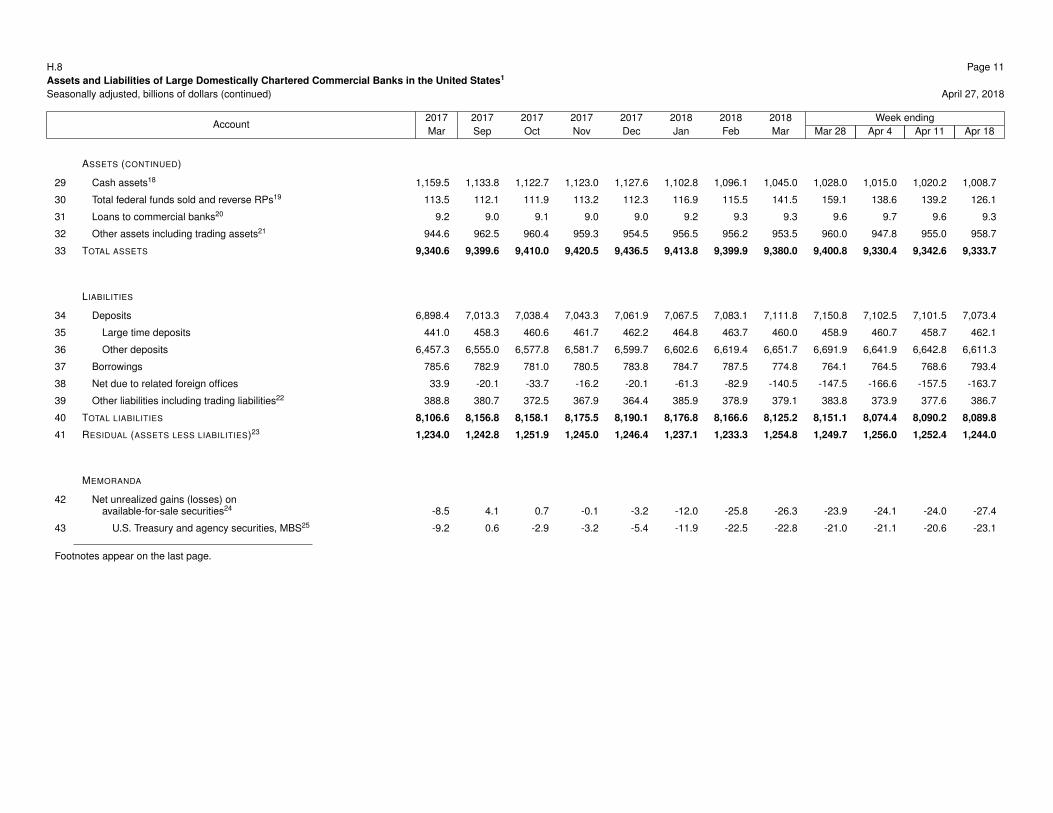
H.8 Page 11
Assets and Liabilities of Large Domestically Chartered Commercial Banks in the United States1
Seasonally adjusted, billions of dollars (continued) April 27, 2018
Account2017 2017 2017 2017 2017 2018 2018 2018 Week ending
Mar Sep Oct Nov Dec Jan Feb Mar Mar 28 Apr 4 Apr 11 Apr 18
ASSETS (CONTINUED)
29 Cash assets18 1,159.5 1,133.8 1,122.7 1,123.0 1,127.6 1,102.8 1,096.1 1,045.0 1,028.0 1,015.0 1,020.2 1,008.7
30 Total federal funds sold and reverse RPs19 113.5 112.1 111.9 113.2 112.3 116.9 115.5 141.5 159.1 138.6 139.2 126.1
31 Loans to commercial banks20 9.2 9.0 9.1 9.0 9.0 9.2 9.3 9.3 9.6 9.7 9.6 9.3
32 Other assets including trading assets21 944.6 962.5 960.4 959.3 954.5 956.5 956.2 953.5 960.0 947.8 955.0 958.7
33 TOTAL ASSETS 9,340.6 9,399.6 9,410.0 9,420.5 9,436.5 9,413.8 9,399.9 9,380.0 9,400.8 9,330.4 9,342.6 9,333.7
LIABILITIES
34 Deposits 6,898.4 7,013.3 7,038.4 7,043.3 7,061.9 7,067.5 7,083.1 7,111.8 7,150.8 7,102.5 7,101.5 7,073.4
35 Large time deposits 441.0 458.3 460.6 461.7 462.2 464.8 463.7 460.0 458.9 460.7 458.7 462.1
36 Other deposits 6,457.3 6,555.0 6,577.8 6,581.7 6,599.7 6,602.6 6,619.4 6,651.7 6,691.9 6,641.9 6,642.8 6,611.3
37 Borrowings 785.6 782.9 781.0 780.5 783.8 784.7 787.5 774.8 764.1 764.5 768.6 793.4
38 Net due to related foreign offices 33.9 -20.1 -33.7 -16.2 -20.1 -61.3 -82.9 -140.5 -147.5 -166.6 -157.5 -163.7
39 Other liabilities including trading liabilities22 388.8 380.7 372.5 367.9 364.4 385.9 378.9 379.1 383.8 373.9 377.6 386.7
40 TOTAL LIABILITIES 8,106.6 8,156.8 8,158.1 8,175.5 8,190.1 8,176.8 8,166.6 8,125.2 8,151.1 8,074.4 8,090.2 8,089.8
41 RESIDUAL (ASSETS LESS LIABILITIES)23 1,234.0 1,242.8 1,251.9 1,245.0 1,246.4 1,237.1 1,233.3 1,254.8 1,249.7 1,256.0 1,252.4 1,244.0
MEMORANDA
42 Net unrealized gains (losses) onavailable-for-sale securities24 -8.5 4.1 0.7 -0.1 -3.2 -12.0 -25.8 -26.3 -23.9 -24.1 -24.0 -27.4
43 U.S. Treasury and agency securities, MBS25 -9.2 0.6 -2.9 -3.2 -5.4 -11.9 -22.5 -22.8 -21.0 -21.1 -20.6 -23.1
Footnotes appear on the last page.

H.8 Page 12
Assets and Liabilities of Large Domestically Chartered Commercial Banks in the United States1
Not seasonally adjusted, billions of dollars April 27, 2018
Account2017 2017 2017 2017 2017 2018 2018 2018 Week ending
Mar Sep Oct Nov Dec Jan Feb Mar Mar 28 Apr 4 Apr 11 Apr 18
ASSETS
1 Bank credit 7,157.1 7,248.0 7,291.0 7,315.7 7,344.7 7,316.3 7,283.1 7,268.3 7,276.3 7,270.8 7,265.7 7,284.4
2 Securities in bank credit2 2,221.3 2,234.0 2,257.3 2,270.5 2,268.2 2,257.6 2,231.3 2,218.3 2,216.4 2,207.6 2,203.5 2,209.3
3 Treasury and agency securities3 1,682.7 1,705.3 1,727.9 1,738.5 1,736.5 1,726.7 1,706.9 1,700.1 1,702.1 1,701.3 1,698.9 1,705.8
4 Mortgage-backed securities (MBS)4 1,219.8 1,287.4 1,300.8 1,310.0 1,308.2 1,294.9 1,279.5 1,277.0 1,281.0 1,281.1 1,276.1 1,283.4
5 Non-MBS5 462.9 417.9 427.1 428.5 428.3 431.8 427.4 423.1 421.1 420.2 422.9 422.4
6 Other securities 538.6 528.7 529.4 531.9 531.8 530.9 524.5 518.2 514.2 506.3 504.5 503.5
7 Mortgage-backed securities (MBS)6 77.2 70.8 70.6 68.7 66.7 65.7 66.3 64.2 62.7 63.5 63.4 63.0
8 Non-MBS7 461.4 457.9 458.8 463.3 465.1 465.2 458.2 454.0 451.5 442.8 441.1 440.5
9 Loans and leases in bank credit8 4,935.8 5,014.0 5,033.7 5,045.3 5,076.5 5,058.7 5,051.8 5,049.9 5,059.9 5,063.2 5,062.2 5,075.0
10 Commercial and industrial loans 1,141.6 1,135.2 1,141.7 1,141.4 1,142.7 1,139.3 1,149.6 1,164.5 1,170.9 1,175.0 1,170.9 1,185.8
11 Real estate loans 2,090.3 2,116.3 2,120.8 2,120.3 2,121.8 2,113.3 2,111.4 2,107.2 2,106.1 2,105.9 2,111.2 2,108.0
12 Residential real estate loans 1,400.4 1,420.9 1,425.4 1,425.4 1,428.5 1,423.2 1,422.2 1,418.2 1,417.6 1,418.8 1,422.6 1,418.8
13 Revolving home equity loans 280.8 266.7 264.2 261.6 259.7 256.7 253.6 250.0 249.1 248.1 247.7 247.8
14 Closed-end residential loans9 1,119.6 1,154.2 1,161.3 1,163.8 1,168.8 1,166.5 1,168.6 1,168.3 1,168.5 1,170.7 1,175.0 1,171.0
15 Commercial real estate loans 690.0 695.4 695.4 694.8 693.2 690.1 689.2 688.9 688.5 687.1 688.6 689.1
16 Construction and land development loans10 107.5 108.4 109.4 110.2 109.2 109.6 110.5 110.7 110.5 109.6 109.5 109.3
17 Secured by farmland11 8.9 8.8 8.8 8.7 8.7 8.7 8.7 8.7 8.7 8.7 8.6 8.6
18 Secured by multifamily properties12 140.5 143.1 142.8 142.3 142.9 142.0 141.7 142.9 143.2 143.0 143.2 143.8
19 Secured by nonfarm nonresidential properties13 433.1 435.1 434.5 433.7 432.3 429.8 428.3 426.7 426.2 425.7 427.2 427.4
20 Consumer loans 982.9 1,016.5 1,020.3 1,027.8 1,046.0 1,040.7 1,028.1 1,015.4 1,016.5 1,018.3 1,018.7 1,018.6
21 Credit cards and other revolving plans 539.1 569.9 572.1 578.8 596.7 590.3 578.4 566.2 567.1 567.4 567.6 567.5
22 Other consumer loans 443.8 446.6 448.2 449.0 449.3 450.3 449.7 449.3 449.5 450.9 451.1 451.1
23 Automobile loans14 335.4 341.4 342.9 343.5 344.1 344.6 343.8 343.3 343.3 344.2 344.1 343.8
24 All other consumer loans15 108.4 105.2 105.3 105.4 105.2 105.8 105.9 106.0 106.2 106.7 107.0 107.3
25 All other loans and leases 721.0 746.0 750.9 755.8 766.0 765.4 762.8 762.8 766.4 764.0 761.5 762.7
26 Loans to nondepository financial institutions16 253.5 271.1 276.4 280.8 281.8 277.8 278.6 280.9 283.8 286.0 283.9 286.7
27 All loans not elsewhere classified17 467.6 474.9 474.4 475.1 484.2 487.6 484.2 481.9 482.7 478.0 477.6 476.0
28 LESS: Allowance for loan and lease losses 69.5 68.9 69.5 69.6 69.6 68.8 68.8 68.7 68.5 68.4 68.3 68.3
Footnotes appear on the last page.

H.8 Page 13
Assets and Liabilities of Large Domestically Chartered Commercial Banks in the United States1
Not seasonally adjusted, billions of dollars (continued) April 27, 2018
Account2017 2017 2017 2017 2017 2018 2018 2018 Week ending
Mar Sep Oct Nov Dec Jan Feb Mar Mar 28 Apr 4 Apr 11 Apr 18
ASSETS (CONTINUED)
29 Cash assets18 1,178.7 1,145.8 1,100.9 1,121.4 1,156.7 1,076.0 1,081.6 1,063.0 1,049.7 1,057.2 1,084.5 1,019.4
30 Total federal funds sold and reverse RPs19 112.0 118.0 116.1 114.7 120.7 120.0 113.5 138.8 158.4 135.0 128.5 116.1
31 Loans to commercial banks20 9.1 9.0 9.0 8.8 9.1 9.2 9.3 9.3 9.5 10.2 9.5 9.2
32 Other assets including trading assets21 945.9 965.1 962.4 962.7 952.5 962.4 960.7 954.0 951.5 938.4 948.3 950.8
33 TOTAL ASSETS 9,333.3 9,417.0 9,410.0 9,453.8 9,514.3 9,415.0 9,379.4 9,364.6 9,377.0 9,343.1 9,368.1 9,311.5
LIABILITIES
34 Deposits 6,922.8 6,997.5 7,040.7 7,062.2 7,139.6 7,075.5 7,062.3 7,134.6 7,166.5 7,185.6 7,199.0 7,109.8
35 Large time deposits 437.2 451.5 453.3 456.2 464.8 475.0 465.9 456.0 456.1 457.5 455.1 458.6
36 Other deposits 6,485.6 6,546.1 6,587.4 6,606.0 6,674.8 6,600.5 6,596.5 6,678.6 6,710.5 6,728.1 6,743.9 6,651.2
37 Borrowings 786.3 794.1 779.8 775.4 776.7 788.9 806.0 775.8 760.7 743.6 741.3 768.6
38 Net due to related foreign offices 19.4 -15.6 -36.1 -8.0 -22.9 -63.5 -88.7 -146.4 -149.7 -175.2 -167.3 -167.7
39 Other liabilities including trading liabilities22 386.6 385.2 377.3 372.3 364.9 387.8 380.5 376.2 377.3 368.6 370.0 373.9
40 TOTAL LIABILITIES 8,115.1 8,161.2 8,161.7 8,201.9 8,258.2 8,188.8 8,160.2 8,140.1 8,154.9 8,122.6 8,143.0 8,084.6
41 RESIDUAL (ASSETS LESS LIABILITIES)23 1,218.1 1,255.7 1,248.3 1,251.9 1,256.0 1,226.2 1,219.1 1,224.5 1,222.1 1,220.5 1,225.1 1,226.9
MEMORANDA
42 Net unrealized gains (losses) onavailable-for-sale securities24 -8.5 4.1 0.7 -0.1 -3.2 -12.0 -25.8 -26.3 -23.9 -24.1 -24.0 -27.4
43 U.S. Treasury and agency securities, MBS25 -9.2 0.6 -2.9 -3.2 -5.4 -11.9 -22.5 -22.8 -21.0 -21.1 -20.6 -23.1
Footnotes appear on the last page.
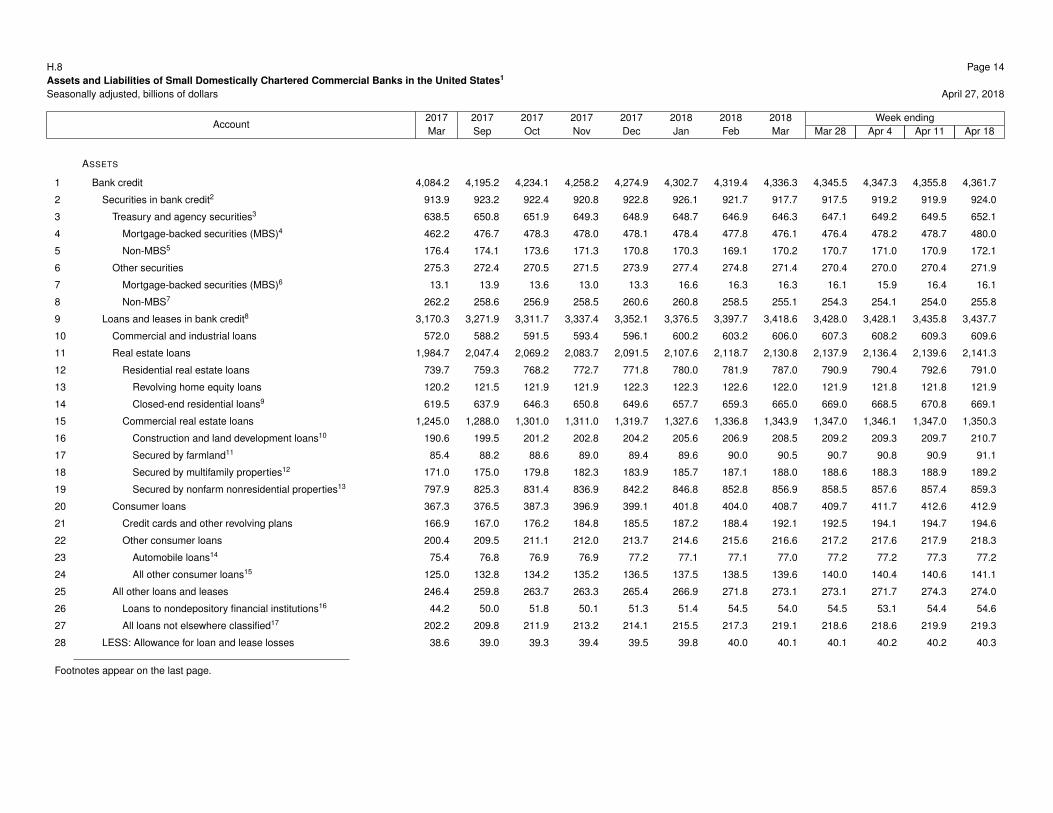
H.8 Page 14
Assets and Liabilities of Small Domestically Chartered Commercial Banks in the United States1
Seasonally adjusted, billions of dollars April 27, 2018
Account2017 2017 2017 2017 2017 2018 2018 2018 Week ending
Mar Sep Oct Nov Dec Jan Feb Mar Mar 28 Apr 4 Apr 11 Apr 18
ASSETS
1 Bank credit 4,084.2 4,195.2 4,234.1 4,258.2 4,274.9 4,302.7 4,319.4 4,336.3 4,345.5 4,347.3 4,355.8 4,361.7
2 Securities in bank credit2 913.9 923.2 922.4 920.8 922.8 926.1 921.7 917.7 917.5 919.2 919.9 924.0
3 Treasury and agency securities3 638.5 650.8 651.9 649.3 648.9 648.7 646.9 646.3 647.1 649.2 649.5 652.1
4 Mortgage-backed securities (MBS)4 462.2 476.7 478.3 478.0 478.1 478.4 477.8 476.1 476.4 478.2 478.7 480.0
5 Non-MBS5 176.4 174.1 173.6 171.3 170.8 170.3 169.1 170.2 170.7 171.0 170.9 172.1
6 Other securities 275.3 272.4 270.5 271.5 273.9 277.4 274.8 271.4 270.4 270.0 270.4 271.9
7 Mortgage-backed securities (MBS)6 13.1 13.9 13.6 13.0 13.3 16.6 16.3 16.3 16.1 15.9 16.4 16.1
8 Non-MBS7 262.2 258.6 256.9 258.5 260.6 260.8 258.5 255.1 254.3 254.1 254.0 255.8
9 Loans and leases in bank credit8 3,170.3 3,271.9 3,311.7 3,337.4 3,352.1 3,376.5 3,397.7 3,418.6 3,428.0 3,428.1 3,435.8 3,437.7
10 Commercial and industrial loans 572.0 588.2 591.5 593.4 596.1 600.2 603.2 606.0 607.3 608.2 609.3 609.6
11 Real estate loans 1,984.7 2,047.4 2,069.2 2,083.7 2,091.5 2,107.6 2,118.7 2,130.8 2,137.9 2,136.4 2,139.6 2,141.3
12 Residential real estate loans 739.7 759.3 768.2 772.7 771.8 780.0 781.9 787.0 790.9 790.4 792.6 791.0
13 Revolving home equity loans 120.2 121.5 121.9 121.9 122.3 122.3 122.6 122.0 121.9 121.8 121.8 121.9
14 Closed-end residential loans9 619.5 637.9 646.3 650.8 649.6 657.7 659.3 665.0 669.0 668.5 670.8 669.1
15 Commercial real estate loans 1,245.0 1,288.0 1,301.0 1,311.0 1,319.7 1,327.6 1,336.8 1,343.9 1,347.0 1,346.1 1,347.0 1,350.3
16 Construction and land development loans10 190.6 199.5 201.2 202.8 204.2 205.6 206.9 208.5 209.2 209.3 209.7 210.7
17 Secured by farmland11 85.4 88.2 88.6 89.0 89.4 89.6 90.0 90.5 90.7 90.8 90.9 91.1
18 Secured by multifamily properties12 171.0 175.0 179.8 182.3 183.9 185.7 187.1 188.0 188.6 188.3 188.9 189.2
19 Secured by nonfarm nonresidential properties13 797.9 825.3 831.4 836.9 842.2 846.8 852.8 856.9 858.5 857.6 857.4 859.3
20 Consumer loans 367.3 376.5 387.3 396.9 399.1 401.8 404.0 408.7 409.7 411.7 412.6 412.9
21 Credit cards and other revolving plans 166.9 167.0 176.2 184.8 185.5 187.2 188.4 192.1 192.5 194.1 194.7 194.6
22 Other consumer loans 200.4 209.5 211.1 212.0 213.7 214.6 215.6 216.6 217.2 217.6 217.9 218.3
23 Automobile loans14 75.4 76.8 76.9 76.9 77.2 77.1 77.1 77.0 77.2 77.2 77.3 77.2
24 All other consumer loans15 125.0 132.8 134.2 135.2 136.5 137.5 138.5 139.6 140.0 140.4 140.6 141.1
25 All other loans and leases 246.4 259.8 263.7 263.3 265.4 266.9 271.8 273.1 273.1 271.7 274.3 274.0
26 Loans to nondepository financial institutions16 44.2 50.0 51.8 50.1 51.3 51.4 54.5 54.0 54.5 53.1 54.4 54.6
27 All loans not elsewhere classified17 202.2 209.8 211.9 213.2 214.1 215.5 217.3 219.1 218.6 218.6 219.9 219.3
28 LESS: Allowance for loan and lease losses 38.6 39.0 39.3 39.4 39.5 39.8 40.0 40.1 40.1 40.2 40.2 40.3
Footnotes appear on the last page.
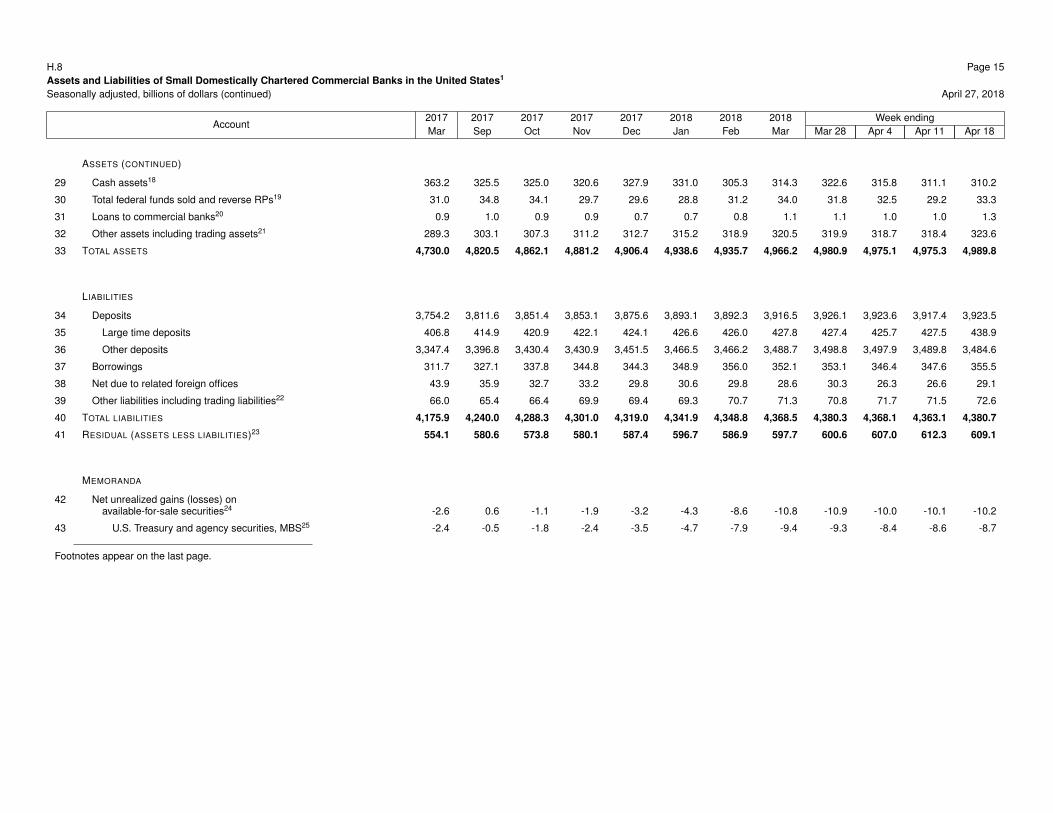
H.8 Page 15
Assets and Liabilities of Small Domestically Chartered Commercial Banks in the United States1
Seasonally adjusted, billions of dollars (continued) April 27, 2018
Account2017 2017 2017 2017 2017 2018 2018 2018 Week ending
Mar Sep Oct Nov Dec Jan Feb Mar Mar 28 Apr 4 Apr 11 Apr 18
ASSETS (CONTINUED)
29 Cash assets18 363.2 325.5 325.0 320.6 327.9 331.0 305.3 314.3 322.6 315.8 311.1 310.2
30 Total federal funds sold and reverse RPs19 31.0 34.8 34.1 29.7 29.6 28.8 31.2 34.0 31.8 32.5 29.2 33.3
31 Loans to commercial banks20 0.9 1.0 0.9 0.9 0.7 0.7 0.8 1.1 1.1 1.0 1.0 1.3
32 Other assets including trading assets21 289.3 303.1 307.3 311.2 312.7 315.2 318.9 320.5 319.9 318.7 318.4 323.6
33 TOTAL ASSETS 4,730.0 4,820.5 4,862.1 4,881.2 4,906.4 4,938.6 4,935.7 4,966.2 4,980.9 4,975.1 4,975.3 4,989.8
LIABILITIES
34 Deposits 3,754.2 3,811.6 3,851.4 3,853.1 3,875.6 3,893.1 3,892.3 3,916.5 3,926.1 3,923.6 3,917.4 3,923.5
35 Large time deposits 406.8 414.9 420.9 422.1 424.1 426.6 426.0 427.8 427.4 425.7 427.5 438.9
36 Other deposits 3,347.4 3,396.8 3,430.4 3,430.9 3,451.5 3,466.5 3,466.2 3,488.7 3,498.8 3,497.9 3,489.8 3,484.6
37 Borrowings 311.7 327.1 337.8 344.8 344.3 348.9 356.0 352.1 353.1 346.4 347.6 355.5
38 Net due to related foreign offices 43.9 35.9 32.7 33.2 29.8 30.6 29.8 28.6 30.3 26.3 26.6 29.1
39 Other liabilities including trading liabilities22 66.0 65.4 66.4 69.9 69.4 69.3 70.7 71.3 70.8 71.7 71.5 72.6
40 TOTAL LIABILITIES 4,175.9 4,240.0 4,288.3 4,301.0 4,319.0 4,341.9 4,348.8 4,368.5 4,380.3 4,368.1 4,363.1 4,380.7
41 RESIDUAL (ASSETS LESS LIABILITIES)23 554.1 580.6 573.8 580.1 587.4 596.7 586.9 597.7 600.6 607.0 612.3 609.1
MEMORANDA
42 Net unrealized gains (losses) onavailable-for-sale securities24 -2.6 0.6 -1.1 -1.9 -3.2 -4.3 -8.6 -10.8 -10.9 -10.0 -10.1 -10.2
43 U.S. Treasury and agency securities, MBS25 -2.4 -0.5 -1.8 -2.4 -3.5 -4.7 -7.9 -9.4 -9.3 -8.4 -8.6 -8.7
Footnotes appear on the last page.
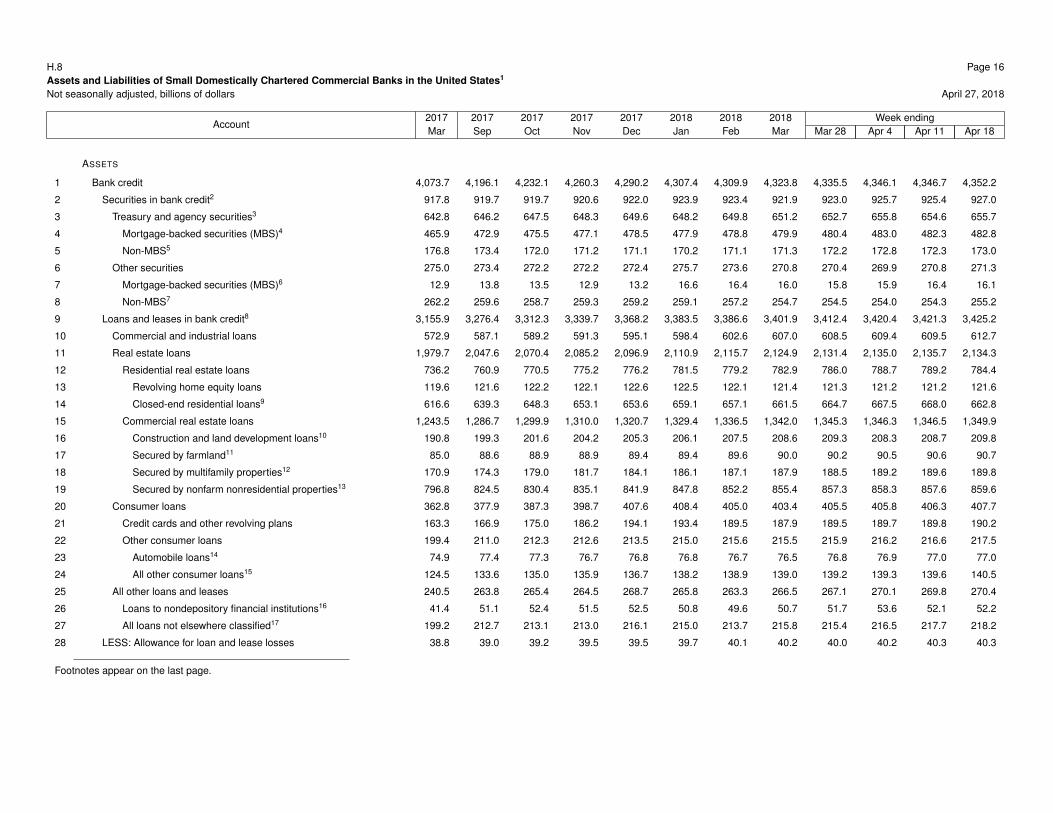
H.8 Page 16
Assets and Liabilities of Small Domestically Chartered Commercial Banks in the United States1
Not seasonally adjusted, billions of dollars April 27, 2018
Account2017 2017 2017 2017 2017 2018 2018 2018 Week ending
Mar Sep Oct Nov Dec Jan Feb Mar Mar 28 Apr 4 Apr 11 Apr 18
ASSETS
1 Bank credit 4,073.7 4,196.1 4,232.1 4,260.3 4,290.2 4,307.4 4,309.9 4,323.8 4,335.5 4,346.1 4,346.7 4,352.2
2 Securities in bank credit2 917.8 919.7 919.7 920.6 922.0 923.9 923.4 921.9 923.0 925.7 925.4 927.0
3 Treasury and agency securities3 642.8 646.2 647.5 648.3 649.6 648.2 649.8 651.2 652.7 655.8 654.6 655.7
4 Mortgage-backed securities (MBS)4 465.9 472.9 475.5 477.1 478.5 477.9 478.8 479.9 480.4 483.0 482.3 482.8
5 Non-MBS5 176.8 173.4 172.0 171.2 171.1 170.2 171.1 171.3 172.2 172.8 172.3 173.0
6 Other securities 275.0 273.4 272.2 272.2 272.4 275.7 273.6 270.8 270.4 269.9 270.8 271.3
7 Mortgage-backed securities (MBS)6 12.9 13.8 13.5 12.9 13.2 16.6 16.4 16.0 15.8 15.9 16.4 16.1
8 Non-MBS7 262.2 259.6 258.7 259.3 259.2 259.1 257.2 254.7 254.5 254.0 254.3 255.2
9 Loans and leases in bank credit8 3,155.9 3,276.4 3,312.3 3,339.7 3,368.2 3,383.5 3,386.6 3,401.9 3,412.4 3,420.4 3,421.3 3,425.2
10 Commercial and industrial loans 572.9 587.1 589.2 591.3 595.1 598.4 602.6 607.0 608.5 609.4 609.5 612.7
11 Real estate loans 1,979.7 2,047.6 2,070.4 2,085.2 2,096.9 2,110.9 2,115.7 2,124.9 2,131.4 2,135.0 2,135.7 2,134.3
12 Residential real estate loans 736.2 760.9 770.5 775.2 776.2 781.5 779.2 782.9 786.0 788.7 789.2 784.4
13 Revolving home equity loans 119.6 121.6 122.2 122.1 122.6 122.5 122.1 121.4 121.3 121.2 121.2 121.6
14 Closed-end residential loans9 616.6 639.3 648.3 653.1 653.6 659.1 657.1 661.5 664.7 667.5 668.0 662.8
15 Commercial real estate loans 1,243.5 1,286.7 1,299.9 1,310.0 1,320.7 1,329.4 1,336.5 1,342.0 1,345.3 1,346.3 1,346.5 1,349.9
16 Construction and land development loans10 190.8 199.3 201.6 204.2 205.3 206.1 207.5 208.6 209.3 208.3 208.7 209.8
17 Secured by farmland11 85.0 88.6 88.9 88.9 89.4 89.4 89.6 90.0 90.2 90.5 90.6 90.7
18 Secured by multifamily properties12 170.9 174.3 179.0 181.7 184.1 186.1 187.1 187.9 188.5 189.2 189.6 189.8
19 Secured by nonfarm nonresidential properties13 796.8 824.5 830.4 835.1 841.9 847.8 852.2 855.4 857.3 858.3 857.6 859.6
20 Consumer loans 362.8 377.9 387.3 398.7 407.6 408.4 405.0 403.4 405.5 405.8 406.3 407.7
21 Credit cards and other revolving plans 163.3 166.9 175.0 186.2 194.1 193.4 189.5 187.9 189.5 189.7 189.8 190.2
22 Other consumer loans 199.4 211.0 212.3 212.6 213.5 215.0 215.6 215.5 215.9 216.2 216.6 217.5
23 Automobile loans14 74.9 77.4 77.3 76.7 76.8 76.8 76.7 76.5 76.8 76.9 77.0 77.0
24 All other consumer loans15 124.5 133.6 135.0 135.9 136.7 138.2 138.9 139.0 139.2 139.3 139.6 140.5
25 All other loans and leases 240.5 263.8 265.4 264.5 268.7 265.8 263.3 266.5 267.1 270.1 269.8 270.4
26 Loans to nondepository financial institutions16 41.4 51.1 52.4 51.5 52.5 50.8 49.6 50.7 51.7 53.6 52.1 52.2
27 All loans not elsewhere classified17 199.2 212.7 213.1 213.0 216.1 215.0 213.7 215.8 215.4 216.5 217.7 218.2
28 LESS: Allowance for loan and lease losses 38.8 39.0 39.2 39.5 39.5 39.7 40.1 40.2 40.0 40.2 40.3 40.3
Footnotes appear on the last page.

H.8 Page 17
Assets and Liabilities of Small Domestically Chartered Commercial Banks in the United States1
Not seasonally adjusted, billions of dollars (continued) April 27, 2018
Account2017 2017 2017 2017 2017 2018 2018 2018 Week ending
Mar Sep Oct Nov Dec Jan Feb Mar Mar 28 Apr 4 Apr 11 Apr 18
ASSETS (CONTINUED)
29 Cash assets18 370.5 324.5 329.3 342.2 342.4 325.5 317.6 321.6 320.7 327.0 327.4 310.5
30 Total federal funds sold and reverse RPs19 31.1 36.5 32.9 28.3 31.2 27.4 31.5 33.9 36.5 31.6 26.4 32.5
31 Loans to commercial banks20 0.7 0.9 0.9 0.9 0.9 0.9 0.8 0.9 0.9 0.9 1.0 1.3
32 Other assets including trading assets21 287.6 304.0 307.3 310.9 313.0 316.6 319.3 318.8 317.5 317.6 318.5 323.9
33 TOTAL ASSETS 4,724.8 4,823.0 4,863.3 4,903.3 4,938.2 4,938.0 4,939.1 4,958.9 4,971.1 4,982.9 4,979.8 4,980.0
LIABILITIES
34 Deposits 3,765.1 3,814.7 3,847.5 3,872.5 3,908.4 3,893.6 3,891.5 3,927.2 3,937.4 3,957.8 3,954.2 3,938.5
35 Large time deposits 407.2 416.1 419.4 420.2 420.9 423.4 426.4 428.3 428.4 427.8 429.9 441.5
36 Other deposits 3,357.9 3,398.5 3,428.2 3,452.2 3,487.6 3,470.1 3,465.1 3,498.9 3,509.0 3,530.0 3,524.2 3,496.9
37 Borrowings 301.6 326.2 332.3 334.5 338.1 353.7 356.8 342.4 343.4 336.7 335.6 347.6
38 Net due to related foreign offices 42.1 36.4 33.3 35.3 30.9 31.5 29.4 27.3 28.4 24.7 25.2 27.2
39 Other liabilities including trading liabilities22 65.1 67.1 66.7 72.4 70.0 69.0 71.0 69.6 68.4 69.4 69.3 69.2
40 TOTAL LIABILITIES 4,173.9 4,244.4 4,279.8 4,314.7 4,347.5 4,347.7 4,348.6 4,366.5 4,377.6 4,388.7 4,384.2 4,382.4
41 RESIDUAL (ASSETS LESS LIABILITIES)23 550.9 578.6 583.4 588.6 590.7 590.3 590.5 592.4 593.5 594.2 595.6 597.6
MEMORANDA
42 Net unrealized gains (losses) onavailable-for-sale securities24 -2.6 0.6 -1.1 -1.9 -3.2 -4.3 -8.6 -10.8 -10.9 -10.0 -10.1 -10.2
43 U.S. Treasury and agency securities, MBS25 -2.4 -0.5 -1.8 -2.4 -3.5 -4.7 -7.9 -9.4 -9.3 -8.4 -8.6 -8.7
Footnotes appear on the last page.

H.8 Page 18
Assets and Liabilities of Foreign-Related Institutions in the United States1
Seasonally adjusted, billions of dollars April 27, 2018
Account2017 2017 2017 2017 2017 2018 2018 2018 Week ending
Mar Sep Oct Nov Dec Jan Feb Mar Mar 28 Apr 4 Apr 11 Apr 18
ASSETS
1 Bank credit 916.1 929.9 925.3 940.2 965.9 966.2 959.7 956.6 959.7 960.4 969.0 969.7
2 Securities in bank credit2 219.6 214.3 214.3 230.2 253.9 257.5 254.8 251.2 250.0 252.3 251.6 253.7
3 Treasury and agency securities3 117.4 111.7 114.1 125.8 147.7 150.0 146.6 144.0 142.9 145.8 144.7 147.6
4 Mortgage-backed securities (MBS)4 13.1 11.4 12.3 17.6 35.3 33.1 31.9 32.5 33.9 33.8 33.5 34.8
5 Non-MBS5 104.2 100.3 101.8 108.2 112.4 116.8 114.7 111.4 109.0 111.9 111.2 112.7
6 Other securities 102.3 102.6 100.1 104.4 106.2 107.6 108.2 107.3 107.1 106.5 106.9 106.1
7 Mortgage-backed securities (MBS)6 1.5 1.5 1.5 1.4 1.5 1.5 1.5 1.4 1.4 1.4 1.4 1.4
8 Non-MBS7 100.8 101.1 98.6 103.0 104.7 106.1 106.7 105.9 105.7 105.2 105.5 104.7
9 Loans and leases in bank credit8 696.5 715.6 711.1 710.0 712.1 708.6 704.9 705.4 709.7 708.1 717.5 716.0
10 Commercial and industrial loans 374.7 383.5 379.8 377.0 374.0 373.5 370.2 371.6 374.7 378.1 383.0 379.5
11 Real estate loans 70.2 73.1 72.9 74.1 74.6 75.8 76.3 79.0 78.9 78.9 80.0 79.3
12 Residential real estate loans 1.4 1.0 1.0 1.0 1.0 0.9 1.0 1.4 1.4 1.2 0.9 1.0
13 Revolving home equity loans 0.4 0.4 0.4 0.3 0.4 0.3 0.3 0.3 0.4 0.4 0.3 0.3
14 Closed-end residential loans9 1.0 0.7 0.7 0.7 0.7 0.6 0.6 1.1 1.0 0.8 0.6 0.7
15 Commercial real estate loans 68.9 72.1 71.9 73.1 73.6 74.9 75.3 77.5 77.5 77.7 79.1 78.3
16 Construction and land development loans10 7.7 9.1 9.2 9.7 9.8 10.0 10.3 10.4 10.4 10.8 11.0 11.3
17 Secured by farmland11 0.2 0.1 0.1 0.1 0.1 0.1 0.1 0.1 0.1 0.1 0.1 0.1
18 Secured by multifamily properties12 4.2 4.6 4.9 5.0 5.1 5.3 5.4 6.1 6.3 5.7 5.7 6.2
19 Secured by nonfarm nonresidential properties13 56.8 58.3 57.7 58.4 58.6 59.4 59.4 61.0 60.7 61.1 62.3 60.7
20 Consumer loans 3.0 2.2 2.2 2.2 2.2 2.4 2.4 2.8 3.0 3.0 2.9 2.9
21 Credit cards and other revolving plans 0.0 0.0 0.0 0.0 0.0 0.0 0.0 0.0 0.0 0.0 0.0 0.0
22 Other consumer loans 3.0 2.2 2.2 2.2 2.2 2.4 2.4 2.8 3.0 3.0 2.9 2.9
23 Automobile loans14 0.0 0.0 0.0 0.0 0.0 0.0 0.0 0.0 0.0 0.0 0.0 0.0
24 All other consumer loans15 3.0 2.2 2.2 2.2 2.2 2.4 2.4 2.8 3.0 3.0 2.9 2.9
25 All other loans and leases 248.6 256.7 256.2 256.7 261.2 256.9 256.0 252.0 253.2 248.1 251.5 254.4
26 Loans to nondepository financial institutions16 111.5 114.3 110.4 110.4 110.6 108.7 107.1 106.4 107.8 106.4 107.1 108.4
27 All loans not elsewhere classified17 137.0 142.4 145.8 146.2 150.6 148.1 148.9 145.6 145.4 141.7 144.3 146.0
28 LESS: Allowance for loan and lease losses 1.4 1.3 1.3 1.3 1.2 1.3 1.3 1.3 1.3 1.3 1.3 1.3
Footnotes appear on the last page.
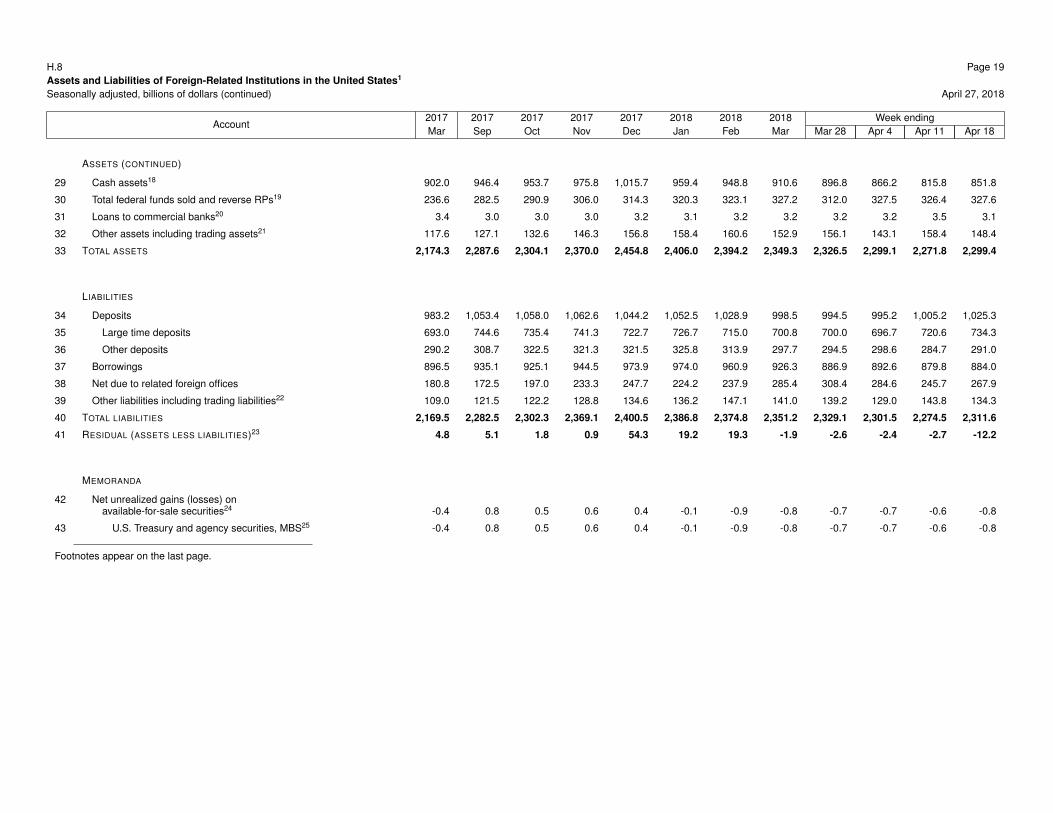
H.8 Page 19
Assets and Liabilities of Foreign-Related Institutions in the United States1
Seasonally adjusted, billions of dollars (continued) April 27, 2018
Account2017 2017 2017 2017 2017 2018 2018 2018 Week ending
Mar Sep Oct Nov Dec Jan Feb Mar Mar 28 Apr 4 Apr 11 Apr 18
ASSETS (CONTINUED)
29 Cash assets18 902.0 946.4 953.7 975.8 1,015.7 959.4 948.8 910.6 896.8 866.2 815.8 851.8
30 Total federal funds sold and reverse RPs19 236.6 282.5 290.9 306.0 314.3 320.3 323.1 327.2 312.0 327.5 326.4 327.6
31 Loans to commercial banks20 3.4 3.0 3.0 3.0 3.2 3.1 3.2 3.2 3.2 3.2 3.5 3.1
32 Other assets including trading assets21 117.6 127.1 132.6 146.3 156.8 158.4 160.6 152.9 156.1 143.1 158.4 148.4
33 TOTAL ASSETS 2,174.3 2,287.6 2,304.1 2,370.0 2,454.8 2,406.0 2,394.2 2,349.3 2,326.5 2,299.1 2,271.8 2,299.4
LIABILITIES
34 Deposits 983.2 1,053.4 1,058.0 1,062.6 1,044.2 1,052.5 1,028.9 998.5 994.5 995.2 1,005.2 1,025.3
35 Large time deposits 693.0 744.6 735.4 741.3 722.7 726.7 715.0 700.8 700.0 696.7 720.6 734.3
36 Other deposits 290.2 308.7 322.5 321.3 321.5 325.8 313.9 297.7 294.5 298.6 284.7 291.0
37 Borrowings 896.5 935.1 925.1 944.5 973.9 974.0 960.9 926.3 886.9 892.6 879.8 884.0
38 Net due to related foreign offices 180.8 172.5 197.0 233.3 247.7 224.2 237.9 285.4 308.4 284.6 245.7 267.9
39 Other liabilities including trading liabilities22 109.0 121.5 122.2 128.8 134.6 136.2 147.1 141.0 139.2 129.0 143.8 134.3
40 TOTAL LIABILITIES 2,169.5 2,282.5 2,302.3 2,369.1 2,400.5 2,386.8 2,374.8 2,351.2 2,329.1 2,301.5 2,274.5 2,311.6
41 RESIDUAL (ASSETS LESS LIABILITIES)23 4.8 5.1 1.8 0.9 54.3 19.2 19.3 -1.9 -2.6 -2.4 -2.7 -12.2
MEMORANDA
42 Net unrealized gains (losses) onavailable-for-sale securities24 -0.4 0.8 0.5 0.6 0.4 -0.1 -0.9 -0.8 -0.7 -0.7 -0.6 -0.8
43 U.S. Treasury and agency securities, MBS25 -0.4 0.8 0.5 0.6 0.4 -0.1 -0.9 -0.8 -0.7 -0.7 -0.6 -0.8
Footnotes appear on the last page.
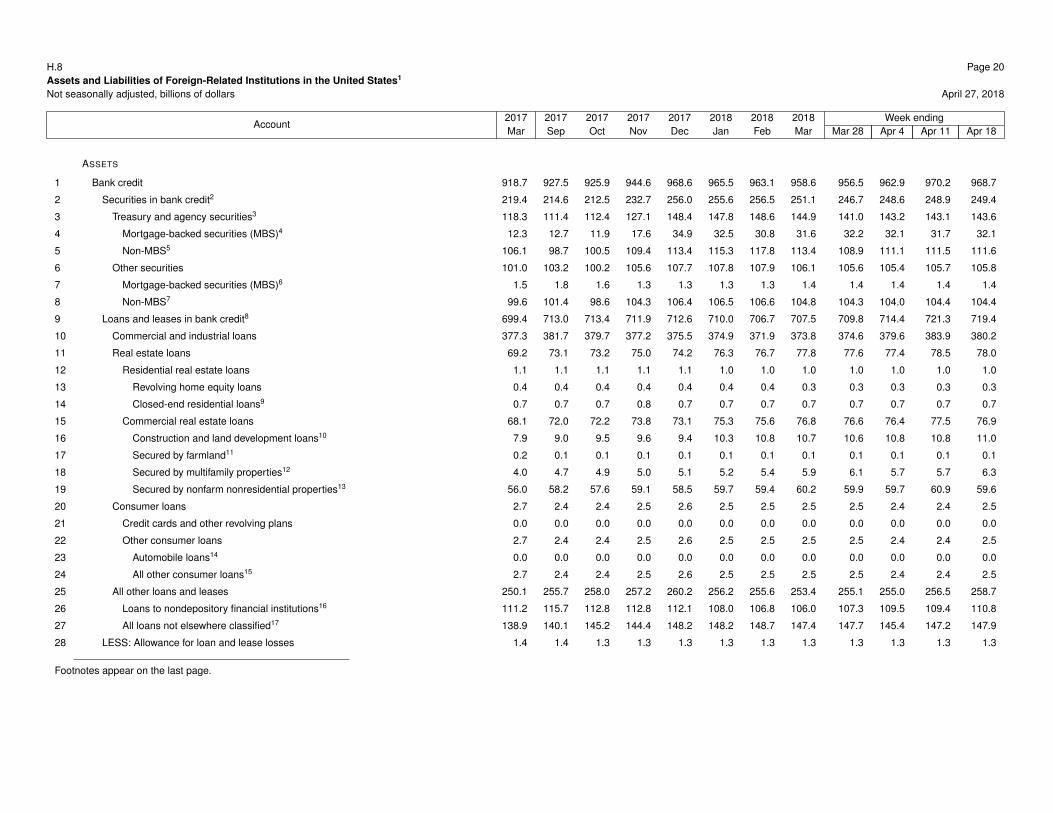
H.8 Page 20
Assets and Liabilities of Foreign-Related Institutions in the United States1
Not seasonally adjusted, billions of dollars April 27, 2018
Account2017 2017 2017 2017 2017 2018 2018 2018 Week ending
Mar Sep Oct Nov Dec Jan Feb Mar Mar 28 Apr 4 Apr 11 Apr 18
ASSETS
1 Bank credit 918.7 927.5 925.9 944.6 968.6 965.5 963.1 958.6 956.5 962.9 970.2 968.7
2 Securities in bank credit2 219.4 214.6 212.5 232.7 256.0 255.6 256.5 251.1 246.7 248.6 248.9 249.4
3 Treasury and agency securities3 118.3 111.4 112.4 127.1 148.4 147.8 148.6 144.9 141.0 143.2 143.1 143.6
4 Mortgage-backed securities (MBS)4 12.3 12.7 11.9 17.6 34.9 32.5 30.8 31.6 32.2 32.1 31.7 32.1
5 Non-MBS5 106.1 98.7 100.5 109.4 113.4 115.3 117.8 113.4 108.9 111.1 111.5 111.6
6 Other securities 101.0 103.2 100.2 105.6 107.7 107.8 107.9 106.1 105.6 105.4 105.7 105.8
7 Mortgage-backed securities (MBS)6 1.5 1.8 1.6 1.3 1.3 1.3 1.3 1.4 1.4 1.4 1.4 1.4
8 Non-MBS7 99.6 101.4 98.6 104.3 106.4 106.5 106.6 104.8 104.3 104.0 104.4 104.4
9 Loans and leases in bank credit8 699.4 713.0 713.4 711.9 712.6 710.0 706.7 707.5 709.8 714.4 721.3 719.4
10 Commercial and industrial loans 377.3 381.7 379.7 377.2 375.5 374.9 371.9 373.8 374.6 379.6 383.9 380.2
11 Real estate loans 69.2 73.1 73.2 75.0 74.2 76.3 76.7 77.8 77.6 77.4 78.5 78.0
12 Residential real estate loans 1.1 1.1 1.1 1.1 1.1 1.0 1.0 1.0 1.0 1.0 1.0 1.0
13 Revolving home equity loans 0.4 0.4 0.4 0.4 0.4 0.4 0.4 0.3 0.3 0.3 0.3 0.3
14 Closed-end residential loans9 0.7 0.7 0.7 0.8 0.7 0.7 0.7 0.7 0.7 0.7 0.7 0.7
15 Commercial real estate loans 68.1 72.0 72.2 73.8 73.1 75.3 75.6 76.8 76.6 76.4 77.5 76.9
16 Construction and land development loans10 7.9 9.0 9.5 9.6 9.4 10.3 10.8 10.7 10.6 10.8 10.8 11.0
17 Secured by farmland11 0.2 0.1 0.1 0.1 0.1 0.1 0.1 0.1 0.1 0.1 0.1 0.1
18 Secured by multifamily properties12 4.0 4.7 4.9 5.0 5.1 5.2 5.4 5.9 6.1 5.7 5.7 6.3
19 Secured by nonfarm nonresidential properties13 56.0 58.2 57.6 59.1 58.5 59.7 59.4 60.2 59.9 59.7 60.9 59.6
20 Consumer loans 2.7 2.4 2.4 2.5 2.6 2.5 2.5 2.5 2.5 2.4 2.4 2.5
21 Credit cards and other revolving plans 0.0 0.0 0.0 0.0 0.0 0.0 0.0 0.0 0.0 0.0 0.0 0.0
22 Other consumer loans 2.7 2.4 2.4 2.5 2.6 2.5 2.5 2.5 2.5 2.4 2.4 2.5
23 Automobile loans14 0.0 0.0 0.0 0.0 0.0 0.0 0.0 0.0 0.0 0.0 0.0 0.0
24 All other consumer loans15 2.7 2.4 2.4 2.5 2.6 2.5 2.5 2.5 2.5 2.4 2.4 2.5
25 All other loans and leases 250.1 255.7 258.0 257.2 260.2 256.2 255.6 253.4 255.1 255.0 256.5 258.7
26 Loans to nondepository financial institutions16 111.2 115.7 112.8 112.8 112.1 108.0 106.8 106.0 107.3 109.5 109.4 110.8
27 All loans not elsewhere classified17 138.9 140.1 145.2 144.4 148.2 148.2 148.7 147.4 147.7 145.4 147.2 147.9
28 LESS: Allowance for loan and lease losses 1.4 1.4 1.3 1.3 1.3 1.3 1.3 1.3 1.3 1.3 1.3 1.3
Footnotes appear on the last page.
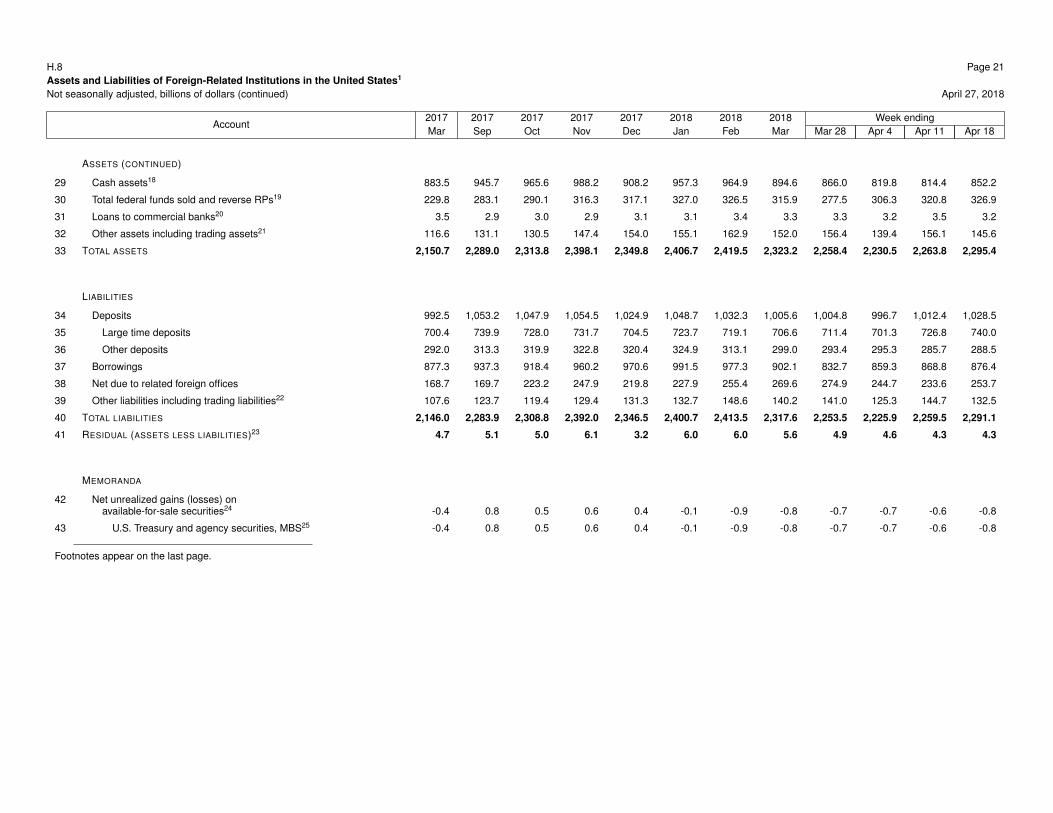
H.8 Page 21
Assets and Liabilities of Foreign-Related Institutions in the United States1
Not seasonally adjusted, billions of dollars (continued) April 27, 2018
Account2017 2017 2017 2017 2017 2018 2018 2018 Week ending
Mar Sep Oct Nov Dec Jan Feb Mar Mar 28 Apr 4 Apr 11 Apr 18
ASSETS (CONTINUED)
29 Cash assets18 883.5 945.7 965.6 988.2 908.2 957.3 964.9 894.6 866.0 819.8 814.4 852.2
30 Total federal funds sold and reverse RPs19 229.8 283.1 290.1 316.3 317.1 327.0 326.5 315.9 277.5 306.3 320.8 326.9
31 Loans to commercial banks20 3.5 2.9 3.0 2.9 3.1 3.1 3.4 3.3 3.3 3.2 3.5 3.2
32 Other assets including trading assets21 116.6 131.1 130.5 147.4 154.0 155.1 162.9 152.0 156.4 139.4 156.1 145.6
33 TOTAL ASSETS 2,150.7 2,289.0 2,313.8 2,398.1 2,349.8 2,406.7 2,419.5 2,323.2 2,258.4 2,230.5 2,263.8 2,295.4
LIABILITIES
34 Deposits 992.5 1,053.2 1,047.9 1,054.5 1,024.9 1,048.7 1,032.3 1,005.6 1,004.8 996.7 1,012.4 1,028.5
35 Large time deposits 700.4 739.9 728.0 731.7 704.5 723.7 719.1 706.6 711.4 701.3 726.8 740.0
36 Other deposits 292.0 313.3 319.9 322.8 320.4 324.9 313.1 299.0 293.4 295.3 285.7 288.5
37 Borrowings 877.3 937.3 918.4 960.2 970.6 991.5 977.3 902.1 832.7 859.3 868.8 876.4
38 Net due to related foreign offices 168.7 169.7 223.2 247.9 219.8 227.9 255.4 269.6 274.9 244.7 233.6 253.7
39 Other liabilities including trading liabilities22 107.6 123.7 119.4 129.4 131.3 132.7 148.6 140.2 141.0 125.3 144.7 132.5
40 TOTAL LIABILITIES 2,146.0 2,283.9 2,308.8 2,392.0 2,346.5 2,400.7 2,413.5 2,317.6 2,253.5 2,225.9 2,259.5 2,291.1
41 RESIDUAL (ASSETS LESS LIABILITIES)23 4.7 5.1 5.0 6.1 3.2 6.0 6.0 5.6 4.9 4.6 4.3 4.3
MEMORANDA
42 Net unrealized gains (losses) onavailable-for-sale securities24 -0.4 0.8 0.5 0.6 0.4 -0.1 -0.9 -0.8 -0.7 -0.7 -0.6 -0.8
43 U.S. Treasury and agency securities, MBS25 -0.4 0.8 0.5 0.6 0.4 -0.1 -0.9 -0.8 -0.7 -0.7 -0.6 -0.8
Footnotes appear on the last page.

H.8 Page 22FootnotesApril 27, 2018
1. Data include the following types of institutions in the fifty states and the District of Columbia: domestically chartered commercial banks; U.S. branches and agencies of foreign banks; and Edge Act and
agreement corporations. The latter two categories together are referred to on this release as ”foreign-related institutions.” Data exclude International Banking Facilities. Weekly levels are Wednesday values; monthly
levels are pro rata averages of Wednesday values. The data for domestically chartered commercial banks and U.S. branches and agencies of foreign banks are estimated by benchmarking weekly data provided by a
sample of banks to quarter-end reports of condition (Call Reports). Large domestically chartered commercial banks are defined as the top 25 domestically chartered commercial banks, ranked by domestic assets as
of the previous commercial bank Call Report to which the H.8 release data have been benchmarked. Small domestically chartered commercial banks are defined as all domestically chartered commercial banks not
included in the top 25. The data for large and small domestically chartered banks are adjusted to remove the estimated effects of mergers and panel shifts between these two bank groups. (See
www.federalreserve.gov/releases/h8/about.htm for more information on how these data were constructed.)
2. Includes all securities, whether held-to-maturity reported at amortized cost, available-for-sale reported at fair value, or held as trading assets, also reported at fair value. Excludes all non-security trading assets,
such as derivatives with a positive fair value (included in line 32) or loans held in trading accounts (included in line 9).
3. Treasury securities are liabilities of the U.S. government. Agency securities are liabilities of U.S. government agencies and U.S. government-sponsored enterprises.
4. Includes mortgage-backed securities (MBS) issued by U.S. government agencies or by U.S. government-sponsored enterprises such as the Government National Mortgage Association (GNMA), the Federal
National Mortgage Association (FNMA), or the Federal Home Loan Mortgage Corporation (FHLMC). Includes pass-through securities, collateralized mortgage obligations (CMOs), real estate mortgage investment
conduits (REMICs), CMO and REMIC residuals, and stripped MBS.
5. Includes U.S. Treasury securities and U.S. government agency obligations other than MBS.
6. Includes MBS not issued or guaranteed by the U.S. government.
7. Includes securities issued by states and political subdivisions in the United States, asset-backed securities (ABS), other domestic and foreign debt securities, and investments in mutual funds and other equity
securities with readily determinable fair values.
8. Includes the allowance for loan and lease losses (line 28) and all loans held in trading accounts under a fair value option. Excludes total federal funds sold and reverse RPs (line 30), loans made to commercial
banks (line 31), and unearned income.
9. Includes first and junior liens on closed-end loans secured by 1-4 family residential properties.
10. Includes construction, land development, and other land loans.
11. Includes loans secured by farmland, including grazing and pastureland.
12. Includes loans secured by multifamily (5 or more) residential properties, including apartment buildings.
13. Includes loans secured by nonfarm nonresidential properties, both owner-occupied and other nonfarm nonresidential properties.
14. Includes loans for purchasing new and used passenger cars and other vehicles. Includes direct and indirect consumer automobile loans as well as retail installment sales paper purchased from auto dealers.
15. Includes student loans, loans for medical expenses and vacations, and loans for other personal expenditures.
16. Includes loans to real estate investment trusts, insurance companies, holding companies of other depository institutions, finance companies, mortgage finance companies, factors, federally-sponsored lending
agencies, investment banks, banks’ own trust departments, and other nondepository financial intermediaries.
17. Includes loans for purchasing or carrying securities, loans to finance agricultural production, loans to foreign governments and foreign banks, obligations of states and political subdivisions, loans to nonbank
depository institutions, unplanned overdrafts, loans not elsewhere classified, and lease financing receivables.
18. Includes vault cash, cash items in process of collection, balances due from depository institutions, and balances due from Federal Reserve Banks.
19. Includes total federal funds sold to, and reverse RPs with, commercial banks, brokers and dealers, and others, including the Federal Home Loan Banks (FHLB).
20. Excludes loans secured by real estate, which are included in line 11.
21. Includes other real estate owned; premises and fixed assets; investments in unconsolidated subsidiaries; intangible assets (including goodwill); direct and indirect investments in real estate ventures; accounts
receivable; derivative contracts (interest rate, foreign exchange rate, other commodity and equity contracts) with a positive fair value, as determined under FASB Interpretation No. 39 (FIN 39); and other assets.
Excludes the due-from position with related foreign offices which is included in line 38. Excludes most securities held in trading accounts (included in line 2); trading account securities at some smaller domestically
chartered commercial banks are included in this item.
22. Includes subordinated notes and debentures; net deferred tax liabilities; interest and other expenses accrued and unpaid; accounts payable; liabilities for short positions; derivative contracts with a negative fair
value, as determined under FASB Interpretation No. 39 (FIN 39); other trading liabilities to which fair value accounting has been applied; and other liabilities.
23. This balancing item is not intended as a measure of equity capital for use in capital adequacy analysis. On a seasonally adjusted basis this item reflects any differences in the seasonal patterns estimated for
total assets and total liabilities.
24. Difference between fair value and amortized cost for securities classified as available-for-sale under FASB Statement 115. Data have been adjusted to include an estimate of tax effects, omitted from the
reported data.
25. Difference between fair value and amortized cost for Treasury and agency securities, mortgage-backed securities (MBS), classified as available-for-sale under FASB Statement 115. Data have been adjusted
to include an estimate of tax effects, omitted from the reported data.
Current and historical H.8 data are available from the Federal Reserve Board’s Data Download Program (www.federalreserve.gov/datadownload/Choose.aspx?rel=H.8). “Notes on the Data” back to October 17,
1989, may be found on the Federal Reserve Board’s website (www.federalreserve.gov/releases/h8/h8notes.htm).