February, 2010. Today’s Focus : MCA: – Who We Are – Our Core Services Challenges & Solutions...
19
February, 2010
-
Upload
alexandrina-harrington -
Category
Documents
-
view
213 -
download
0
Transcript of February, 2010. Today’s Focus : MCA: – Who We Are – Our Core Services Challenges & Solutions...

February, 2010

Today’s Focus:
•MCA:– Who We Are– Our Core Services
•Challenges & Solutions• Items for Council Awareness•Questions
Page 2

Page 3
Director & Chief Clerk
Sahira J. Abdool ( 6 ) - 309.5 FTE - ( 312
)
Communications Officer/PIO
Gwendolyn Goins3.0 FTE ( 3 )
Chief of StaffMary Sloan Hammond
2.0 FTE ( 2 )
Admin. ServicesGilbert
Crawford48.0 FTE - ( 48 )
IT/System Support
Rex Billings24.0 FTE - ( 24 )
Public Services
Karen Williams
93.7 FTE - ( 94 )
Court Operations
Gregory Prier138.8 FTE - ( 141
)
MCA Organization Chart

Page 4
MCA Team Members

Our Core Services• We provide 24/7 court access and support to the
public 365 days a year for more than 2 million customers annually or approximately (6-8K daily)
• We process more than 1.2 million citations a year and bring in approximately $60M in fine payments for the State of Texas and City combined
• We provide Court Services, Court Operations, Administrative, Building Security and IT Support to all Court facilities.
• We are Generally the first and last points of contact for court visitors.
Page 5

Challenges:
1. One of the Largest Municipal Courts in America with a Court Management System at End of Life
2. Revenue Retention and Growth
3. Transforming the Court Culture and Team Members
4. Raising Court Services to 21st century standards
Page 6

Solution #1 Customized System Development
• Designed to meet current and future business needs for the complexity and volume of business
• Automate complex manual processes, improve quality, efficiency and expedite wait times
• Ensure daily operations continues to provide essential services to the public and stakeholders
Page 7

Solution #2 Total Revenue Retention
FY04 FY05 FY06 FY07 FY08 FY09 12/31/09
56,490,278 60,079,408 56,733,437 60,381,264 60,059,069 62,531,959 27,619,586
$17,900,161
$38,590,117
$21,287,676
$38,791,732
$21,672,341
$35,061,096
$23,023,919
$37,357,345
$23,285,476
$36,773,593
$25,658,817
$36,873,142
$11,413,211
$16,206,375
$M
$10M
$20M
$30M
$40M
$50M
$60M
$70M
FY04 FY05 FY06 FY07 FY08 FY09YTD
FY10YTD
State Fees C ity Revenues
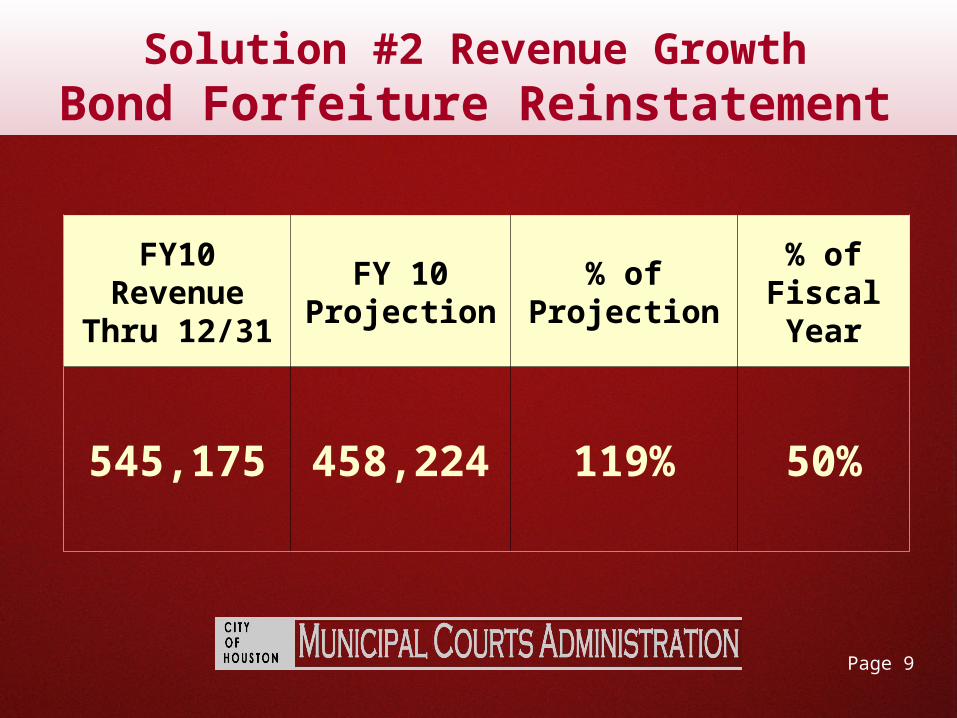
Solution #2 Revenue GrowthBond Forfeiture Reinstatement
Page 9
FY10 Revenue
Thru 12/31
FY 10Projection
% of Projection
% of Fiscal Year
545,175 458,224 119% 50%

Page 10
Solution #2 Revenue Growth One Call Solution Center
Global Connect
MonthsFY09
Outbound Revenue
FY10 Outbound Revenue
July $ 18,796 $ 28,581
August $ 11,760 $ 40,589
September $ 27,651 $ 35,894
October $ 53,981 $ 57,884
November $ 38,505 $ 53,613
December $ 45,685 $ 64,561
Total $196,378 $ 281,123

Page 11
Solution #2 Revenue Growth One Call Solution Center
MonthsFY09 Total Collections Revenue
FY10 Total Collections Revenue
July $ 765,284 $ 915,918
August $ 695,859 $ 863,407
September $ 612,692 $ 920,034
October $ 838,225 $ 958,897
November $ 740,533 $ 798,822
December $859,553 $ 855,586
Total $ 4,512,525 $5,312,933

Solution #2 - Revenue Growth 24/7 IVR Payment Services
3rd Qtr Go-Live
Hardware, Software, Contract to RS Maintenance
Year 1 Year 2 Year 3 Year 4 Year 5 Total
$802,528 $71,412 $85,712 $85,712 $85,712 1,115,576
Cost Projections MCA
Projected Benefits
Year 1 Year 2 Year 3 Year 4 Year 5 Total
24/7 payment processing
3,132,258 3,132,258 3,132,258 3,132,258 3,132,258 $15,661,290
24/7 Global Connect 12,464 12,464 12,464 12,464 12,464 $62,320
Total Benefits
3,144,722 3,144,722 3,144,722 3,144,722 3,144,722 $15,723,610
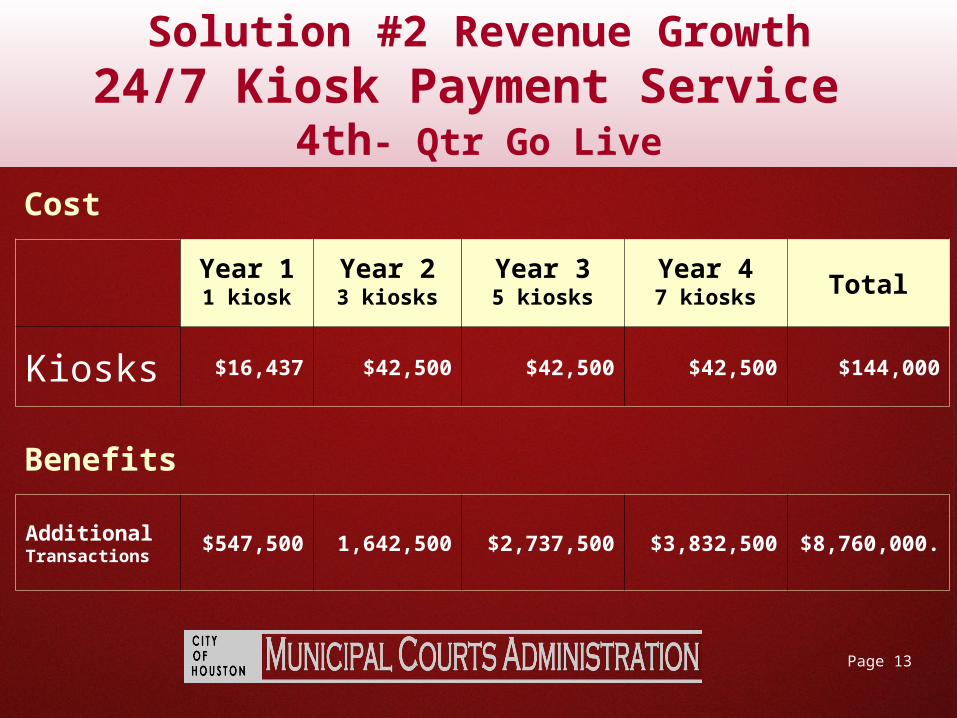
Solution #2 Revenue Growth24/7 Kiosk Payment Service
4th- Qtr Go Live
Page 13
Year 11 kiosk
Year 23 kiosks
Year 35 kiosks
Year 47 kiosks Total
Kiosks $16,437 $42,500 $42,500 $42,500 $144,000
Additional Transactions
$547,500 1,642,500 $2,737,500 $3,832,500 $8,760,000.
Cost
Benefits

Page 14
Solution #2 - Revenue GrowthScofflaw-Vehicle Registration Denial Program
(Pending Authorization)
YearTotal No. of Capias
Total Dollar Value
20% matches; potential revenue
2005/2006 8,979 3,240,108 648,022
2007 46,917 16,732,999 3,346,600
2008 37,894 9,893,302 1,978,640
Total 93,790 29,866,409 5,973,262

Solution #3MCAD Transformation
PRODUCTION
KNOWLEDGE
HIGH PERFORMANCE
5 - 8 Year Process
We are here
Page 15

Solution #4 21st Century Services
Page 16

Solution #421st Century Services
Page 17
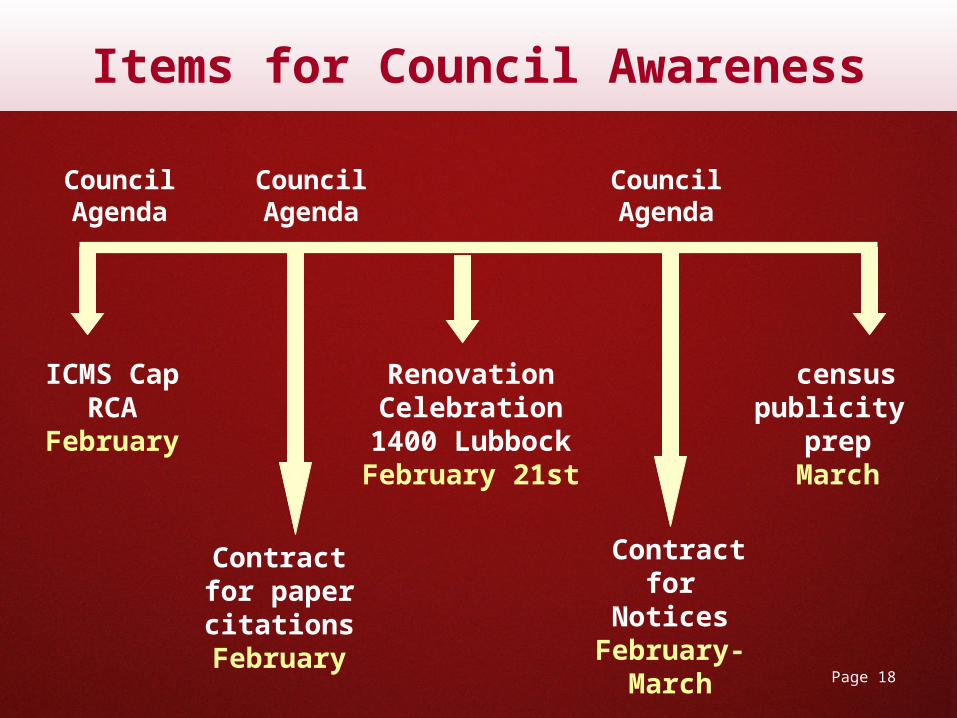
ICMS Cap RCA
February
Council Agenda
Contract for paper citations February
Council Agenda
Renovation Celebration
1400 Lubbock February 21st
census publicity
prep March
Council Agenda
Contract for Notices February-
March
Items for Council Awareness
Page 18

Questions?
Page 19