Feasibility Study on the Establishment of an Online Portal ...
76
Feasibility Study on the Establishment of an Online Portal for Trading in Freight Services (e-freightex) in East Africa Final Report – July 2013 Volume I Upper Quartile LLP
Transcript of Feasibility Study on the Establishment of an Online Portal ...
Feasibility Study on the Establishment of an Online Portal for Trading in Freight Services (e-freightex) in
East Africa
Final Report – July 2013
Volume I
Upper Quartile LLP

Final report: Feasibility study on the establishment of an online portal
for trading in freight services (e-freightex) in East Africa
E8073-UQ 2
Contents ACRONYMS ......................................................................................................................... 6
EXECUTIVE SUMMARY ....................................................................................................... 8
1. INTRODUCTION .......................................................................................................... 13
1.1 Commissioned Project .............................................................................................. 13
1.2 Project Background .................................................................................................. 13
1.3 Project Objectives ..................................................................................................... 14
1.4 Failed Attempts ......................................................................................................... 14
1.5 Study Work Plan ....................................................................................................... 14
1.6 Structure of the Draft Report ..................................................................................... 15
2. E-FREIGHTEX MARKET ............................................................................................. 16
2.1 Introduction ............................................................................................................... 16
2.2 Types of E-Freightex's .............................................................................................. 16
2.2.1 Type 1: Quotation Engine E-Freightex .................................................................. 16
2.2.2 Type 2: Matching Engine E-Freightex ................................................................... 17
2.2.3 Type 3: Matching Engine E-Freightex with Aggregate Reporting .......................... 17
2.2.4 Type 4: Mature Freightex with Advanced Features ............................................... 18
2.3 Synergies Between other platforms .......................................................................... 19
2.3.1 Introduction ........................................................................................................... 19
2.3.2 Single Window Information for Trade (SWIFT) ...................................................... 19
2.3.3 Transport Observatory .......................................................................................... 19
2.3.4 Integrated Border Management ............................................................................. 20
2.3.5 Other Freight Studies ............................................................................................ 20
2.4 Key Freight Project Issues and Challenges ............................................................... 21
3. EAST AFRICA’S VOLUME AND TRADE DIRECTION ................................................. 23
3.1 Trade Performance ................................................................................................... 23
3.2 Top Exports and Imports ........................................................................................... 23
3.3 Intra-Regional Trade ................................................................................................. 24
3.4 East Africa Container Port Traffic of the Region ........................................................ 25
3.5 Import-Export Cargo Time in the Region ................................................................... 25
3.6 Import-Export Cost of a Container in the Region ....................................................... 27
3.7 Freight Distribution .................................................................................................... 29
4. WORKSHOPS AND STAKEHOLDERS’ CONSULTATIONS OUTCOMES ................. 30
4.1 Inception Workshop .................................................................................................. 30
Final report: Feasibility study on the establishment of an online portal
for trading in freight services (e-freightex) in East Africa
E8073-UQ 3
4.1.1 General ................................................................................................................. 30
4.1.2 Key Outcomes of the Inception Workshop ............................................................. 30
4.2 Stakeholders’ Consultation Workshops ..................................................................... 31
4.2.1 Selection of E-Freightex Type ............................................................................... 31
4.2.2 Expected Impacts of E-Freightex Portal ................................................................ 32
4.2.3 Operation and Management of E-Freightex Portal ................................................ 32
4.3 Stakeholder Validation Workshop ............................................................................. 33
5. OPTIONEERING .......................................................................................................... 34
5.1 Introduction ............................................................................................................... 34
5.2 Methodology ............................................................................................................. 34
5.2.1 Overview ............................................................................................................... 34
5.2.2 Qualitative Assessment ......................................................................................... 34
5.3 Outcome of Optioneering .......................................................................................... 38
6. DESIGN OF E-FREIGHTEX ......................................................................................... 39
6.1 Business Process Management (BPM) - As Is .......................................................... 39
6.2 Solution Components for To-Be ................................................................................ 39
6.2.1 Key Requirements ................................................................................................. 39
6.2.2 Solution Components ............................................................................................ 40
6.3 Technical Options ..................................................................................................... 41
6.3.1 Intellectual Property Model for Delivery ................................................................. 41
6.3.2 Deployment and Development Technology Choices ............................................ 43
6.3.2.1 Deployment Technologies ................................................................................. 43
6.3.2.2 Development Technologies ............................................................................... 44
6.3.3 Hosting .................................................................................................................. 44
6.3.3.1 Scaling and Volume Predictions ........................................................................ 45
6.3.3.2 Availability and Disaster Recovery ..................................................................... 46
6.4 IT Capacity Requirements & Interventions Required ................................................. 46
6.4.1 Hosting Infrastructure in the Region ...................................................................... 46
6.4.2 Reliability of Local Connectivity ............................................................................. 47
6.4.3 Lack of General IT skills ........................................................................................ 47
6.4.4 Consolidating freight statistics from across the region ........................................... 48
6.5 Proposed Solution .................................................................................................... 48
6.5.1 Buy vs Build .......................................................................................................... 48
6.5.2 Proposed solution for feasibility study purposes .................................................... 51

Final report: Feasibility study on the establishment of an online portal
for trading in freight services (e-freightex) in East Africa
E8073-UQ 4
6.6 Cost Estimates.......................................................................................................... 51
6.6.1 Software Development Costs ................................................................................ 51
6.6.2 Other initial development costs ............................................................................. 52
6.6.3 Running Costs - Hosting ....................................................................................... 53
6.6.4 Running Costs – Administration Staff and Equipment Costs ................................. 54
6.6.5 Running Costs – Software Support and Maintenance ........................................... 54
6.6.6 Running Costs - Management & Admin overheads ............................................... 54
6.6.7 Payment Transactions Cost .................................................................................. 56
6.6.8 Overall Cost Summary .......................................................................................... 56
7. THE VALUE FOR MONEY CASE ................................................................................ 58
7.1 Container Demand Forecasts ................................................................................... 58
7.2 Transport Costs ........................................................................................................ 62
7.3 The Value for Money Case ....................................................................................... 63
7.3.1 Introduction ........................................................................................................... 63
7.3.2 Options Assessment ............................................................................................. 63
7.3.3 Definition of Scenarios .......................................................................................... 63
7.3.4 Appraisal Period .................................................................................................... 63
7.3.4 Project Costs ......................................................................................................... 64
7.3.5 Monetised Benefits of the Project .......................................................................... 64
7.4 Risk Assessment ...................................................................................................... 65
7.4.1 Introduction ........................................................................................................... 65
7.4.2 Risk Assessment ................................................................................................... 65
7.5 Scenario Testing ....................................................................................................... 67
7.6 Appraisal Summary Table ......................................................................................... 67
7.7 Financial Assessment ............................................................................................... 69
7.7.1 General ................................................................................................................. 69
7.7.2 Revenue Streams ................................................................................................ 69
7.7.2.1 Subscription Model ............................................................................................ 69
7.7.2.2 Fee-based Model ............................................................................................... 73
7.7.2.3 Advertising Revenues ........................................................................................ 73
7.8 E-Freightex Ownership, Management and Regulation Options ................................. 74
7.8.1 Options for Ownership, Management and Regulation of e-freightex ...................... 74
8. CONCLUSIONS AND RECOMMENDATIONS ............................................................. 76
8.1 Conclusions .............................................................................................................. 76

Final report: Feasibility study on the establishment of an online portal
for trading in freight services (e-freightex) in East Africa
E8073-UQ 5
8.2 Recommendations .................................................................................................... 76

Final report: Feasibility study on the establishment of an online portal
for trading in freight services (e-freightex) in East Africa
E8073-UQ 6
ACRONYMS ABADT - Association Burundaise des Agences en Douaneet Transitaires,
Burundi ACOBU - Chambre Sectorielle des Commercants du Burundi/Service Chamber ADR - Association des Agences en Douane du Rwanda AFAB - Association des femmes d'affaires du Burundi ATIB - International Transporters Association of Burundi B2B - Business to Business B2C - Business to Consumer BPM - Business Process Mapping C&F - Clearing and Forwarding CCTTFA - Central Corridor Transit Transport Facilitation Agency CCS - Consultative Committee of Stakeholders EAC - East African Community EATTA - East Africa Tea Trade Association FEAFFA - Federation of East African Freight Forwarders Associations FEARTA - Federation of East Africa Road Transport Association FPEAK - Fresh Produce Exporters Association of Kenya IT - Information and Technology KAM - Kenya Association of Manufacturers KIFWA - Kenya International freight & Warehousing Association KEPSA - Kenya Private Sector Alliance KSAA - Kenya Ships Agents Association KENTRADE - Kenya Trade Network Agency KPA - Kenya Ports Authority KSC - Kenya Shippers Council KTA - Kenya Transporters Association Ministry of Trade - Rwanda Ministry of Trade NCTTCA - Northern Corridor Transit Transport Coordination Authority NTB - Non Tariff Barrier RDB - Rwanda Development Board RLDTA - Regional Lorry Drivers and Transporters Association RTA - Road Transport Association RVR - Rift Valley Railways TAFFA - Tanzania Freight Forwarders Association TATOA - Tanzania Truck Owners Association TPA - Tanzania Port Authority TSC - Tanzania Shippers Council TMEA - Trade Mark East Africa ToR - Terms of Reference UCIFA - Uganda Clearing Industry and Forwarding Association UCTOA - Uganda Commercial Trucker Owners Association
Final report: Feasibility study on the establishment of an online portal
for trading in freight services (e-freightex) in East Africa
E8073-UQ 7
UFFA - Uganda Freight Forwarders Association UNTA - Uganda National Transporters Alliance USC - Uganda Shippers Council UTA - Uganda Transporters Alliance US$ - United States Dollar UQ - Upper Quartile
Final report: Feasibility study on the establishment of an online portal
for trading in freight services (e-freightex) in East Africa
E8073-UQ 8
EXECUTIVE SUMMARY
Overview A freight exchange (e-freightex) is an online service for freight carriers, logistics providers, freight forwarders and related service providers. It allows transport companies and other service providers to search for freight, and freight forwarders/logistics providers/shippers to offer freight to be transported, handled, warehoused or serviced. Freight exchanges make it easier for forwarders and shippers with large cargo loads that may not be handled by one carrier to advertise their freight either privately or publicly to a large number of freight operators looking for loads. Similarly they allow freight operators to offer vehicle space to small scale cargo holders cannot afford a full truck load. Freight exchanges provide a platform for network wide collaboration e.g. enabling service providers or their associations to communicate freight traffic information to fellow operators or, in case of associations, their members. Online systems are normally subscription-based with a small charge for advertising (posting) and searching (consulting).
Some of the potential benefits perceived for the e-freightex include:
Improved market information and increased competition; Reduced administrative outlay and logistics costs; Increased truck load factors and shortened turnaround times thereby reducing
transport costs and increasing operators’ profits and investment;; Improved freight services such as insurance, IT solutions, agency/representation,
brokerage, market intelligence etc.; and Information dissemination.
East Africa Trade East Africa’s total trade was estimated at US$37 billion in 2010, which was a fourfold increase from the US$8.8 billion traded in 2000. Trade in 2010 was worth 47% of East Africa’s GDP, compared with 28% in 2000. The US$11.1 billion of East African exports in 2010 were predominantly from Kenya (US$5.2 billion/47%) and Tanzania (US$3.9 billion/36%). Kenya also accounted for 44% of the US$27 billion in imports, while Tanzania’s import share was 29% in 2010.
East African ports too substantially increased their container traffic between 2007 and 2011. The average annual rate of growth of container traffic in Kenya (585367 in 2007 and 735672 in 2011) is estimated at 5.9 percent and in Tanzania (350991 in 2007 and 453754 in 2011) at 6.6 percent per annum. However owing to the rapid expansion of traffic, the region’s ports are beginning to experience capacity constraints as both in the case of Mombasa (Kenya) and Dar es Salaam (Tanzania) the volume of general cargo and container traffic significantly exceeds design capacity.
The capacity constraints faced at the ports of Mombasa and Dar es Salaam, coupled with extremely lengthy import and export procedures, adds considerable time to the clearing of goods from ports (average 20-30 days as compared with less than five days in Europe, US, Hong Kong etc.). Among road corridors serving landlocked countries, there are significant cost differences. Based on the three main intraregional arteries in East Africa, the cost of importing goods from a landlocked country lies in the range of $170 to $370 per tonne-kilometer.
A recently completed report on the East African trade and transport facilitation project sets out that the roads mode dominates the freight distribution in the East African region by
Final report: Feasibility study on the establishment of an online portal
for trading in freight services (e-freightex) in East Africa
E8073-UQ 9
carrying 80% of the regional ton-km. Pipelines carry 10%, which is followed by rail (8%) and air transport (2%).
Stakeholder Consultations The participants were presented with 4 types based on the complexity of a freight exchange:
Type 1 – Quotation engine, simplest form of freight exchange, allows buyers to find sellers (generally regarded by participants as too simplistic);
Type 2 – Matching engine to allow buyers and sellers to find each other; Type 3 – As Type 2, with additional aggregate reporting services; and Type 4 – As Type 3, with additional value-added features (generally regarded by
participants as a good “end goal” but likely more complex than necessary to derive the key benefits of the freight exchange concept)
During the stakeholders’ consultation stage, 83.5% of the total stakeholders of the region preferred Type 3 to be taken forward to the next stage of the study; followed by 12.5% showing preference for Type 4; and the remaining 5% voting for Type 1 e-freightex system.
When stakeholders were asked that what percentage of transport costs reduction do they envisage the e-freightex portal can generate; 73.9% of those who voted thought it could reduce the transport costs by 5%; 21.7% thought that the development of e-freightex portal could reduce the transport costs by 10%; and the remaining 4.4% thought the costs savings will be higher than 10%.
Optioneering A preliminary appraisal of each e-freightex type was designed to show the broad impacts of a range of criteria on them. The information derived from the exercise helped UQ and TMEA to identify the preferred type of e-freightex. It was concluded that Type 3 e-freightex (Matching Engine E-Freightex with Aggregate Reporting) was ranked first among the other types of e-freightex’s; and was clearly the most preferred type of e-freightex.
E-Freightex Design The study team assessed the requirements and functions for the e-freightex system including business processes, system development and hosting requirements. The study team also undertook the schematic design of the e-freightex system showing key components of the e- freightex system.
The study team found out that a key decision which will need to be made by the operator in the next stage of implementation of the e-freightex is whether to “build or buy” the e-freightex system software.
For the purposes of the feasibility study the consultants have assumed that the operator would make a “Build” decision because:
It provides maximum flexibility in terms of addressing requirements;
It maximises ownership and therefore control of the overall e-freightex solution, potentially with a positive impact on sustainability; and
It is definitely do-able (the study team do not know if any third parties want to sell or license their freight exchange software).

Final report: Feasibility study on the establishment of an online portal
for trading in freight services (e-freightex) in East Africa
E8073-UQ 10
Figure E.1: Buy vs Build options
Project Costs The project development cost for the e-freightex portal was estimated at circa US$ 0.45m (2013 prices). The operational cost was estimated at circa US$ 0.6m per annum.
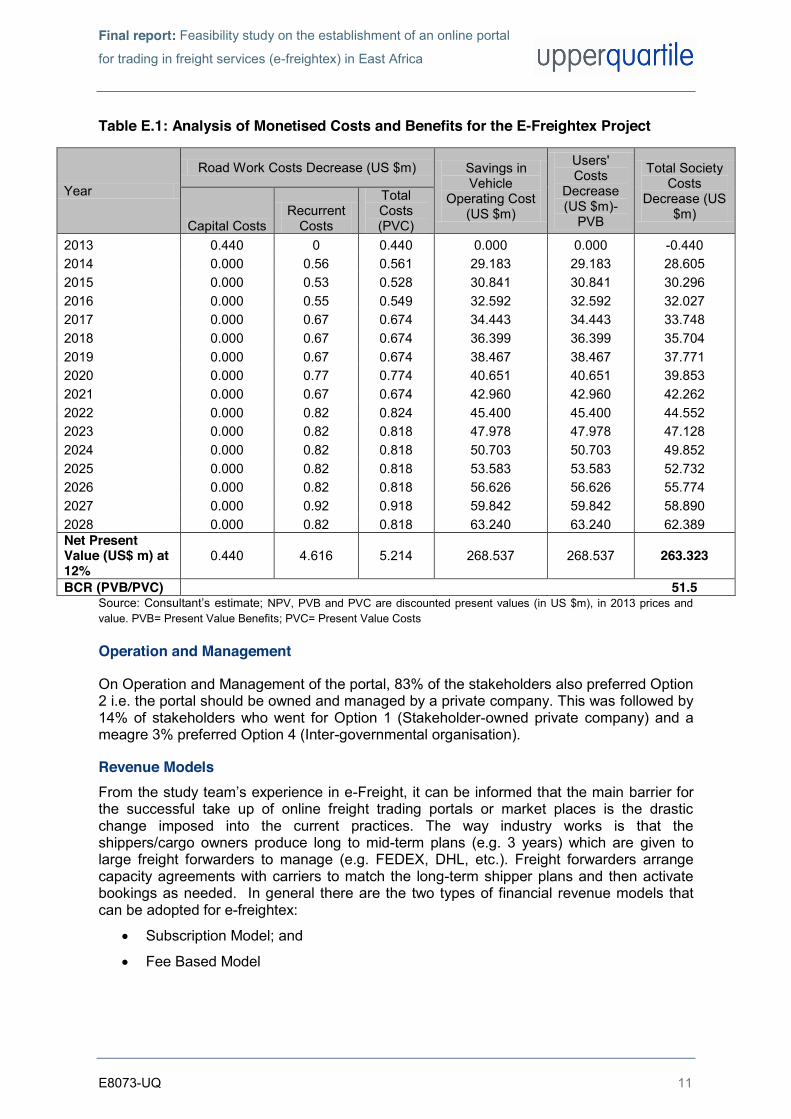
The Value for Money Case Table E.1 below summarise the costs and benefits and show that the Net Present Value (NPV) of the project is estimated at US$ 263.0m. This large positive value indicates that the benefits for the scheme considerably outweigh the costs i.e. the scheme offers a very high value for money to the taxpayer.
Final report: Feasibility study on the establishment of an online portal
for trading in freight services (e-freightex) in East Africa
E8073-UQ 11
Table E.1: Analysis of Monetised Costs and Benefits for the E-Freightex Project
Year
Road Work Costs Decrease (US $m) Savings in Vehicle
Operating Cost (US $m)
Users' Costs
Decrease (US $m)-
PVB
Total Society Costs
Decrease (US $m)
Capital Costs Recurrent
Costs
Total Costs (PVC)
2013 0.440 0 0.440 0.000 0.000 -0.440 2014 0.000 0.56 0.561 29.183 29.183 28.605 2015 0.000 0.53 0.528 30.841 30.841 30.296 2016 0.000 0.55 0.549 32.592 32.592 32.027 2017 0.000 0.67 0.674 34.443 34.443 33.748 2018 0.000 0.67 0.674 36.399 36.399 35.704 2019 0.000 0.67 0.674 38.467 38.467 37.771 2020 0.000 0.77 0.774 40.651 40.651 39.853 2021 0.000 0.67 0.674 42.960 42.960 42.262 2022 0.000 0.82 0.824 45.400 45.400 44.552 2023 0.000 0.82 0.818 47.978 47.978 47.128 2024 0.000 0.82 0.818 50.703 50.703 49.852 2025 0.000 0.82 0.818 53.583 53.583 52.732 2026 0.000 0.82 0.818 56.626 56.626 55.774 2027 0.000 0.92 0.918 59.842 59.842 58.890 2028 0.000 0.82 0.818 63.240 63.240 62.389 Net Present Value (US$ m) at 12%
0.440 4.616 5.214 268.537 268.537 263.323
BCR (PVB/PVC) 51.5 Source: Consultant’s estimate;; NPV, PVB and PVC are discounted present values (in US $m), in 2013 prices and value. PVB= Present Value Benefits; PVC= Present Value Costs
Operation and Management
On Operation and Management of the portal, 83% of the stakeholders also preferred Option 2 i.e. the portal should be owned and managed by a private company. This was followed by 14% of stakeholders who went for Option 1 (Stakeholder-owned private company) and a meagre 3% preferred Option 4 (Inter-governmental organisation).
Revenue Models From the study team’s experience in e-Freight, it can be informed that the main barrier for the successful take up of online freight trading portals or market places is the drastic change imposed into the current practices. The way industry works is that the shippers/cargo owners produce long to mid-term plans (e.g. 3 years) which are given to large freight forwarders to manage (e.g. FEDEX, DHL, etc.). Freight forwarders arrange capacity agreements with carriers to match the long-term shipper plans and then activate bookings as needed. In general there are the two types of financial revenue models that can be adopted for e-freightex:
Subscription Model; and
Fee Based Model

Final report: Feasibility study on the establishment of an online portal
for trading in freight services (e-freightex) in East Africa
E8073-UQ 12
For the purposes of this feasibility study the consultants have followed the predominant model in the industry and chosen to follow a subscription model rather than one based on transaction fees.

Final report: Feasibility study on the establishment of an online portal
for trading in freight services (e-freightex) in East Africa
!
E8073-UQ 13
1. INTRODUCTION
1.1 Commissioned Project
TradeMark East Africa (TMEA) commissioned Upper Quartile (UQ) to carry a feasibility study on the establishment of an online portal for trading in freight services (e-freightex) in East Africa in March 2013. Along with setting out a number of specific tasks to successfully achieve the outputs of this study, the study’s Terms of Reference (ToR) also set out a challenging timeframe to achieve the same. The whole study was aimed to be finished in circa fourteen weeks starting from end March/beginning of April 2013.
1.2 Project Background
A freight exchange (e-freightex) is an online service for freight carriers, logistics providers, freight forwarders and related service providers. It allows transport companies and other service providers to search for freight, and freight forwarders/logistics providers/shippers to offer freight to be transported, handled, warehoused or serviced. Freight exchanges make it easier for forwarders and shippers with large cargo loads that may not be handled by one carrier to advertise their freight either privately or publicly to a large number of freight operators looking for loads. Similarly they allow freight operators to offer vehicle space to small scale cargo holders cannot afford a full truck load. Freight exchanges provide a platform for network wide collaboration e.g. enabling service providers or their associations to communicate freight traffic information to fellow operators or, in case of associations, their members. Online systems are normally subscription-based with a small charge for advertising (posting) and searching (consulting).
Discussions on the development of an e-freightex online portal in East Africa have been ongoing since 2005. While regional stakeholder groups have indicated broad support for the concept, capacity constraints have meant that there has been limited partner activity in this area in the period. However, more recently, renewed interest in the concept has been intimated to TMEA from private sector organisations and through the two corridor authorities in the region. It is within this context that TMEA has agreed to support the development and implementation of an e-freightex portal.
The commissioning of this study to assess the feasibility of the concept can be viewed as a major step in taking this support forward. The outputs of the feasibility study were assumed to be a key strategic resource to guide future decisions on the costs, specification, and implementation of the finalised e-freightex solution. As such, the outputs of the feasibility study would play a key role in ensuring that TMEA, regional stakeholders, and the wider economy gains the maximum potential benefits and improved linkages from the implementation of the e-freightex portal. Some of the potential benefits perceived for the e-freightex include:
• Improved market information and increased competition; • Reduced administrative outlay and logistics costs; • Increased truck load factors and shortened turnaround times thereby reducing
transport costs and increasing operators’ profits and investment (See sections 3.5 and 3.6);
• Improved freight services such as insurance, IT solutions, agency/representation, brokerage, market intelligence etc.; and
Final report: Feasibility study on the establishment of an online portal
for trading in freight services (e-freightex) in East Africa
E8073-UQ 14
brokerage, market intelligence etc.; and Information dissemination.
1.3 Project Objectives
The objective of the study is twofold:
To carry out scoping and appraisal work for the development of an online portal for trading in freight services in East Africa; and
To propose appropriate interventions for its implementation. TMEA also regarded that the study will also help to elicit questions such as whether there is enough demand for such a service and why some private sector attempts failed in developing the online portal.
1.4 Failed Attempts
As set out above discussions on developing an e-freightex portal have been going on since around 2005. In February 2006, three leading industry organisations (KIFWA, KTA and KAM), the Northern Corridor’s Authority (TTCA) and a supporting team of specialists from USAID East Africa’s Trade Hub programme held consultations to discuss ways of establishing an online B2B platform (e-freightex) to support e- commerce in freight services in East Africa. Although the promoters reached a loose agreement to promote the initiative but, due to limited capacity, could not take the idea forward beyond that stage. No other major developments have taken place in this area except one or two failed attempts by private entrepreneurs. During the course of the study, the study team met one of those entrepreneurs and sought his views on the project and the reasons for the previous failed attempt. The three key reasons that the concept could not take off beyond a certain point are as follows:
Technology constraint, including e.g. the lack of advancement in information technology in the region ten years back. It should also be noted that, in real terms, the same was also quite expensive to adopt then;
Lack of understanding and vision as the private entrepreneur was unable to make the key stakeholders understand and appreciate the project concept including its potential benefits; and finally
Lack of enthusiasm and support shown by the stakeholders.
1.5 Study Work Plan
To achieve the objectives of the study, UQ developed a work plan comprising the following high-level tasks:
Mobilization and Inception; Inception Workshop; Stakeholder’s Consultation Workshops; Progress Report; E-Freightex Feasibility Analysis; Draft Final Report;

Final report: Feasibility study on the establishment of an online portal
for trading in freight services (e-freightex) in East Africa
! ! ! !
E8073-UQ 15
• Final Report.
1.6 Structure of the Draft Report
The reminder of this report is structured as follows:
• Section 2 presents different types of e-freightex portals and sets out key challenges and issues of developing such projects;
• Section 3 provides a snapshot of East Africa’s trade;
• Section 4 details out outcomes of inception workshop and stakeholders’ workshops;
• Section 5 sets out optinoneering exercise undertaken for the four types of e-freightex portals;
• Section 6 presents detailed information on e-freightex design including information on BPM “As is” and “To be”;
• Section 7 presents the value for money case of the project including potential options on management, operation and regulation of the e-freightex portal; and finally
• Section 8 sets out conclusions and recommendations of the study.

Final report: Feasibility study on the establishment of an online portal
for trading in freight services (e-freightex) in East Africa
E8073-UQ 16
2. E-FREIGHTEX MARKET
2.1 Introduction A freight exchange (freightex) is a real-time service where:
Transporters, freight forwarders, shipping agents and rail road operators etc. can list the availability of capacity to transport loads via several modes of transport;
Load providers who have a requirement to transport goods to a consignee can add/list loads, freight and cargo to the system, providing the opportunity for transport providers to make offers or bid on the listing, providing competitive pricing to Load providers;
Freight exchanges (freightex) provide a platform that allows carriers to communicate freight traffic information to other operators;
Freight can be advertised privately or publicly to participants that are looking for loads, and vehicle space can be advertised to participants looking to make shipments;
Vehicle operators add vehicles to the system that are available to transport a load; and
Load providers add loads, freight and cargo to the system that are looking for a vehicle to move the goods.
2.2 Types of E-Freightex's For the purposes of this study UQ identified four types of e-freightex solutions, of increasing complexity:
2.2.1 Type 1: Quotation Engine E-Freightex This is the simplest type of e-freightex that acts as a freight shipping quotation engine and allows buyers to find sellers e.g. e-Freight1 (US).
The key features of this type of freightex include:
Price comparison is available to all participants for a range of destinations and for a range of services (e.g. driver assistance, hazardous materials, time/date restrictions, Full truck load (FTL) vs Less-than truck load (LTL), etc.);
Multiple carriers can provide quotation algorithms for their standard shipping rates to/from a range of destinations (e.g. freight terminals etc.) or based on distance etc.; and
Shippers are presented with a range of carrier options and must establish contact and negotiate with carriers (or book shipment via the Freightex).
Perceived benefits of this type of freightex include:
Improved market awareness of carrier shipping rates;
Reduces barriers to entry for new market participants;
1 http://www.efreight.com/
Final report: Feasibility study on the establishment of an online portal
for trading in freight services (e-freightex) in East Africa
E8073-UQ 17
Improved market efficiency regarding FTL/LTL loads;
Replaces manual estimation with automated shipping quotes; and
Likely to reduce effective shipping costs.
2.2.2 Type 2: Matching Engine E-Freightex This is a more complex freightex type that provides a matching service i.e. allows buyers and sellers to find each other. Examples include RightNowLoads2 (US) or Teleroute3 (EU).
The key features of this type of freightex include:
Carriers can enter specific space availability details for specific journeys (origin -> destination) with specific truck types and/or other restrictions;
Carriers can search for "backhaul" (return) loads as well as outbound; and
When matched with a load, carriers can bid on the load. Carriers and shippers need to contact each other to negotiate and agree terms.
Perceived benefits of this type of freightex (over and above Type 1 freightex) include:
Matching service proactively alerts carriers to load opportunities;
Freightex holds more accurate information regarding freight movements;
Enables route planning by carriers;
Simplifies process for bespoke pricing on specific journeys or for loads with specific requirements; and
Supports more open communication between shippers and carriers by providing a single hub for interactions.
2.2.3 Type 3: Matching Engine E-Freightex with Aggregate Reporting This is basically a Type 2 Freightex but with additional aggregate reporting services e.g. 123Loadboard4. The relatively simple statistics presented on this type are useful confidence-building numbers to encourage new participants to use the Freightex. In addition to this, it is also possible to include a richer set of statistics (popular destinations, total mileage, load types, etc.), which would be useful for all participants in gauging the success and usefulness of the Freightex.
Perceived benefits of this type of freightex (over and above Type 2 freightex) include:
Provision of statistics builds confidence for new participants and demonstrates that the Freightex is being used; and
2 http://www.rightnowloads.com/search.php?one=IL&two=FL&Submit2.x=66&Submit2.y=17&Submit2=Submit 3 http://freights.teleroute.com/#/from/Great-Britain/to/Great-Britain 4 http://www.123loadboard.com/signup/how-it-works/stats.aspx

Final report: Feasibility study on the establishment of an online portal
for trading in freight services (e-freightex) in East Africa
E8073-UQ 18
Stats can be used to support aggregate reporting of freight activity across the area covered by the Freightex.
It should be noted that as a Type 3 e-freightex matures towards becoming a Type 4 e-freightex (See Section 2.2.4), it is common to see additional features being added in accordance with operator’s and users’ needs/requirements/preferences – such as:
Multi-user accounts (e.g. GetLoaded5);
Participant ratings and "top rated" carriers etc.; and
Mobile apps for use by shippers and carriers to allow searches and matches to be performed "on the move".
2.2.4 Type 4: Mature Freightex with Advanced Features As a Type 3 freightex matures over time, it will evolve into a “Type 4” freightex. With usage and increasing user experience it can be expected that the operator and users will want to improve the utility of the freightex with a range of value-added features (e.g. GetLoaded6). Typical features of this type of mature freightex would include:
Integration with third-party Transportation Management System (TMS) solutions as well as simplified upload of load and truck availability via email, File Transfer Protocol (FTP) and other mechanisms;
Advertising for related services (common examples are invoice factoring, software, insurance, asset financing, routing solutions);
Built-in invoice factoring and payment clearance (e.g. Transite case study7);
Industry specialisms (Livestock8, Vehicle transport9); and
Multi-modal quotes (e.g. intermodal shipping quotes provided by Canadian rail operator CN10).
It should be noted that in the case of GetLoaded the features on offer to freightex users vary depending on their subscription level and include options for alerts, matching, directory entries, multi-load searches, routing and tolls information and a variety of other features. There are also a number of similar freightexs with active user communities/forums (e.g. Livestock Network11) where participants were able to discuss issues, ask peers for advice etc.
Perceived benefits of this type of freightex (over and above Type 3 freightex) include:
Supports development of the community of participants;
Provides opportunities for supporting industries to participate in success of Freightex;
Improves utility of Freightex service to participants; 5 http://www.getloaded.com/ 6 http://www.getloaded.com/ 7 http://transite.com/news/Pergo_casestudy.pdf 8 http://www.livestocknetwork.com/ 9 http://www.carloadusa.com/ 10 http://www.cn.ca/en/our-business/prices-tariffs-transit-times 11 http://www.livestocknetwork.com/
Final report: Feasibility study on the establishment of an online portal
for trading in freight services (e-freightex) in East Africa
E8073-UQ 19
Increases integration of Freightex with day-to-day freight operations; and
Provides opportunities to generate revenue from Freightex operation.
2.3 Synergies Between other platforms
2.3.1 Introduction A number of existing/proposed initiatives in East Africa (including those initiated by TMEA) were also reviewed briefly as part of this study. A description of a selected sample of these is provided below.
2.3.2 Single Window Information for Trade (SWIFT) The Single Window Information for Trade (SWIFT) is aimed to allow cross-border traders to access, apply for and submit regulatory documents, such as customs declarations, certificates of origin and applications for import/export permits, at a single location. Key initiatives include:
Tea Board of Kenya - TMEA signed an Memorandum of Understanding (MoU) with Tea Board of Kenya (TBK) in 2012 to develop an e-portal that would automate its business process, which touched on trade with regards to the application of various licenses and the workflow from initiation to the point where applications are either approved or rejected.
Rwanda Bureau of Standards - TMEA has also signed a Memorandum of Understanding (MoU) with the Rwanda Bureau of Standards (RBS) to provide an e-portal that would automate most of their internal processes with the exception of their laboratories as their had already purchased a separate system for this.
Expected results include: Increased Efficiency through time and cost savings;
Easier Access to standardised documents and other information at a single entry point; and
Increased compliance rates and reduces inaccurate documents.
Potential synergy areas with the e-freightex include:
Sharing of statistical and reporting information; and
Automated posting of load or contract opportunities to the e-freightex.
2.3.3 Transport Observatory The northern and central corridors are the primary transport networks linking the ports of Mombasa and Dar es Salaam to the landlocked countries of Uganda, Rwanda, South Sudan and Burundi. TMEA is supporting the corridor authorities to establish Transport Observatories (TOs) where collected data is analysed to map the various bottlenecks and identify the non-tariff barriers, with the aim of reducing transport-related costs. The delays identified by the TOs are analysed by cause, location, date and time, and parameters, such
Final report: Feasibility study on the establishment of an online portal
for trading in freight services (e-freightex) in East Africa
E8073-UQ 20
as direction of travel, nationality of vehicles and types of cargo. The information is disseminated to partner states of the East African Community (EAC) to inform policy and decision-making that will reduce transport related costs. Expected results include:
Policy makers and the business community will improve their knowledge of corridor performance; and
Potential shorter transport times at less costs.
Potential synergy areas with the e-freightex project include:
Sharing of statistical information regarding freight movements; and
Transport-related costs.
2.3.4 Integrated Border Management Integrated Border Management (IBM) is a concept for establishing collaboration in the management of borders among agencies responsible for border controls. The framework is an essential tool for ensuring that a One-Stop Border Post (OSBP) becomes operational immediately when construction is completed. The essence of an OSBP is not the infrastructure and facilities but implementation of one-stop controls. Traffic stops at one side of the border only, which makes it easier for traders, transporters and the public in general to cross from one country to another.
IBM gives border agencies an opportunity to modernize their services and build their institutional capacity while enjoying new infrastructure and facilities. It will improve management of individual agencies and their standing in the local community, and will enable them to contribute to the regional integration agenda. Expected results include:
30% reduction in clearance times for passengers and transit goods; and
Better transparency and accountability at cross-border operations.
Potential synergy areas with the e-freightex project include:
Sharing of statistical information regarding freight movements; and
Transport-related costs.
2.3.5 Other Freight Studies A number of freight logistics studies have been completed or currently being commissioned (including by TMEA) in the region. The aim of these studies varied from analysing freight logistics chains and related markets in East Africa to transport costs of moving containers etc. The following key studies were reviewed:
Analytical Comparative Transport Cost Study along the Northern Corridor Region, prepared by CPCS;
Corridor Diagnostic Study of the Northern and Central Corridors of East Africa, prepared by Nathan Associates;

Final report: Feasibility study on the establishment of an online portal
for trading in freight services (e-freightex) in East Africa
E8073-UQ 21
East Africa Freight Logistics Market Study, currently undertaken by CPCS;
Rwanda Integrated Trade Logistics Facilities Project, undertaken by Deloitte;
The ASSET Study by TMEA; and
Transport Prices and Costs in Africa, The World Bank.
Potential synergy areas with the commissioned e-freightex project include: freight logistics, Information dissemination, trade, transport-related costs etc.
2.4 Key Freight Project Issues and Challenges The study team sets out below key freight project issues, which involve multi-national stakeholders and policy changes at government level. It should be noted that the challenge of these issues is for countries and stakeholders to have an alignment of business processes with each other.
Stakeholder Identification and Needs Analysis – these systems need to be built with the needs of stakeholders in mind; if the wrong group of stakeholders is identified or their requirements not captured in sufficient detail then the project risks delivering functionality that is not required or that does not meet the needs of the participants.
Political Issues – Lack of co-operation and collaboration between countries, stakeholders, competitors and agencies. If these are lacking then the implementation of any kind of solutions that requires an integrated Business Process Model is a non-starter. For solutions to work there is an expectation to have consensus on ICT architecture, single template documents, base model for Business Processes and freight/logistics Government policies, regulations and legislations aligned between countries.
Competitors and Collaborative Working – Competitors are generally reluctant to share information relating to their business intelligence. Many feel that by collaborating via a portal/shared platform openly, they will expose their business intelligence about their business model, loads, type of contracts they undertake etc., and they will lose their competitive advantage. This issue must be considered when designing and presenting a draft ICT solution.
The Case for Change – there needs to be a compelling case for the reforms proposed by these systems. The following anecdote is taken from a case study on trade reform in Madagascar12, and could apply equally to public and private sector market participants: “Opposition to the reforms was widespread and came from many quarters. The private sector - resigned to the inefficiency and corruption in Customs - was reluctant to start paying the additional fees that the project would require and sceptical that such an ambitious and advanced solution would work in the Malagasy context. The 1,400-strong Customs service itself was also reluctant to change its
12 Kjartan Fjeldsted, 2009 Case study on trade reform in Madagascar, World Bank Publications

Final report: Feasibility study on the establishment of an online portal
for trading in freight services (e-freightex) in East Africa
E8073-UQ 22
ways. Wedded to the old way of doing things, many customs agents also had a vested interest in existing arrangements, which brought steady revenues under the table.”
Technology Adoption – Even at the most basic level these projects have all depended on the willingness of participants to adopt the technologies being made available. Ease of use and simplicity of integration with existing business processes are high on the priority list for ensuring that technologies are used (provided that political issues can be overcome). Providing ubiquitous access methods for users (browser vs application, mobile vs desktop) are increasingly important and of course the robustness and uptime associated with online systems needs to be at an appropriately high level of service.

Final report: Feasibility study on the establishment of an online portal
for trading in freight services (e-freightex) in East Africa
E8073-UQ 23
3. EAST AFRICA’S VOLUME AND TRADE DIRECTION
3.1 Trade Performance
East Africa’s total trade was estimated at US$37 billion in 2010, which was a fourfold increase (AACGR13 = 15% per annum) from the US$8.8 billion traded in 200014. Trade in 2010 was worth 47% of East Africa’s GDP, compared with 28% in 2000. The US$11.1 billion of East African exports in 2010 were predominantly from Kenya (US$5.2 billion/47%) and Tanzania (US$3.9 billion/36%). Kenya also accounted for 44% of the US$27 billion15 in imports, while Tanzania’s import share was 29% in 2010.
3.2 Top Exports and Imports
In 2010, the combined total of each of the five (Kenya, Tanzania, Uganda, Rwanda and Burundi) East African country’s top three exports was US$3.92 billion/36% of the region’s total exports. Agricultural products (tea, coffee, flowers, fish, tobacco and cashews) accounted for the majority of this, estimated to be US$2.7 billion of the top three exports. The balance US$1.2 billion of top three exports (as shown in Table 1 below) is made up almost entirely of gold.
Table 1 – East Africa’s Top Three Export Products (in US$, 2010)
Country Top 1st Export Top 2nd Export Top 3rd Export
Tanzania Gold (914 million)
Tobacco (121 million)
Cashews (118 million)
Kenya Tea (1.2 billion)
Cut flowers (312 million)
Coffee (150 million)
Uganda Coffee (283 million)
Fish and fish products (127 million)
Cellular telephones (79 million)
Rwanda Tin Ores (66 million)
Coffee (57 million)
Tea (34 million)
Burundi Coffee (275 million)
Gold (164 million)
Tea (23 million)
Source: The State of East Africa 2012, Society for International Development (SID)
The combined total of each of the five (Kenya, Tanzania, Uganda, Rwanda and Burundi) East African country’s top three imports was valued at US$6.5 billion (59% of total imports) in 2010. The major import categories were petroleum and related products (US$1.8 billion), vehicles and transport equipment (US$1.4 billion) and machinery (US$1.07 billion).
13 AACGR= Annual Average Compound Growth Rate 14 The State of East Africa 2012, Society for International Development (SID) 15 Numbers may not add up due to informal trade.
Final report: Feasibility study on the establishment of an online portal
for trading in freight services (e-freightex) in East Africa
E8073-UQ 24
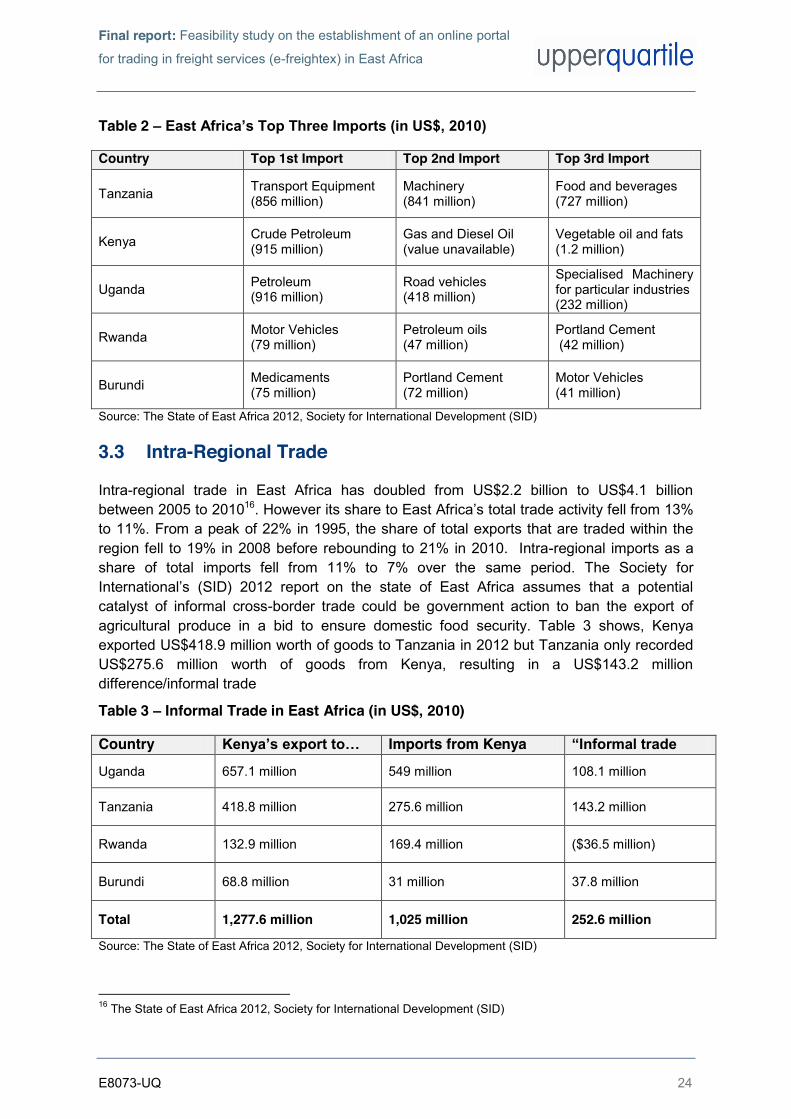
Table 2 – East Africa’s Top Three Imports (in US$, 2010)
Country Top 1st Import Top 2nd Import Top 3rd Import
Tanzania Transport Equipment (856 million)
Machinery (841 million)
Food and beverages (727 million)
Kenya Crude Petroleum (915 million)
Gas and Diesel Oil (value unavailable)
Vegetable oil and fats (1.2 million)
Uganda Petroleum (916 million)
Road vehicles (418 million)
Specialised Machinery for particular industries (232 million)
Rwanda Motor Vehicles (79 million)
Petroleum oils (47 million)
Portland Cement (42 million)
Burundi Medicaments (75 million)
Portland Cement (72 million)
Motor Vehicles (41 million)
Source: The State of East Africa 2012, Society for International Development (SID)
3.3 Intra-Regional Trade
Intra-regional trade in East Africa has doubled from US$2.2 billion to US$4.1 billion between 2005 to 201016. However its share to East Africa’s total trade activity fell from 13% to 11%. From a peak of 22% in 1995, the share of total exports that are traded within the region fell to 19% in 2008 before rebounding to 21% in 2010. Intra-regional imports as a share of total imports fell from 11% to 7% over the same period. The Society for International’s (SID) 2012 report on the state of East Africa assumes that a potential catalyst of informal cross-border trade could be government action to ban the export of agricultural produce in a bid to ensure domestic food security. Table 3 shows, Kenya exported US$418.9 million worth of goods to Tanzania in 2012 but Tanzania only recorded US$275.6 million worth of goods from Kenya, resulting in a US$143.2 million difference/informal trade
Table 3 – Informal Trade in East Africa (in US$, 2010)
Country Kenya’s export to… Imports from Kenya “Informal trade
Uganda 657.1 million 549 million 108.1 million
Tanzania 418.8 million 275.6 million 143.2 million
Rwanda 132.9 million 169.4 million ($36.5 million)
Burundi 68.8 million 31 million 37.8 million
Total 1,277.6 million 1,025 million 252.6 million
Source: The State of East Africa 2012, Society for International Development (SID)
16 The State of East Africa 2012, Society for International Development (SID)
Final report: Feasibility study on the establishment of an online portal
for trading in freight services (e-freightex) in East Africa
E8073-UQ 25
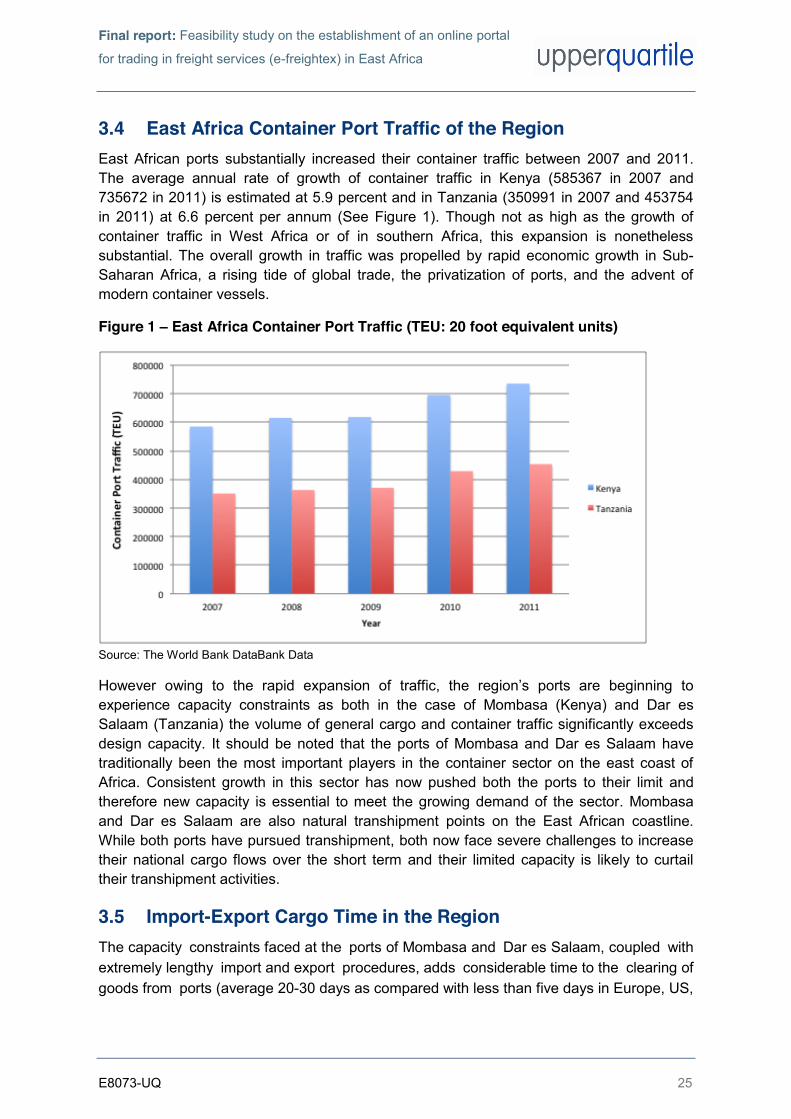
3.4 East Africa Container Port Traffic of the Region East African ports substantially increased their container traffic between 2007 and 2011. The average annual rate of growth of container traffic in Kenya (585367 in 2007 and 735672 in 2011) is estimated at 5.9 percent and in Tanzania (350991 in 2007 and 453754 in 2011) at 6.6 percent per annum (See Figure 1). Though not as high as the growth of container traffic in West Africa or of in southern Africa, this expansion is nonetheless substantial. The overall growth in traffic was propelled by rapid economic growth in Sub-Saharan Africa, a rising tide of global trade, the privatization of ports, and the advent of modern container vessels.
Figure 1 – East Africa Container Port Traffic (TEU: 20 foot equivalent units)
Source: The World Bank DataBank Data
However owing to the rapid expansion of traffic, the region’s ports are beginning to experience capacity constraints as both in the case of Mombasa (Kenya) and Dar es Salaam (Tanzania) the volume of general cargo and container traffic significantly exceeds design capacity. It should be noted that the ports of Mombasa and Dar es Salaam have traditionally been the most important players in the container sector on the east coast of Africa. Consistent growth in this sector has now pushed both the ports to their limit and therefore new capacity is essential to meet the growing demand of the sector. Mombasa and Dar es Salaam are also natural transhipment points on the East African coastline. While both ports have pursued transhipment, both now face severe challenges to increase their national cargo flows over the short term and their limited capacity is likely to curtail their transhipment activities.
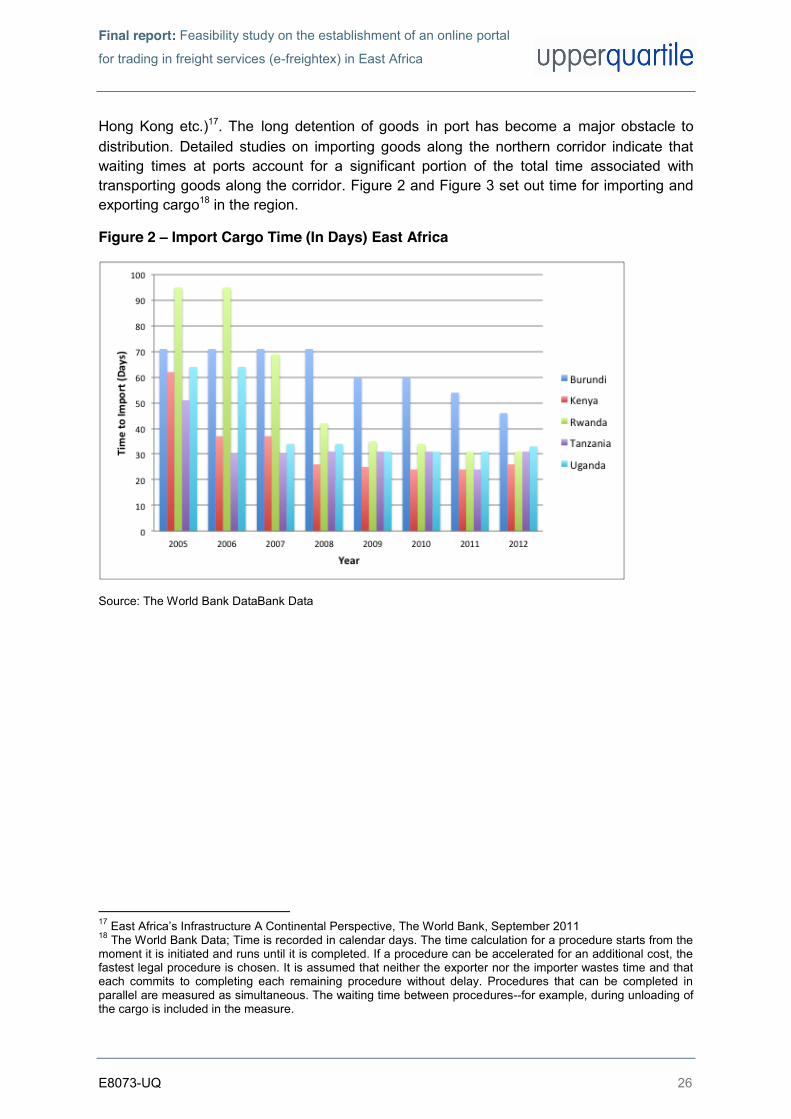
3.5 Import-Export Cargo Time in the Region The capacity constraints faced at the ports of Mombasa and Dar es Salaam, coupled with extremely lengthy import and export procedures, adds considerable time to the clearing of goods from ports (average 20-30 days as compared with less than five days in Europe, US,
Final report: Feasibility study on the establishment of an online portal
for trading in freight services (e-freightex) in East Africa
E8073-UQ 26
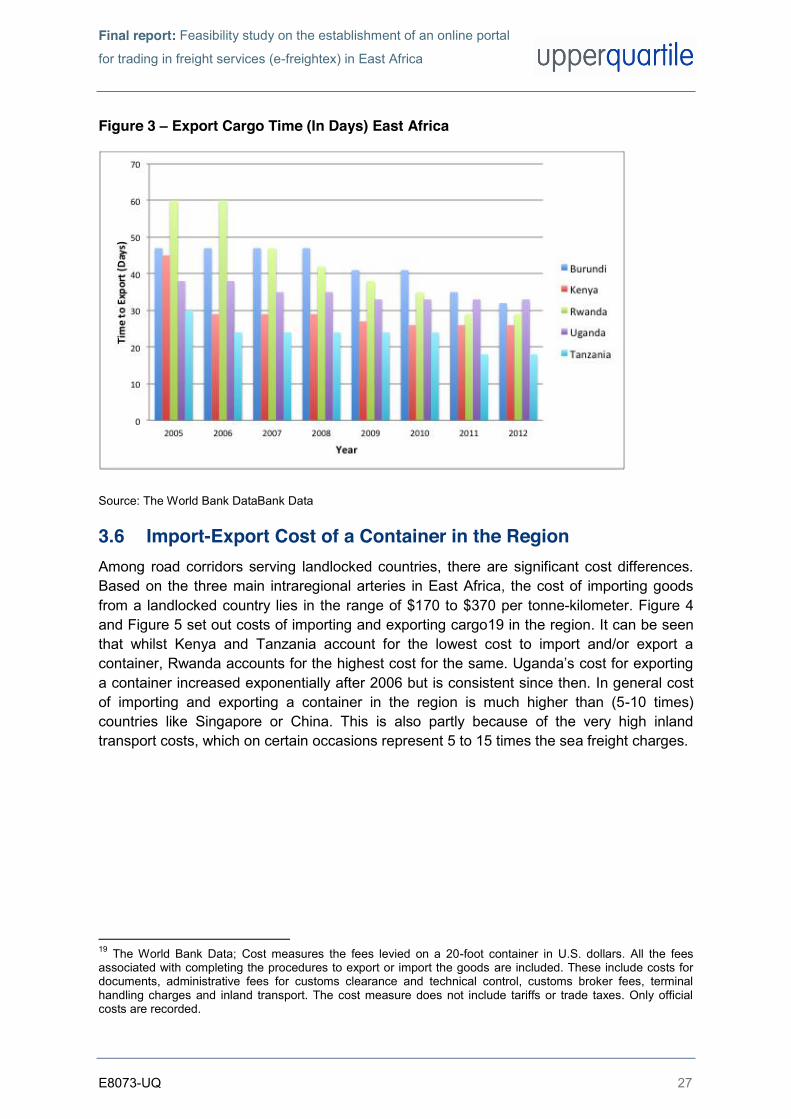
Hong Kong etc.)17. The long detention of goods in port has become a major obstacle to distribution. Detailed studies on importing goods along the northern corridor indicate that waiting times at ports account for a significant portion of the total time associated with transporting goods along the corridor. Figure 2 and Figure 3 set out time for importing and exporting cargo18 in the region.
Figure 2 – Import Cargo Time (In Days) East Africa
Source: The World Bank DataBank Data
17 East Africa’s Infrastructure A Continental Perspective, The World Bank, September 2011 18 The World Bank Data; Time is recorded in calendar days. The time calculation for a procedure starts from the moment it is initiated and runs until it is completed. If a procedure can be accelerated for an additional cost, the fastest legal procedure is chosen. It is assumed that neither the exporter nor the importer wastes time and that each commits to completing each remaining procedure without delay. Procedures that can be completed in parallel are measured as simultaneous. The waiting time between procedures--for example, during unloading of the cargo is included in the measure.
Final report: Feasibility study on the establishment of an online portal
for trading in freight services (e-freightex) in East Africa
E8073-UQ 27
Figure 3 – Export Cargo Time (In Days) East Africa
Source: The World Bank DataBank Data
3.6 Import-Export Cost of a Container in the Region Among road corridors serving landlocked countries, there are significant cost differences. Based on the three main intraregional arteries in East Africa, the cost of importing goods from a landlocked country lies in the range of $170 to $370 per tonne-kilometer. Figure 4 and Figure 5 set out costs of importing and exporting cargo19 in the region. It can be seen that whilst Kenya and Tanzania account for the lowest cost to import and/or export a container, Rwanda accounts for the highest cost for the same. Uganda’s cost for exporting a container increased exponentially after 2006 but is consistent since then. In general cost of importing and exporting a container in the region is much higher than (5-10 times) countries like Singapore or China. This is also partly because of the very high inland transport costs, which on certain occasions represent 5 to 15 times the sea freight charges.
19 The World Bank Data; Cost measures the fees levied on a 20-foot container in U.S. dollars. All the fees associated with completing the procedures to export or import the goods are included. These include costs for documents, administrative fees for customs clearance and technical control, customs broker fees, terminal handling charges and inland transport. The cost measure does not include tariffs or trade taxes. Only official costs are recorded.

Final report: Feasibility study on the establishment of an online portal
for trading in freight services (e-freightex) in East Africa
E8073-UQ 28
Figure 4 – Import Cost (US$ per container) of Cargo in East Africa
Source: The World Bank DataBank Data
Figure 5 – Export Cost (US$ per container) of Cargo in East Africa
Source: The World Bank DataBank Data
Final report: Feasibility study on the establishment of an online portal
for trading in freight services (e-freightex) in East Africa
E8073-UQ 29
3.7 Freight Distribution A recently completed report on the East African trade and transport facilitation project sets out that the roads mode dominates the freight distribution in the East African region by carrying 80% of the regional ton-km. Pipelines carry 10%, which is followed by rail (8%) and air transport (2%).
On the rail side, the Tanzania Ports Authority’s 2009-10 Annual Report sets out that the poor performance of the two railway lines TRL (Tanzania Railway Limited) and TAZARA (Tanzania Zambia Railway Authority) had an adverse impact on the port’s overall performance. It sets out further that the percentage of container traffic handled by the rail as compared with road fell from 10% in 2008 to a 0.05% in 2009 even though it is expensive to send a container (long destined cargo) by road when compared with rail. Similar views were also echoed by Kenya Ports Authority, which sets out that there is poor off take by rail at Mombasa port and that the rail handles only 6% of the total containers handled at its container terminal.
For the pipelines freight, the major concern for the region and especially the land-locked countries has been security of supply of petroleum products, fuel prices and capacity of product transportation/distribution infrastructure. East and Central African countries are net importers of petroleum products i.e. refined petroleum products and crude oil processed at the Kenya Petroleum Refinery Ltd. The transportation/distribution of petroleum products in the region is by a network of the pipeline, railway, roads and (previously) lake transport systems. Out of these, the existing pipeline system in the region transports over 90% of the petroleum products consumed in Kenya and about 80% of the petroleum products consumed by the neighbouring countries of Uganda, Rwanda, Burundi, Northern Tanzania, Eastern DRC and Southern Sudan. The current pipeline system has experienced capacity constraints, which has led to oil marketers uplifting their products at Mombasa/Nairobi using the more costly road and rail options.
The bulk of the region’s air cargo traffic is handled by Kenya followed by smaller volumes by Tanzania and Uganda. Europe is the primary destination for the air cargo. Primary exports are counter-seasonal flowers and perishables, with relatively little return cargo. Kenya is a large exporter of flowers to the Netherlands; Nairobi is one of the three main airports in the region that handles air cargo traffic. In addition to exporting cut flowers, it handles strong domestic demand for imports shipped via air. Demand for Kenyan flowers is increasing, which has encouraged new entrants to the market, including Rwanda and Uganda. Seafood comprises the bulk of Tanzania’s exports to the European Union. Around two-thirds of the West Nile perch catch are shipped fresh by air. The fish are caught by fisherman as well as commercial fishing operations and then transferred via air to Mwanza or Nairobi.
Final report: Feasibility study on the establishment of an online portal
for trading in freight services (e-freightex) in East Africa
E8073-UQ 30
4. WORKSHOPS AND STAKEHOLDERS’ CONSULTATIONS OUTCOMES
4.1 Inception Workshop
4.1.1 General The project’s inception workshop was held in Kenya (Mombasa) on 22 April 2013. The key purpose of the workshop was to raise awareness of the objectives and requirements of the project and to secure the buy-in of strategic stakeholders to support the study research and delivery. The following issues were discussed:
Background and Context – The study team introduced the study to the potential audience by providing them information on the background of the project. This discussion was aimed to ensure a mutual understanding between the consultant team and strategic stakeholders so that our work meets their needs.
Methodological Approach – The study team also discussed its proposed approach to delivering the project successful; and sought support from strategic stakeholders to identify and access relevant data and documentation.
In general the workshop was well received by the audience.
4.1.2 Key Outcomes of the Inception Workshop The key outcomes of the workshops were:
To establish a Focus Group for the study;
To identify key stakeholders for project’s stakeholders’ consultation process;; and
Finalisation of the programme for stakeholders’ consultation.
The Focus Group (See Annex 1) was selected to give as broad a range as possible of people who are in some way concerned with the associated issues of the project. Due to the tight time schedule of this project, it was conveyed that it might not be possible for the Focus Group to meet more than once during the course of the project. However the project team would keep them informed about the progress of the project via emails and telephone calls. Table 4 sets out the programme for stakeholders’ consultation process.

Final report: Feasibility study on the establishment of an online portal
for trading in freight services (e-freightex) in East Africa
E8073-UQ 31
Table 4 – Programme for Stakeholders’ Consultation Workshop/s
Country/Town Date of Workshop
Venue/Schedule
Kenya (Pilot Workshop in Nairobi)
30 April 2013 9:00 am to 1:00 pm at Southern Sun Hotel in Nairobi
Kenya (Workshop in Mombasa)
2 May 2013 8:30 am to 1:00 pm at Whitesands Sarova Hotel in Mombasa
Rwanda (Workshop in Kigali)
2 May 2013 8:30 am to 1:00 pm at Hotel Mille Collines Hotel in Kigali
Tanzania (Workshop in Dar es Salam)
3 May 2013 9:00 am to 1:00 pm at Southern Sun Hotel in Dar es Salaam
Burundi (Workshop in Bujumbura)
3 May 2013 9:00 am to 1:00 pm at Roca Golf Hotel in Bujumbura
Uganda (Workshop in Kampala)
6 May 2013 9:00 am to 1:00 pm at Sheraton Hotel in Kampala
South Sudan 8 May 2013 Phone Interview/s
4.2 Stakeholders’ Consultation Workshops
4.2.1 Selection of E-Freightex Type In line with Section 2, the participants were presented with 4 types based on the complexity of a freight exchange:
Type 1 – Quotation engine, simplest form of freight exchange, allows buyers to find sellers (generally regarded by participants as too simplistic);
Type 2 – Matching engine to allow buyers and sellers to find each other; Type 3 – As Type 2, with additional aggregate reporting services; and Type 4 – As Type 3, with additional value-added features (generally regarded by
participants as a good “end goal” but likely more complex than necessary to derive the key benefits of the freight exchange concept)
During the stakeholders’ consultation stage, 83.5% of the total stakeholders of the region (circa 50 in total) preferred Type 3 to be taken forward to the next stage of the study; followed by 12.5% showing preference for Type 4; and the remaining 5% voting for Type 1 e-freightex system. The decision can be attributed to the following reasons:
It provides all the services of matching while “keeping it simple” during the period of introduction as the market gets used to the opportunities provided by the freight exchange;

Final report: Feasibility study on the establishment of an online portal
for trading in freight services (e-freightex) in East Africa
E8073-UQ 32
It provides the aggregate market reporting that will improve the visibility of market information to all users – hence preferred to Type 2, which did not include these reports; and
It allows for the users to determine and prioritise future enhancements.
4.2.2 Expected Impacts of E-Freightex Portal When stakeholders were asked that what percentage of transport costs20 reduction do they envisage the e-freightex portal can generate; 73.9% of those who voted thought it could reduce the transport costs by 5%; 21.7% thought that the development of e-freightex portal could reduce the transport costs by 10%; and the remaining 4.4% thought the costs savings will be higher than 10%. The stakeholders also voiced their opinion on some other beneficial impacts that may include:
Increased competition;
Reducing the cost of shipping;
Reducing administration cost;
Small carrier can have access to more business and large contracts;
Larger shippers can get better rates and hence deliver cheaper goods and services to their end user customers and become more competitive on a global scale;
Optimizing capacity, by reducing voids on return journey;
More routes being serviced more frequently, shipping goods faster, reducing the loss of perishable goods; and
Increased timely deliveries.
4.2.3 Operation and Management of E-Freightex Portal The stakeholders were presented with the following four potential ownership and management options and were asked to vote for their preferred option:
Option 1: Stakeholder-owned private company - A private company owned by representatives from the region and company ownership will comprise of key stakeholders from the region including the revenue authorities, the importers, the EAC and forwarding agents (for profit);
Option 2: Outsourced to a private operator, with an oversight committee - A private operator run the e-freightex for profit but under oversight committee or board comprised of stakeholders (for profit);
Option 3: EAC Secretariat - EAC through an appointed committee would operate after being set up by a private company (Not for profit but self sustainable); and
Option 4: Inter-governmental organisation - Similar to the EAC owned and operated model but would involve government ownership where representatives
20 Transport costs were defined as a sum total of Fixed Costs (which includes, independently of vehicle usage, financing charges, depreciation of investment, wages, facilities, insurance, security, administrative overheads, taxes, profit margins etc.), Variable Costs (Fuel, subsistence, road user charges, occasional maintenance, tires, taxes etc.) and overheads (informal payments etc.).

Final report: Feasibility study on the establishment of an online portal
for trading in freight services (e-freightex) in East Africa
E8073-UQ 33
seconded by each of the EAC member states manage the company (Not for profit but self sustainable).
83% of the stakeholders who voted preferred Option 2 i.e. the portal should be owned and managed by a private company. This was followed by 14% of stakeholders who went for Option 1 and a meagre 3% preferred Option 4.
Additional feedback included:
There should be a global tender and the project should be awarded to the best company;
Some stakeholders (including those from outside Kenya) felt that the portal could be based in Nairobi as it has higher technological experience as compared with other countries;
Stake holders also agreed that the actual data center for the portal can be based anywhere on the globe but there should be a balance between data security and the hosting cost of the data centre;
If the Option 2 goes ahead then the private operator should also be made accountable to an oversight committee made up of stakeholders form across all countries of the EAC. However, oversight committee should have a very straightforward role and does not need offices in each country.
Most of the stakeholders also conveyed a message that they are willing to pay a membership fee for the potential portal. However the same should offer them at the very least a good value for money and quality of service.
4.3 Stakeholder Validation Workshop The project’s stakeholder validation workshop was held in Rwanda (Kigali) on 26 June 2013. The key objectives of the workshop were as follows:
Update stakeholders on the project’s progress up to the submission of the draft final report of the project;
Solicit feedback from the stakeholders including their comments on the draft report; Agreeing upon potential changes; and Validating the project.
The key outcome of the workshop was that the stakeholders, who turned up quite in numbers, showed a lot of interest and enthusiasm for the project. Most of the stakeholders were keen to get on with the project and were seen asking questions on the next stage of the project. Key comments and observations were also noted from the stakeholders and the same were addressed during the writing up of this report.
Final report: Feasibility study on the establishment of an online portal
for trading in freight services (e-freightex) in East Africa
E8073-UQ 34
5. OPTIONEERING
5.1 Introduction
This section sets out a preliminary appraisal of the proposed four types of e-freightexs (See Section 2). The assessment was designed to aid in the decision-making processes among the proposed types at this stage. Subsequently, a more complete Value for Money (VfM) analysis will be carried out for the preferred type of e-freightex.
5.2 Methodology
5.2.1 Overview A preliminary appraisal of each e-freightex type was designed to show the broad impacts of a range of criteria on them. The information derived from the exercise helped UQ and TMEA to identify the preferred type of e-freightex.
For the proposed e-freightexs types, the study team developed a matrix showing the ‘score’ of each type against a variety of criteria that could be useful in eliminating non-preferred types of e-freightex and selecting the preferred type of e-freightex. The following factors were considered when using this approach:
Since the scores are to be aggregated, we tried to arrange the ‘levels’ (e.g. Large Beneficial, Moderate Beneficial, Slight Beneficial, Neutral, Slight Adverse, Moderate Adverse, Large Adverse etc.) of each criterion in such a way that a given score for one criterion indicates the same order of importance as the same score for another;
The study team tried to avoid overlaps, i.e. where one criterion duplicates part of another; and most importantly
Since these assessments are inevitably subjective, it was born in mind that the robustness of the assessment system could only be improved if several people (with the relevant specialist knowledge) contributed to the process.
It should also be noted here that even after considering every possible factor for optioneering exercise, such a matrix, whilst being useful for sifting through types and for providing background information to go with the business case, could still not be used as a substitute for the business case of the preferred type. The same was subsequently addressed and a Value for Money section is presented in the latter part of this report.
5.2.2 Qualitative Assessment The qualitative assessment was designed to indicate the relative merits of the options considered. The methodology included the following steps:
Establishing the options/types of e-freightexs to be assessed;
Establishing the criteria to be assessed;
Designing the valuation system to be applied;
Assigning values to each criteria; and
Summarising and discussing outcomes.

Final report: Feasibility study on the establishment of an online portal
for trading in freight services (e-freightex) in East Africa
E8073-UQ 35
A qualitative assessment against fifteen (15) criteria was thus undertaken to illustrate the differences among the potential project options. As described above, this was only an initial assessment, based on little hard evidence, as the impacts had not been valued then. The four types of e-freightexs were assessed against the following criteria:
Environment;
Road Accidents;
Wider Economic Impacts (Jobs);
Capital Cost;
Sustainable;
Scalable;
Competitiveness;
Efficiency to Businesses;
Efficiency to Customers;
Market Information Availability;
Operating and Maintenance Cost;
Transport Costs;
Complexity;
Lead Time to Development; and
Commercial Disclosure.
Each type was valued for its impact on each criterion, on a system from -3 to +3. Scores could be interpreted as follows:
-3: Large Adverse;
-2: Moderate Adverse;
-1: Slight Adverse;
0: Neutral;
1: Slight Beneficial;
2: Moderate Beneficial;
3: Large Beneficial;
A matrix of option valuations as well as a summary of the relative ranking of the types to indicate any types that rank well according to many perspectives, and any that perform poorly is shown in Table 5 below.
Final report: Feasibility study on the establishment of an online portal
for trading in freight services (e-freightex) in East Africa
E8073-UQ 36
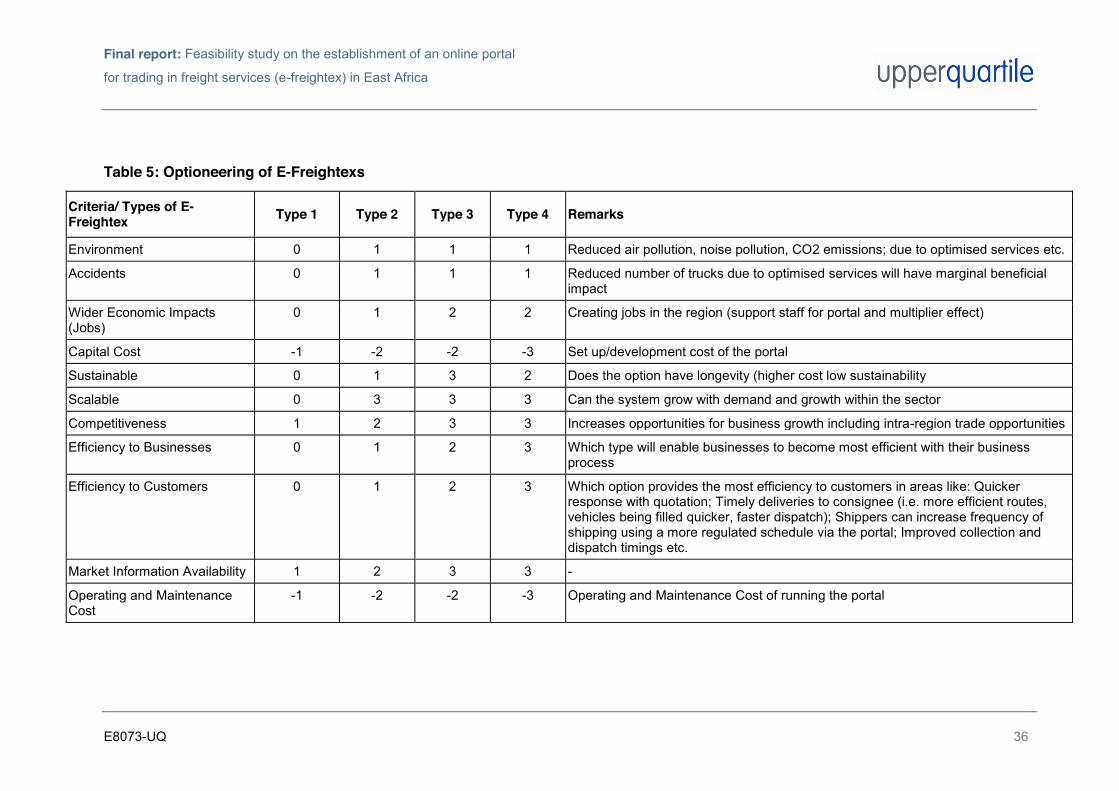
Table 5: Optioneering of E-Freightexs
Criteria/ Types of E-Freightex Type 1 Type 2 Type 3 Type 4 Remarks
Environment 0 1 1 1 Reduced air pollution, noise pollution, CO2 emissions; due to optimised services etc.
Accidents 0 1 1 1 Reduced number of trucks due to optimised services will have marginal beneficial impact
Wider Economic Impacts (Jobs)
0 1 2 2 Creating jobs in the region (support staff for portal and multiplier effect)
Capital Cost -1 -2 -2 -3 Set up/development cost of the portal
Sustainable 0 1 3 2 Does the option have longevity (higher cost low sustainability
Scalable 0 3 3 3 Can the system grow with demand and growth within the sector
Competitiveness 1 2 3 3 Increases opportunities for business growth including intra-region trade opportunities
Efficiency to Businesses 0 1 2 3 Which type will enable businesses to become most efficient with their business process
Efficiency to Customers 0 1 2 3 Which option provides the most efficiency to customers in areas like: Quicker response with quotation; Timely deliveries to consignee (i.e. more efficient routes, vehicles being filled quicker, faster dispatch); Shippers can increase frequency of shipping using a more regulated schedule via the portal; Improved collection and dispatch timings etc.
Market Information Availability 1 2 3 3 -
Operating and Maintenance Cost
-1 -2 -2 -3 Operating and Maintenance Cost of running the portal

Final report: Feasibility study on the establishment of an online portal
for trading in freight services (e-freightex) in East Africa
E8073-UQ 37
Criteria/ Types of E-Freightex Type 1 Type 2 Type 3 Type 4 Remarks
Transport Costs 0 2 2 2 Overall impact on reduction in transport costs, which is defined as sum total of Fixed Costs (which includes, independently of vehicle usage, financing charges, depreciation of investment, wages, facilities, insurance, security, administrative overheads, taxes, profit margins etc.), Variable Costs (Fuel, subsistence, road user charges, occasional maintenance, tires, taxes etc.) and overheads (informal payments etc.).
Complexity -1 -2 -2 -3 Requirement for it skills; Technology risk
Lead Time to Development -1 -2 -2 -3 Delivery of the e-freightex portal
Commercial disclosure -3 -1 -1 -1 Type 1 is most vulnerable because a user may log in and request a quote, he'll get all the commercial rates of any matching transport company i.e. which type places the user at most risk of disclosing business intelligence
Total -5 6 15 10 -
Rank 4 3 1 2 - Scoring Scale: 3 - Large Beneficial, 2 - Moderate Beneficial, 1 - Slight Beneficial, 0 – Neutral, -1 Slight Adverse, -2 – Moderate Adverse, -3 – Large adverse

Final report: Feasibility study on the establishment of an online portal
for trading in freight services (e-freightex) in East Africa
E8073-UQ 38
5.3 Outcome of Optioneering
UQ team with feedback from TMEA and stakeholders (obtained during and after the stakeholders’ consultation stage of the study) carried out an independent assessment to score the criteria. The feedback was sought not only to obtain a reasonable scoring consistency but also to improve credibility of the assessment. This helped us to make the case for choosing a stronger preferred type as we noticed stakeholders’ opinions within the region coincided well with each other.
Table 6 shows that Type 3 e-freightex (Matching Engine E-Freightex with Aggregate Reporting) is ranked first among the other types of e-freightexs; and is clearly the most preferred type of e-freightex. Therefore a clear message was given by the assessors to carry forward Type 3 e-freightex to the next stage of this feasibility study. The table also shows that there is little benefit of choosing Types 1, 2 and 4 over Type 3 e-freightex. In particular, we noticed that there are no major benefits of choosing Type 4 e-freightex over Type 3 e-freightex even though Type 4 e-freightex had more advanced features attached to it. This can be attributed to the fact that Type 4 e-freightex also had more complexity, higher costs, higher lead development time etc. attached to it. It should, however, be noted that although Type 4 is not recommended to be used by the stakeholders at this stage, but as the region embraces ICT and mobile technology (such as 3G etc.), TMEA could consider scalability to this type as a possibility in the future.
The above analysis is also supplemented by the stakeholders’ opinion on type of the e-freightex they would like to use in future i.e. during the stakeholders’ consultation stage, 83.5% of the total stakeholders of the region (circa 50 in total) preferred Type 3 to be taken forward to the next stage of the study; followed by 12.5% showing preference for Type 4; and the remaining 5% voting for Type 1 e-freightex system (See Section 4.2.1).

Final report: Feasibility study on the establishment of an online portal
for trading in freight services (e-freightex) in East Africa
E8073-UQ 39
6. DESIGN OF E-FREIGHTEX
6.1 Business Process Management (BPM) - As Is
Businesses within the EAC freight and logistics sector all seem to have business processes, which are chaotic, certainly at local level. When combined they are similar but it was difficult to identify a systematic approach or process for shippers and transporters to exchange business. However, international carriers and manufacturers as well as customs do have a systematic structure with a service-orientated architecture supporting their business processes.
The study team was also unable to identify any local transporter or shippers with an electronic backend system and process, which is ready to be integrated into an e-freightex portal which will improve automation at a level that will provide seamless integration, real time information and updates and optimal visibility. The only exception to this was DHL Logistics Tanzania. In Tanzania, there were reported to be 20 trucking companies out of 1000, which had some kind if fleet management system. Having said that all the stakeholders identified that the proposed online portal will provide a platform for them to increase their business immediately just by having an online presence within an online freight exchange environment. By increasing their market intelligence they can become more competitive and by reducing wasted capacity can also reduce transport costs.
The information gathered during the consultations provided a broad and very informative perspective on the processes followed within stakeholders sectors (see Annex 2 in Volume II of this report, which outlines the key processes identified at a macro level).
6.2 Solution Components for To-Be
Detailed tables have been set out in Annex 3 in Volume II of this report.
6.2.1 Key Requirements The To-Be processes were developed from anecdotal evidence gathered from the Stakeholder workshops, and provide a strong indication of the required scope of the e-Freightex at a feasibility study level. Based on the output from stakeholder workshops and our review of freight exchange implementations elsewhere around the world we identified a number of key priorities, which need to be addressed by the e-Freightex if it is developed:
Ensure security and privacy, along with incorporating feedback mechanisms so that users can see the reputation of other e-freightex users;
Mobile and web interaction with the e-freightex, ensuring sufficient features are included to encourage and support adoption by operators of all sizes;
Alerts when matching loads/trucks are listed; Aggregate reporting of system usage overall as a mechanism to help businesses
predict volume and plan business; Supportive knowledgebase materials; and
Final report: Feasibility study on the establishment of an online portal
for trading in freight services (e-freightex) in East Africa
E8073-UQ 40
Robust administration and hosting to ensure availability and drive perception of reliability.
During our stakeholder workshops the study team had identified 4 broad types of freight exchange (See Section 4.2.1) and the consensus opinion across all workshops mapped most closely to a “Type 3” freight exchange, with a number of added features.
6.2.2 Solution Components Taking into account the feedback from participants and the generic features of the “Type 3” model, we identified the following solution components, shown in the Figure 10 below:
Marketing website – front end website used for promotion and marketing of the e-freightex concept – may also include knowledgebase or FAQ area;
Sign-up – including vetting of signups; Payments – potential integration with online or offline payment for payment of
subscription fees, if charged; Directory & User management – allows management of users with accounts and
also allows accounts to indicate membership of relevant trade associations; Supplier listings management – allows suppliers (garages, parts, insurance,
accommodation) to register a listing on the freight exchange; Knowledgebase/planning zone – area for users to review FAQs, customs
procedures, other knowledgebase style items. Includes aggregate reports of freightex activity;
Contract, truck, load data entry – allows users to enter details to be searched by other users;
Matching engine – provides the ability for the users to search for and find relevant trucks, loads or contracts;
Alerts – sends alerts for “saved searches” to users;; Reporting tools – reports that allow users to query the e-freightex to access data
about their usage of the system; Bid processing – manages the bidding process when users are bidding for loads,
regardless of mode; Transaction processing – manages a transportation transaction once the bidding is
complete; Reputation & Feedback – manages user feedback on other users; and Administration tools – tools, reports and utilities for system administrators.
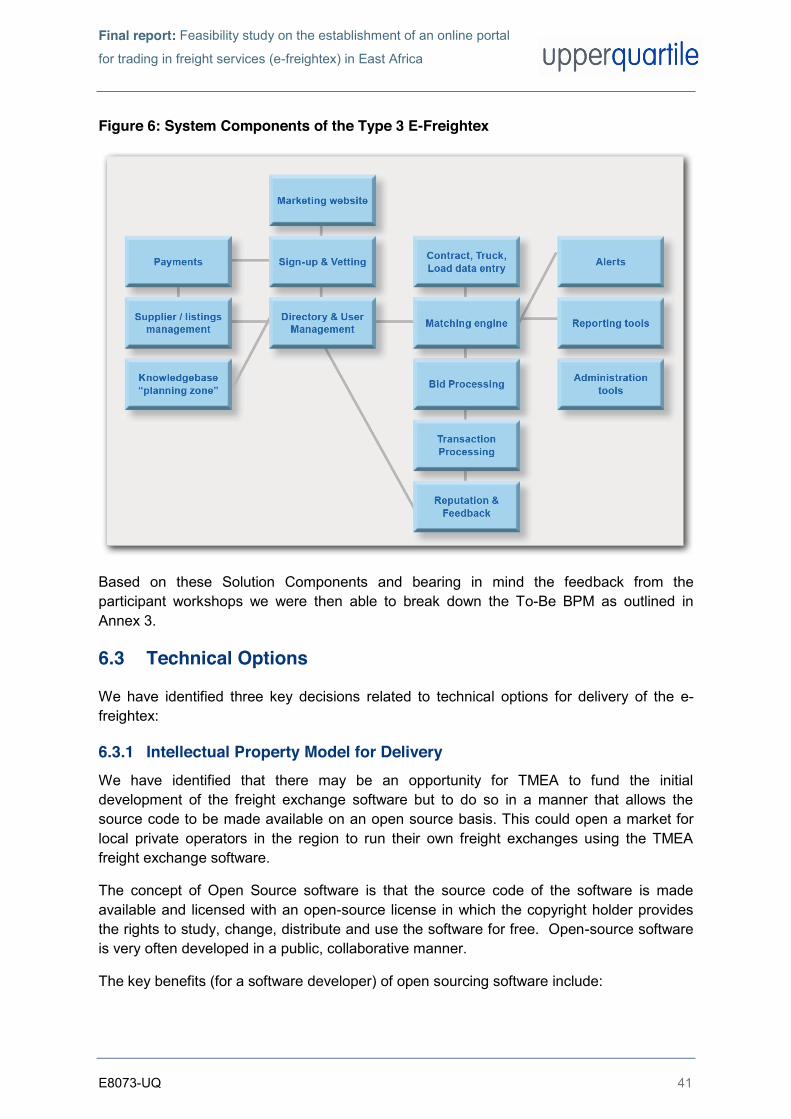
Final report: Feasibility study on the establishment of an online portal
for trading in freight services (e-freightex) in East Africa
E8073-UQ 41
Figure 6: System Components of the Type 3 E-Freightex
Based on these Solution Components and bearing in mind the feedback from the participant workshops we were then able to break down the To-Be BPM as outlined in Annex 3.
6.3 Technical Options
We have identified three key decisions related to technical options for delivery of the e-freightex:
6.3.1 Intellectual Property Model for Delivery We have identified that there may be an opportunity for TMEA to fund the initial development of the freight exchange software but to do so in a manner that allows the source code to be made available on an open source basis. This could open a market for local private operators in the region to run their own freight exchanges using the TMEA freight exchange software.
The concept of Open Source software is that the source code of the software is made available and licensed with an open-source license in which the copyright holder provides the rights to study, change, distribute and use the software for free. Open-source software is very often developed in a public, collaborative manner.
The key benefits (for a software developer) of open sourcing software include:
Final report: Feasibility study on the establishment of an online portal
for trading in freight services (e-freightex) in East Africa
E8073-UQ 42
It can be a good way for a business to increase the rate of adoption of their software, and can be a good way to promote the organisation;
With the software being available for free, the marketing and servicing costs are typically lower;
By developing the software in public and encouraging the contributions of third-party developers, the approach can accelerate the process of developing reliable and high-quality software; developers are empowered and have a sense of ownership of the product; and
With a larger pool of developers there is potential for more rapid innovation and it can be argued that the software may be more reliable because more developers will be independently working on the code and finding and fixing bugs.
There are of course drawbacks including:
Open source software may be more open to hackers because the source code is available and hence it is easier for them to find weaknesses in the code;
It can be challenging to design a commercially sound business model around open source software; and
Without leadership and a clear development and quality process, open source development can become chaotic.
There are at least three models that could be followed:
CLOSED SOURCE - following the “traditional” software development model would see the Operator (and/or Developer) retaining ownership of the code base for the e-freightex. This typically provides a greater degree of control but limits the opportunities to develop the market for freight exchanges by retaining the IP within a single organisation. Revenue typically comes from software sales or subscriptions.
FULLY OPEN SOURCED - an increasingly common model for software development, the source code is made openly available to developers who are free to extend it as required. Depending on the terms of the licensing model, developers may (or may not) be required to submit their changes back into the core code base. This typically increases the pace of development, provided that there is an active and supported community of developers working with the source code. A degree of control can be retained by ensuring that the “chaos” of open source development is managed by lead development team that takes responsibility for QA, merging changes into the core code base, etc. Revenue (if any) typically comes from provision of a “premium” version (which may have closed source elements) or paid-for support from the lead development team.
HYBRID MODEL - starting out with a closed- source model it would be possible to open-source the code base at a later point in the project lifecycle - for example, after 3 years. This approach would allow time for the concept of the freight exchange to be introduced to the industry in a controlled fashion (I.e. while being sponsored) but to be subsequently opened out to allow new market participants to run their own freight exchanges further down the line.
Recommendation: It is probably simpler in the medium term (2-5yrs) to work with a closed-source model. This possibly also fits better with the TMEA organisation.

Final report: Feasibility study on the establishment of an online portal
for trading in freight services (e-freightex) in East Africa
E8073-UQ 43
6.3.2 Deployment and Development Technology Choices
6.3.2.1 Deployment Technologies The assumption that appeared to have been made by all participants at the stakeholders’ consultation was that the e-freightex should not be delivered as software but as a web or mobile service. This makes sense given:
The wide variety and likely age of hardware/operating systems “in the wild” – Asycuda++ software, for example, is delivered as software at lowest common denominator technology platform and this clearly presents challenges for ongoing software support and development; hence Asycuda World is now web based; and
Adopting a web delivery model minimises the need for users to upgrade existing IT systems since existing internet connections and equipment with web browsing capability can continue to be used.
However, participants varied in their preferences regarding web vs mobile delivery:
All participants saw value in delivery for web and mobile platforms; but Approximately 25% of participants expressed a preference for “mobile first” while the
remainder preferred delivery of both desktop and mobile solutions.
There is a lot of coverage of the high adoption rate of mobile technology in Africa and a very common case study is M-Pesa, the mobile money service run by Safaricom, primarily in Kenya and Tanzania. The other EAC countries do not have the same level of adoption of mobile money although solutions similar to M-Pesa are being introduced under various brands across the region.
The demand from the participants for mobile services therefore needs to be taken in context:
Anecdotally, there is high demand for smartphones (Android is the dominant OS) although many smartphone owners we spoke to admitted to lacking the technical skills to be able to install and use apps effectively;
Part of the success of M-Pesa has been its ubiquity. M-Pesa does not require the mobile broadband (3G) capabilities that mobile apps would, and accordingly M-Pesa has been much easier to roll out in remote areas with limited mobile coverage (and to users with low-specification phones/contracts) – i.e. in the absence of 3G coverage, M-Pesa will continue to work with GSM network signal where an app would not. However, M-Pesa is implemented using Unstructured Supplementary Service Data (USSD) and SIM Application Toolkit (STK) technologies, requiring a secure app on the user’s SIM card, and hence cooperation with the telco operator would be essential in order to follow the same implementation approach; and
Participants indicated a wide variety of technical skills; for some organisations the introduction of the e-Freightex is unlikely to cause any technical problems or create any skills barriers. Other participants suggested that the e-Freightex would require them to install new hardware (PCs) and invest in training to ensure that users were able to use the system effectively.
Final report: Feasibility study on the establishment of an online portal
for trading in freight services (e-freightex) in East Africa
! ! ! !
E8073-UQ 44
The implications of this are therefore:
• Web-based delivery with an accompanying mobile element seems to be the appropriate direction to head in. The e-Freightex is likely to be accessed from equipment with a wide age profile and cross-browser compatibility will need to be a primary consideration;
• Mobile apps for the solution need to be built as Android apps first; other platforms are currently of secondary importance it seems. No distinction was really made by participants with respect to mobile web vs mobile apps so it may be appropriate to leave this point “open” as the technology matures in the region;
• There may be an argument that some aspects of mobile delivery should be implemented via SMS in order to avoid dependence on 3G coverage; and
• A mobile solution could be developed on USSD to avoid dependence on 3G, but cooperation of the network operators (e.g. Safaricom and others) would be required for implementation, which probably makes this route impractical.
6.3.2.2 Development Technologies In most respects, the chosen developer should be allowed to make their own choices in regards to the development technology to be used. Common options are likely to be:
• Windows platform (e.g. Windows Server, IIS, SQL Server, C#); • LAMP platform (e.g. Linux, Apache, MySQL, PHP); and • Java platform (e.g. Linux, Tomcat, Oracle, Java).
However there are numerous alternative technologies, which the developers may opt to use to develop the e-freightex, for example
• Hadoop, noSQL or other big data technologies; and • Ruby/Rails, Node.js, Python or other programming languages.
In the evaluation of developer submissions it is appropriate to consider all of these as valid choices. Without wishing to limit opportunities for innovation, it should however be borne in mind that the e-freightex is likely to be supporting a substantial proportion of the transportation industry of the region and accordingly the technology choices of the developer will at least need to be proven and stable to the extent that they can be depended on as a platform technology for the e-freightex in the foreseeable future.
Regardless of the development technology, it will be imperative that the e-freightex solution can scale in line with the requirements noted in the hosting section of this report.
Recommendation: The e-freightex needs to be delivered as a web application with a mobile component. Choice of development technology should be left to the developer.

Final report: Feasibility study on the establishment of an online portal
for trading in freight services (e-freightex) in East Africa
! ! ! !
E8073-UQ 45
6.3.3 Hosting
With respect to hosting options, the following applies:
• The selected model for ownership and management of the freightex may have a bearing on the hosting model selected;
• Current industry trend would suggest that the service should be hosted “in the cloud” to reduce up-front investment, provide flexibility for capacity (scalability), and reduce running costs. None of the large Cloud providers operate data centres in the region; and
• There may however be a political requirement to host in the region. However, local hosting options are restricted (and anecdotally, very expensive) due to lack of data centers (datacentermap.com lists 2 data centers in Nairobi although we have seen reports that MTN (telecom operator) has created a data center in Kampala) and we are aware that there is also a data center in Rwanda. Problems with power supply and other factors in both countries mean that local hosting may not be the most technically appropriate solution.
Likelihood therefore is that the solution is hosted in the cloud, the “nearest” (i.e. lowest latency) data centers of any major cloud vendor are probably those in EU. This places dependence on the internet connectivity into the region. This approach is consistent with that taken by many of the East African websites that the study team reviewed.
Figure 7: Global Internet connectivity from East Africa

Final report: Feasibility study on the establishment of an online portal
for trading in freight services (e-freightex) in East Africa
E8073-UQ 46
400 shippers creating a freight listing at least once a day 1600 transporters creating a truck listing at least once a week and searching on
average three times per day 400 suppliers of other services (e.g. accommodation) Likelihood is that after an initial surge, rate of growth in transaction volume is likely
to be relatively steady. There may be some seasonal spikes and some spikes associated with time of day but overall, system usage is likely to be fairly steady reflecting the 24x7 nature of the industry.
Our assumptions were applied to a basic model to calculate likely transaction volume (where a “transaction” is defined as an iteration of a single process from the to-be BPM documentation.
Our model suggests that there will be an average of around 40 transactions per minute under these assumptions. The variation on a day-to-day basis is likely to be between 6 transactions per minute and 60 transactions per minute. See Annex 4 (Volume II of this report) that sets out the detail of the transaction calculations.
6.3.3.2 Availability and Disaster Recovery The general principle here should, of course, be to avoid Single Points of Failure. The developer and operator will need to ensure that this is adequately taken account of in their development and hosting plans.
The key point to note in this respect will be that the freight exchange will be supporting the transportation industry of 6 transport-dependent countries. On this basis the availability and stability of the e-freightex hosting platform will be critically important.
Recommendation: given the scaling and availability requirements of the application and based on current technology trends it would be appropriate to require developers to specify hosting on a mature cloud platform such as Amazon AWS or Microsoft Azure. There may be options to use “Private Cloud” technologies to extend this model to make it possible to utilise local hosting resources, which would help to reduce dependence on connectivity out of the region.
6.4 IT Capacity Requirements & Interventions Required
While there are no major interventions (including any legal or business) required to enable the launch and use of the e-freightex, the study team has, however, identified a number of desirable interventions as follows:
6.4.1 Hosting Infrastructure in the Region It is notable that there is very little hosting infrastructure of suitable quality in the region. Datacentermap.com lists two data centres in Nairobi and we saw one further news report of a new data centre being developed in Kampala. We also identified a data center in Rwanda. The data centre capacity that does exist lacks the fullest level of redundancy (not fully Tier 4 due to power supply requirements) and by most accounts seems to be used primarily to support telecoms requirements rather than to provide hosting infrastructure.

Final report: Feasibility study on the establishment of an online portal
for trading in freight services (e-freightex) in East Africa
E8073-UQ 47
Anecdotally the costs of server colocation in these data centres is very high and particularly in light of the reduced levels of service that they offer.
Even the statehousekenya.go.ke website is hosted in the US and information.go.ke in the UK.
Accordingly the market for hosting services in the region is dominated by local resellers of EU and US hosting services. This is logical since the region's internet connectivity through Mombasa is peered in Western Europe (I.e. this is where the best response times will typically be seen). None of the major cloud hosting providers (Amazon AWS, Microsoft Azure, Google, Rackspace) have any presence in Africa.
Overall this places pressure on the connectivity links between the region and the rest of the world, since practically all internet traffic has to go outside the region.
Bearing in mind the increasing reliance placed on websites and web-based technologies in the region, it would be advantageous if the conditions for delivery of hosting infrastructure could be improved.
6.4.2 Reliability of Local Connectivity Given that users of the e-Freightex service will be dependent on both fixed and wireless connectivity this is a key area for consideration.
Fixed: anecdotally, Internet connections in non-urban locations (and indeed in the outskirts of the larger cities) are likely poor and of variable speed and quality.
Wireless: Participants in the stakeholder workshops voiced a strong Preference to see a mobile aspect to the e-Freightex service; to make this successful and ubiquitous requires some dependence on 3G service provided by the telecoms operators across the region. 3G appears to be reasonably dependable in urban areas but anecdotally non existent in areas where owner-operated trucks might want to be able to access the e-Freightex (e.g. Truck stops mid journey).
The study team have identified that it might be possible to develop some of the mobile aspects of the e-freightex to operate at the GSM level only, however this development approach is extremely specialised and would require assistance from the Telecoms operators.
As business internet connections trends towards becoming business critical, the connections need to get faster and more reliable and it would be desirable to support projects in this respect.
6.4.3 Lack of General IT skills During the stakeholder workshops we identified a trend indicative of poor IT skills generally. Typical users of the e-freightex will need to be comfortable with many of the following:
Use of web browser to conduct business and time-critical processes; Use of smartphones and/or tablet technology to conduct business and time-critical
processes;
Final report: Feasibility study on the establishment of an online portal
for trading in freight services (e-freightex) in East Africa
E8073-UQ 48
Use of tools like spread-sheets and word processors to prepare and submit documents (e.g. CSV files) for automated processing;
Understanding of importance of password security and access restrictions; Online privacy and data security Issues; and Use of email, particularly using a single unique email address as a user identifier.
During the workshop period we identified many issues in these and related areas.
This highlights the need to improve general IT skills in the region as well as a likely requirement for training in the use of the e-Freightex system itself.
6.4.4 Consolidating freight statistics from across the region One of the requirements for the e-freightex solution that stakeholders identified was for the provision of aggregated statistics. In the context of the e-freightex these statistics might include popular freight routes, geographical “hot spots” for location of freight to be shipped, and so on.
We are aware that there are numerous other projects that are generating statistics for the regional transportation industry, for example the Transport Observatories, government/customs, Ports, and at the Stakeholder Validation Workshop in Kigali numerous suggestions were made for websites that would want to either consume or contribute to the statistics to be made available on the e-freightex.
We have identified from this that there may be an opportunity to deliver a single “data warehouse” or similar environment which would consolidate the statistics generated by these various projects and provide a single reference point and a “single version of the truth”.
Built correctly, this data warehouse could support the provision of reports and statistics to the various other portals around the region that need to consume and present this information.
6.5 Proposed Solution
6.5.1 Buy vs Build A key decision which will need to be made by the operator in the next stage of implementation of the e-freightex is whether to “build or buy” the e-freightex system software.

Final report: Feasibility study on the establishment of an online portal
for trading in freight services (e-freightex) in East Africa
E8073-UQ 49
Figure 8: Buy vs Build options
There is a range of options available, including:
Build: a fully bespoke development project to create a unique solution (option 1 in diagram)
Hybrid: a combination of bespoke development using purchased or open-source toolkits to accelerate development of core functionality (option 3 in diagram)
Buy: Licence (or in some cases purchase) software from an existing operator and customise where required (option 5 in diagram)
Variations on these are possible depending on what can be negotiated commercially. The diagram shows one variation, namely an opportunity to revenue-share with developers or licensors (options 2 & 4).
We have examined some of the factors that will need to be taken into account as part of the build vs buy decision:
Fit to Requirements
Building the e-freightex software will allow the operator to address the unique requirements that the e-freightex needs to address in East Africa – for example some of the vetting and user reputation processes are tightly associated with regional issues.
Third party software will not to have a 100% fit with the requirements for the e-freightex and hence some customisation work will be required to make the solution fit.
As requirements change over time, development work will be required in either case – either to refine the bespoke software or to adjust customisations as the bought solution develops over time.
Final report: Feasibility study on the establishment of an online portal
for trading in freight services (e-freightex) in East Africa
E8073-UQ 50
Time to deployment
A fully-bespoke development project is likely to take longer to deliver than the purchase of a third-party solution.
To date we have been unable to identify any third-party freight exchange platforms that are openly available to be licensed; accordingly some form of exploration of commercial terms would need to conducted under NDA with appropriate suppliers.
It may be the case that a well-executed bespoke development project could be delivered more quickly than a protracted set of commercial negotiations.
Support requirements
Regardless of the outcome of the build vs buy decision there will be a requirement to support and maintain the technology of the chosen solution and any customisations that have been made.
Support and maintenance of a bespoke solution is more onerous for the operator as they will need to maintain the whole solution. In the long term however, the operator can choose to set its own budgets for support and maintenance and prioritise appropriately.
For purchased solutions the maintenance effort for the operator will probably be limited to maintenance of customisations. Maintenance of the core freight exchange software would likely be handled by the software provider and the cost of this reflected in the license fees, for example. (This of course depends on what can be negotiated with the software provider.)
Ownership vs Vendor dependence
The e-freightex will be a business-critical core operational system for the Operator.
As a consequence it may be desirable to build a bespoke solution that can be directly owned and controlled by the operator. This would avoid any dependence on third parties for delivery of software – ownership of the source code would ensure that even the developer could be changed if necessary. Priorities for new features can be determined directly by the operator.
We believe a build decision would also allow TMEA or the operator to subsequently sell or licence the e-freightex software to other agencies; this could have a further positive impact on the sustainability of the project.
A buy decision in these circumstances would place reliance on the third party for provision of software and hosting and would also place dependence on the third party for creation of new features (and potentially also for customisations). If a new feature is required urgently then the operator would need to wait until the third party can accommodate the work within their development schedule and their software roadmap.
A buy decision also requires careful consideration of the commercial dependence on the third-party – for example:
What happens if the third-party fails? Source code escrow may be required in these circumstances to ensure that the operator can ensure the future of the e-freightex platform.
Final report: Feasibility study on the establishment of an online portal
for trading in freight services (e-freightex) in East Africa
E8073-UQ 51
What happens if the third-party chooses to withdraw their licence? This is a longer-term issue but the migration of the e-freightex to any alternative platform (built or bought) would represent a major change for the operator.
Long term Cost
For this purpose we can make the assumption that the operator’s average yearly operating costs for management and administration and for hosting will remain broadly the same, regardless of whether a build or buy decision is made.
Without engaging with third party suppliers to establish their willingness to licence their platforms and the associated costs, it is not possible to accurately estimate the cost of a “buy” decision.
However, it seems likely that in the longer term the cost of the bought solution will be higher than the cost of the developed solution – this is based on the expectation that in the long term, bespoke software will stabilise and potentially need only low levels of maintenance while the bought solution will continue to incur full licence fees.
Summary and assumptions for feasibility study
At the feasibility stage the build vs buy decision is not clear. It requires consideration both by TMEA and the operator.
For the purposes of the feasibility study the consultants have assumed that the operator would make a “Build” decision because:
It provides maximum flexibility in terms of addressing requirements;
It maximises ownership and therefore control of the overall e-freightex solution, potentially with a positive impact on sustainability; and
It is definitely do-able (the study team do not know if any third parties want to sell or license their freight exchange software).
6.5.2 Proposed solution for feasibility study purposes For the purposes of the feasibility study, the study team therefore proposes:
A Software development project to deliver the functionality of the 14 solution components described, as a web-based application with an accompanying mobile smartphone app;
Working on the basis of closed-source development for the foreseeable future; and Developed using Microsoft .Net technology and cloud-hosted on EU-based servers
with sufficient infrastructure to ensure availability and options for disaster recovery.
6.6 Cost Estimates
6.6.1 Software Development Costs The study team has attempted (Annex 5, Volume II of this report) to estimate approximate development costs for the project using the following rationale:
For each BPM process the study team has estimated a number of story points.

Final report: Feasibility study on the establishment of an online portal
for trading in freight services (e-freightex) in East Africa
E8073-UQ 52
The story points reflect the overall complexity of the work required to implement each process. The story points are estimated as 1,2,4,8,16 which can broadly be thought of as similar to a size range – Small, Medium, Large, Extra Large, XXL.
The complexity assessment includes both implementation work and an allowance for development of automated tests.
The study team has assumed a daily rate of USD$800 per story point in order to allow us to estimate a cost. This rate should be sufficient to cover around 2 days of development work per story point and overall should include an allowance for development project management.
Annex 5 (Volume II of this report) shows the detailed story point allocation. This is summarised in table below:
Table 6: Components and Story Points
Component Story Points 01. Marketing Website 13 02. Signup & Vetting 11 03. Payments 31 04. Directory & User Management 18 05. Supplier & Listings Management 19 06. Knowledgebase & Planning Zone 24 07. Data Entry 28 08. Matching Engine 24 09. Alerts 16 10. Bidding 18 11. Transaction Processing 16 12. Feedback 26 13. Reporting 16 14. Administration 70 Grand Total 330
Our estimated software development cost is therefore US$ 264,000. For budgeting purposes it would be appropriate to apply a contingency of 15% taking the development budget to US$ 303,600.
6.6.2 Other initial development costs The study team has included an allowance for other development costs as follows:
User interface design and testing (assumed 15% of software development cost): US$ 45,540
Mobile App development (assumed 10% of software development cost): US$ 30,360
Legal costs – particularly for terms and conditions of use and privacy aspects at start of project, will need to take into account legal regimes of all countries in the region (assumed cost): US$ 20,000
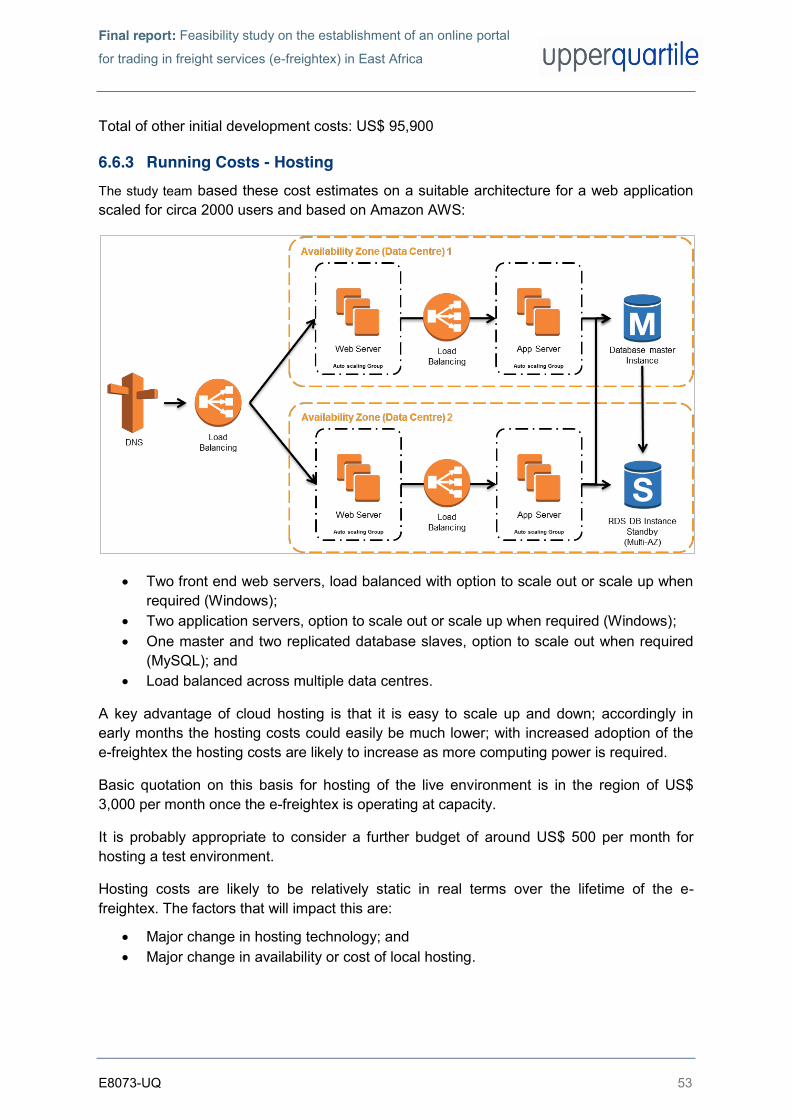
Final report: Feasibility study on the establishment of an online portal
for trading in freight services (e-freightex) in East Africa
E8073-UQ 53
Total of other initial development costs: US$ 95,900
6.6.3 Running Costs - Hosting The study team based these cost estimates on a suitable architecture for a web application scaled for circa 2000 users and based on Amazon AWS:
Two front end web servers, load balanced with option to scale out or scale up when required (Windows);
Two application servers, option to scale out or scale up when required (Windows); One master and two replicated database slaves, option to scale out when required
(MySQL); and Load balanced across multiple data centres.
A key advantage of cloud hosting is that it is easy to scale up and down; accordingly in early months the hosting costs could easily be much lower; with increased adoption of the e-freightex the hosting costs are likely to increase as more computing power is required.
Basic quotation on this basis for hosting of the live environment is in the region of US$ 3,000 per month once the e-freightex is operating at capacity.
It is probably appropriate to consider a further budget of around US$ 500 per month for hosting a test environment.
Hosting costs are likely to be relatively static in real terms over the lifetime of the e-freightex. The factors that will impact this are:
Major change in hosting technology; and Major change in availability or cost of local hosting.
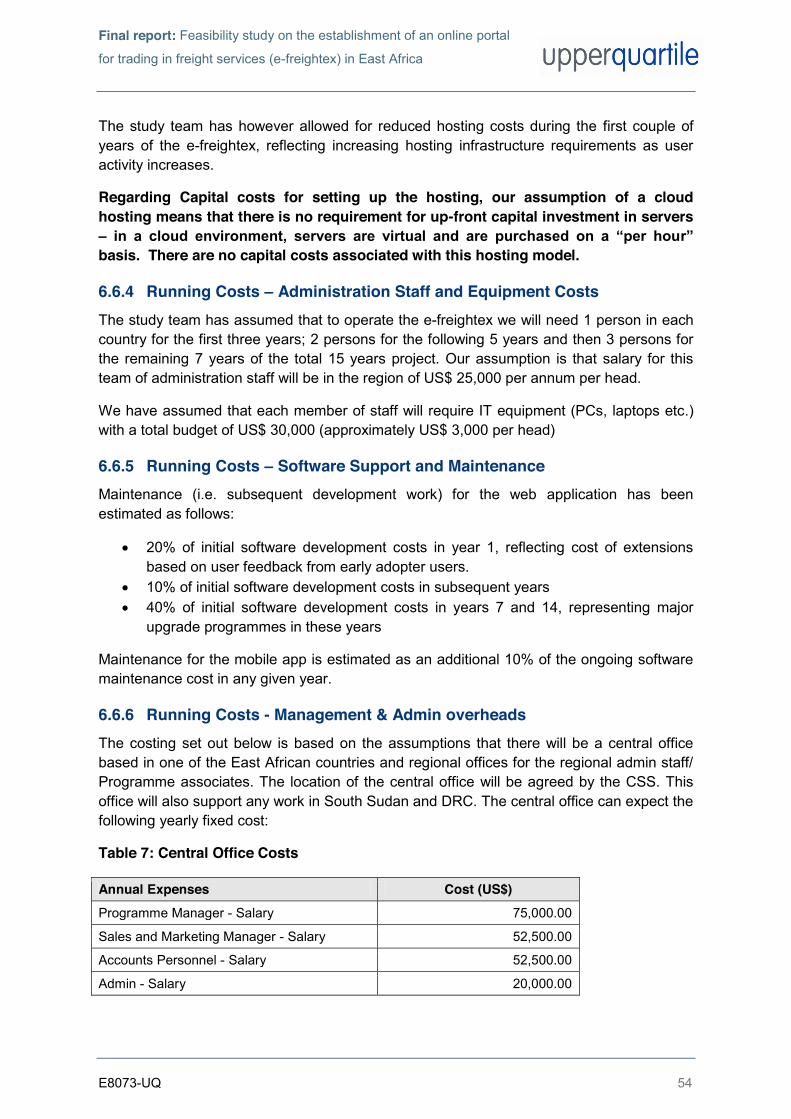
Final report: Feasibility study on the establishment of an online portal
for trading in freight services (e-freightex) in East Africa
E8073-UQ 54
The study team has however allowed for reduced hosting costs during the first couple of years of the e-freightex, reflecting increasing hosting infrastructure requirements as user activity increases.
Regarding Capital costs for setting up the hosting, our assumption of a cloud hosting means that there is no requirement for up-front capital investment in servers – in a cloud environment, servers are virtual and are purchased on a “per hour” basis. There are no capital costs associated with this hosting model.
6.6.4 Running Costs – Administration Staff and Equipment Costs The study team has assumed that to operate the e-freightex we will need 1 person in each country for the first three years; 2 persons for the following 5 years and then 3 persons for the remaining 7 years of the total 15 years project. Our assumption is that salary for this team of administration staff will be in the region of US$ 25,000 per annum per head.
We have assumed that each member of staff will require IT equipment (PCs, laptops etc.) with a total budget of US$ 30,000 (approximately US$ 3,000 per head)
6.6.5 Running Costs – Software Support and Maintenance Maintenance (i.e. subsequent development work) for the web application has been estimated as follows:
20% of initial software development costs in year 1, reflecting cost of extensions based on user feedback from early adopter users.
10% of initial software development costs in subsequent years 40% of initial software development costs in years 7 and 14, representing major
upgrade programmes in these years
Maintenance for the mobile app is estimated as an additional 10% of the ongoing software maintenance cost in any given year.
6.6.6 Running Costs - Management & Admin overheads The costing set out below is based on the assumptions that there will be a central office based in one of the East African countries and regional offices for the regional admin staff/ Programme associates. The location of the central office will be agreed by the CSS. This office will also support any work in South Sudan and DRC. The central office can expect the following yearly fixed cost:
Table 7: Central Office Costs
Annual Expenses Cost (US$) Programme Manager - Salary 75,000.00
Sales and Marketing Manager - Salary 52,500.00
Accounts Personnel - Salary 52,500.00
Admin - Salary 20,000.00

Final report: Feasibility study on the establishment of an online portal
for trading in freight services (e-freightex) in East Africa
E8073-UQ 55
Annual Expenses Cost (US$) Office Rent - 800 sq ft 18,000.00
Utilities 4,500.00
Telephone 4,500.00
Stationary 3,000.00
Software – MS Office (SaaS) 340.00
Accounts Package (1 user) 500.00
Travel - Programme manager 10,000.00
Marketing budget 30,000.00
General expenses 5,000.00
TOTAL (US$) 275,840.00 Source: Consultant’s Estimate
The above salaries are an approximate based on EU labour market rates. Salary cost can be significantly reduced base on current rates of pay in EAC.
Based on the Design document, the regional office will accommodate one Programme Associate/Admin from year one to three. Their key role will be to support the Programme Manager. The salary cost for these personnel has already been accounted for in the estimates document. Therefore the costing set out below will only account for the office and travel for this staff in each country.
Table 8: Regional Office Costs
Annual Expenses Cost (US$) Office Rent - 400 sq ft 9,000.00
Utilities 2,000.00
Telephone 2,000.00
Stationary 500.00
Software – MS Office (SaaS) 75.00
Travel - Programme manager 3,000.00
Total Cost for one office (US$) 16,575.00 Total Cost for four country offices (US$) 66,300.00
Source: Consultant’s Estimate
Our recommendation to reduce the upfront cost of regional offices is to have one central office with Regional staff working from home, with a central budget for travel, mobile phone, internet access and stationary. This model reduces upfront cost (US$ 342,140) whilst trying to increase subscription rates and is scalable as the regional support requirement increases.

Final report: Feasibility study on the establishment of an online portal
for trading in freight services (e-freightex) in East Africa
E8073-UQ 56
6.6.7 Payment Transactions Cost We are currently anticipating two payment methods (card and MPesa) so the real total cost to be included is a fixed yearly cost of US$ 4,400 plus 3.5% per transactions value per year. Other payment methods could be introduced later as system updates (e.g. PayPal, Google Wallet or others).
Fixed Payment Transaction Charges:
Assuming two online payment methods (card, M-Pesa) Payment methods charges can be estimated as:
US$ 1,000 per payment method per year (connection fee); and
US$ 100 per payment method per month (usage charge).
Variable Payment Transaction Charges:
3.5% per transaction value (fee) 21
Please see Table 9 below, which illustrates the payment transaction cost for the first three years as an example (Cross refer Annex 6, Volume II of this report).
Table 9: Payment Transaction Cost
YEAR 1 2 3
Number of subscriptions at US$ 45 per month 1000 1000 1000
Charges Connection Fee Mpesa US$ 1000 1000 1000
Connection Fee Card Payment US$ 1000 1000 1000
Annual Usage Fee Mpesa US$ 1200 1200 1200
Annual Usage Fee Card Payment US$ 1200 1200 1200
3.5% Per Transaction value US$ 18900 18900 18900
Total Payment Transaction Charges (in US$) 23,300.00 23,300.00 23,300.00 Source: Consultant’s Estimate
These payment methods and charges will need to be verified and then built into the business plan at the next stage of the process. We would also recommend exploring other payment methods and cheaper solutions as technology matures in the regions over the next 15 years.
6.6.8 Overall Cost Summary Table 10 below sets out the overall cost summary as reported above.
21 As we were finalising this report Safaricom announced a new tariff reducing M-Pesa fees. We have continued to assume a “flat rate” of 3.5% in order to take a pessimistic view. See http://www.cio.co.ke/news/main-stories/safaricom-goes-after-payment-cards,-targets-smes-with-%22lipa-na-m-pesa%22

Final report: Feasibility study on the establishment of an online portal
for trading in freight services (e-freightex) in East Africa
E8073-UQ 57
Table 10: Project Costs (in ‘000 US$, 2013, prices)
Year 2013 2014 2015 2016 2017 2018 2019 2020 2021 2022 2023 2024 2025 2026 2027 2028
Initial Software Development Cost (6.6.1)
303.60 - - - - - - - - - - - - - - -
Other initial development costs (6.6.2)
95.90 - - - - - - - - - - - - - - -
Hosting costs (6.6.3) 10.50 21.00 21.00 42.00 42.00 42.00 42.00 42.00 42.00 42.00 42.00 42.00 42.00 42.00 42.00 42.00 Administration staff and equipment costs (6.6.4)
30.00 125.00 125.00 125.00 250.00 250.00 250.00 250.00 250.00 400.00 400.00 400.00 400.00 400.00 400.00 400.00
Software support and maintenance (6.6.5)
- 66.79 33.4 33.4 33.4 33.4 33.4 133.6 33.4 33.4 33.4 33.4 33.4 33.4 133.6 33.4
Management and administration overheads (6.6.6)
- 342.14 342.14 342.14 342.14 342.14 342.14 342.14 342.14 342.14 342.14 342.14 342.14 342.14 342.14 342.14
Payment Transaction Charges (6.6.7)
- 23.3 23.3 23.3 28.05 28.05 28.05 30.86 30.86 30.86 33.22 33.22 33.22 34.17 34.17 34.17
Estimated Development Costs 440.0 - - - - - - - - - - - - - - -
Estimated Operating Costs - 578.2 544.8 565.8 695.6 695.6 695.6 798.6 698.4 848.4 850.8 850.8 850.8 851.7 951.9 851.7
Source: Consultant’s Estimate

Final report: Feasibility study on the establishment of an online portal
for trading in freight services (e-freightex) in East Africa
E8073-UQ 58
7. THE VALUE FOR MONEY CASE
7.1 Container Demand Forecasts
The container traffic in East Africa region has been forecasted using growth rates from a recently completed study22 for USAID and DFID. Table 11 below sets out the growth rates forecasted by region.
Table 11: Import Export Growth Rates by East Africa Region
Country 2009-2015 2015-2030
Imports Exports Imports Exports Burundi 16.5 19.6 3.2 6.6
Kenya 13 7.2 6.8 4.6
Rwanda 14.4 23.3 6.1 12.2
Sudan 5 66.1* 5 5
Tanzania 11.2 12.7 7.1 6.7
Uganda 10.6 13.6 4.1 5.5 * Trade with Kenya and Tanzania only growth, from a small base
Using Table 12 below and the above mentioned growth rates, the study team estimated (Table 13, Table 14 and Table 15) number of containers imported and exported by each country up to 2028 (as 2014 was assumed to be project opening year; and year 2028 was assumed to be project horizon year).
Table 12: Container Traffic (International) by Country (2009)
Country Import Export Total Burundi 4,649 835 5,484
Kenya 212,571 208,223 420,795
Rwanda 6,671 6,534 13,205
South Sudan 4,710 4,614 9,324
Tanzania 175,678 192,271 367,949
Uganda 75,873 74,321 150,193
Total 48,0152 486,799 966,951 Source: KPA, TPA and Consultant’s estimate
22 Corridor Diagnostic Study of the Northern and Central Corridors of East Africa, Nathan Associates Inc., April 2011
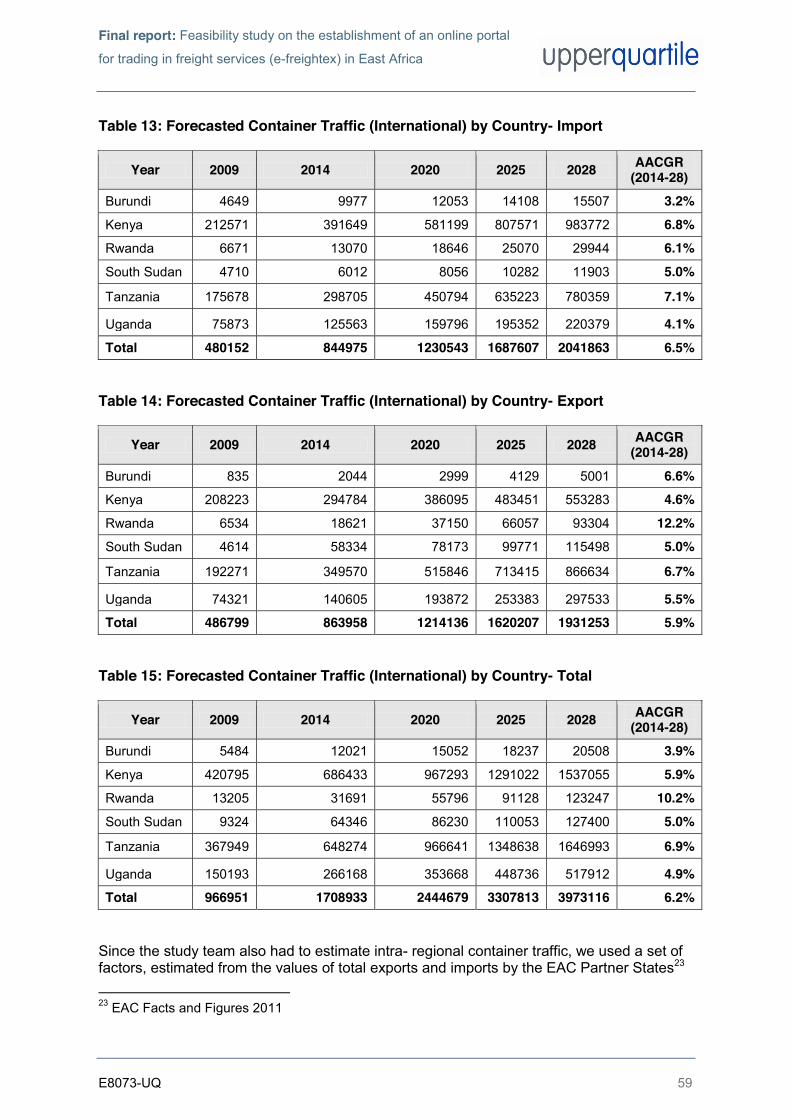
Final report: Feasibility study on the establishment of an online portal
for trading in freight services (e-freightex) in East Africa
E8073-UQ 59
Table 13: Forecasted Container Traffic (International) by Country- Import
Year 2009 2014 2020 2025 2028 AACGR (2014-28)
Burundi 4649 9977 12053 14108 15507 3.2% Kenya 212571 391649 581199 807571 983772 6.8% Rwanda 6671 13070 18646 25070 29944 6.1% South Sudan 4710 6012 8056 10282 11903 5.0%
Tanzania 175678 298705 450794 635223 780359 7.1%
Uganda 75873 125563 159796 195352 220379 4.1% Total 480152 844975 1230543 1687607 2041863 6.5%
Table 14: Forecasted Container Traffic (International) by Country- Export
Year 2009 2014 2020 2025 2028 AACGR (2014-28)
Burundi 835 2044 2999 4129 5001 6.6% Kenya 208223 294784 386095 483451 553283 4.6% Rwanda 6534 18621 37150 66057 93304 12.2% South Sudan 4614 58334 78173 99771 115498 5.0%
Tanzania 192271 349570 515846 713415 866634 6.7%
Uganda 74321 140605 193872 253383 297533 5.5% Total 486799 863958 1214136 1620207 1931253 5.9%
Table 15: Forecasted Container Traffic (International) by Country- Total
Year 2009 2014 2020 2025 2028 AACGR (2014-28)
Burundi 5484 12021 15052 18237 20508 3.9% Kenya 420795 686433 967293 1291022 1537055 5.9% Rwanda 13205 31691 55796 91128 123247 10.2% South Sudan 9324 64346 86230 110053 127400 5.0%
Tanzania 367949 648274 966641 1348638 1646993 6.9%
Uganda 150193 266168 353668 448736 517912 4.9% Total 966951 1708933 2444679 3307813 3973116 6.2%
Since the study team also had to estimate intra- regional container traffic, we used a set of factors, estimated from the values of total exports and imports by the EAC Partner States23 23 EAC Facts and Figures 2011

Final report: Feasibility study on the establishment of an online portal
for trading in freight services (e-freightex) in East Africa
E8073-UQ 60
(See Table 16 to Table 22). Using the above mentioned growth rates, intra-regional container traffic was then forecasted up to 2028.
Table 16: Container Traffic (Intra-Regional) by Country (2009)
Country Import Export Total Burundi 7532 3133 10665
Kenya 4437 76385 80822
Rwanda* 0 0 0
South Sudan* 0 0 0
Tanzania 6146 18404 24550
Uganda 11150 31993 43143
Total 29265 129916 159180 * data not available
Table 17: Import Container Traffic (Intra-Regional) by Country (2009)
Import from/to Burundi Kenya Rwanda South Sudan Tanzania Uganda Total Burundi 0 1288 193 0 4544 1507 7532 Kenya 77 0 70 0 2585 1705 4437
Rwanda 0 0 0 0 0 0 0
South Sudan 0 0 0 0 0 0 0
Tanzania 13 5515 26 0 0 592 6146
Uganda 0 10379 147 0 623 0 11150
Total 90 17182 436 0 7752 3804 29265
Table 18: Export Container Traffic (Intra-Regional) by Country (2009)
Export from/to Burundi Kenya Rwanda South Sudan Tanzania Uganda Total Burundi 0 1886 609 0 81 557 3133 Kenya 3288 0 7549 0 23248 42300 76385
Rwanda 0 0 0 0 0 0 0
South Sudan 0 0 0 0 0 0 0
Tanzania 1759 9796 4460 0 0 2389 18404
Uganda 2662 14577 11255 0 3499 0 31993
Total 7710 26260 23872 0 26828 45247 129916

Final report: Feasibility study on the establishment of an online portal
for trading in freight services (e-freightex) in East Africa
E8073-UQ 61
Table 19: Total Container Traffic (Intra-Regional) by Country (2009)
ExIM from/to Burundi Kenya Rwanda South Sudan Tanzania Uganda Total
Burundi 0 3174 802 0 4625 2064 10665 Kenya 3365 0 7619 0 25833 44005 80822
Rwanda 0 0 0 0 0 0 0
South Sudan 0 0 0 0 0 0 0
Tanzania 1772 15311 4485 0 0 2981 24550
Uganda 2662 24956 11402 0 4122 0 43143
Total 7799 43442 24308 - 34580 0 159180
Table 20: Import Container Traffic (Intra-Regional) by Country (2028)
Import from/to Burundi Kenya Rwanda
South Sudan Tanzania Uganda Total
AACGR (2014-28)
Burundi 0 4295 644 0 15157 5026 25122 3.2% Kenya 358 0 322 0 11962 7891 20533 6.8%
Rwanda 0 0 0 0 0 0 0 -
South Sudan 0 0 0 0 0 0 0 -
Tanzania 56 24498 114 0 0 2630 27299 7.1%
Uganda 0 30148 428 0 1811 0 32387 4.1%
Total 414 58942 1509 0 28929 15547 105341 5.0%
Table 21: Export Container Traffic (Intra-Regional) by Country (2028)
Import from/to Burundi Kenya Rwanda
South Sudan Tanzania Uganda Total
AACGR (2014-28)
Burundi 0 11295 3645 0 484 3337 18761 6.6% Kenya 8737 0 20059 0 61773 112399 202968 4.6%
Rwanda 0 0 0 0 0 0 0 -
South Sudan 0 0 0 0 0 0 0 -
Tanzania 7930 44155 20101 0 0 10768 82954 6.7%
Uganda 10658 58357 45057 0 14007 0 128080 5.5%
Total 27325 113807 88861 0 76265 126505 432763 5.3%
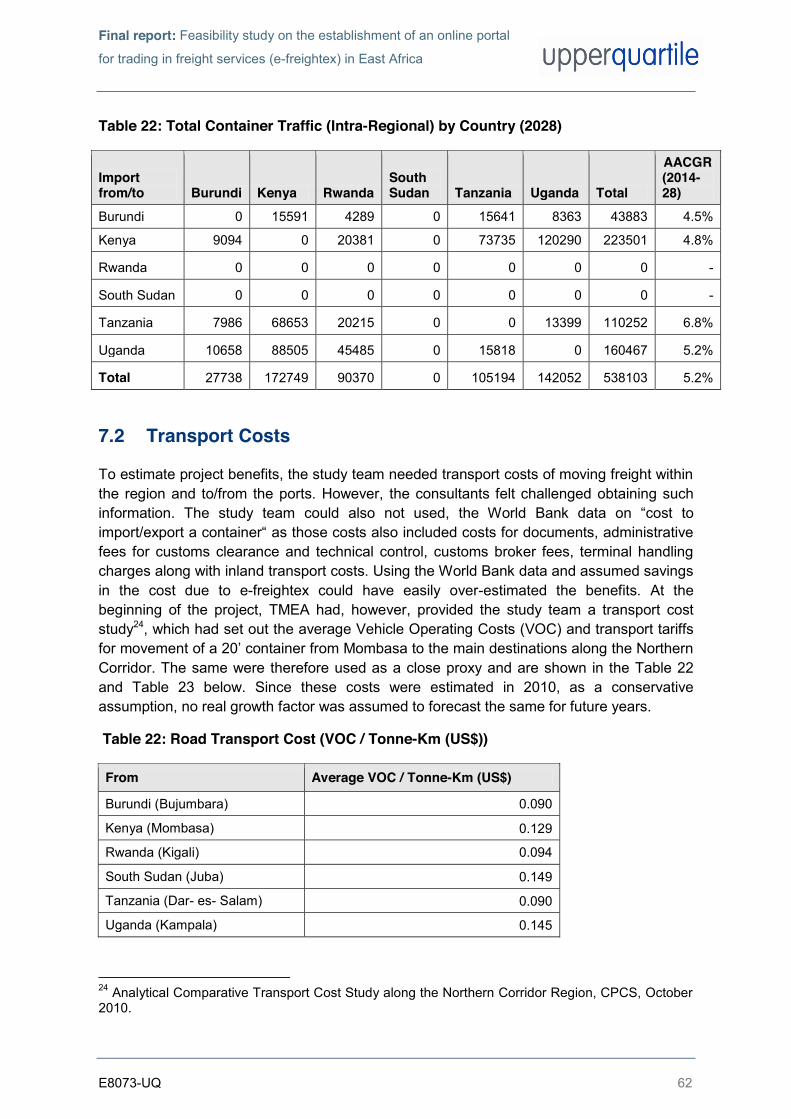
Final report: Feasibility study on the establishment of an online portal
for trading in freight services (e-freightex) in East Africa
E8073-UQ 62
Table 22: Total Container Traffic (Intra-Regional) by Country (2028)
Import from/to Burundi Kenya Rwanda
South Sudan Tanzania Uganda Total
AACGR (2014-28)
Burundi 0 15591 4289 0 15641 8363 43883 4.5% Kenya 9094 0 20381 0 73735 120290 223501 4.8%
Rwanda 0 0 0 0 0 0 0 -
South Sudan 0 0 0 0 0 0 0 -
Tanzania 7986 68653 20215 0 0 13399 110252 6.8%
Uganda 10658 88505 45485 0 15818 0 160467 5.2%
Total 27738 172749 90370 0 105194 142052 538103 5.2%
7.2 Transport Costs
To estimate project benefits, the study team needed transport costs of moving freight within the region and to/from the ports. However, the consultants felt challenged obtaining such information. The study team could also not used, the World Bank data on “cost to import/export a container“ as those costs also included costs for documents, administrative fees for customs clearance and technical control, customs broker fees, terminal handling charges along with inland transport costs. Using the World Bank data and assumed savings in the cost due to e-freightex could have easily over-estimated the benefits. At the beginning of the project, TMEA had, however, provided the study team a transport cost study24, which had set out the average Vehicle Operating Costs (VOC) and transport tariffs for movement of a 20’ container from Mombasa to the main destinations along the Northern Corridor. The same were therefore used as a close proxy and are shown in the Table 22 and Table 23 below. Since these costs were estimated in 2010, as a conservative assumption, no real growth factor was assumed to forecast the same for future years.
Table 22: Road Transport Cost (VOC / Tonne-Km (US$))
From Average VOC / Tonne-Km (US$)
Burundi (Bujumbara) 0.090
Kenya (Mombasa) 0.129
Rwanda (Kigali) 0.094
South Sudan (Juba) 0.149
Tanzania (Dar- es- Salam) 0.090
Uganda (Kampala) 0.145
24 Analytical Comparative Transport Cost Study along the Northern Corridor Region, CPCS, October 2010.

Final report: Feasibility study on the establishment of an online portal
for trading in freight services (e-freightex) in East Africa
E8073-UQ 63
Table 23: Road Transport Cost (VOC / Km (US$))
From Average VOC / Tonne-Km (US$)*
Burundi (Bujumbara) 1.710
Kenya (Mombasa) 2.451
Rwanda (Kigali) 1.786
South Sudan (Juba) 2.831
Tanzania (Dar- es- Salam) 1.713
Uganda (Kampala) 2.755 *using a net tonnage of a container at 19
7.3 The Value for Money Case
7.3.1 Introduction This section presents a summary of the appraisal and Value for Money (VfM) assessment for the e-freightex portal project. Whilst some of the impacts have been monetised, the remaining were either assessed quantitatively or assessed qualitatively or both. The appraisal process demonstrates the strength of the case with a high or a low positive Benefit to Cost Ratio (BCR).
7.3.2 Options Assessment This business case has been prepared based on assessment of the preferred option only. Impacts have been quantified using a spread-sheet approach, which represents the conventional Do-Something (DS) /Do-Minimum (DM) scenarios as set in the section below.
7.3.3 Definition of Scenarios The assessment of an intervention includes a comparison of the situation without the intervention (Do-Minimum scenario) against the situation, which would obtain with the intervention in place (Do-Something scenario). Defining realistic Do-minimum (DM) and Do-something (DS) scenarios are central to the appraisal process. The same was done in order to avoid both over and/or under estimations of benefits.
The DS scenario is based on development of e-freightex online portal, which is assumed to be developed by end 2013. The DM scenario is assumed as the same as the current situation is.
7.3.4 Appraisal Period The time horizon/appraisal period is the period over which streams of costs and benefits should be estimated. It includes the period during which investment is being planned and implemented as well as the operating period. In general, an appraiser should include the full benefits of projects based on the lifetime of a project, which unfortunately cannot be determined easily because of the following reasons:
Final report: Feasibility study on the establishment of an online portal
for trading in freight services (e-freightex) in East Africa
E8073-UQ 64
It is extremely difficult to predict future demand of a project for such a long period of time; and
It is more difficult to estimate a period appropriate to projects’ economically useful life as some projects could have indefinite lives.
Therefore, the appraisal period is often limited to the period over which demand can be foreseen with reasonable accuracy. In line with the EU guidance on cost-benefit analysis of investment projects25, appraisal period for e-freightex project is recommended as 15 years from the opening year of the project (e.g. if a project opens in 2014 then the project’s horizon year will be 2028).
7.3.4 Project Costs Table 10 in Section 6 sets out the project costs used for the analysis. It should be noted that the project costs included the risk costs.
7.3.5 Monetised Benefits of the Project To estimate the benefits of the e-freightex project, the study team built an in house EXCEL spread-sheet model. The analysis was informed by information gathered during the stakeholder consultations (See Section 4.2.2). When stakeholders were asked that what percentage of transport costs26 reduction do they envisage the e-freightex portal can generate; 73.9% of those who voted thought it could reduce the transport costs by 5%; 21.7% thought that the development of e-freightex portal could reduce the transport costs by 10%; and the remaining 4.4% thought the costs savings will be higher than 10%. For the purposes of this project, we used a conservative assumption of decrease in transport costs by 1%. A modal split of 90% container movement by road was applied (See Section 3.6) throughout the project appraisal period (i.e. it was assumed that out of total forecasted containers, 90% will move by road mode and the remaining 10% by other modes). However to check the impact of the above set of assumptions on the project economics, the study team conducted a rigorous sensitivity testing (See Section 7.4). Due to lack of data and project time constraint, the study team also could not estimate monetised benefits that may occur due to savings in cargo import/export time or by savings incurred by rail or air cargo mode. See Annex 7 in Volume II of this report for economic model inputs.
Table 24 below summarise the costs and benefits and show that the Net Present Value (NPV) of the project is estimated at US$ 263.0m. This large positive value indicates that the benefits for the scheme considerably outweigh the costs i.e. the scheme offers a very high VfM to the taxpayer/development agency.
25 Guide to cost-benefit analysis of investment projects 26 Transport costs were defined as a sum total of Fixed Costs (which includes, independently of vehicle usage, financing charges, depreciation of investment, wages, facilities, insurance, security, administrative overheads, taxes, profit margins etc.), Variable Costs (Fuel, subsistence, road user charges, occasional maintenance, tires, taxes etc.) and overheads (informal payments etc.).
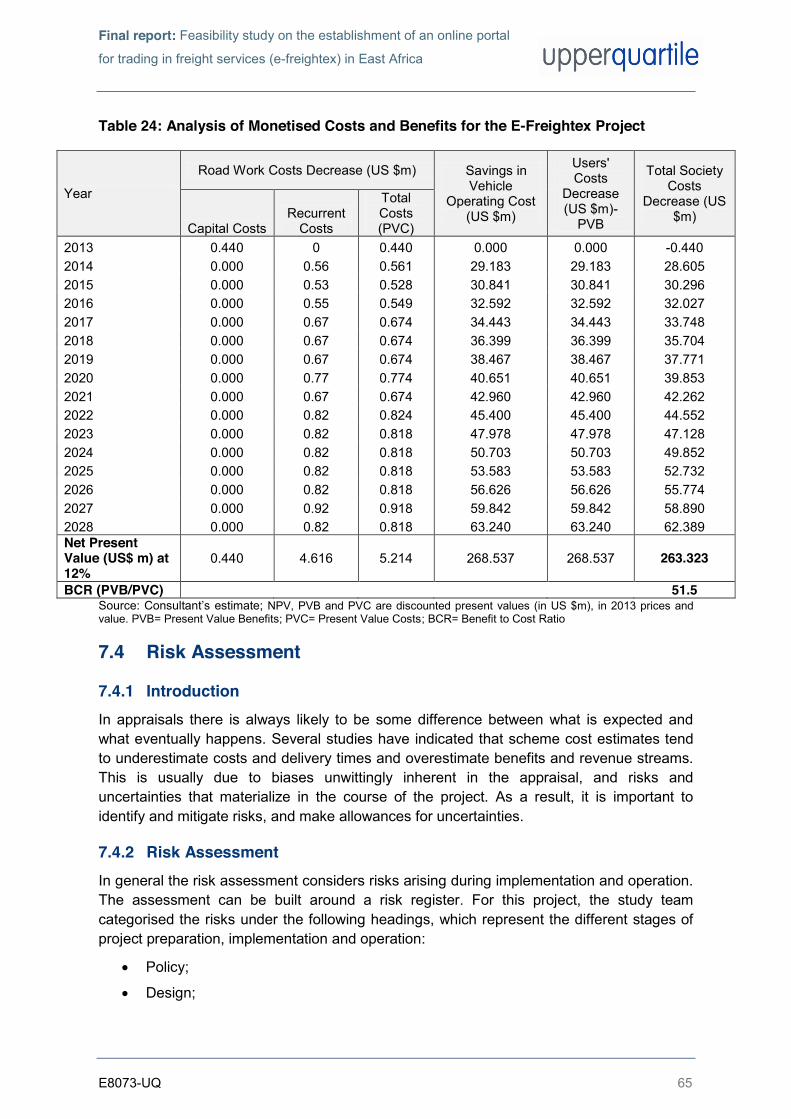
Final report: Feasibility study on the establishment of an online portal
for trading in freight services (e-freightex) in East Africa
E8073-UQ 65
Table 24: Analysis of Monetised Costs and Benefits for the E-Freightex Project
Year
Road Work Costs Decrease (US $m) Savings in Vehicle
Operating Cost (US $m)
Users' Costs
Decrease (US $m)-
PVB
Total Society Costs
Decrease (US $m)
Capital Costs Recurrent
Costs
Total Costs (PVC)
2013 0.440 0 0.440 0.000 0.000 -0.440 2014 0.000 0.56 0.561 29.183 29.183 28.605 2015 0.000 0.53 0.528 30.841 30.841 30.296 2016 0.000 0.55 0.549 32.592 32.592 32.027 2017 0.000 0.67 0.674 34.443 34.443 33.748 2018 0.000 0.67 0.674 36.399 36.399 35.704 2019 0.000 0.67 0.674 38.467 38.467 37.771 2020 0.000 0.77 0.774 40.651 40.651 39.853 2021 0.000 0.67 0.674 42.960 42.960 42.262 2022 0.000 0.82 0.824 45.400 45.400 44.552 2023 0.000 0.82 0.818 47.978 47.978 47.128 2024 0.000 0.82 0.818 50.703 50.703 49.852 2025 0.000 0.82 0.818 53.583 53.583 52.732 2026 0.000 0.82 0.818 56.626 56.626 55.774 2027 0.000 0.92 0.918 59.842 59.842 58.890 2028 0.000 0.82 0.818 63.240 63.240 62.389 Net Present Value (US$ m) at 12%
0.440 4.616 5.214 268.537 268.537 263.323
BCR (PVB/PVC) 51.5 Source: Consultant’s estimate; NPV, PVB and PVC are discounted present values (in US $m), in 2013 prices and value. PVB= Present Value Benefits; PVC= Present Value Costs; BCR= Benefit to Cost Ratio
7.4 Risk Assessment
7.4.1 Introduction In appraisals there is always likely to be some difference between what is expected and what eventually happens. Several studies have indicated that scheme cost estimates tend to underestimate costs and delivery times and overestimate benefits and revenue streams. This is usually due to biases unwittingly inherent in the appraisal, and risks and uncertainties that materialize in the course of the project. As a result, it is important to identify and mitigate risks, and make allowances for uncertainties.
7.4.2 Risk Assessment In general the risk assessment considers risks arising during implementation and operation. The assessment can be built around a risk register. For this project, the study team categorised the risks under the following headings, which represent the different stages of project preparation, implementation and operation:
Policy;
Design;
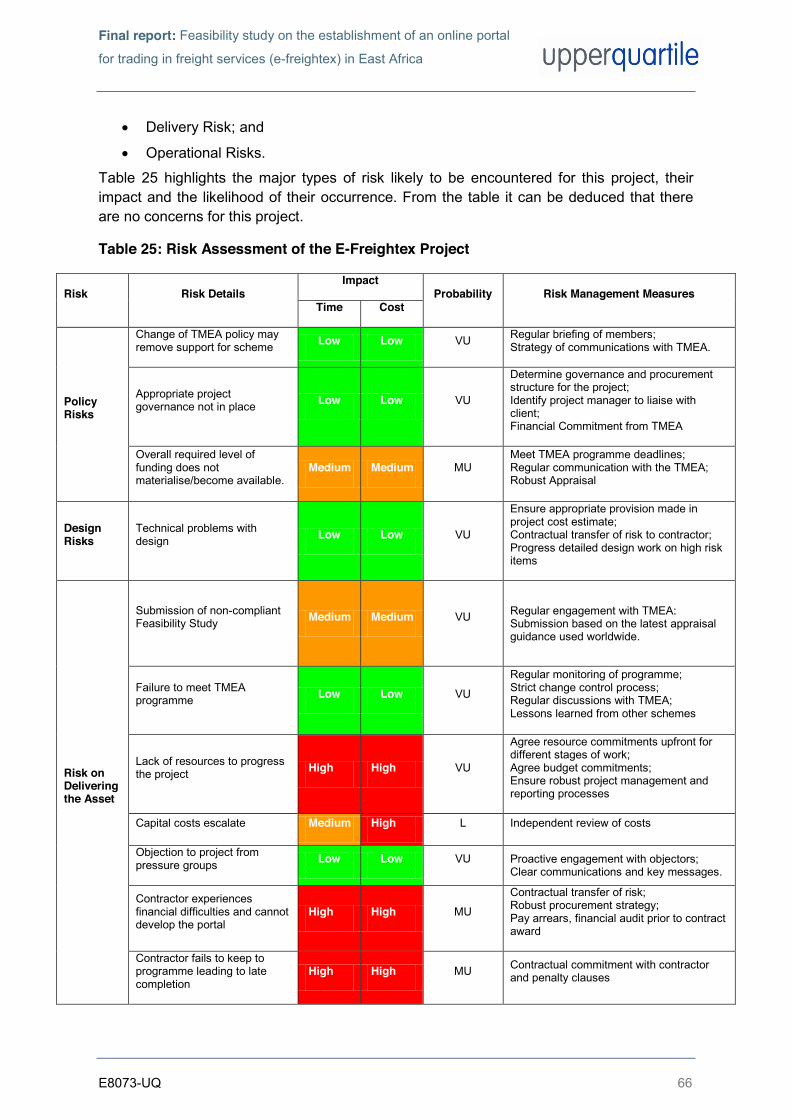
Final report: Feasibility study on the establishment of an online portal
for trading in freight services (e-freightex) in East Africa
E8073-UQ 66
Delivery Risk; and
Operational Risks.
Table 25 highlights the major types of risk likely to be encountered for this project, their impact and the likelihood of their occurrence. From the table it can be deduced that there are no concerns for this project.
Table 25: Risk Assessment of the E-Freightex Project
Risk Risk Details Impact
Probability Risk Management Measures Time Cost
Policy Risks
Change of TMEA policy may remove support for scheme Low Low VU Regular briefing of members;
Strategy of communications with TMEA.
Appropriate project governance not in place Low Low VU
Determine governance and procurement structure for the project; Identify project manager to liaise with client; Financial Commitment from TMEA
Overall required level of funding does not materialise/become available.
Medium Medium MU Meet TMEA programme deadlines; Regular communication with the TMEA; Robust Appraisal
Design Risks
Technical problems with design Low Low VU
Ensure appropriate provision made in project cost estimate; Contractual transfer of risk to contractor; Progress detailed design work on high risk items
Risk on Delivering the Asset
Submission of non-compliant Feasibility Study Medium Medium VU Regular engagement with TMEA:
Submission based on the latest appraisal guidance used worldwide.
Failure to meet TMEA programme Low Low VU
Regular monitoring of programme; Strict change control process; Regular discussions with TMEA; Lessons learned from other schemes
Lack of resources to progress the project High High VU
Agree resource commitments upfront for different stages of work; Agree budget commitments; Ensure robust project management and reporting processes
Capital costs escalate Medium High L Independent review of costs
Objection to project from pressure groups Low Low VU Proactive engagement with objectors;
Clear communications and key messages.
Contractor experiences financial difficulties and cannot develop the portal
High High MU
Contractual transfer of risk; Robust procurement strategy; Pay arrears, financial audit prior to contract award
Contractor fails to keep to programme leading to late completion
High High MU Contractual commitment with contractor and penalty clauses
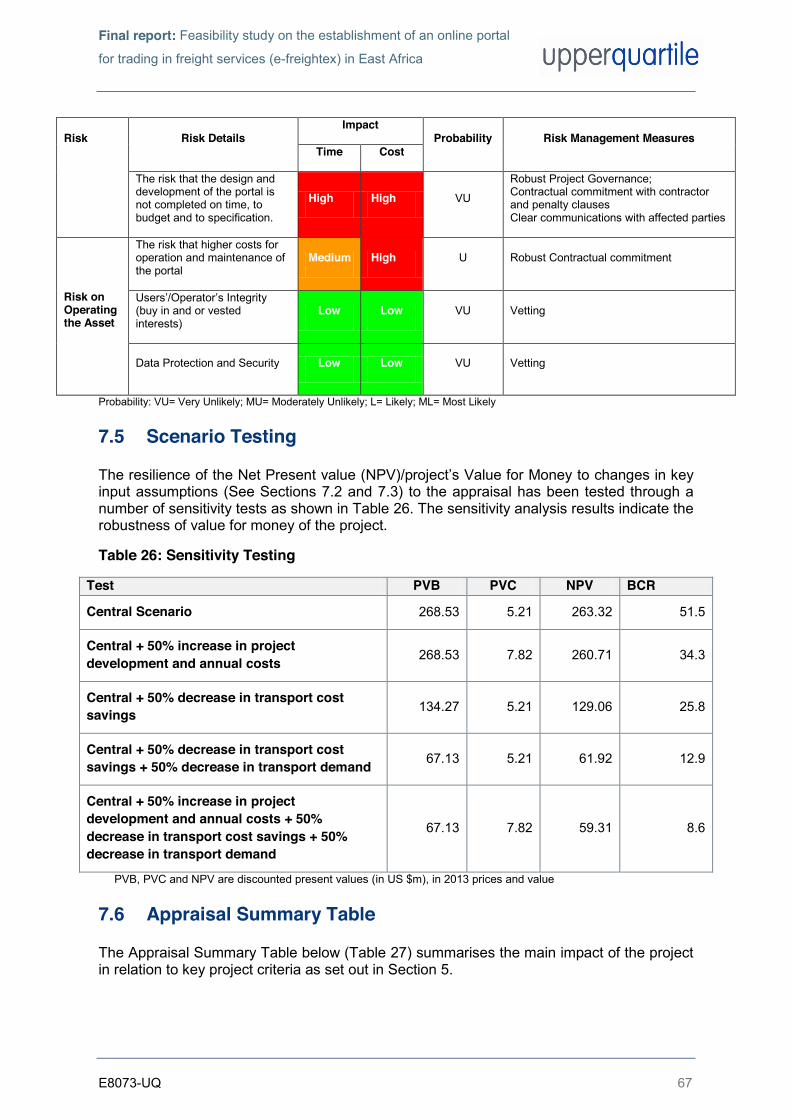
Final report: Feasibility study on the establishment of an online portal
for trading in freight services (e-freightex) in East Africa
E8073-UQ 67
Risk Risk Details Impact
Probability Risk Management Measures Time Cost
The risk that the design and development of the portal is not completed on time, to budget and to specification.
High High VU
Robust Project Governance; Contractual commitment with contractor and penalty clauses Clear communications with affected parties
Risk on Operating the Asset
The risk that higher costs for operation and maintenance of the portal
Medium High U Robust Contractual commitment
Users’/Operator’s Integrity (buy in and or vested interests)
Low Low VU Vetting
Data Protection and Security Low Low VU Vetting
Probability: VU= Very Unlikely; MU= Moderately Unlikely; L= Likely; ML= Most Likely
7.5 Scenario Testing
The resilience of the Net Present value (NPV)/project’s Value for Money to changes in key input assumptions (See Sections 7.2 and 7.3) to the appraisal has been tested through a number of sensitivity tests as shown in Table 26. The sensitivity analysis results indicate the robustness of value for money of the project.
Table 26: Sensitivity Testing
Test PVB PVC NPV BCR
Central Scenario 268.53 5.21 263.32 51.5
Central + 50% increase in project development and annual costs 268.53 7.82 260.71 34.3
Central + 50% decrease in transport cost savings 134.27 5.21 129.06 25.8
Central + 50% decrease in transport cost savings + 50% decrease in transport demand 67.13 5.21 61.92 12.9
Central + 50% increase in project development and annual costs + 50% decrease in transport cost savings + 50% decrease in transport demand
67.13 7.82 59.31 8.6
PVB, PVC and NPV are discounted present values (in US $m), in 2013 prices and value
7.6 Appraisal Summary Table
The Appraisal Summary Table below (Table 27) summarises the main impact of the project in relation to key project criteria as set out in Section 5.
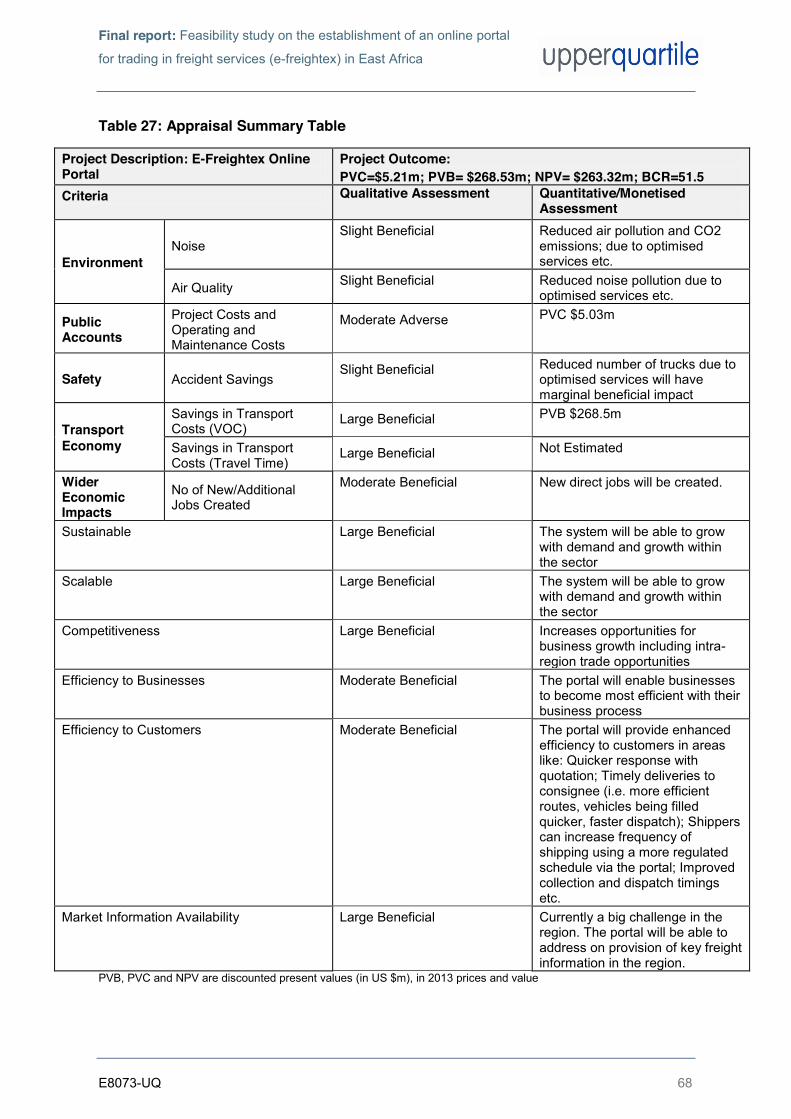
Final report: Feasibility study on the establishment of an online portal
for trading in freight services (e-freightex) in East Africa
E8073-UQ 68
Table 27: Appraisal Summary Table
Project Description: E-Freightex Online Portal
Project Outcome: PVC=$5.21m; PVB= $268.53m; NPV= $263.32m; BCR=51.5
Criteria Qualitative Assessment Quantitative/Monetised Assessment
Environment Noise
Slight Beneficial Reduced air pollution and CO2 emissions; due to optimised services etc.
Air Quality Slight Beneficial Reduced noise pollution due to optimised services etc.
Public Accounts
Project Costs and Operating and Maintenance Costs
Moderate Adverse PVC $5.03m
Safety Accident Savings Slight Beneficial Reduced number of trucks due to
optimised services will have marginal beneficial impact
Transport Economy
Savings in Transport Costs (VOC)
Large Beneficial PVB $268.5m
Savings in Transport Costs (Travel Time)
Large Beneficial Not Estimated
Wider Economic Impacts
No of New/Additional Jobs Created
Moderate Beneficial New direct jobs will be created.
Sustainable Large Beneficial The system will be able to grow with demand and growth within the sector
Scalable Large Beneficial The system will be able to grow with demand and growth within the sector
Competitiveness Large Beneficial Increases opportunities for business growth including intra-region trade opportunities
Efficiency to Businesses Moderate Beneficial The portal will enable businesses to become most efficient with their business process
Efficiency to Customers Moderate Beneficial The portal will provide enhanced efficiency to customers in areas like: Quicker response with quotation; Timely deliveries to consignee (i.e. more efficient routes, vehicles being filled quicker, faster dispatch); Shippers can increase frequency of shipping using a more regulated schedule via the portal; Improved collection and dispatch timings etc.
Market Information Availability Large Beneficial Currently a big challenge in the region. The portal will be able to address on provision of key freight information in the region.
PVB, PVC and NPV are discounted present values (in US $m), in 2013 prices and value
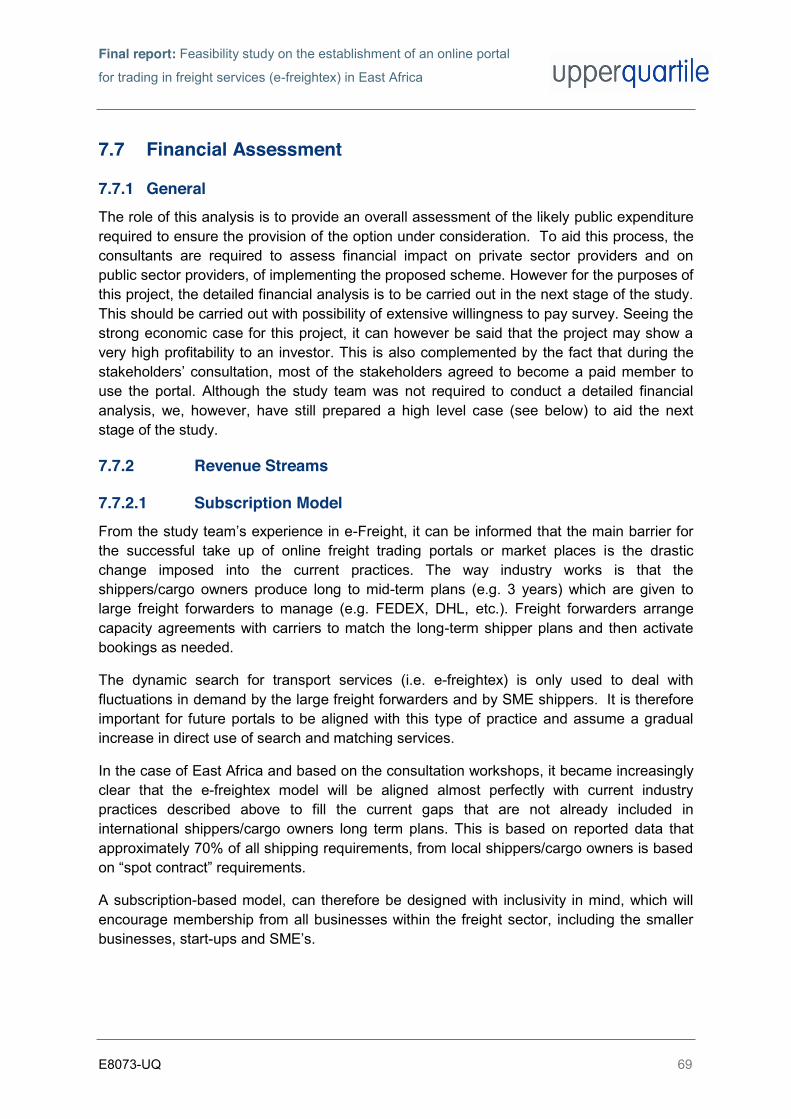
Final report: Feasibility study on the establishment of an online portal
for trading in freight services (e-freightex) in East Africa
E8073-UQ 69
7.7 Financial Assessment
7.7.1 General The role of this analysis is to provide an overall assessment of the likely public expenditure required to ensure the provision of the option under consideration. To aid this process, the consultants are required to assess financial impact on private sector providers and on public sector providers, of implementing the proposed scheme. However for the purposes of this project, the detailed financial analysis is to be carried out in the next stage of the study. This should be carried out with possibility of extensive willingness to pay survey. Seeing the strong economic case for this project, it can however be said that the project may show a very high profitability to an investor. This is also complemented by the fact that during the stakeholders’ consultation, most of the stakeholders agreed to become a paid member to use the portal. Although the study team was not required to conduct a detailed financial analysis, we, however, have still prepared a high level case (see below) to aid the next stage of the study.
7.7.2 Revenue Streams
7.7.2.1 Subscription Model From the study team’s experience in e-Freight, it can be informed that the main barrier for the successful take up of online freight trading portals or market places is the drastic change imposed into the current practices. The way industry works is that the shippers/cargo owners produce long to mid-term plans (e.g. 3 years) which are given to large freight forwarders to manage (e.g. FEDEX, DHL, etc.). Freight forwarders arrange capacity agreements with carriers to match the long-term shipper plans and then activate bookings as needed.
The dynamic search for transport services (i.e. e-freightex) is only used to deal with fluctuations in demand by the large freight forwarders and by SME shippers. It is therefore important for future portals to be aligned with this type of practice and assume a gradual increase in direct use of search and matching services.
In the case of East Africa and based on the consultation workshops, it became increasingly clear that the e-freightex model will be aligned almost perfectly with current industry practices described above to fill the current gaps that are not already included in international shippers/cargo owners long term plans. This is based on reported data that approximately 70% of all shipping requirements, from local shippers/cargo owners is based on “spot contract” requirements.
A subscription-based model, can therefore be designed with inclusivity in mind, which will encourage membership from all businesses within the freight sector, including the smaller businesses, start-ups and SME’s.

Final report: Feasibility study on the establishment of an online portal
for trading in freight services (e-freightex) in East Africa
E8073-UQ 70
A fair and inclusive structure will consider, fair and affordable pricing, value for money features, with a minimum set of features for all members which provides each member with an equal opportunity to list loads and bid on loads on a fair and transparent platform.
Please see below a brief description of possible subscription models for consideration.
“Pay As You Go” Model - This model would see users signing up for free or paying a small administration charge for membership, followed by an “eBAY type” model requiring users to pay per listing. This model can become quite complex to administrate and maybe perceived as being unfairly funded by users who are listing services. There could be a hybrid version of pay as you go, which suggests a minimum subscription fee for all members, then a pay per listings for users who are creating listing for loads to sell or loads to buy.
“Fixed Fee” Model - This model would see a fixed fee for all users irrespective of the size of the company, number of users or turnover of business. There is a perception that larger companies with a high number of concurrent users and high level of listings activity, can exploit this model gaining a competitive advantage over smaller companies, who may only have one or two users with significantly fewer listings.
“Tiered Membership” Model - This model allows users to select a tier based on their budget and business requirements choosing from a progressively increasing price points. Subscription tier can be based on number of users, number of administrators, volume of activity and added value features.
TABLE 28: Example of a Tier subscription Freight Exchange model
Features Bronze US$ Free (Trial 1 month)
Silver US$ 45.00
Gold US$ 75.00
Platinum US$ 99.00
No of users 1 users 3 Users Unlimited Unlimited
No of Admins 1 Admin 1 Admin 5 Admins 10 Admins
Listings per Month
3 Listings 20 Unlimited Unlimited
Reports and Alerts
No No Yes Yes
Featured Listings No No No Yes
Top ranked Member Highlight
No No No Yes
Subscription Model Example
TMEA may require the portal to be priced fairly with inclusivity and transparency in mind to encourage as many businesses within the sector to subscribe, we would recommend that a tiered subscription model for e-freightex such as the one above can be built. This would

Final report: Feasibility study on the establishment of an online portal
for trading in freight services (e-freightex) in East Africa
E8073-UQ 71
allow businesses to try and explore the commercial advantages (both tangible and intangible benefits) of using such a portal, and then sign up based on their business size and number of users and turnover. Allowing SME’s, start-up’s and larger business to all benefit from becoming members.
We have made the assumption that over a 15 year period, there will be a up to 2000 subscription as a minimum. This figure is based on experiential evidence from the different associations representatives, speaking on behalf of their members. Each association suggested that they would expect over 30% of their members will want to join, this came from discussion in Mombasa and Tanzania, which included the Shipping Agents Association, Road transport Association, Truck Owners Association and DHL.
A more accurate study of the true numbers of paid subscribers will need to be done at the next stage of the study and this will need to be stated as an outcome with the final ToR for the next phase.
Based on the assumptions of an overall 2000 membership subscription, we then created a break even subscription model (see Annex 8 in Volume II of the report that sets out an example of a subscription break even model) to identify the minimum numbers of subscription, which will be need from year one to bring the operation of the e-Freightex Portal to a break even point.
To get to this point we needed to identify the yearly fixed cost of running the portal. These cost are shown in the table below. Please note though that this only shows a cost for Year 1 (also See Table 10). However, the average cost from Year 1-3 is estimated at $562968.00.
TABLE 29: Opening Year 1 (2014) Project Costs (US$)
Type Cost (US$)
Hosting costs 21000
Administration staff costs 125000
Software support and maintenance 66792
Payment Transaction Charges 23,300
Management and administration overheads 342140
Total (US$) 578,232
Once the average costs were estimated, we then ran the break even model showing what the monthly cost would look like if we started with 2000 subscriptions going down to 100 subscriptions. The formula (Yearly cost divided by number of subscribers divided by 12) gives an indication of the subscription which should be charged based on subscriber numbers to get the business to break even.
Table 30 below shows that if the subscription rate was at US$ 45.00 per month, then there will need to be a minimum 1050 paid subscribers to ensure that the business was achieving

Final report: Feasibility study on the establishment of an online portal
for trading in freight services (e-freightex) in East Africa
E8073-UQ 72
break even. This is based on the average yearly fixed cost of $562,968 between Year 1-3. If the numbers of subscribers increase during this period then the business goes into profitability, if the 1050 number of subscribers target is not met then the business goes into losses.
TABLE 30: Breakeven Cost of Subscription Model for Year 1 to Year 3
Average total Operating Cost per
annum in US$ Fee in US$ per Subscription
Break Even Point per Subscribers
562968 23 2000
562968 31 1500
562968 39 1200
562968 45 1050 562968 59 800
562968 78 600
562968 117 400
562968 156 300
562968 188 250
562968 235 200
562968 313 150
562968 469 100
Based on the above one can see that the recommended paid entry point of the Silver Package could to be set at US$ 45.00 per month. This however is dependent on a minimum of 1050 subscribers on-board for the operation to get to a break even state. The exact subscription fee will also need to be included as an outcome requirement in the ToR for the next stage of the project.
Ignoring inflation, from year 4 to 6 - as cost go up the subscription numbers needs to go up to 1275 to maintain break even and similarly from year 7-9 the subscription numbers need to be at 1450 to keep the entry price at the magic price US$ 45.00 per month (see Annex 8 in Volume II of the report that sets out an example of the full break even model from year 1 through to 15).
It should also be noted that the magic entry price at US$ 45.00 per month is based on several factors. These include - features the portal will provide which are bespoke for the region. The fact that is it based in the EAC compared to other portals globally and the prices points in the EU, which range from US$ 10 to US$ 120. Lacking affordability by smaller businesses if the price was higher. One also needs to consider that the business will need
Final report: Feasibility study on the establishment of an online portal
for trading in freight services (e-freightex) in East Africa
E8073-UQ 73
to become profitable therefore leaving some room for increasing number of subscriptions without increasing fixed cost, to provide the operators with the opportunity for gross profit margins.
When preparing the business plan at the next stage, the consultant may want to increase this figure or, reduce the fixed yearly cost of regional staff and the cost of the central office, so that they can go into profitability with a lower number of subscribers. Based on the example above, the key to profitability and success of the portal from a commercial perspective is to get 1000 subscribers on board in Year one.
7.7.2.2 Fee-based Model The alternative to the subscription model is a fee-based model where the operator charges a percent (%) fee on the value of each successful transaction arranged via the e-freightex.
It should however be noted that:
The adoption of subscription fees rather than transaction fees is predominant across established freight exchanges around the world.
Reliance on transaction fee information requires a higher level of contractual agreement with users.
Tracking transaction values “in the real world” would require the freight exchange solution to track the process of payment and would essentially need to provide the payment process for all freight – this level of complexity was discussed in our workshops and rejected by stakeholders.
Monitoring and policing these offline transactions would be challenging and threaten the value of the reputation process.
Working this way moves the freight exchange portal to a freight auction site, which is quite different, particularly in relation to the legal framework of legally binding auctions. The development and management would be more complex hence increasing both the cost overall.
The operator would be no longer working with a target number of paid users, instead targeting transactions and values, which is less predictable.
For the purposes of this feasibility study the consultants have followed the predominant model in the industry and chosen to follow a subscription model rather than one based on transaction fees.
7.7.2.3 Advertising Revenues The To-Be BPM documentation includes provision to allow suppliers and other e-freightex users to advertise or promote their services.

Final report: Feasibility study on the establishment of an online portal
for trading in freight services (e-freightex) in East Africa
E8073-UQ 74
Advertising sales revenue could come from a wide variety of opportunities including directory listings, “featured” or “promoted” items, or even simply the use of a service like Google AdSense to display relevant adverts on the e-freightex website. The Operator will be responsible for reviewing the desirability and value of any advertising services they choose to implement.
For the purposes of this Feasibility Study we have chosen not to include any revenue streams for advertising; this allows us to take the least optimistic view in considering the financials for the e-freightex.
7.8 E-Freightex Ownership, Management and Regulation Options
7.8.1 Options for Ownership, Management and Regulation of e-freightex For the proposed e-freightex portal, the configurations of the various roles (including ownership, management, regulation etc.) will be highly dependent on the needs and requirements of the stakeholders and will most likely be driven by the national interests in the adoption of a particular model.
In general the following four potential ownership and management options are considered27:
Option 1: Stakeholder-owned private company - A private company owned by representatives from the region and company ownership will comprise of key stakeholders from the region including the importers, the EAC and forwarding agents. This model would be ideal since it will assign the responsibilities of running the company in the hands of an experienced institution that has the relevant capabilities and interests. A similar model is used in the settlement of tea at the Mombasa auction. Members representing key stakeholders within the tea value chain own the East African Tea Trade Association (EATTA).
Option 2: Outsourced to a private operator, with an oversight committee - A private operator run the e-freightex for profit but under oversight committee or board comprised of stakeholders. This structure would reduce undue influence from any key stakeholders, as the outfit will be run as a separate private owned entity. The main advantage of such a model would be the fact that the company chosen would have adequate experience and possibly adequate financial backing to handle the risks involved.
Option 3: EAC Secretariat Managed and Operated - EAC through an appointed committee would operate after a private company develops the e-freightex portal. This model should work well in conjunction with any of the other options outlined in this section in terms of the day-to-day management and operation; and
Option 4: Inter-governmental organisation - Similar to the EAC owned and operated model but would involve government ownership where representatives seconded by each of the EAC member states manage the company. The advantage
27 ASSET, TMEA
Final report: Feasibility study on the establishment of an online portal
for trading in freight services (e-freightex) in East Africa
E8073-UQ 75
of this structure is that the governments, which would consider this a national initiative and possibly fund its operations and maintain ownership. The costs would thus end up being lower in the long run.
Therefore the potential e-freightex portal allows a number of different options for its ownership and management but the best option of course will depend on the consensus of the various stakeholders.
To this regard, the stakeholders were presented with all the above-mentioned four options and were asked to vote for their preferred option. 83% of the stakeholders who voted preferred Option 2 i.e. the portal should be owned and managed by a private company. This was followed by 14% of stakeholders who went for Option 1 and a meagre 3% preferred Option 4. Based on stakeholders’ feedback, our recommendation is to opt for Option 2 for e-freightex’s ownership, management and regulation. However, further details on hosting country etc. should be decided in the next stage of the study, as the portal should be aimed to provide a balance between security, quality and value for money for users.

Final report: Feasibility study on the establishment of an online portal
for trading in freight services (e-freightex) in East Africa
E8073-UQ 76
8. CONCLUSIONS AND RECOMMENDATIONS
8.1 Conclusions
This study’s key objective was to carry out scoping and appraisal work for the development of an online portal for trading in freight services in East Africa. The study also identified potential interventions for e-freightex portal’s implementation and helped elicit questions such as whether there is enough demand for such a service and why some private sector attempts failed in developing the online portal. The study’s main conclusions are summarized as below
Clearing of goods from ports takes 4-6 times more than in Europe, US, Hong Kong (<5 Days);
Cost of importing and exporting a container in the region is much higher (5-10 times) than countries like China;
Inland transport costs can represent 5 to 15 times the sea freight charges;
E-Freightex could reduce transport costs and time for importers/exporters; increased business (and hence profit) for transport companies (e.g. increased truck load factors) and service providers; and increased profit for operators (subscription charges, advertisement, market intelligence etc.);
Stakeholders would Prefer Type 3 e-freightex;
The study showed a strong project economics for the project; and
The stakeholders would prefer the e-freightex to be owned and managed by a private company with an oversight committee.
8.2 Recommendations
The study’s key recommendations are as follows:
TMEA should aim to get a financial business case for the next stage of the project. Through market research, the consultant’s for the next stage of the project should estimate an accurate number of users/members who will use the online portal. A willingness to pay survey should also be carried out to estimate optimal subscription charges for use of the portal;
TMEA should take a decision on whether they want to buy the e-freightex portal or would rather build one from scratch (See Section 6). This is because a build decision could provide e.g. maximum flexibility in terms of addressing requirements (purpose built), maximise ownership, maximise integration with other existing software solutions of the region etc.;
Once/if a build viz-à-viz buy decision is taken, TMEA should also decide on the type of ownership and management model it would prefer for the portal. The same can be set out in the proposed ToR (for the next stage) for the design and development of e-freightex solution.