Favorable Outcome Presentation 06 25 14 final
25
© 2014 Iron Mountain Incorporated. All rights reserved. Iron Mountain and the design of the mountain are registered trademarks of Iron Mountain Incorporated. All other trademarks and registered trademarks are the property of their respective owners. REIT Conversion to Enhance Stockholder Returns June 26, 2014
-
Upload
ironminc -
Category
Investor Relations
-
view
460 -
download
2
Transcript of Favorable Outcome Presentation 06 25 14 final
© 2014 Iron Mountain Incorporated. All rights reserved. Iron Mountain and the design of the mountain are registered trademarks of Iron Mountain Incorporated.
All other trademarks and registered trademarks are the property of their respective owners.
REIT Conversion to Enhance Stockholder Returns
June 26, 2014
2
Safe Harbor Language and Reconciliation of Non-GAAP Measures Safe Harbor Statement Under the Private Securities Litigation Reform Act of 1995:
This presentation contains certain forward-looking statements within the meaning of the Private Securities Litigation Reform Act of 1995 and other securities laws and is subject to
the safe-harbor created by such Act. Forward-looking statements include our financial performance outlook and shareholder returns in 2014 through 2016 and statements
regarding our operations, economic performance, financial condition, goals, beliefs, future growth strategies, investment objectives, plans and current expectations, such as our
proposed conversion to a REIT and the anticipated benefits of such conversion, including the opportunity to create value by acquiring leased space, our potential for a broadened
investor base and enhanced valuations and the estimated range of our remaining earnings and profits distribution. These forward-looking statements are subject to various known
and unknown risks, uncertainties and other factors. When we use words such as "believes," "expects," "anticipates," "estimates" or similar expressions, we are making forward-
looking statements. You should not rely upon forward-looking statements except as statements of our present intentions and of our present expectations, which may or may not
occur. Although we believe that our forward-looking statements are based on reasonable assumptions, our expected results may not be achieved, and actual results may differ
materially from our expectations. Important factors that could cause actual results to differ from our other expectations include, among others: (i) the actual 2014 Special
Distribution and our expected full-year 2014 minimum annual distribution as a REIT may be materially different from our estimates (ii) the cost to comply with current and future
laws, regulations and customer demands relating to privacy issues; (iii) the impact of litigation or disputes that may arise in connection with incidents in which we fail to protect our
customers' information; (iv) changes in the price for our storage and information management services relative to the cost of providing such storage and information management
services; (v) changes in customer preferences and demand for our storage and information management services; (vi) the adoption of alternative technologies and shifts by our
customers to storage of data through non-paper based technologies; (vii) the cost or potential liabilities associated with real estate necessary for our business; (viii) the
performance of business partners upon whom we depend for technical assistance or management expertise outside the U.S.; (ix) changes in the political and economic
environments in the countries in which our international subsidiaries operate; (x) claims that our technology violates the intellectual property rights of a third party; (xi) changes in
the cost of our debt; (xii) the impact of alternative, more attractive investments on dividends; (xiii) our ability or inability to complete acquisitions on satisfactory terms and to
integrate acquired companies efficiently; (xiv) other trends in competitive or economic conditions affecting our financial condition or results of operations not presently
contemplated; and (xv) other risks described more fully in our Annual Report on Form 10-K filed on February 28, 2014 under “Item 1A. Risk Factors” and other documents that we
file with the SEC from time to time. Except as required by law, we undertake no obligation to release publicly the result of any revision to these forward-looking statements that
may be made to reflect events or circumstances after the date hereof or to reflect the occurrence of unanticipated events.
Reconciliation of Non-GAAP Measures:
Throughout this presentation, Iron Mountain will be discussing Adjusted Operating Income Before Depreciation, Amortization and Intangible Impairments (Adjusted OIBDA), Free
Cash Flows Before Acquisitions & Discretionary Investments (FCF) and Adjusted Earnings Per Share from Continuing Operations (Adjusted EPS), which do not conform to
accounting principles generally accepted in the United States (GAAP). For additional information and the reconciliation of these measures to the appropriate GAAP measure, as
required by Securities and Exchange Commission Regulation G, please access the Supplemental Data link on the Investor Relations page of the Company’s website at
www.ironmountain.com.

3
Diversified Global Business
$3B annual revenues
>155,000 customers
Serving 95% of Fortune 1000
67MM SF of real estate in >1,000 facilities
Compelling Customer Value Proposition
Reduce costs and risks of storing and protecting information assets
Broadest range of footprint and services
Most trusted brand
Leading Global Presence
36 Countries
5 Continents

4
Large & growing
59% of revenues ($1.8B)
4% constant dollar growth
GDP correlated & inflation hedged
Diversified customer base
No customer >2% of total revenues
Low customer turnover (<2% per annum)
Strong value proposition with related services
Long average life of a box in storage (~15 yrs)1
Storage Rental Stream is Key Economic Driver
(1) Based on annual volume churn rate of ~7%
25 Consecutive Years of
Storage Rental Growth
$1,785
2013 Storage Rental ($MM)

5
Strategy to Extend Durability of Business
Speed and Agility Simplification, Process Automation and Efficiency
Developed
Markets Drive Profitable Revenue
Growth; Grow Tape and
Cube Volume
Strategic Plan
Emerging Markets Expand and Leverage
Emerging
Businesses Identify, Incubate,
Scale or Scrap
Organization and Culture Organizational Capabilities, Talent and Processes
CO
RE
PIL
LA
RS
E
NA
BL
ER
S

6
Low-volatility, Moderate Growth with Attractive Yield
Driving Total Shareholder Returns - projected to be between 8% to 9%
$919
$50-$75
$20-$45 $20-$30 $1,010 - $1,070
Adj. OIBDA 2013 Base Incremental M&A Speed and Agility Adj. OIBDA 2016 E
2013 excludes restructuring charges
ROIC 9.7% 9% - 10%
Avg. Inv. Capital
~$5.5B ~$6.3B
($MM)

7
REIT Conversion Highlights
Began operating in manner consistent with REIT effective 1/1/2014
REIT structure aligns with operating strategy
Capital allocation as a REIT to include real estate acquisitions
Significant stockholder benefits from REIT structure
Next Steps as a REIT and Updated 2014 Guidance

8
Required PLRs and unanimous board approval received
Will elect REIT status for 2014
Will file registration statement with SEC and hold special meeting for stockholder approval of typical REIT ownership limitations
Total REIT costs to date in line with expectations
REIT will enhance stockholder value through significant increase in annual dividend
REIT Conversion On Track for 2014
$0.00
$0.20
$0.40
$0.60
Quarterly Dividends per Share (normalized)
Regular C-Corp Dividend Estimated Dividend as a REIT
2014 reflects projected REIT dividend and assumes midpoint of the range

9
Able to execute strategy within REIT framework
Significant global real estate footprint – over 1,000 facilities in 67MM square feet worldwide
Successfully structured the business to deliver services and aligned international businesses within structure
REIT Structure Aligns with Operating Strategy

10
-6%
-4%
-2%
0%
2%
4%
6%
8%
10%
2007 2008 2009 2010 2011 2012 2013
Same Store NOI Growth (Historical)
Industrial average
Self-storage average
IRM storage rental internal growth
Storage Rental Revenue is Stable Throughout Cycles
Source: Benchmark data provided by Green Street Advisors
IRM average internal storage rental revenue growth

11
“Enterprise Storage” Compares Favorably
Iron Mountain Self-Storage Industrial
North America annual rental revenue/SF $27.00 $13.80 $5.50
Tenant Improvements/SF N/A N/A $1.96
CapEx(1) ~7% 5.3% 12%
Average lease term Large customers: 3 Yrs.
Small customers: 1 Yr. Month-to-Month ~4-6 Yrs.
Customer retention ~98% ~85% ~75%
Customer concentration Very Low Very Low Low
Customer type Business Consumer Business
Non-Real Estate %(2) 30% 20% 10%
Stabilized Occupancy (building & racking utilization) Building: 80% to 85%
Racking: 90% to 95% 90% 93%
Operating Margin(3) Storage: 70% - 75% 68% 70%
(1) IRM CapEx includes maintenance and growth CapEx; excludes Real Estate and REIT costs as a percentage of total revenue. Self-Storage and Industrial recurring
CapEx as a percentage of NOI. Excludes leasing commissions.
(2) Non-Real Estate % for IRM is as a % of Adj. OIBDA. Self-Storage and Industrial are as a % of Assets.
(3) Operating margin for IRM is storage gross margin.
Source: Company estimates. Benchmark data provided by Green Street Advisors

12
Illustrative North America RM Storage
Annual Economics(1) (per square foot, except for ROIC)
Investment
Customer acquisition $ 42
Building and outfitting 54
Racking structures 54
Total investment $ 150
Storage Rental Income
Storage rental revenue $ 27
Direct operating costs (3)
Allocated field overhead (3)
Storage rental income $ 21
Pre-Tax Storage Rental ROIC(2) ~14%
High storage rental revenues per square foot
Storage rental value creation drivers
Facility design expertise
Network utilization
Portfolio management of multiple tenants
Related services
High-Return Storage Rental Businesses Creates Significant Value
(1) Reflects average portfolio pricing and assumes an owned facility (2) Includes maintenance CapEx, assumed at 2% of revenue
13
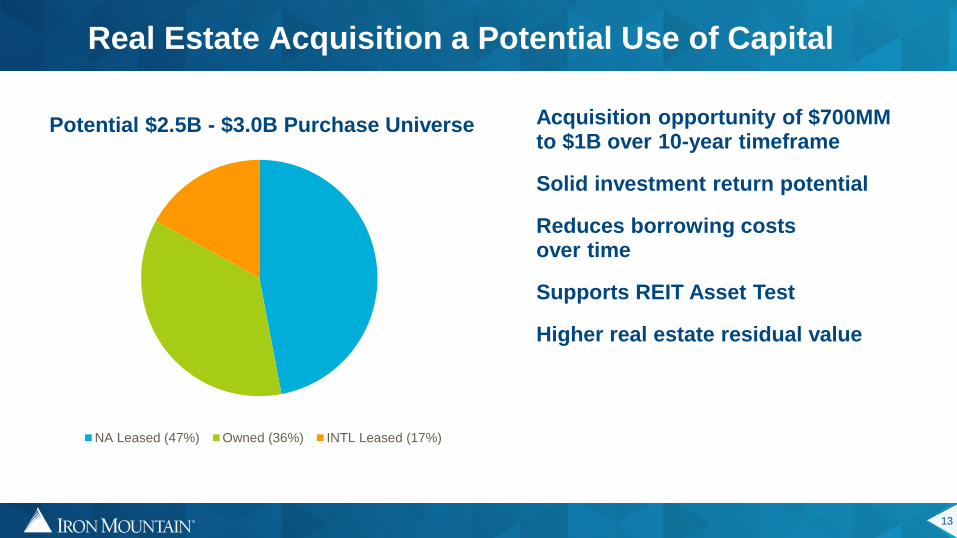
NA Leased (47%) Owned (36%) INTL Leased (17%)
Acquisition opportunity of $700MM to $1B over 10-year timeframe
Solid investment return potential
Reduces borrowing costs over time
Supports REIT Asset Test
Higher real estate residual value
Real Estate Acquisition a Potential Use of Capital
Potential $2.5B - $3.0B Purchase Universe

14
2.0
3.0
4.0
5.0
6.0
2007 2008 2009 2010 2011 2012 2013 2014 2015 2016
Target Range
Stockholder Payouts, REIT Costs & Distributions Have Temporarily Increased Leverage
$MM 2010 - 11 2012 2013 2014 E Total
Share Repurchases $1,097 $38 --- --- $1,135
Quarterly Dividends $211 $179 $207
$400 - $420
$997 - $1,017
Special Div./Dist. --- $140 --- $120 - $140 $260 - $280
Total Cash $1,308 $357 $207 $520 - $560 $2,392-$2,432
Special Stock Dist. --- $560 --- $480 - $560 $1,040-$1,120
Total Value
Distributed to
Shareholders
$1,308 $917 $207 $1,000-$1,120 $3,432-$3,552
Other Expenditures (1) --- $127 $159 $109-$139
2010 - 2014 Estimated Distributions ($MM)
(1) Represents REIT costs
(2) As defined under company’s senior credit facility, assumes no equity issuances
Net Lease Adjusted Leverage Ratio(2)
15
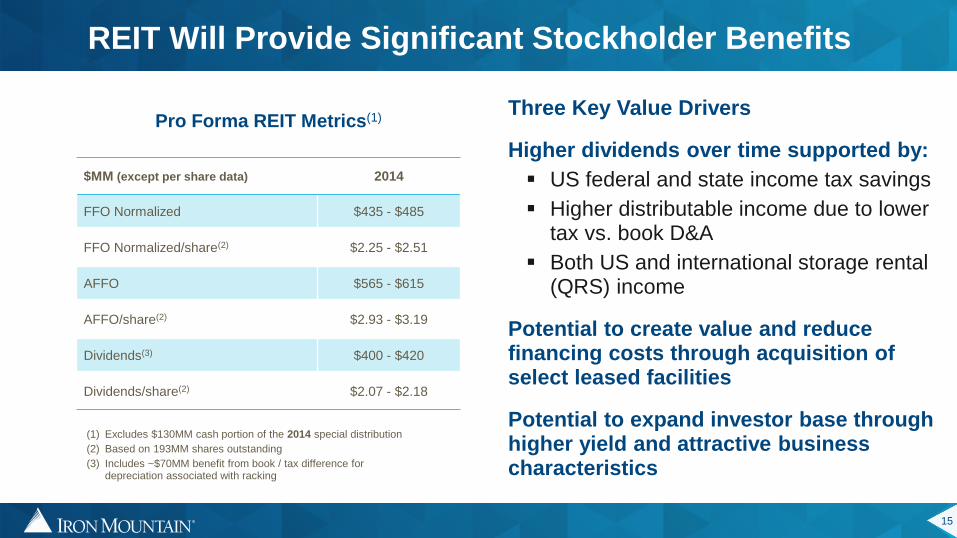
$MM (except per share data) 2014
FFO Normalized $435 - $485
FFO Normalized/share(2) $2.25 - $2.51
AFFO $565 - $615
AFFO/share(2) $2.93 - $3.19
Dividends(3) $400 - $420
Dividends/share(2) $2.07 - $2.18
Pro Forma REIT Metrics(1)
Three Key Value Drivers
Higher dividends over time supported by:
US federal and state income tax savings
Higher distributable income due to lower tax vs. book D&A
Both US and international storage rental (QRS) income
Potential to create value and reduce financing costs through acquisition of select leased facilities
Potential to expand investor base through higher yield and attractive business characteristics
REIT Will Provide Significant Stockholder Benefits
(1) Excludes $130MM cash portion of the 2014 special distribution
(2) Based on 193MM shares outstanding
(3) Includes ~$70MM benefit from book / tax difference for depreciation associated with racking

16
• File registration statement with SEC
• Special meeting to approve typical REIT ownership limitations
• Regular dividend of $400MM - $420MM
• Remaining Special Distribution of ~$600MM - $700MM to be distributed by year end
• 20% cash / 80% stock likely
What’s Next with the REIT?
Cash Stock Total
Regular
Dividend $410 -- $410
Special
Distribution $130 $520 $650
Total $540 $520 $1,060
2014 Expected Payouts (midpoints of ranges)
17
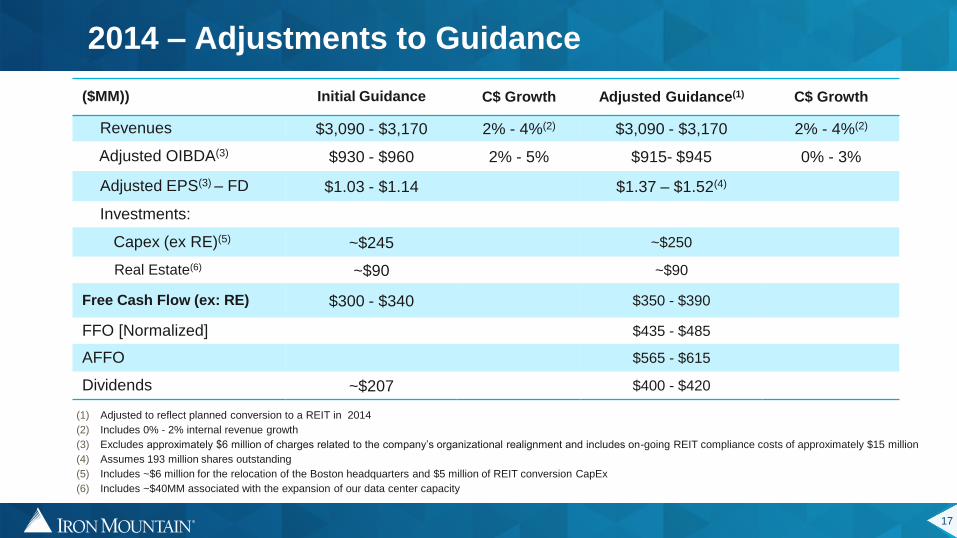
(1) Adjusted to reflect planned conversion to a REIT in 2014
(2) Includes 0% - 2% internal revenue growth
(3) Excludes approximately $6 million of charges related to the company’s organizational realignment and includes on-going REIT compliance costs of approximately $15 million
(4) Assumes 193 million shares outstanding
(5) Includes ~$6 million for the relocation of the Boston headquarters and $5 million of REIT conversion CapEx
(6) Includes ~$40MM associated with the expansion of our data center capacity
($MM)) Initial Guidance C$ Growth Adjusted Guidance(1) C$ Growth
Revenues $3,090 - $3,170 2% - 4%(2) $3,090 - $3,170 2% - 4%(2)
Adjusted OIBDA(3) $930 - $960 2% - 5% $915- $945 0% - 3%
Adjusted EPS(3) – FD $1.03 - $1.14 $1.37 – $1.52(4)
Investments:
Capex (ex RE)(5) ~$245 ~$250
Real Estate(6) ~$90 ~$90
Free Cash Flow (ex: RE) $300 - $340 $350 - $390
FFO [Normalized] $435 - $485
AFFO $565 - $615
Dividends ~$207 $400 - $420
2014 – Adjustments to Guidance

© 2014 Iron Mountain Incorporated. All rights reserved. Iron Mountain and the design of the mountain are registered trademarks of Iron Mountain Incorporated.
All other trademarks and registered trademarks are the property of their respective owners.
Appendix
19
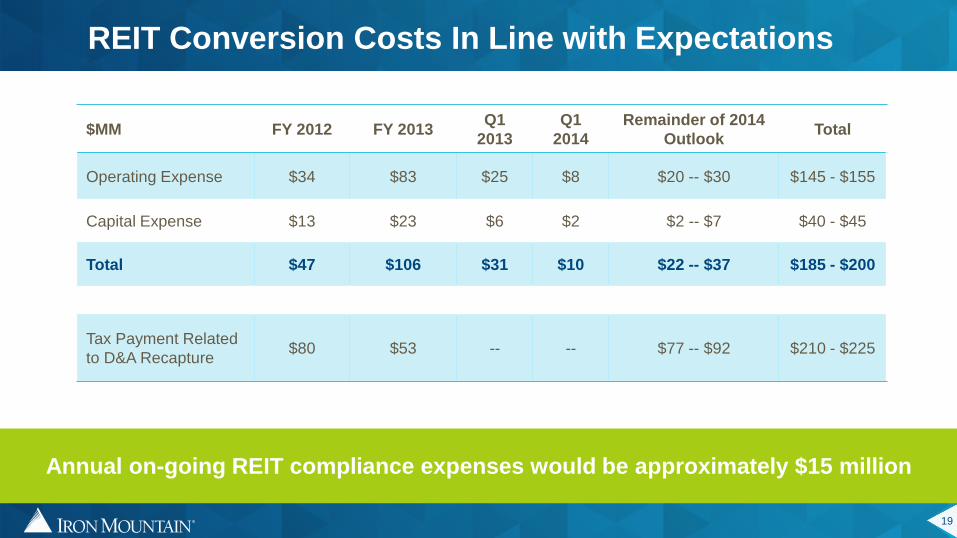
REIT Conversion Costs In Line with Expectations
$MM FY 2012 FY 2013 Q1
2013
Q1
2014
Remainder of 2014
Outlook Total
Operating Expense $34 $83 $25 $8 $20 -- $30 $145 - $155
Capital Expense $13 $23 $6 $2 $2 -- $7 $40 - $45
Total $47 $106 $31 $10 $22 -- $37 $185 - $200
Tax Payment Related
to D&A Recapture $80 $53 -- -- $77 -- $92 $210 - $225
Annual on-going REIT compliance expenses would be approximately $15 million

20
2014 Adjusted OIBDA to Net Income (REIT basis)
(1) Excludes approximately $30 costs associated with the company’s REIT conversion (“REIT Costs”)
(2) Based on an estimated 193 million shares outstanding.
($MM, except per share data) FY 2014 Outlook
Adjusted OIBDA $915 - $945
Less: Depreciation & amortization $344 - $342
Less: Interest expense $252 - $250
Pre-tax income $319 - $353
Less Income tax expense of ~17% $54 - $60
Consolidated net income(1) $265 - $293
Adjusted EPS(2) – FD $1.37 - $1.52

21
REIT Supported By Strong Cash Flow
FFO 2014 Pro forma Estimate*
Net income attributable to Iron Mountain (pro forma) $ 250
Real estate depreciation 180
(Gain) Loss on disposal/write-down of PP&E ----
FFO (NAREIT) $ 430
REIT Costs 30
Normalized FFO (Iron Mountain) $ 460
AFFO 2014 Pro forma Estimate*
Normalized FFO (Iron Mountain) $ 460
Non-real estate depreciation 120
Amortization expense (including deferred financing costs) 65
Rent normalization 5
Stock option compensation expense 30
Business support CapEx (maintenance) (90)
AFFO $ 590
*Metrics represent approximate midpoint of the estimated range
($MM)
22
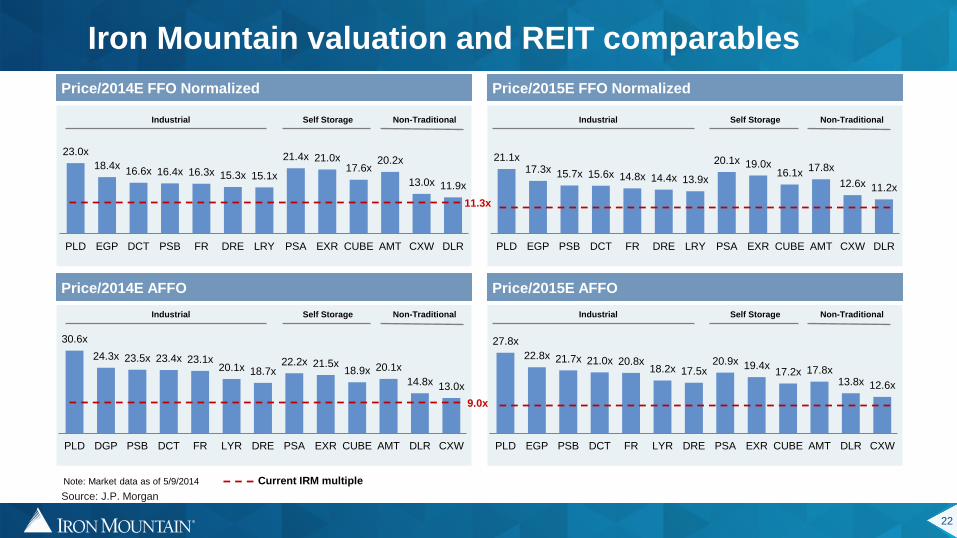
Iron Mountain valuation and REIT comparables
Price/2014E FFO Normalized Price/2015E FFO Normalized
Price/2014E AFFO Price/2015E AFFO
23.0x
18.4x 16.6x 16.4x 16.3x 15.3x 15.1x
21.4x 21.0x 17.6x
20.2x
13.0x 11.9x
PLD EGP DCT PSB FR DRE LRY PSA EXR CUBE AMT CXW DLR
21.1x 17.3x 15.7x 15.6x 14.8x 14.4x 13.9x
20.1x 19.0x 16.1x
17.8x
12.6x 11.2x
PLD EGP PSB DCT FR DRE LRY PSA EXR CUBE AMT CXW DLR
30.6x
24.3x 23.5x 23.4x 23.1x 20.1x 18.7x
22.2x 21.5x 18.9x 20.1x
14.8x 13.0x
PLD DGP PSB DCT FR LYR DRE PSA EXR CUBE AMT DLR CXW
27.8x
22.8x 21.7x 21.0x 20.8x 18.2x 17.5x
20.9x 19.4x 17.2x 17.8x
13.8x 12.6x
PLD EGP PSB DCT FR LYR DRE PSA EXR CUBE AMT DLR CXW
9.0x
11.3x
Industrial Self Storage Non-Traditional Industrial Self Storage Non-Traditional
Industrial Self Storage Non-Traditional Industrial Self Storage Non-Traditional
Note: Market data as of 5/9/2014 Current IRM multiple
Source: J.P. Morgan

23
Global Real Estate Portfolio
As of 3/31/14
Buildings Sq. Ft. Buildings Sq. Ft. Buildings Sq. Ft.
North America 182 19,395 504 30,970 686 50,365
Europe 49 2,412 208 7,427 257 9,839
Latin America 39 1,915 51 2,855 90 4,770
Asia Pacif ic 2 51 69 2,199 71 2,250
International 90 4,379 328 12,481 418 16,860
Total 272 23,774 832 43,451 1,104 67,224
TotalLeased FacilitiesOwned Facilities
Note: numbers may not foot due to rounding

24
Definitions
Funds From Operations, or FFO, and FFO (Normalized)
FFO is a non-GAAP financial measure commonly used in the REIT industry. FFO is defined by the National Association of Real Estate Investment Trusts (NAREIT) and us as net income excluding gains and losses on the sale or write-down of real estate assets plus depreciation on real estate assets. FFO does not give effect to real estate depreciation and amortization because these amounts are computed, under GAAP, to allocate the cost of a property over its useful life. Because values for well-maintained real estate assets have historically increased or decreased based upon prevailing market conditions, we believe that FFO (Normalized) provides investors with a clearer view of our operating performance. Our most directly comparable GAAP measure to FFO (Normalized) is net income attributable to Iron Mountain. Although NAREIT has published a definition of FFO, modifications to the NAREIT calculation of FFO are common among REITs as companies seek to provide financial measures that most meaningfully reflect their business. Our definition of FFO (Normalized) excludes other items that we believe do not appropriately reflect our underlying operations such as intangible impairment charges, other income and expense (including foreign exchange gains and losses), income and losses from discontinued operations, provision or benefit from deferred taxes and REIT Costs.
Adjusted Funds From Operations, or AFFO
AFFO is defined as FFO (Normalized) excluding non-cash rent expense or income, plus depreciation on non-real estate assets, amortization expense (including amortization of deferred financing costs) and non-cash equity compensation expense, less maintenance capital expenditures. We believe AFFO is a useful measure in determining our ability to generate excess cash that may be used for reinvestment in the business, discretionary deployment in investments such as real estate or acquisition opportunities, returning of capital to our stockholders and voluntary prepayments of indebtedness.

25
Definitions
Adjusted OIBDA
Adjusted OIBDA is defined as operating income before depreciation, amortization, intangible impairments, (gain) loss on disposal/write-down of property, plant and equipment, net, and REIT Costs. These measures are an integral part of the internal reporting system we use to assess and evaluate the operating performance of our business. We use multiples of current or projected Adjusted OIBDA in conjunction with our discounted cash flow models to determine our overall enterprise valuation and to evaluate acquisition targets. We believe Adjusted OIBDA provides our current and potential investors with relevant and useful information regarding our ability to generate cash flow to support business investment.
Net Operating Income, or NOI: defined as revenue from rental activities less storage rental costs.
ROIC: defined as net operating profit after tax (NOPAT) plus depreciation & amortization less non-growth CapEx divided by Average Invested Capital. NOPAT is defined as Adjusted OIBDA less depreciation & amortization, at the structural tax rate of approximately 40% for Enterprise, but varies by region. Average Invested Capital is defined as the average of interest bearing debt plus equity less cash plus accumulated depreciation on racking.
Total Shareholder Return (TSR): TSR – Total Shareholder Return is calculated by taking the total dividend yield plus stock appreciation of a three year period (assuming dividends are reinvested at the current year TSR rate using a mid-year convention) divided by the Base Share Price and annualized for the three year period. Base Share Price is approximately $29 and assumes constant multiple of 10.5x.
![Unilateral Choroidal Osteoma with Choroidal Neovascularization...Surgical evacuation of the choroidal neovascular membrane has been reported [12] but the visual outcome was not favorable.](https://static.fdocuments.us/doc/165x107/6053732923e31173be575e28/unilateral-choroidal-osteoma-with-choroidal-neovascularization-surgical-evacuation.jpg)


![CRIP1 expression is correlated with a favorable outcome and ......protein-protein interactions during transcription, immune response, and cytokine expression [6, 7]. Additionally,](https://static.fdocuments.us/doc/165x107/6026c4750c07ba76034bd468/crip1-expression-is-correlated-with-a-favorable-outcome-and-protein-protein.jpg)