
FATIGUE DAMAGE CHARACTERIZATION IN SHORT GLASS FIBER...
8
THE 19 TH INTERNATIONAL CONFERENCE ON COMPOSITE MATERIALS Abstract This paper aims at studying the fatigue damage behavior of injection molded 30%wt-short glass fiber reinforced polyamide-66 composite (PA66/GF30). The dynamic modulus, cyclic creep and temperature field evolutions during fatigue testing were analyzed. Post-mortem 3D damage analysis by X-Ray micro-computed tomography (µCT) of PA66/GF30 were performed to further understand the damage mechanisms during fatigue loading. Results show that the information of dynamic modulus, strain and temperature evolution are important to evaluate the damage evolution. The µCT analysis allows damage mechanisms reconstruction. 1 General Introduction The reduction of vehicle mass is a major concern for automotive industries to comply with the strict pollution regulation, particularly for the CO 2 emission. Fiber reinforced thermoplastic materials are good candidates to provide the required lightweight properties but their structural durability has not yet been fully investigated. In particular further study to comprehend the fatigue damage behavior of these composites is necessary. Various techniques have been used to evaluate the damage in short fiber reinforced composites. Early works of Horst et. al. [1, 2] performed fractography analysis onto the fracture surface of fatigued specimens by scanning electron microscopy (SEM) and they proposed a damage mechanisms scenario which consider that the damage is initialized at fiber ends due to fiber-matrix debonding. The evolution of dynamic modulus, i.e. the slope of stress-strain hysteresis curve, has been proposed by several authors to evaluate the level of damage of the composites [3–8]. Since the damage process is thermally activated, thermography technique by using infra-red camera has become an important tool for fatigue damage evaluation in composites [9–14]. Due to the 3D distribution of damage in such materials, tomography technique has become a suitable tool for fatigue damage characterization in composites [15–17]. During fatigue loading of the composite, some physical phenomena can develop concurrently, such as the damage, cyclic creep and increase of temperature that all can participate to the overall fatigue strength of the material [1, 18, 19]. A comprehensive study of fatigue damage behavior is necessarily being coupled by the analysis of all interrelating phenomena during fatigue loading. The objective of this work is to characterize the fatigue damage mechanisms of PA66/GF30. It is proposed to use the analyses of dynamic modulus, cyclic creep and temperature field evolutions during fatigue testing together with post-mortem 3D damage analysis by X-Ray micro-computed tomography (µCT) to further understand the damage mechanisms during fatigue testing. To evaluate the anisotropic property of PA66/GF30 due the skin- shell-core structure produced by injection molding process [20–22], two specimen directions longitudinal and transverse to the mold flow direction (MFD) are examined. 2 Experimental Methods 2.1 Material The material studied is an injection molded 30%wt of short glass fiber reinforced polyamide-6,6 composites (PA66/GF30) provided by Solvay Engineering Plastics-France. The material is FATIGUE DAMAGE CHARACTERIZATION IN SHORT GLASS FIBER REINFORCED POLYAMIDE-66 M.F. Arif 1 , N. Saintier 2 *, F. Meraghni 1 , Y. Chemisky 1 , J. Fitoussi 3 , G. Robert 4 1 LEM3, Arts et Métiers ParisTech, Metz, France, 2 I2M, Arts et Métiers ParisTech, Bordeaux, France 3 PIMM, Arts et Métiers ParisTech, Paris, France, 4 Solvay Engineering Plastics, Saint-Fons, France *Corresponding author ([email protected] ) Keywords: fatigue, damage mechanisms, X-Ray microtomography, infrared thermography
Transcript of FATIGUE DAMAGE CHARACTERIZATION IN SHORT GLASS FIBER...
THE 19TH INTERNATIONAL CONFERENCE ON COMPOSITE MATERIALS
Abstract
This paper aims at studying the fatigue damage
behavior of injection molded 30%wt-short glass
fiber reinforced polyamide-66 composite (PA66/GF30). The dynamic modulus, cyclic creep
and temperature field evolutions during fatigue
testing were analyzed. Post-mortem 3D damage
analysis by X-Ray micro-computed tomography
(µCT) of PA66/GF30 were performed to further
understand the damage mechanisms during fatigue loading. Results show that the information of
dynamic modulus, strain and temperature evolution
are important to evaluate the damage evolution. The µCT analysis allows damage mechanisms
reconstruction.
1 General Introduction
The reduction of vehicle mass is a major concern for
automotive industries to comply with the strict
pollution regulation, particularly for the CO2
emission. Fiber reinforced thermoplastic materials
are good candidates to provide the required
lightweight properties but their structural durability
has not yet been fully investigated. In particular
further study to comprehend the fatigue damage
behavior of these composites is necessary.
Various techniques have been used to evaluate the
damage in short fiber reinforced composites. Early
works of Horst et. al. [1, 2] performed fractography analysis onto the fracture surface of fatigued
specimens by scanning electron microscopy (SEM)
and they proposed a damage mechanisms scenario which consider that the damage is initialized at fiber
ends due to fiber-matrix debonding. The evolution
of dynamic modulus, i.e. the slope of stress-strain
hysteresis curve, has been proposed by several
authors to evaluate the level of damage of the
composites [3–8]. Since the damage process is
thermally activated, thermography technique by
using infra-red camera has become an important tool
for fatigue damage evaluation in composites [9–14]. Due to the 3D distribution of damage in such
materials, tomography technique has become a
suitable tool for fatigue damage characterization in
composites [15–17].
During fatigue loading of the composite, some
physical phenomena can develop concurrently, such as the damage, cyclic creep and increase of
temperature that all can participate to the overall
fatigue strength of the material [1, 18, 19]. A comprehensive study of fatigue damage behavior is
necessarily being coupled by the analysis of all
interrelating phenomena during fatigue loading.
The objective of this work is to characterize the
fatigue damage mechanisms of PA66/GF30. It is
proposed to use the analyses of dynamic modulus,
cyclic creep and temperature field evolutions during
fatigue testing together with post-mortem 3D
damage analysis by X-Ray micro-computed
tomography (µCT) to further understand the damage
mechanisms during fatigue testing. To evaluate the
anisotropic property of PA66/GF30 due the skin-shell-core structure produced by injection molding
process [20–22], two specimen directions
longitudinal and transverse to the mold flow direction (MFD) are examined.
2 Experimental Methods
2.1 Material
The material studied is an injection molded 30%wt
of short glass fiber reinforced polyamide-6,6
composites (PA66/GF30) provided by Solvay
Engineering Plastics-France. The material is
FATIGUE DAMAGE CHARACTERIZATION IN SHORT GLASS
FIBER REINFORCED POLYAMIDE-66
M.F. Arif1, N. Saintier
2*, F. Meraghni
1, Y. Chemisky
1, J. Fitoussi
3, G. Robert
4
1LEM3, Arts et Métiers ParisTech, Metz, France,
2I2M, Arts et Métiers ParisTech, Bordeaux, France
3PIMM, Arts et Métiers ParisTech, Paris, France,
4Solvay Engineering Plastics, Saint-Fons, France
*Corresponding author ([email protected])
Keywords: fatigue, damage mechanisms, X-Ray microtomography, infrared thermography

presented in the form of rectangular plate with a
thickness of 3.2 mm. This material has a specific microstructure characterized by a skin-shell-core
structure, typical of thermoplastic composites
manufactured by injection molding process [20, 21, 23].
X-ray micro-computed tomography (µCT) technique
was employed to study the microstructure (fiber
orientation) of PA66/GF30. The µCT experiment
was carried out at ID19 beam line of the European
Synchrotron Radiation Facility (ESRF) Grenoble,
France [24]. A voxel resolution of 1.4µm was
achieved by the experimental setup. The µCT
experiment was performed on the sample with dimension of 2 x 2 x 3.2 mm3 that has been extracted
from the unloaded (virgin) specimen. By the current
experimental setup, the thickness scanning was
limited to 2.8 mm so that the final analyzed volume
was 2 x 2 x 2.8 mm3.
The microstructure of PA66/GF30 is shown in Fig.
1. The ImageJ freeware was used to visualize the microstructure. As described in Fig. 1, around 90%
of fibers are located at the shell layer with a global
fiber orientation longitudinal to the mold flow direction (MFD). The core layer represents about
5% of fiber content with a global fiber orientation
perpendicular to the MFD. A random skin layer is formed at the area in direct contact to the mold
surface. The thickness of the skin layer represents
about 5% of fiber content, considering both the
upper and lower skin layers. Although the random
skin layer was developed, the fibers in this layer
seemed to have tendency to orient to the MFD. The
quantitative analysis of the degree of randomness
will be addressed in our next work. The formation of
skin-shell-core layer was only developed through the thickness of the material and no microstructure
heterogeneity was found through the width and
length of the specimen.
Mostly, the fibers orient parallel to the shear flow
direction. The shear flow exists at the zone near to
the wall due to the friction between the polymer melt
and mold wall, whereas the shear flow is zero in the
core zone due to the absence of mold wall friction
influence. This leads fibers to orient parallel to MFD
at the shell zone and perpendicular to MFD at the
core zone. A thin random layers were formed due to
the polymer melt that is in direct contact with the
relatively cold temperature of the mold wall and hence fibers freeze without any preferential
orientations [20].
The µCT 3D image segmentation of the fiber via gray value thresholding was carried out to allow
calculation of fiber dimensions. Avizo and Visilog
softwares were used for this purpose. Based on the
computation result, the fiber average diameter and
length after the injection molding process were 10
and 270 µm, respectively.
Several virgin samples have been observed by µCT
analysis and it was shown that no visible damage is
observed inside the sample which confirms that the initial damage due to the manufacturing process is
negligible.
2.2 Specimens
Specimens used for mechanical characterizations
were machined from the rectangular plate produced
by injection molding process. The specimens were
machined longitudinally and transversely to the MFD, defined hereafter as the longitudinal and
transverse specimens. The description of
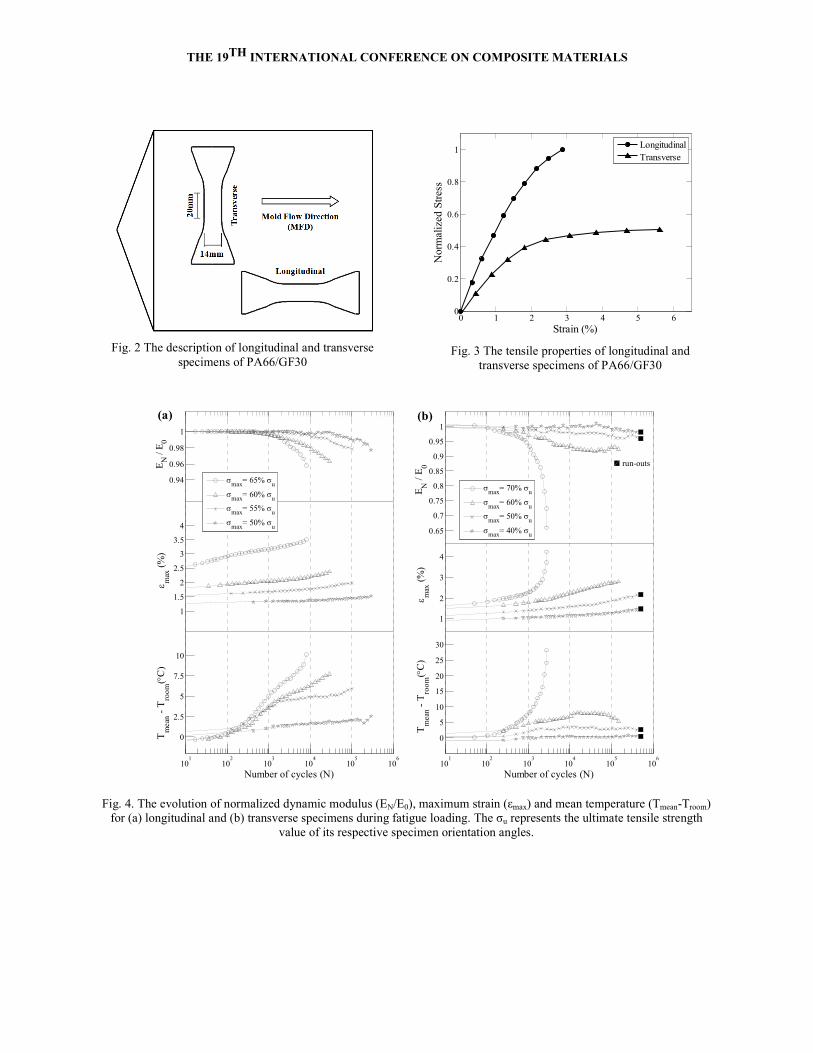
longitudinal and transverse specimens, as well as its main dimensions are illustrated in Fig. 2.
2.3 Experimental procedures
Tensile and fatigue tests were performed on dry as mold PA66/GF30 (<0.2% water content) at room
temperature. Tensile tests were performed upon a
servo-hydraulic machine at a crosshead speed of
1 mm/min, which corresponds to the strain rate of
3x10⁻⁴
s-1
. Fatigue tests were performed by applying
sinusoidal wave, load controlled mode at constant
amplitude. The frequency of 3Hz was chosen in
order to avoid an excessive heating of the
composites. Fatigue strength of the material was evaluated within the range of 103 to 106 cycles.
Fatigue tests were stopped if the specimens didn't
reach final fracture at 5x10⁵ cycles. To prevent
specimens from buckling, the tests were conducted
under tension-tension mode, with a stress ratio
R=0.1. The data of cyclic creep and dynamic
modulus evolution during fatigue loading were
extracted from the servo-hydraulic machine
acquisition software. Continuous temperature
monitoring of the active zone of the specimen was
assured by the CEDIP Jade III MWR infrared
camera with a spectral range between 3.9 and 4.5μm. The µCT analyses were performed on the
samples extracted from the virgin specimen and the
longitudinal and transverse specimens after being subjected into fatigue loading till failure. The sample
dimension and experimental procedures were similar
to those for the microstructure analysis. The fatigue
loaded samples for the µCT analysis were extracted
far from the fracture surface. By segmentation
technique with proper selection of threshold value,
the voids inside the analyzed µCT volume element
can be isolated, thereby the void properties such as
volume, orientation angle and aspect ratio can be quantified. The Avizo and Visilog software were
used for this purpose. In this work, the void aspect
ratio and orientation angle in the shell and core
representative volumes will be presented to confirm
the damage mechanisms in PA66/GF30.
3 Results
3.1 Tensile behavior
The tensile properties of PA66/GF30 are described
in Fig. 3. This figure illustrates the strong anisotropy
effect induced by the injection molding process. The Young modulus and ultimate stress of the
longitudinal specimen are twice than that of the
transverse specimen. On the other hand, the ductility of the longitudinal specimen is half than that of the
transverse specimen. The fiber orientations through
the thickness of the specimen were predominantly
occupied by the shell layer where the fibers are
longitudinally oriented to the MFD. This yields the
shell layer to dominantly govern the tensile behavior
of PA66/GF30.
3.2 Macroscopic fatigue damage evaluation
Fig. 4 illustrates the evolution of the monitored parameters, i.e. normalized dynamic modulus
(EN/E0), maximum strain (εmax) and mean
temperature (Tmean-Troom) for the longitudinal and transverse specimens. During cyclic loading, energy
dissipation can be associated to different phenomena
such as damage development and intrinsic
dissipation (viscous behavior). Part of the energy
dissipation due to the damage development and
viscous effect of the material is turned into heat so
that thermal-viscous-damage coupling can occur
during fatigue loading.
The loss of dynamic modulus can be used as a
damage indicator when considering a classical
damage mechanics framework. For all loading cases encountered in this study, the normalized dynamic
modulus evolution showed a stable value for the first
103 cycles and then decreased more or less
depending on the loading level. In all cases, the
intensity of the normalized dynamic modulus drop
was directly related to the fatigue life of the
specimen.
The evolution of mean temperature exhibited two
regimes. The first one corresponded to a stable normalized modulus, where heat dissipation seemed
to be mostly related to the intrinsic energy
dissipation associated to the viscous nature of the
composite. The second regime was associated to the
beginning of the normalized dynamic modulus drop
and corresponded to an inflexion point on the mean
temperature curve. This regime change can be associated to the fact that the energy dissipation was
not fully dissipated into the heat due to the viscous
nature of composite but also dissipated into a damage development.
In each cycle of a stress controlled fatigue test,
stress-strain hysteresis loop is developed due to the viscous nature of the material. As the number of
cycles increases, cyclic creep occurs, concerning to
the phenomenon where the viscous effect is
accumulated through the increase of overall material
strain such as that of maximum or minimum strain.
As shown in Fig. 4, the maximum strain
continuously increased during fatigue life which
demonstrates that cyclic creep occurred during
fatigue loading. This also demonstrates that the
fatigue energy was partly dissipated into the form of viscous dissipation. While the viscous dissipation
was observed, no particular regime change was
detected, except for the highest loading level of the transverse specimen (σmax=70%σu). One may
consider that the fatigue energy dissipated into the
form of viscous dissipation was weak and thus the
dynamic modulus loss was more governed by the
damage development.
The longitudinal and transverse specimens exhibited
different behavior considering that the thermal-
viscous-damage coupling in longitudinal specimens
was higher than that in transverse specimens. With the stress levels significantly lower than those in
longitudinal specimens, the transverse specimens
generated higher changes in dynamic modulus, strain and temperature. This is due to the fact that in
transverse specimens, the polyamide matrix play
more important role than that of fibers during the
fatigue loading.
It can be summarized that the information of
dynamic modulus is important though it becomes
more difficult to completely comprehend the fatigue
damage behavior without the information of strain
and temperature evolution. The evolution of dynamic modulus is good as a damage indicator,
though in high stress level it may overpredict the
damage evolution due to the high viscous effect
contribution of the composite, such as the one shown
in the highest loading level of the transverse
specimen. In the next subsection, the microscopic
analysis of damage by µCT method will be discussed in order to further comprehend the fatigue
damage behavior in PA66/GF30.
3.3 Microscopic fatigue damage analysis
Based on visual observation of the µCT 3D image,
dark spots and dark line paths were noticed
frequently, either situated along or between the fibers in the damage zone of the fatigue loaded
specimens. Some small local changes of grey levels
in the matrix were also detected, which could be due
to the intrinsic artifact of µCT image or due to the
real matrix morphology or damage. By comparison
to the virgin specimen, the presence of distinctive
dark spots and dark line paths are believed to be
associated to fatigue damage. The dark spot could be
related to the void, whereas dark line path could be related to the interfacial debonding or matrix
cracking.
Damage mechanisms of the fatigue loaded specimens were mainly located along fiber interface
(Fig. 5b), though it is impossible to say if local
damage was adhesive or cohesive. Fiber ends were
found though it didn't necessarily involve in
interfacial debonding (Fig. 5a). Despite the difficulty
to present in 2D image, it was shown that initial
damage appeared in locations where fibers are close
to each other, especially in the region where fiber
fraction is locally higher. The damage then
propagated and coalesced till the final failure. In a particular case, matrix transverse cracks can be
developed, such as the one found in the core layer of
the transverse specimen (Fig. 6). The relatively thin of core layer is believed to bear higher stress level
due to its longitudinal orientation to the loading
direction. Transverse cracks were found to develop
favorably in this region.
The damage mechanisms were confirmed by
evaluating the void aspect ratio vs. orientation of the
µCT volume element. The evaluation was carried
out in every 50µm through the thickness of the µCT
image volume, thus it corresponds to the volume of 50 x 2000 x 2000 µm3 for each analysis. Consistent
trend on void properties was found for all the
examined volume of the samples. As shown in Fig.
7, voids with low aspect ratio were detected in the
unloaded sample. Mostly the voids had very small
volume. This trend was consistent for the skin, shell
and core layers. The voids observed in the unloaded sample could be partly due to the real initial damage
and partly due to the fluctuation of the grey scale. In
longitudinal specimen, the majority of voids in the shell and core layers were oriented at 0o
(longitudinal to MFD) and 90o (transverse to MFD),
respectively (Fig. 8). These orientations are the same
as the fiber orientations in the shell and core layers which mean that the voids, notably those with high
aspect ratio are located along fiber interface in the
form of interfacial debonding. The trend of the
volume was the same as that of aspect ratio, which
demonstrates that the void becomes higher in
volume and elongates due to the fatigue loading. For
the transverse specimen, the voids in the shell and
core layers were both oriented at 90o (transverse to
MFD), as shown in Fig. 9, which shows that interfacial debondings occurred in the shell layer
while transverse crackings were found in the core
layer of the composite. The random skin layer in the longitudinal and transverse specimens possessed the
same behavior as that in shell layer. As discussed in
the section of 2.1, even though the random skin layer
was developed, the degree of randomness was not
high and the fibers in this layer seemed to have
tendency to orient to MFD, which is the same
orientation as that in the shell layer.

4 Conclusions
The fatigue and damage behavior of PA66-GF30 have been studied. The information of dynamic
modulus, strain and temperature evolution are
important to evaluate the damage evolution. The information of dynamic modulus is important
though it becomes more difficult to analyze
unambiguously without the information of strain and
temperature evolution. The evolution of dynamic
modulus is good as a damage indicator, though in
high stress level it may overpredict the damage
evolution due to the high viscous effect contribution
of the composite. The µCT analysis allows damage
mechanisms reconstruction. The initial damage appears in locations where fibers are close to each
other, especially in the region where fiber fraction is
locally higher. The damage then propagates through
fiber interface and coalesces each other till the final
failure. If the local stress distribution is high, the
damage may propagate in the form of transverse
cracks, such as the one observed in the core layer of the transverse specimen.
References
[1] J. J. Horst and J. L. Spoormaker, “Mechanisms of
fatigue in short glass fiber reinforced polyamide 6,”
Polymer Engineering & Science, vol. 36, no. 22, pp.
2718–2726, 1996.
[2] J. J. Horst and J. L. Spoormaker, “Fatigue fracture
mechanisms and fractography of short-glassfibre-
reinforced polyamide 6,” Journal of materials
science, vol. 32, no. 14, pp. 3641–3651, 1997.
[3] A. Ben Cheikh Larbi, K. Sai, H. Sidhom, and D.
Baptiste, “Constitutive Model of Micromechanical
Damage to Predict Reduction in Stiffness of a
Fatigued SMC Composite,” Journal of Materials
Engineering and Performance, vol. 15, no. 5, pp.
575–580, 2006.
[4] L. Toubal, M. Karama, and B. Lorrain, “Damage
evolution and infrared thermography in woven
composite laminates under fatigue loading,”
International Journal of Fatigue, vol. 28, no. 12, pp.
1867–1872, 2006.
[5] H. Nouri, F. Meraghni, and P. Lory, “Fatigue
damage model for injection-molded short glass fibre
reinforced thermoplastics,” International Journal of
Fatigue, vol. 31, no. 5, pp. 934–942, 2009.
[6] E. Mourglia-Seignobos, “Compréhension des
mécanismes physiques de fatigue dans le polyamide
vierge et renforcé de fibres de verre,” INSA Lyon,
2009.
[7] F. Meraghni, H. Nouri, N. Bourgeois, C. Czarnota,
and P. Lory, “Parameters identification of fatigue
damage model for short glass fiber reinforced
polyamide (PA6-GF30) using digital image
correlation,” Procedia Engineering, vol. 10, pp.
2110–2116, 2011.
[8] H. Nouri, C. Czarnota, and F. Meraghni,
“Experimental Parameters Identification of Fatigue
Damage Model for Short Glass Fiber Reinforced
Thermoplastics GFRP,” in Design and Modeling of
Mechanical Systems, M. Haddar, L. Romdhane, J.
Louati, and A. Ben Amara, Eds. Berlin, Heidelberg:
Springer Berlin Heidelberg, 2013, pp. 523–530.
[9] R. Steinberger, T. I. Valadas Leitao, E. Ladstatter,
G. Pinter, W. Billinger, and R. W. Lang, “Infrared
thermographic techniques for non-destructive
damage characterization of carbon fibre reinforced
polymers during tensile fatigue testing,”
International Journal of Fatigue, vol. 28, no. 10, pp.
1340–1347, 2006.
[10] A. Ghorbel, N. Saintier, and A. Dhiab,
“Investigation of damage evolution in short glass
fibers reinforced polyamide 6,6 under tensile
loading using infrared thermography,” Procedia
Engineering, vol. 10, pp. 2123–2128, 2011.
[11] B. Esmaeillou, J. Fitoussi, A. Lucas, and A.
Tcharkhtchi, “Multi-scale experimental analysis of
the tension-tension fatigue behavior of a short glass
fiber reinforced polyamide composite,” Procedia
Engineering, vol. 10, pp. 2117–2122, 2011.
[12] B. Esmaeillou, P. Ferreira, V. Bellenger, and A.
Tcharkhtchi, “Fatigue behavior of polyamide
66/glass fiber under various kinds of applied load,”
Polymer Composites, vol. 33, no. 4, pp. 540–547,
2012.
[13] B. Esmaeillou, P. Fereirra, V. Bellenger, and A.
Tcharkhtchi, “Fatigue damage initiation of a
PA66/glass fibers composite material,” Journal of
Applied Polymer Science, vol. 125, no. 5, pp. 4007–
4014, 2012.
[14] J. Montesano, Z. Fawaz, and H. Bougherara, “Use
of infrared thermography to investigate the fatigue
behavior of a carbon fiber reinforced polymer
composite,” Composite Structures, vol. 97, pp. 76–
83, 2013.
[15] E. Bayraktar, S. Antolonovich, and C. Bathias,
“Multiscale study of fatigue behaviour of composite
materials by χ-rays computed tomography,”
International Journal of Fatigue, vol. 28, no. 10, pp.
1322–1333, 2006.

[16] J. Lambert, A. R. Chambers, I. Sinclair, and S. M.
Spearing, “3D damage characterisation and the role
of voids in the fatigue of wind turbine blade
materials,” Composites Science and Technology,
vol. 72, no. 2, pp. 337–343, 2012.
[17] P. J. Withers and M. Preuss, “Fatigue and Damage
in Structural Materials Studied by X-Ray
Tomography,” Annual Review of Materials
Research, vol. 42, no. 1, pp. 81–103, 2012.
[18] A. Bernasconi and R. M. Kulin, “Effect of
frequency upon fatigue strength of a short glass
fiber reinforced polyamide 6: A superposition
method based on cyclic creep parameters,” Polymer
Composites, vol. 30, no. 2, pp. 154–161, 2009.
[19] P. K. Mallick and Y. Zhou, “Effect of mean stress
on the stress-controlled fatigue of a short E-glass
fiber reinforced polyamide-6,6,” International
Journal of Fatigue, vol. 26, no. 9, pp. 941–946,
2004.
[20] A. Bernasconi, P. Davoli, A. Basile, and A. Filippi,
“Effect of fibre orientation on the fatigue behaviour
of a short glass fibre reinforced polyamide-6,”
International Journal of Fatigue, vol. 29, no. 2, pp.
199–208, 2007.
[21] B. Klimkeit, S. Castagnet, Y. Nadot, A. El Habib,
G. Benoit, S. Bergamo, C. Dumas, and S. Achard,
“Fatigue damage mechanisms in short fiber
reinforced PBT+PET GF30,” Materials Science and
Engineering: A, vol. 528, no. 3, pp. 1577–1588,
2011.
[22] M. De Monte, E. Moosbrugger, and M. Quaresimin,
“Influence of temperature and thickness on the off-
axis behaviour of short glass fibre reinforced
polyamide 6.6 – cyclic loading,” Composites Part
A: Applied Science and Manufacturing, vol. 41, no.
10, pp. 1368–1379, 2010.
[23] B. Mlekusch, “Fibre orientation in short-fibre-
reinforced thermoplastics II. Quantitative
measurements by image analysis,” Composites
science and technology, vol. 59, pp. 547–560, 1999.
[24] www.esrf.eu/UsersAndScience/Experiments/
Imaging/ID19.
Fig. 1 Skin-shell-core formation in PA66/GF30 which shows preferential orientation of fibers randomly, longitudinally (L)
and transversely (T) to the mold flow direction (MFD) for skin, shell and core layers, respectively
THE 19TH INTERNATIONAL CONFERENCE ON COMPOSITE MATERIALS
Fig. 2 The description of longitudinal and transverse
specimens of PA66/GF30
Fig. 3 The tensile properties of longitudinal and
transverse specimens of PA66/GF30
Fig. 4. The evolution of normalized dynamic modulus (EN/E0), maximum strain (εmax) and mean temperature (Tmean-Troom)
for (a) longitudinal and (b) transverse specimens during fatigue loading. The σu represents the ultimate tensile strength
value of its respective specimen orientation angles.
0 1 2 3 4 5 60
0.2
0.4
0.6
0.8
1
Strain (%)
Norm
aliz
ed S
tres
s
Longitudinal
Transverse
101
102
103
104
105
106
0.94
0.96
0.98
1
Number of cycles (N)
0
2.5
5
7.5
10
1
1.5
2
2.5
3
3.5
4
Tm
ean
- T
roo
m(°
C)
εm
ax (
%)
EN
/ E
0
(a)
σmax
= 65% σu
σmax
= 60% σu
σmax
= 55% σu
σmax
= 50% σu
101
102
103
104
105
106
0.65
0.7
0.75
0.8
0.85
0.9
0.95
1
Number of cycles (N)
0
5
10
15
20
25
30
1
2
3
4
run-outs
Tm
ean
- T
roo
m(°
C)
εm
ax (
%)
EN
/ E
0(b)
σmax
= 70% σu
σmax
= 60% σu
σmax
= 50% σu
σmax
= 40% σu

THE 19TH INTERNATIONAL CONFERENCE ON COMPOSITE MATERIALS
Fig. 5. Void at fiber ends (a) and interfacial debonding
(b) observed in the shell zone of longitudinal specimen
Fig. 6. Transverse crack observed in the core zone of
transverse specimen
Fig. 7. General trend of void aspect ratio vs. theta angle in
the unloaded specimen
Fig. 8. General trend of void aspect ratio vs. theta angle in
the shell and core zones of longitudinal specimen
Fig. 9. General trend of void aspect ratio vs. theta angle
in the shell and core zones of transverse specimen
-200 -150 -100 -50 0 50 100 150 2000
5
10
15
20
25
30
θ angle
Void
asp
ect
rat
io
-180 -90 0 90 1800
5
10
15
20
25
30
θ angle
Void
asp
ect
rati
o
shell
core
-180 -90 0 90 1800
5
10
15
20
25
30
θ angle
Void
asp
ect
rati
o
shell
core
a) b)


![MODELING STRUCTURAL BEHAVIOUR OF PVC …confsys.encs.concordia.ca/ICCM19/AllPapers/FinalVersion/...absorption of circular CFRP tubes with diameter/thickness ratio [7] (b) Photograph](https://static.fdocuments.us/doc/165x107/5adb09867f8b9a6d318d8ddd/modeling-structural-behaviour-of-pvc-of-circular-cfrp-tubes-with-diameterthickness.jpg)