Fatigue behaviour of geometric features subjected to laser...
34
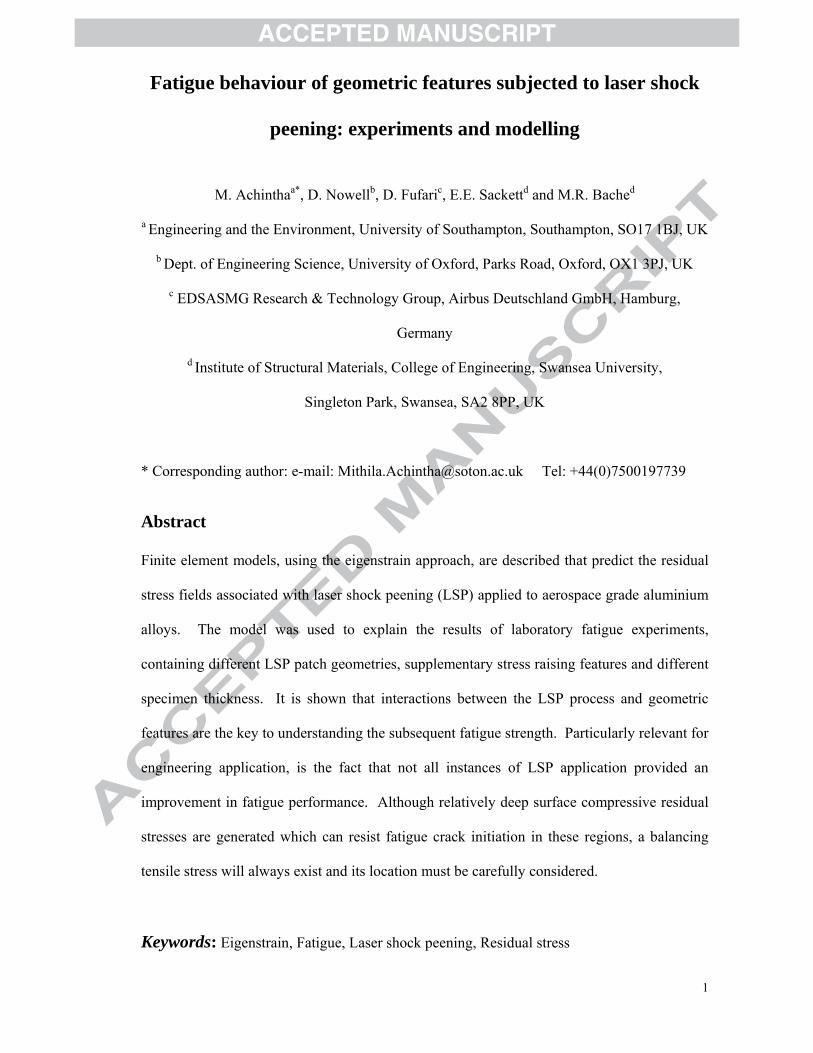
Accepted Manuscript Fatigue behaviour of geometric features subjected to laser shock peening: ex‐ periments and modelling M. Achintha, D. Nowell, D. Fufari, E.E. Sackett, M.R. Bache PII: S0142-1123(13)00122-9 DOI: http://dx.doi.org/10.1016/j.ijfatigue.2013.04.016 Reference: JIJF 3109 To appear in: International Journal of Fatigue Received Date: 29 October 2012 Revised Date: 28 January 2013 Accepted Date: 22 April 2013 Please cite this article as: Achintha, M., Nowell, D., Fufari, D., Sackett, E.E., Bache, M.R., Fatigue behaviour of geometric features subjected to laser shock peening: experiments and modelling, International Journal of Fatigue (2013), doi: http://dx.doi.org/10.1016/j.ijfatigue.2013.04.016 This is a PDF file of an unedited manuscript that has been accepted for publication. As a service to our customers we are providing this early version of the manuscript. The manuscript will undergo copyediting, typesetting, and review of the resulting proof before it is published in its final form. Please note that during the production process errors may be discovered which could affect the content, and all legal disclaimers that apply to the journal pertain.
Transcript of Fatigue behaviour of geometric features subjected to laser...
Accepted Manuscript
Fatigue behaviour of geometric features subjected to laser shock peening: ex‐
periments and modelling
M. Achintha, D. Nowell, D. Fufari, E.E. Sackett, M.R. Bache
PII: S0142-1123(13)00122-9
DOI: http://dx.doi.org/10.1016/j.ijfatigue.2013.04.016
Reference: JIJF 3109
To appear in: International Journal of Fatigue
Received Date: 29 October 2012
Revised Date: 28 January 2013
Accepted Date: 22 April 2013
Please cite this article as: Achintha, M., Nowell, D., Fufari, D., Sackett, E.E., Bache, M.R., Fatigue behaviour of
geometric features subjected to laser shock peening: experiments and modelling, International Journal of Fatigue
(2013), doi: http://dx.doi.org/10.1016/j.ijfatigue.2013.04.016
This is a PDF file of an unedited manuscript that has been accepted for publication. As a service to our customers
we are providing this early version of the manuscript. The manuscript will undergo copyediting, typesetting, and
review of the resulting proof before it is published in its final form. Please note that during the production process
errors may be discovered which could affect the content, and all legal disclaimers that apply to the journal pertain.
1
Fatigue behaviour of geometric features subjected to laser shock
peening: experiments and modelling
M. Achinthaa*, D. Nowellb, D. Fufaric, E.E. Sackettd and M.R. Bached
a Engineering and the Environment, University of Southampton, Southampton, SO17 1BJ, UK
b Dept. of Engineering Science, University of Oxford, Parks Road, Oxford, OX1 3PJ, UK
c EDSASMG Research & Technology Group, Airbus Deutschland GmbH, Hamburg,
Germany
d Institute of Structural Materials, College of Engineering, Swansea University,
Singleton Park, Swansea, SA2 8PP, UK
* Corresponding author: e-mail: [email protected] Tel: +44(0)7500197739
Abstract
Finite element models, using the eigenstrain approach, are described that predict the residual
stress fields associated with laser shock peening (LSP) applied to aerospace grade aluminium
alloys. The model was used to explain the results of laboratory fatigue experiments,
containing different LSP patch geometries, supplementary stress raising features and different
specimen thickness. It is shown that interactions between the LSP process and geometric
features are the key to understanding the subsequent fatigue strength. Particularly relevant for
engineering application, is the fact that not all instances of LSP application provided an
improvement in fatigue performance. Although relatively deep surface compressive residual
stresses are generated which can resist fatigue crack initiation in these regions, a balancing
tensile stress will always exist and its location must be carefully considered.
Keywords: Eigenstrain, Fatigue, Laser shock peening, Residual stress

2
1. Introduction
Laser shock peening (LSP) uses high power laser pulses (typical process parameters are
power = 1-25 J, pulse duration = 18-30 ns, laser beam size < 10 mm) to generate an
advantageous residual surface stress distribution in structural components (e.g. for airframe
applications) [1]. The technique involves firing laser pulses at the surface of a component to
introduce a surface compressive residual stress. Typically, an LSP treatment produces
compression to a depth of 1-2 mm, which is about five to ten times deeper than that produced
by conventional shot peening [1-4]. A significant advantage is that the laser parameters are
more reproducible than their equivalents during shot peening, and this allows the process to
be tailored to specific design requirements.
LSP is particularly attractive for application at geometric stress concentrations; by introducing
a compressive surface residual stress, fatigue performance can be enhanced through the
increased resistance to crack initiation. However, these are precisely the areas where the
technique is most difficult to apply in practice, often due to “line of sight” restrictions or
simply the difficulty in applying the ablative tape (used to transfer the laser shock to the
substrate) around complex geometric features. Further, as will be shown in the paper, the
interaction between the process and complex geometries can lead to unexpected results. The
current paper examines such interactions in two aerospace grade aluminium alloys (Al 2024
and Al 7010). The analysis presented here shows how the eigenstrain technique may be used
as an efficient tool for predicting the associated residual stress. This approach obviates the
need for a completely explicit finite element (FE) analysis, which may be impractical, since in
practice an array of multiple LSP pulses is generally required to treat the surface area of a
component.

3
Surface treatment by LSP usually involves applying an ablative or sacrificial aluminium tape
to the surface of a component. This tape is then vaporised by a laser pulse, producing a
rapidly expanding plasma. The plasma is confined by a jet of water simultaneously sprayed
on the surface [1-2] and the effect is to generate a high-amplitude, short duration shock
(pressure) wave in the work piece [1-4]. As the stress wave propagates, localised plastic
deformation occurs and, once the pulse has decayed, misfit between the plastically deformed
material and surrounding elastic region generates a residual stress [2, 3]. Due to the short
duration of the laser pulse (typically < 30 ns) no significant heating occurs in the substrate.
Hence the generation of residual stress may be regarded as a largely mechanical process,
involving the response of the material to a pressure wave [1-2]. An explicit FE analysis is
generally required to model the residual stresses caused by LSP. However, in order to obtain
the stabilised stress distribution, the FE simulation must be run until the stress waves caused
by each laser pulse fully dissipate. Hence modelling the process in this manner is demanding
in terms of computational processing times and cost [2-3].
Although the LSP technique offers significant potential to improve the fatigue resistance of
engineering components, instances have been reported [5] where a subsequent fatigue benefit
has not been found. Indeed, unless great care is taken, the balancing tensile stresses [1] may
actually reduce fatigue life, therefore knowledge of the locations and magnitudes of these
tensile stresses is required. For instance, in thin sections, care must be taken in the choice of
the laser power to avoid “overpeening”, leading to a largely tensile field near the surface1.
The beneficial effects of LSP on fatigue strength have been widely reported in the literature,
for example using dog-bone [6] and open hole specimens [7]. There are also some
investigations of the effect of LSP on fretting fatigue [6]. Titanium (Ti-6Al-4V) [6] and
1 For thin sections, it is possible to develop tension close to both the surfaces, if the stress wave reflection from the back surface is high enough to cause reverse plasticity in the initial compressive field underneath the LSP patch.

4
aerospace grade aluminium alloys (Al 2024 and Al 7010) [5] have been used in many studies,
but limited research has been carried out using other alloys, including Ni-based super alloys
[8]. The exact nature of the balancing tensile stress regions can be difficult to determine,
because the residual stress arises as the result of the elastic response of the whole component
to the localised plastic strain introduced by LSP. A knowledge of the precise interaction
between the LSP parameters, the geometric features and the resulting tensile “hot spots” is
required in order to model the fatigue strength.
It has been proposed that the improvements in fatigue life generated by LSP are dominated by
a significant increase in life during initiation and early stage crack growth, [6]. Even so, a
comprehensive understanding of the effect of LSP on fatigue strength is still lacking, and the
influence of residual stress and surface conditions are very difficult to determine.
Development of a comprehensive analytical method to predict the residual stresses generated
by LSP and subsequent fatigue performance is difficult because of the complex interaction
between the geometry of the component and the residual stress field. The authors have
previously developed a hybrid eigenstrain approach (i.e. employing misfit strains, which act
as sources of incompatibility of displacement) to determine the residual stresses generated by
the LSP [2-4]. The current paper extends the method to model the stress field in open-hole
specimens, both after treatment and during subsequent fatigue loads.
The eigenstrain technique is an efficient tool for modelling the residual stress state present in
a component and the technique has been successfully used in a number of applications. For
example, Korsunsky et al. [9] successfully constructed the residual stress induced by welding;
Prime and Hill [10] determined fibre scale residual stress variation in metal-matrix
composites; and Korsunsky [11] evaluated residual stresses in auto-frettaged tubes. The
knowledge of eigenstrain distribution may be used to determine the residual stress rather than
seeking the stress field directly. This has the advantage that the eigenstrain distribution is less

5
sensitive to component geometry than the resulting stress field. Previous analyses [2-4] have
shown that the plastic strains are usually stabilised within a short time period and hence the
eigenstrain distribution can be conveniently extracted from an explicit FE simulation by the
modelling the effect of a LSP pulse as a dynamic pressure load. The residual stress
distribution is then determined as the elastic response of the workpiece after incorporating the
eigenstrain as an initial misfit strain in a static FE model [2-3]. It should be noted that the
plastic flow caused by the shot has been captured in the eigenstrain extracted from the explicit
simulation, so that the yield condition is unlikely to be exceeded in the implicit model.
Previous work [2-4] has shown that the eigenstrain caused by the array of shots in a single
layer of LSP pulses can be simply modelled as that generated by a single LSP shot but applied
over a wider area in an appropriate misfit strain FE model. This allows modelling of the
effect of an array of LSP shots, arranged side by side, to peen a desired surface patch of a
component. Thus, the residual stress distribution can be determined from a static FE model
by incorporating the eigenstrain depth profile obtained from a representative simple array,
thereby significantly reducing the computational cost compared to an equivalent wholly
explicit FE analysis [3]. Similarly, the residual stress in a range of different geometries and
for a range of peened areas (in a given material) can be simply derived using the knowledge
of a single eigenstrain depth profile, related to a particular set of peening parameters. This
has allowed modelling the effect of LSP treatment adjacent to geometric features (e.g. in the
vicinity of a straight or curved edge) [4].
This paper investigates experimentally and numerically the degree to which the fatigue
response of complex geometric features can be modelled by using an understanding of simple
eigenstrain distributions. Thus, the model will be validated by comparing the predicted stress
profiles in a particular specimen geometry with the corresponding experimental fatigue lives.

6
The results suggest that the eigenstrain approach is particularly useful in these cases (e.g. in
the hole geometry investigated here). It will be shown that care must be exercised in the
application of LSP at stress concentrations. In some cases, no fatigue benefit can result and
performance may even be worse than the non-peened condition. Notably, the results show
that LSP, when restricted to small patches around geometric stress raising features, may be
more effective than LSP applied to larger areas.
2. Experimental Methods and Data
Fatigue tests were carried out on two aerospace grade aluminium alloys supplied by Airbus,
Al 7010 T7451 and Al 2024 T351. The 0.2% proof strength of these two alloys is 340MPa
and 430MPa respectively. Figure 1 shows the design of two open hole fatigue specimens,
which were tested under cyclic tension. Two thicknesses of specimen were employed, 5 and
15 mm respectively. The specimens were initially machined into rectilinear blanks using
CNC milling. LSP was then applied to the shaded regions indicated in Figure 1 on the front
and rear faces only (i.e. no LSP was applied to the side faces). Where LSP was applied across
the full width of the test piece this was designated a “full face specimen”. Alternatively, LSP
was restricted to a central region of 20 x 20mm, to provide a “patch specimen”. As the final
machining operation, the hole was drilled and reamed. A more limited set of specimens were
prepared to the same geometry but peened across the full face using a conventional shot
peening technique (MI 230H, 0.006 to 0.010 Almen) or tested in the “as machined” condition
(i.e. without peening of either type). All fatigue tests were carried out in laboratory air at
ambient temperature (20oC) using a load (R) ratio of 0.1 and 5 Hz sine waveform. A full
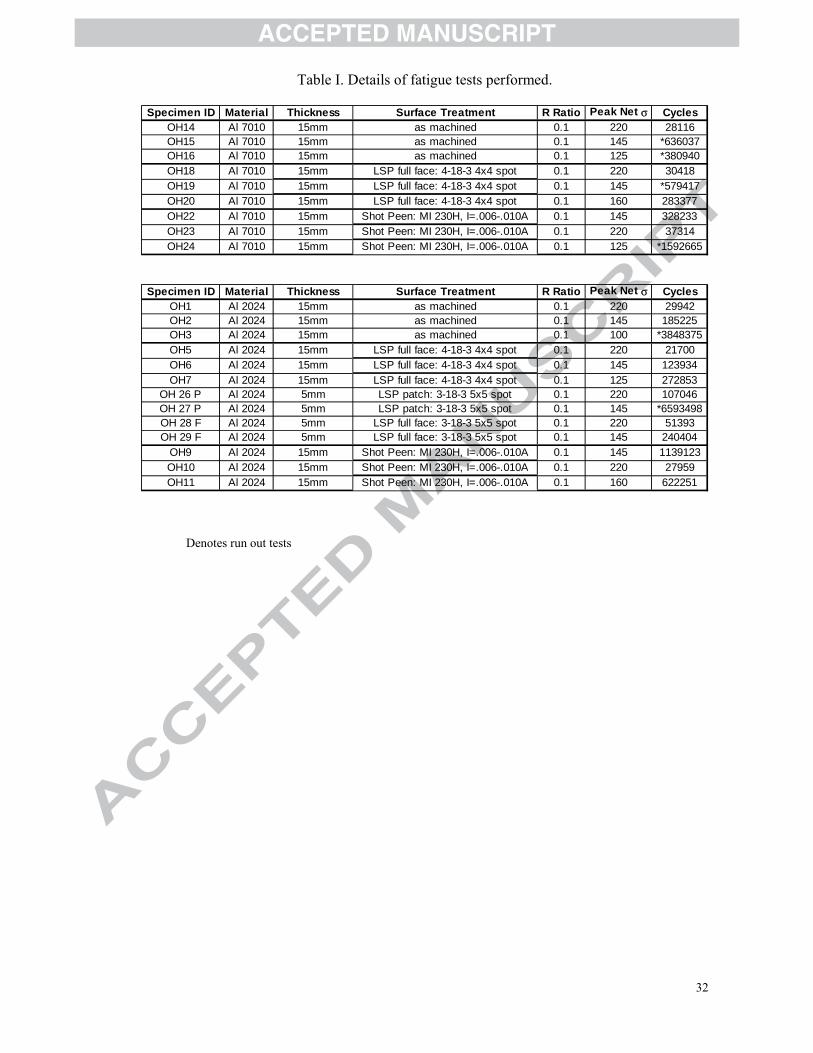
inventory of experiments is included as Table I.
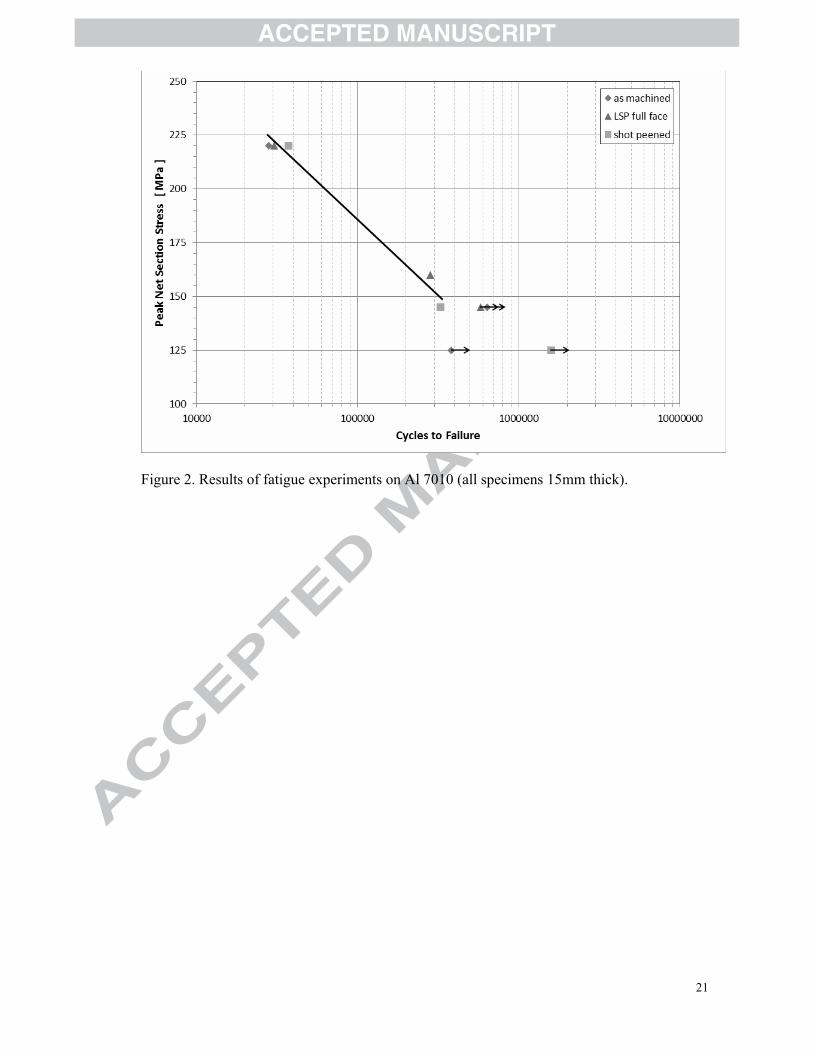
Figure 2 shows the results of the fatigue tests carried out on Al 7010. The peak net section
stress (i.e. maximum load / minimum cross sectional area at the specimen mid length
position) is plotted against the number of cycles to rupture. Three types of 15mm thick
7
specimen were used: ‘As-machined’, LSP, and shot-peened. The laser peening was applied
using 4 x 4 mm shots with a laser pulse of 18 ns duration and an energy density of 4 Gw/cm2.
Three layers of shots were superimposed across the whole area of the array. This surface
treatment was designated 4-18-3. No significant difference between the performance of the
three types of specimen was apparent.
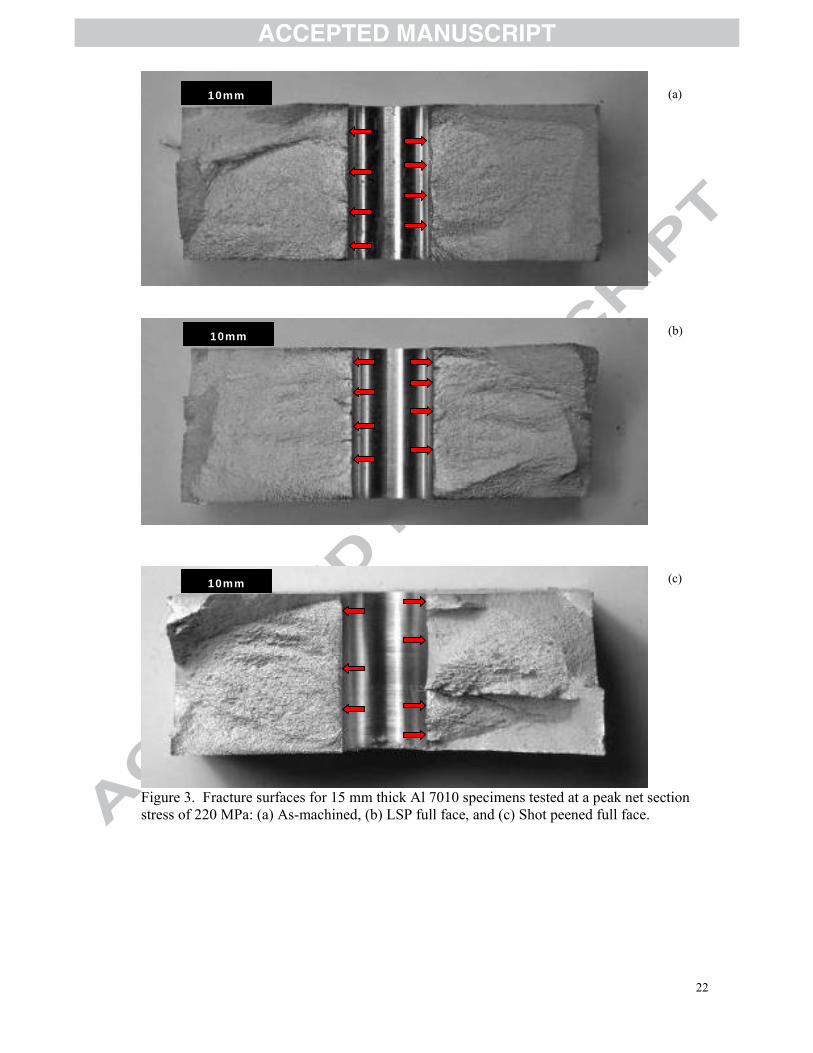
Figure 3 illustrates fracture surfaces from the three specimen variants tested at a common net
section stress of 220 MPa. Essentially, all three specimens have failed in a similar mode, with
multiple cracks initiated to either side of the hole, eventually coalescing to form through
section cracks growing laterally to either side . Notably in all cases, crack initiation was most
prevalent in the mid-thickness bore of the hole and no cracks initiated at surface corner
locations). Therefore, from the combination of evidence from the measured fatigue lives and
fractography, neither of the peening operations appear to affect the overall fatigue
performance.
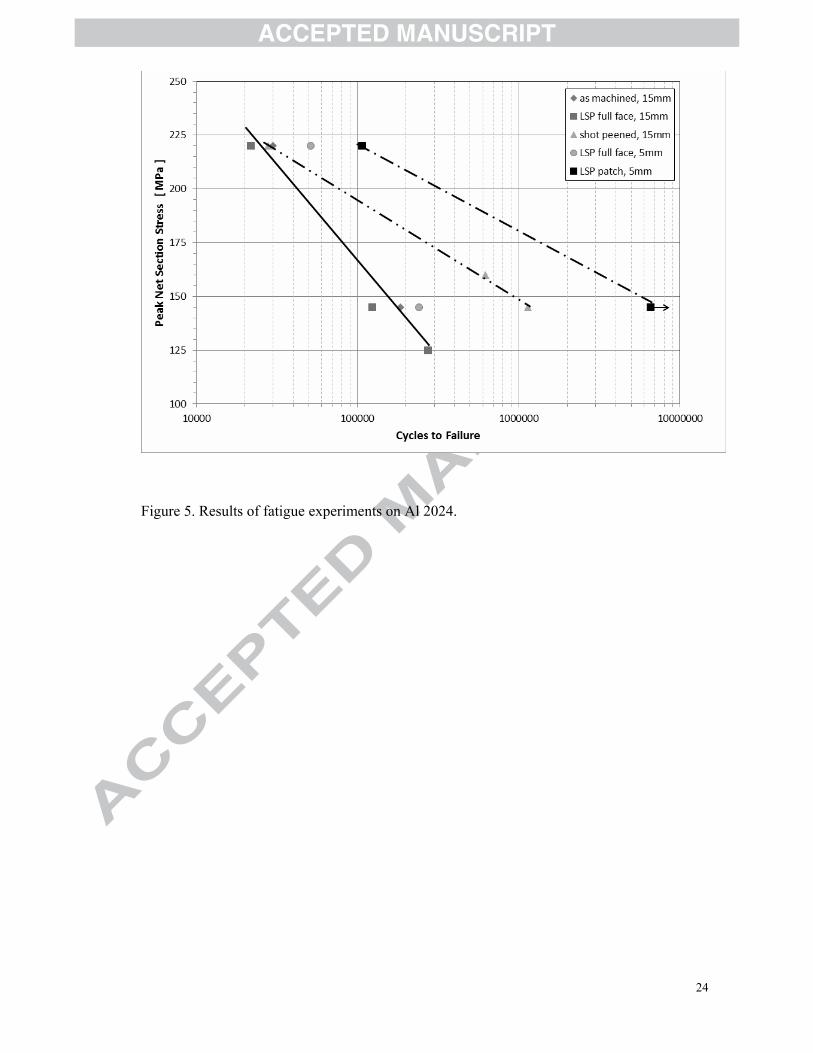
For the experiments on Al 2024, five different types of specimen were tested: (i) as-machined;
(ii) conventionally shot-peened; (iii) LSP full face; all with a thickness of 15mm, then (iv)
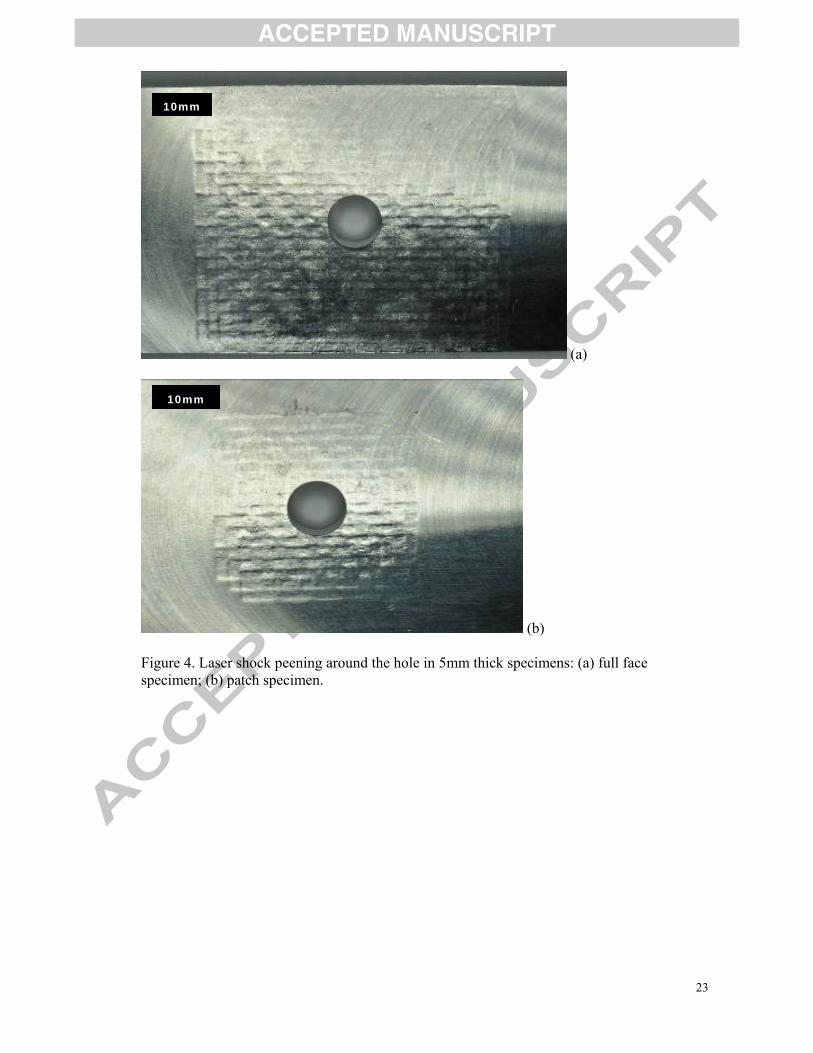
LSP full face and (v) 20 mm x 20 mm LSP patch on specimens of 5mm thickness. Figure 4
illustrates the actual surface appearance on the thin, full face and patch specimens
respectively. Figure 5 plots the results obtained from the AL 2024 specimens. As with the Al
7010 alloy, LSP on the 15 mm thick specimens showed no benefit when compared to ‘as
machined’ specimens. In contrast, conventional shot peening of thick specimens did appear
to show a benefit with this alloy, with an apparent increase in endurance strength, although
the increase in life was more significant at lower stress.

8
Turning to the thin (5mm) specimens, LSP applied over the full face of the specimen provided
a similar response to either of the 15mm thick specimens. However, a notable improvement in
fatigue performance was obtained with Al 2024 patch specimens at all applied stress levels.
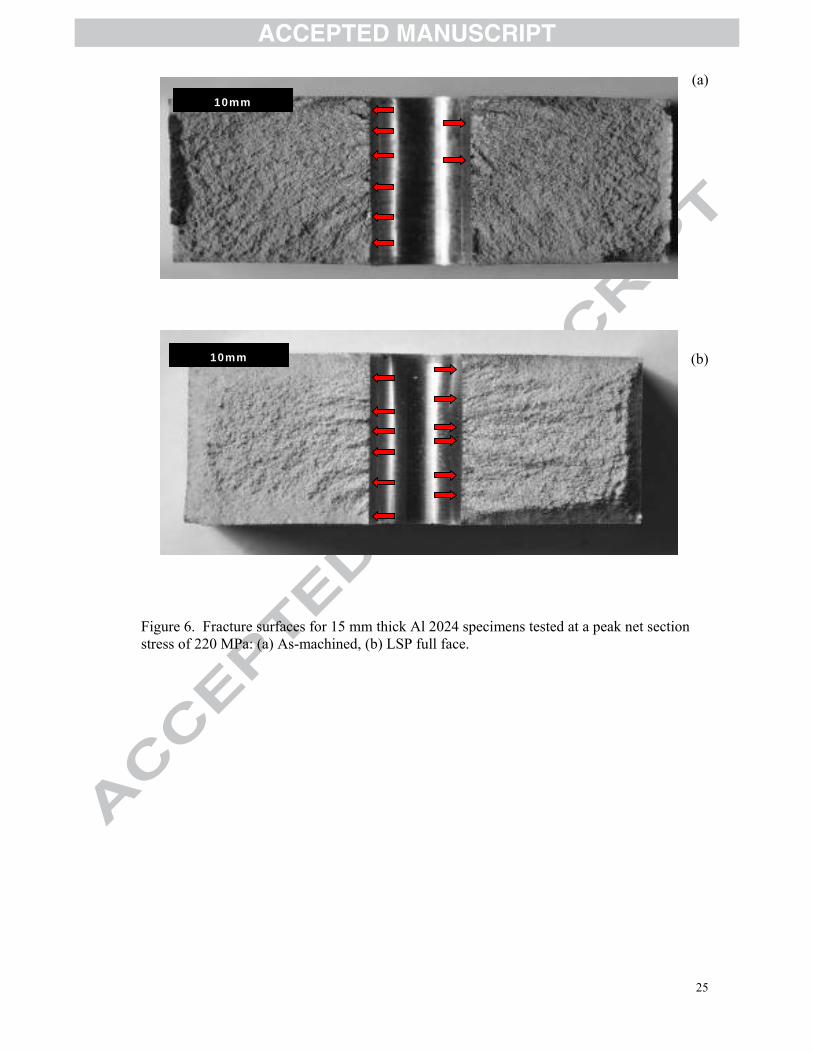
Figure 6 shows fracture surfaces for two 15 mm thick specimens (as machined and LSP full
face respectively) tested at a peak stress of 220 MPa. As with the Al 7010 alloy, crack
initiation occurs along the bore of the hole and away from the specimen surfaces. Finally,
Figure 7 Illustrates the fracture surfaces obtained from the 5mm thick specimens. Comparing
the ‘full-face’ and ‘patch’ treatments, it is clear that the total critical crack length (i.e.
measured to either side of the hole) is shorter in the patch specimen. It will be shown later
(Section 4) that this difference can be explained by the location of the tensile part of the
residual stress field.
3. Modelling
As explained in Section 1, modelling of the residual stress distribution was carried out using
an eigenstrain method. The first step was to establish the residual plastic strain distribution
introduced by a single LSP shot. This was achieved by means of an explicit (i.e. dynamic)
finite element simulation of the LSP process. The resulting stress distribution in the specimen
was then modelled by the introduction of a misfit strain (or eigenstrain) over the entire treated
region [2]. In the experiments reported here, three layers of LSP shots were applied. Hence,
the required profile of plastic strain with depth is that caused by three successive LSP shots at
the same location [3].
As explained in greater detail [2], the LSP process is modelled as a purely mechanical process
caused by the shock wave generated by the ablation of the tape by the laser. Hence, in the
explicit finite element model, a pressure pulse is applied to the surface of the specimen over
the area corresponding to the laser pulse. The pressure is treated as uniform over the area of
9
the pulse. Whilst this is probably an approximation, it is difficult to make a more
sophisticated assumption without a detailed multi-physics model of the plasma generation
process. It remains to determine the time history of the pressure pulse applied. For
simplicity, and because experimental results are limited, a simple triangular variation of
pressure with time was assumed (Figure 8). The duration of the pulse is tp and the peak
pressure, pmax, is assumed to be generated at half the total duration of the pressure pulse, i.e.
max)2/( ptp p = . The pressure pulse duration is normally assumed to be four to six times that
of the laser pulse [2, 12]. Here a value of tp = 100 ns was used, which can be compared to the
laser pulse duration, tL, of 18 ns. The final parameter needed is the peak pressure. This may
be chosen by considering the energy transferred to the work piece by the pressure pulse and
comparing this to the laser energy.
Typically, only 5 to 10% of the laser energy is transferred to the substrate [2]. In the current
application, a peak laser power density of 4 GW/cm2 was used, and the peak pressure in the
simulation was adjusted so that 3 % of the energy was transferred to the work piece2. This
resulted in a peak pressure in the simulation of 3.15 GPa. A simple elastic, perfectly plastic
material model was assumed, with a yield stress of 350 MPa. More sophisticated material
models (e.g. including strain or strain rate hardening) could easily be employed. However,
there is always a difficulty in setting the hardening parameters correctly. Strain rates during
the LSP pulse are found to be in the region of 106 s-1 and materials data at these rates of strain
are difficult to obtain. Very high strain rate material data for the alloys used here was not
readily available, therefore use of a more sophisticated material model could not be justified.
In any case, even if strain rate hardening takes place, the high levels of yield stress are
2 The total strain energy and kinetic energy in the finite element model is readily available as an output from the explicit FE code.
10
unlikely to be sustained after the impact event, so that a quasi-static value is likely to be
representative of the situation at the end of the process.
The assumptions of peak pressure and pulse duration in the modeling can be validated to
some extent by comparing the results of the simulation with a simple experiment. One
straightforward method of validation is to compare the experimental and predicted surface
profiles obtained for the case of a single shot. Figure 9 shows a typical surface measurement
profile obtained from an Alicona Infinite Focus microscope. Half of the LSP shot is shown,
and the surface indentation caused by the shot is clearly visible. Figure 10 shows a
comparison of the measured and predicted surface profiles, and it is evident that a good
match can be obtained if the peak pressure in the simulation is set correctly. If pulse length
and temporal distribution or material yield stress are also treated as free parameters, then other
combinations might lead to a similar indentation depth. Hence the validation must be treated
with some caution. It merely provides an indication that a broadly consistent set of
parameters have been found.
The explicit finite element simulation of an LSP shot may be terminated as soon as the plastic
strain has stabilized. Typically this is 1000-1200 ns (i.e. after 10-12 tp) after the start of the
pressure pulse. The plastic strain is found to be introduced almost exclusively underneath the
shot itself [2] and not to vary significantly over the area of the shot. Hence, the plastic strain
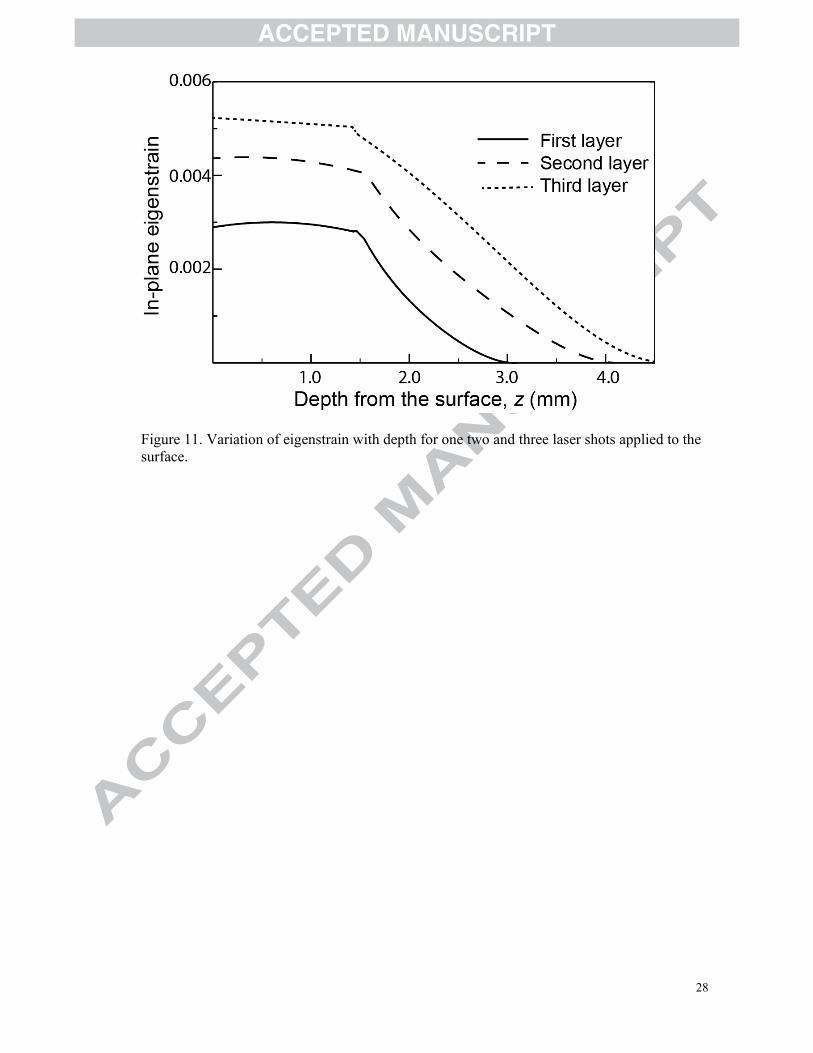
profile can be assumed to be a function of distance from the surface (z) only. Figure 11
shows the profile obtained for the current case. The plastic strain components in the x and y
directions are identical and are shown here as ‘eigenstrain’. In the current configuration three
layers of shots are used. Because the strain introduced is largely confined to the material
directly under the shot, it is not necessary to consider interaction of adjacent shots, nor is it
necessary to explicitly consider any offset between shots of subsequent layers [3]. Hence, the
11
effect of two or three shots can be explicitly simulated by applying the pressure pulses one
after the other in the finite element model. Figure 11 shows the results obtained, it can be
seen that the plastic strain is increased in magnitude and depth with each subsequent shot. It
should be recognized that these results are obtained without strain hardening and the effect
may be less significant with a work-hardening material.
Once the variation of plastic strain with depth has been established, this may be introduced as
a misfit strain (or eigenstrain) in an implicit finite element model. A convenient means of
achieving this is to specify a thermal expansion coefficient which varies with position in the
work piece and then apply a fictitious unit temperature rise [2]. The residual stresses then
arise in the model as the elastic response to the misfit strain. This is exactly what happens in
the real process: a plastic misfit strain is introduced and the residual stress field arises from
the elastic response of the work piece to this misfit strain. Herein lies a significant advantage
of the eigenstrain approach: subsequent machining operations which change the shape of the
component will not significantly affect the misfit strain introduced. Hence, the same
eigenstrain distribution can be used in the remaining material. The residual stress field will,
of course, change, as the different component geometry will affect the elastic response.
The method outlined above may now be exploited in the context of the surface treated fatigue
specimens described earlier. Since the hole was introduced after the LSP treatment, we can
consider the eigenstrain distribution to be uniform over the remaining area treated. Provided
that the drilling of the hole does not create significant further plastic strain in the remaining
material, it is not necessary to consider the interaction of the hole with the plastic strain field.
Of course, the residual stresses in a specimen with a hole will differ from those in a flat plate,
but the requirements of equilibrium, compatibility and the material constitutive law will be
correctly enforced within the finite element code. Hence, the residual stress field will be
12
correctly modeled and it is not necessary to install the eigenstrain first in an undrilled
specimen and then to model the drilling of the hole.
4. Predictions of residual stress
The method described in the previous section was used to predict the residual stress field
present in each of the different Al 2024 specimens with laser shock peening applied
(Section 2). It was assumed that the specimen was originally free of residual stress and the
appropriate eigenstrain distribution was introduced to correspond to the area treated in the
specimenIn practice there may be some near-surface residual stresses in the specimen caused
by machining, but these are likely to be significantly smaller than those induced by LSP [ ].
As is usual in finite element analysis, only half the thickness of the specimen is modeled, and
symmetry conditions applied at the mid-plane. In the case of the 5mm thick specimen, the
eigenstrain distribution is deeper than 2.5mm. Hence, an approximation was made by
truncating the distribution at this depth. A comparison with the case where the two full
eigenstrain distributions were superposed (so that they overlapped) shows relatively small
differences in the residual stress profile.
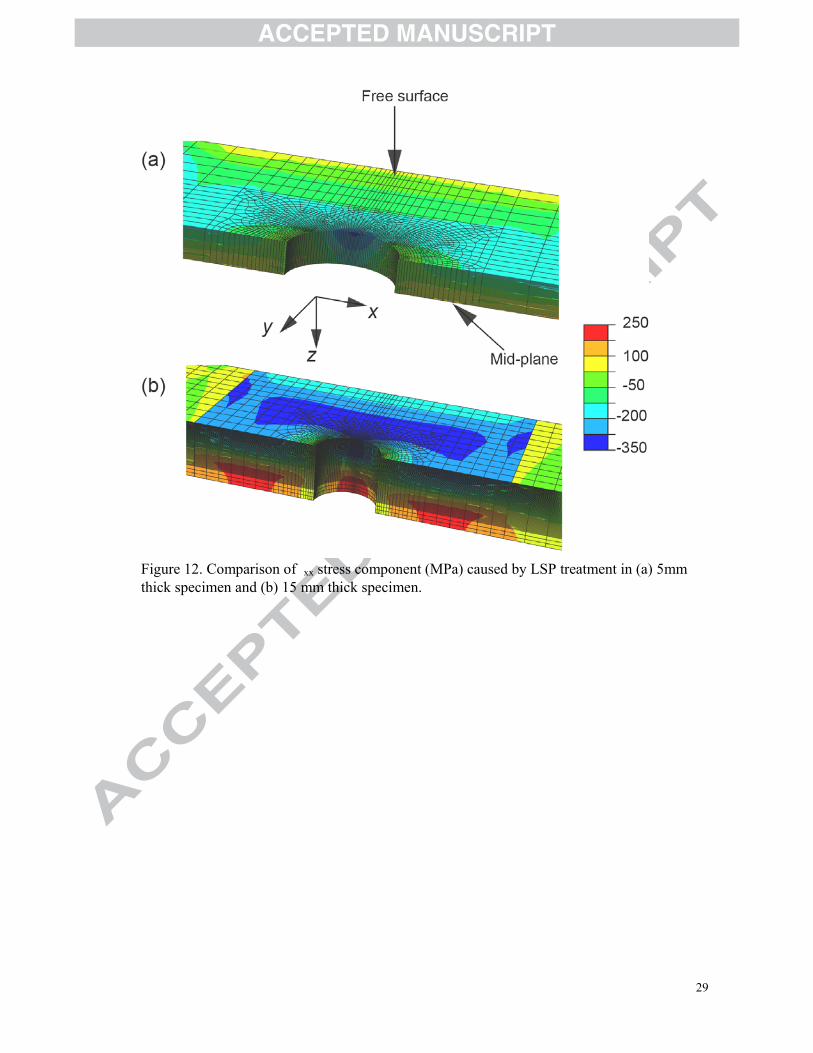
Figure 12 shows two contour plots of the xx stress distribution in the 5 mm and 15 mm thick
specimens with “full-face” LSP treatments. This is the stress component which combines
with the applied stress to cause fatigue crack initiation. In both the ‘thick’ and ‘thin’
geometries, a compressive stress is introduced as expected at the specimen surface. In the
thin specimen, this residual compression persists along the bore of the hole throughout the
entire thickness, whereas the thick specimen exhibits some residual tension on the mid-plane.
This difference explains the observed experimental results (Section 2 and Fig. 5). With the
thin specimen, the residual compression helps to inhibit crack initiation and the recorded lives
are longer than the ‘as machined’ condition. The thick specimen geometry does not produce
13
this life extension, as there are points along the bore of the hole where the residual stress is
mildly tensile. It should be noted that in Fig 12, the surface compressive stress reaches 350
MPa in compression. This suggests that a small amount of additional plasticity has been
caused by the interaction of the eigenstrain with the hole.
Figure 13 illustrates the effects discussed above in a more quantitative fashion. The xx stress
component at the 90o position with respect to the applied loading is plotted as a function of
depth. For the 5mm thick specimen geometry the stress component is purely compressive,
whereas for the 15mm thick geometry, the stress rises to about 150 MPa at mid-plane. Also
illustrated here is the significant difference between the full-face (40 x 40 mm) treatment and
the patch (20 x 20 mm) case in the thin specimen geometry. The 20 x 20 mm patch generates
residual compression of about 350 MPa, whereas in the ‘full-face’ case this is reduced to
around 200 MPa. The reason for this becomes apparent when one considers overall specimen
equilibrium and it illustrates a fundamental point. The definition of residual stress is a stress
field that exists in the absence of external loading. Hence, the residual stress field on any
section through the component must give rise to no resultant force and moment. It follows
that it is not possible to introduce a compressive residual stress at one location in a component
without a balancing tension somewhere else. The magnitude and location of this tensile
region is of crucial importance: if it is located in a region of low stress and away from the
surface, then the residual stress field may be beneficial to fatigue life. If it is not, then the
fatigue life of the component may be reduced.
In the light of the observations made above, the results of Figure 13 may be interpreted as
follows: for the thick specimen treated with full-face LSP, there is residual compression at
the surface of the specimen. The balancing tension must therefore be carried towards the
mid-plane of the specimen, and this gives rise to increased tensile stress along the bore of the

14
hole. There is therefore likely to be no improvement in fatigue life. If the peening is only
applied to a patch, then some of the tension can be carried closer to the surface, in the un-
peened regions and this gives rise to a slight improvement in residual stress profile. For the
thin specimen, the residual tension must still be carried, and there must clearly be tensile
stresses at the mid-plane. However, the eigenstrain interacts with the presence of the hole in
quite a complex manner, and it appears (Figure 13), that the stress along the bore of the hole
is wholly compressive. The best results were achieved with the thin specimen treated with a
patch. Here there is a clear load path for the tension at the surface of the specimen in the
lateral areas not treated by LSP. This means that a substantial residual compression can be
established along the bore of the hole through the entire thickness of the specimen. This
explains the fatigue life enhancement found in the experiments (Figure 5). It also accounts
for the shorter critical crack length found experimentally in the specimens treated with an LSP
patch (Figure 7a). Once the crack grows away from the treated area it experiences significant
residual tension superimposed on the applied loading and hence the critical stress intensity
factor for unstable crack growth will be experienced at a shorter crack length than will be the
case in the ‘full-face’ treated case.
4.1 Effects of loading
The discussion above concerns the residual stress field which exists in the absence of any
applied loading. Whilst this gives useful insight into the behaviour under fatigue loading, a
crucial question remains: how will the residual stress field be affected by the loading itself. A
simple first approximation is to assume that there is no further plastic deformation, in which
case superposition may be used to give the stresses as the sum of residual and applied elastic
fields. However, there will clearly always be a level of loading which gives rise to plasticity
in the specimen and we would expect the residual stress field to change under these
15
circumstances. Hence, it is possible that the beneficial effects of the surface treatment might
not persist under relatively high applied loading.
The eigenstrain method provides a simple means of investigating the point raised in the
previous paragraph. The implicit finite element model includes the effect of surface treatment
as a misfit strain, and the residual stress arises as a response to this. Hence, application of a
live load to the model will superpose the effect of this loading on the residual stress field and
plastic flow will take place once the yield condition is reached. With the current material
model, application is particularly straightforward, since no work hardening has taken place
and the yield condition is the same at all points in the model. Figure 14 shows the effect of
applying a live load corresponding to an average net section stress 145 MPa. This represents
the lowest peak load used in the experiments on the 5mm thick specimens. Figure 14a shows
the load applied to an ‘as-machined’ specimen, and the effect of the stress concentration at the
hole is clearly visible. A significant tensile stress is present right through the bore of the hole,
and it is this which will give rise to crack initiation. In Figure 14b, the same load is applied to
a specimen treated with an LSP patch (20 x 20 mm). It can clearly be seen that the tension is
largely carried outside the patch, and that the bore of the hole is subjected to far lower tensile
stress.
Figure 15 shows the effect of loading in more detail by plotting the variation of the axial
stress component along the bore of the hole for different applied loads. Initially the stress is
simply the superposition of the residual stress field and the applied stress times the elastic
stress concentration factor, Kt . The xx stress component becomes tensile at an applied stress
of around 100 MPa (Fig 15), but the LSP still offers a significant benefit compared with an
untreated specimen, as the tensile part of the stress range is reduced in magnitude. However,
at applied loads greater than about 145 MPa, plasticity starts to occur and the protection

16
provided by the LSP treatment is diminished, as plastic flow reduces some of the beneficial
misfit strains introduced by the process. Hence, we would expect treatment by a patch of LSP
to show a large benefit at stress levels below 145 MPa, but a significantly reduced effect at
higher stress levels. This is clearly evident in the experimental results shown in Figure 5.
5. Conclusions
The paper has presented experimental results concerning the fatigue response of Al 7010 and
Al 2024 specimens with a centre hole geometry. The use of conventional shot peening and
laser shock peening to potentially improve the fatigue strength was investigated. For the
15mm thick specimen, the surface treatments were found to have minimal or no effect.
Initiation of fatigue cracks took place in the bore of the hole, in an area where the stress was
not significantly affected by the surface treatment. For thin (5mm thick) specimens, there was
some improvement, particularly when LSP was applied in a patch around the hole, rather than
across the full face of the specimen.
A modelling approach based on the representation of the LSP process by an eigenstrain
distribution was used to interpret the experimental results. This proved simple and effective
and avoids the necessity to carry out explicit finite element simulation of each LSP shot,
which would be computationally impractical. The method was able to explain the
experimental results: residual compression was predicted in some areas of the specimen, but
balancing residual tension at others. It is the location of this balancing tension which is an
important feature in determining the fatigue life of a specimen. If the full face of the specimen
is peened, then the tension must be carried towards the mid-plane of the specimen, and the
bore of the hole will be exposed to these increased stress levels. If, however, a patch of LSP
17
is applied around the hole, the residual tension is carried outside the patch and it is possible to
place the whole of the bore of the hole into residual compression.
The eigenstrain approach is also extremely convenient in investigating the effects of
subsequent applied loading and the ‘shakedown’ of the residual stress field. For low loads,
there is little or no plastic flow and the protective residual compression remains in place. For
higher applied loads, plastic flow occurs and some of the benefits of the surface treatment can
be lost. Hence, the eigenstrain approach provides an important tool for investigating the
treatment of stress concentrations with LSP or similar surface treatments, such as shot
peening. Once the characteristic eigenstrain distribution caused by the treatment has been
determined, it may be applied over different regions of the work piece and the resulting stress
distribution determined using a simple implicit finite element analysis. It is important to note
that there will always be residual tension in addition to residual compression and the location
of these tensile regions is an important consideration. If residual tension occurs in regions
which are already subject to a significant tensile fatigue loading, then the improvement in
fatigue performance offered by surface treatment may be compromised.
Acknowledgements
The work described in this paper was undertaken as part of a collaborative project involving
the universities of Manchester, Oxford, and Swansea, part-funded by the EPSRC and the UK
Ministry of Defence under grant numbers (EP/F028830/1 and EP/F026226/1). In-kind
contributions were also received from Rolls-Royce plc, Airbus GmbH, and the Metal
Improvements Company. The contributions of our collaborators in all of these organisations
are gratefully acknowledged.
18
References
[1] Ding K, Ye L. Laser shock peening: Performance and process simulation, Woodhead,
Cambridge, UK, 2006.
[2] Achintha M, Nowell D. “Eigenstrain modelling of residual stresses generated by laser
shock peening”. Journal of Material Processing Technology, 211(2011) 1091-1101.
[3] Achintha M, Nowell D, Shapiro K, Withers PJ. “Eigenstrain modelling of residual stress
generated by arrays of Laser Shock Peeing shots and determination of the complete stress
field using limited strain measurements”. Surface Coatings and Technology, 2012, In press,
doi: 10.1016/j.surfcoat.2012.11.027.
[4] Achintha M, Nowell D. “Residual stress in complex geometric features subjected to laser
shock peening”. Surface Coatings and Technology, 2012, under review.
[5] Dorman M, Toparli MB, Smyth N, Cini A, Fitzpatrick ME, Irving PE. “Effect of laser
shock peening on residual stress and fatigue life of clad 2024 aluminium sheet containing
scribe defects”. 2012 Materials Science and Engineering: A, 548 pp. 142–151.
[6] Liu KK, Hill MR. “The effects of laser peening and shot peening on fretting fatigue in Ti–
6Al–4V coupons”. Tribology International 42 (2009) 1250–1262.
[7] Yang JM, Her YC, Han N, Clauer A. “Laser shock peening on fatigue behavior of 2024-
T3 Al alloy with fastener holes and stopholes”. Science and Engineering A298 (2001) 296–
299.
[8] He W, Li Y, Li Q, Liu H, Li Y, Liu R. “The effects of laser shock peening on fatigue life
in Ni-based superalloy” , Advanced Materials Research Vol 135(2010), 209-214.
[9] Korsunsky AM, Regino GM, Nowell D. “Variational eigenstrain analysis of residual stresses
in a welded plate”. International Journal Solids and Structures, 44(13), 2006, 4574-4591.
[10] Prime MB, Hill MR. “Measurement of fibre-scale residual stress variation in a metal-
matrix composite”. Journal of Composite Materials, 38(23), 2004, 2079-2095.
19
[11] Korsunsky AM. “Residual elastic strains in autofrettaged tubes: elastic-ideally plastic
model analysis”. Journal of Engineering Materials and Technology, 129(1), 2007, 77-81.
[12] Berthe L, Fabbro R, Peyre P, Tollier L, Bartnicki E. “Shock wave from a water-confined
laser-generated plasma”. J. Appl. Phys. 82 (6), 1997, 2826–2832.
[13] Clauer, A. H., "Laser Shock Peening for Fatigue Resistance," pp 217-230 of ‘Surface
Performance of Titanium’, J. K. Gregory, H. J. Rack, and D. Eylon, eds., TMS, Warrendale,
PA, 1996.

20
Figure 1. Mid gauge section details of the full face (left) and patch (right) test specimens (total
length of specimens = 330 mm, all dimensions quoted in mm)
21
Figure 2. Results of fatigue experiments on Al 7010 (all specimens 15mm thick).
22
Figure 3. Fracture surfaces for 15 mm thick Al 7010 specimens tested at a peak net section stress of 220 MPa: (a) As-machined, (b) LSP full face, and (c) Shot peened full face.
(a)
(b)
(c)
10mm
10mm
10mm
23
(a)
(b) Figure 4. Laser shock peening around the hole in 5mm thick specimens: (a) full face specimen; (b) patch specimen.
10mm
10mm
24
Figure 5. Results of fatigue experiments on Al 2024.
25
(a)
(b)
Figure 6. Fracture surfaces for 15 mm thick Al 2024 specimens tested at a peak net section stress of 220 MPa: (a) As-machined, (b) LSP full face.
10mm
10mm

26
Figure 7. Fracture surfaces for the 5mm thick Al 2024 specimens tested at 220 MPa: (a) with LSP applied over the entire face; and (b) with LSP over a 20 x 20 mm patch.
Figure 8. Assumed variation of pressure with time, caused by application of a laser pulse.
LSP Patch
~ Extent of LSP patch
~ Critical crack length
LSP Face
~ Critical crack length
tp
pmax

27
Figure 9. Measured surface profile following a single LSP shot.
Figure 10. Variation of surface displacement in the normal (z) direction with distance from the centre of the pulse (y): comparison of experimental results and model predictions.
28
Figure 11. Variation of eigenstrain with depth for one two and three laser shots applied to the surface.
29
Figure 12. Comparison of xx stress component (MPa) caused by LSP treatment in (a) 5mm thick specimen and (b) 15 mm thick specimen.
30
Figure 13. Variation of the of xx stress component with depth along the bore of the hole (i.e. normal to the loading direction) for different specimen geometries and treatments.
Figure 14. σxx stress component (MPa) in a thin specimen loaded to 145 MPa: (a) ‘as-machined’ and (b) treated with an LSP patch.

31
Figure 15. Variation of σxx stress component with depth along the bore of the hole for different applied loads in a 5mm thick specimen with an LSP patch.
32
Table I. Details of fatigue tests performed. Specimen ID Material Thickness Surface Treatment R Ratio Peak Net σ Cycles
OH14 Al 7010 15mm as machined 0.1 220 28116OH15 Al 7010 15mm as machined 0.1 145 *636037OH16 Al 7010 15mm as machined 0.1 125 *380940OH18 Al 7010 15mm LSP full face: 4-18-3 4x4 spot 0.1 220 30418OH19 Al 7010 15mm LSP full face: 4-18-3 4x4 spot 0.1 145 *579417OH20 Al 7010 15mm LSP full face: 4-18-3 4x4 spot 0.1 160 283377OH22 Al 7010 15mm Shot Peen: MI 230H, I=.006-.010A 0.1 145 328233OH23 Al 7010 15mm Shot Peen: MI 230H, I=.006-.010A 0.1 220 37314OH24 Al 7010 15mm Shot Peen: MI 230H, I=.006-.010A 0.1 125 *1592665
Specimen ID Material Thickness Surface Treatment R Ratio Peak Net σ Cycles
OH1 Al 2024 15mm as machined 0.1 220 29942OH2 Al 2024 15mm as machined 0.1 145 185225OH3 Al 2024 15mm as machined 0.1 100 *3848375OH5 Al 2024 15mm LSP full face: 4-18-3 4x4 spot 0.1 220 21700OH6 Al 2024 15mm LSP full face: 4-18-3 4x4 spot 0.1 145 123934OH7 Al 2024 15mm LSP full face: 4-18-3 4x4 spot 0.1 125 272853
OH 26 P Al 2024 5mm LSP patch: 3-18-3 5x5 spot 0.1 220 107046OH 27 P Al 2024 5mm LSP patch: 3-18-3 5x5 spot 0.1 145 *6593498OH 28 F Al 2024 5mm LSP full face: 3-18-3 5x5 spot 0.1 220 51393OH 29 F Al 2024 5mm LSP full face: 3-18-3 5x5 spot 0.1 145 240404
OH9 Al 2024 15mm Shot Peen: MI 230H, I=.006-.010A 0.1 145 1139123OH10 Al 2024 15mm Shot Peen: MI 230H, I=.006-.010A 0.1 220 27959OH11 Al 2024 15mm Shot Peen: MI 230H, I=.006-.010A 0.1 160 622251
Denotes run out tests
33
Research Highlights (JIJF 3109) Eigenstrain approach works well to model the fatigue of LSP treated specimens
Interactions between the LSP process and geometric features are important
Not all instances of LSP applications provide improvement in fatigue life
Eigenstrain method allows modelling the effects due to balancing tensile stress