![Modelling Ecological Cognitive Rehabilitation Therapies ...oa.upm.es/40162/1/INVE_MEM_2015_212533.pdf · structure is changed depending on experi ence [7]. New neural connectivity](https://static.fdocuments.us/doc/165x107/5e71514deb7fe92ac322b148/modelling-ecological-cognitive-rehabilitation-therapies-oaupmes401621invemem2015.jpg)
Fast and Slow Dynamics in Neural Networks with Small-World Connectivity
28
Fast and Slow Dynamics in Neural Networks with Small- World Connectivity oxin, Riecke, Solla - Phys. Rev.Lett. 92, 198101 (2004) iecke, Roxin, Madruga, Solla - Chaos 17, 026110 (2007) h: Santiago Madruga, Hermann Riecke, Alex Ro Sara A. Solla Northwestern University
-
Upload
noel-solis -
Category
Documents
-
view
18 -
download
0
description
Fast and Slow Dynamics in Neural Networks with Small-World Connectivity. Sara A. Solla Northwestern University. With: Santiago Madruga, Hermann Riecke, Alex Roxin. Roxin, Riecke, Solla - Phys. Rev.Lett. 92 , 198101 (2004) Riecke, Roxin, Madruga, Solla - Chaos 17 , 026110 (2007). - PowerPoint PPT Presentation
Transcript of Fast and Slow Dynamics in Neural Networks with Small-World Connectivity

Fast and Slow Dynamics in Neural Networks with Small-
World Connectivity
Roxin, Riecke, Solla - Phys. Rev.Lett. 92, 198101 (2004)Riecke, Roxin, Madruga, Solla - Chaos 17, 026110 (2007)
With: Santiago Madruga, Hermann Riecke, Alex Roxin
Sara A. SollaNorthwestern
University

Complex Networks: Form to Function
To which extent does network topology determine or affect network function?

Model of Network Connectivity: a Small-
World Network Many complex networks have a small-world topology characterized by dense local clustering or cliquishness of connections between neighboring nodes yet a short path length between any (distant) pair of nodes due to the existence of relatively few long-range connections.
This is an attractive model for the organization of brain anatomical and functional networks because a small-world topology can support both segregated (specialized) and distributed (integrated) information processing.
Bassett, Bullmore - The Neuroscientist 12, 512 (2006)
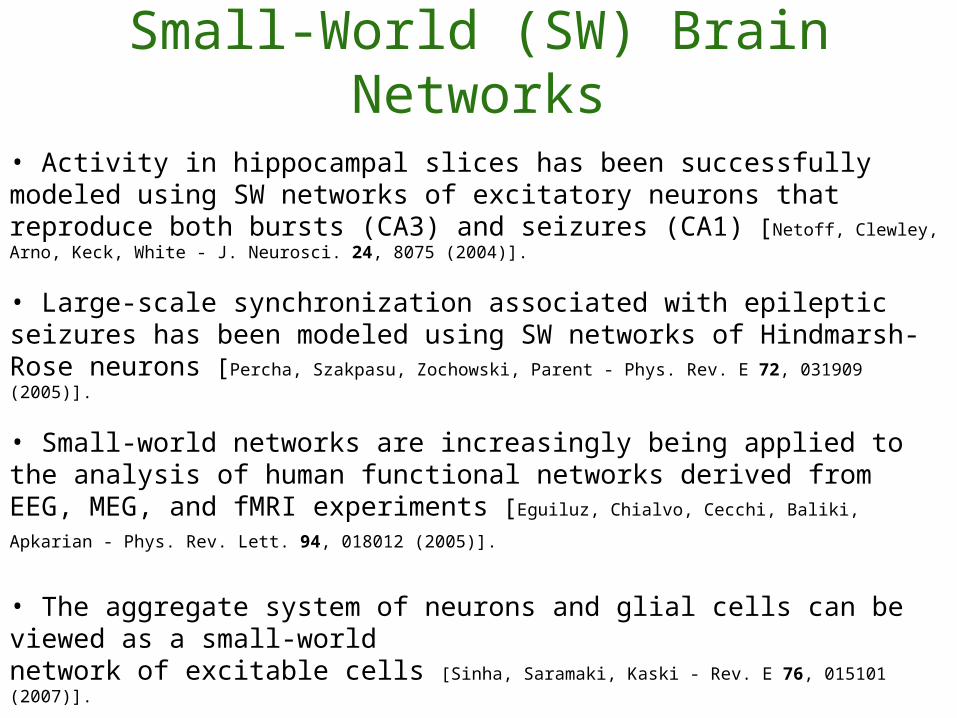
Small-World (SW) Brain Networks
• Activity in hippocampal slices has been successfully modeled using SW networks of excitatory neurons that reproduce both bursts (CA3) and seizures (CA1) [Netoff, Clewley, Arno, Keck, White - J. Neurosci. 24, 8075 (2004)].
• Large-scale synchronization associated with epileptic seizures has been modeled using SW networks of Hindmarsh-Rose neurons [Percha, Szakpasu, Zochowski, Parent - Phys. Rev. E 72, 031909 (2005)].
• Small-world networks are increasingly being applied to the analysis of human functional networks derived from EEG, MEG, and fMRI experiments [Eguiluz, Chialvo, Cecchi, Baliki, Apkarian - Phys. Rev. Lett. 94, 018012 (2005)].
• The aggregate system of neurons and glial cells can be viewed as a small-world network of excitable cells [Sinha, Saramaki, Kaski - Rev. E 76, 015101 (2007)].
• A large-scale structural SW model of the dentate gyrus has been formulated and used to identify topological determinants of epileptogenesis [Dyhrfjeld-Johnsen, Santhakumar, Morgan, Huerta, Tsimring, Soltesz - J. Neurophysiol. 97, 1566 (2007)].

Dentate Gyrus: a Small-World Network
Complex network topology: neither regular, nor random
QuickTime™ and aTIFF (Uncompressed) decompressor
are needed to see this picture.
L : average path length C : clustering coefficient
The average number of synapses between any two neurons in the dentate gyrus is less than three - similar to the average path length for the nervous system of C. Elegans, which has only 302 neurons as opposed to over one million! [Dyhrfjeld-Johnsen, Santhakumar, Morgan, Huerta, Tsimring, Soltesz - J. Neurophysiol. 97, 1566 (2007)]

Excitable Integrate-and-Fire Neurons
Spikes are produced whenever:
Followed by a reset:
Excitable neurons if:
<

Network Activity: p = 0
QuickTime™ and aGIF decompressor
are needed to see this picture.

Network Activity: p = 0.05
QuickTime™ and aGIF decompressor
are needed to see this picture.

Sustained Network Activity
p=0 p=0.05

Instantaneous Firing Rate, p = 0.10

Sustained Network Activity: Oscillations
QuickTime™ and aTIFF (Uncompressed) decompressor
are needed to see this picture.

Network Activity: p = 0.15
QuickTime™ and aGIF decompressor
are needed to see this picture.

Sustained Network Activity
p=0.05 p=0.15

Failure to Sustain Oscillations
100
0
Ensemble average over many network configurations with the same density p of shortcuts. Some of the configurations will sustain persistent oscillatory activity, while some will burst and fail. Is there a well defined transition for large networks?

Failure to Sustain Oscillations
Failure involves the interaction of two time scales:
1) A cellular time scale associated with the time TR needed for a neuron to recover to the point where a single synaptic input will make it fire:
2) A network time scale associated with the TN (p) for the first return of activity in a small-world network:
[Newman, Moore, Watts - Phys. Rev. Lett. 84, 3201 (2000)]
, where

Transition to Failure
The failure transition occurs at a size-dependent critical density of shortcuts, determined by the condition
The critical density pcr scales with the logarithm of the size N of the system.

Transition to Failure

Sustained Oscillations: Backbone Pathway
QuickTime™ and aTIFF (Uncompressed) decompressor
are needed to see this picture.
Backbone neurons shown in red; N=1000, p=0.10, and TR = 2.494.

Sustained Oscillations: Attractors
Oscillatory solutions characterized by their period, their mean firing rate, and the standard deviation of their firing rate.
N=1000, p=0.05, D= 0.10
QuickTime™ and aTIFF (Uncompressed) decompressor
are needed to see this picture. QuickTime™ and aTIFF (Uncompressed) decompressor
are needed to see this picture.
Number of attractors vs N

Fast Waves: D= 0.10
QuickTime™ and aTIFF (Uncompressed) decompressor
are needed to see this picture.
p = 0.01, 0.05, 0.10, 0.15, 0.20, 0.25, from (a) to (f)

Slow Waves: D= 0.16
QuickTime™ and aTIFF (Uncompressed) decompressor
are needed to see this picture.
p = 0.01, 0.20, 0.40, 1.00, from (a) to (d)
Activity in (d) is noisy and exhibits synchronized population spikes

Slow Waves: Increasing D
D= 0.06, 0.08, 0.10, 0.12, 0.14, 0.16, 0.18

Reentrant Network Activity: p = 0.8
D= 0.16

Reentrant Network Activity: p = 1.0
D= 0.16

Chaotic Neural Activity
N=1000, D= 0.16
QuickTime™ and aTIFF (Uncompressed) decompressor
are needed to see this picture.
Dashed vertical line indicates TR, the minimum value of the interspike interval (ISI) if neurons receive only one input per cycle. As p increases, an increasing number of neurons exhibit ISIs below TR. These ‘faster’ neurons receive multiple inputs via shortcuts, and they sustain network activity while the `slower’ neurons recover.

Chaotic Neural Activity
Temporal complexity of activity patterns in chaotic regime.
N=1000, D= 0.18
QuickTime™ and aTIFF (Uncompressed) decompressor
are needed to see this picture.
Lifetime of chaotic activity: stretched exponentials.QuickTime™ and a
TIFF (Uncompressed) decompressorare needed to see this picture.
QuickTime™ and aTIFF (Uncompressed) decompressor
are needed to see this picture.
p=1, D= 0.18 and D= 0.165

Bistability: a switch-off mechanism

Summary• Small-world networks of excitable neurons are capable of supporting sustained activity. This activity is sparse and oscillatory, and it does not require excitatory-inhibitory interactions.
• A transition to failure occurs with increasing density of shortcuts. Below the failure transition, the number of attractors increases at least linearly with the size N of the system. A connectivity backbone can be associated with each attractor.
• Above the transition, the network dynamics exhibit exceedingly long chaotic transients; failure times follow a stretched exponential distribution. Periods of low activity are mediated by `early firing’ neurons that receive more than one shortcut input. This chaotic activity does not require a balanced excitatory-inhibitory network.
CONNECTIVITY MATTERS!!!