Railroad Safety Advisory Committee (RSAC) Federal Railroad Administration.

Fast and Accurate Railroad Track Measurement - the
Detroit People Mover's New Automated System
Soheil Saadat1, Bernard Schulze2, Steve J. Smith3,
Rickey L. Stratton4, Barbara Hansen5, Richard D. Curtis6, and Jaimy Juliano7
1Soheil Saadat, Project Manager, CTLGroup, Washington D.C. Office, 10480 Little Patuxent Parkway,
Suite 820, Columbia, MD 21044 , Email: [email protected], Phone: 410-997-0400, Fax: 410-997-
8480
2Bernard Schulze, Principal Engineer & Group Manager, CTLGroup, 5400 Old Orchard Road, Skokie, IL
60077, Email: [email protected], Phone: 847-972-3176, Fax: 847-965-6541
3Steve J. Smith, Principal Engineer & Group Manager, CTLGroup, Washington D.C. Office, 10480 Little
Patuxent Parkway, Suite 820, Columbia, MD 21044, Email: [email protected], Phone: 410-997-0400,
Fax: 410-997-8480
4Rickey L. Stratton, Transit Electrical Engineer, Detroit Transportation Corporation, The People Mover,
1420 Washington Blvd. (3rd Floor), Detroit, MI 48226, Email: [email protected], Phone:
313-224-2160, Fax: 313-224-2134
5Barbara Hansen, General Manager, Detroit Transportation Corporation, The People Mover, 1420
Washington Blvd. (3rd Floor), Detroit, MI 48226, Email: [email protected], Phone: 313-224-
2190, Fax: 313-224-2134
6Richard D. Curtis, Curtis Engineering Consulting Services, Inc., 8731 Crestwood Ave., Munster, IN
46321, Email: [email protected], Phone/Fax: 219-838-2045
7Jaimy Juliano, Piki Technology, 274 Penny Ln., Grayslake, IL, 60030, Email: [email protected],
Phone: 847-224-8470
ABSTRACT
Conventional track inspection methods are based on labor intensive visual and manual inspections that
are often either too slow or too inaccurate. Maintenance work on inner-city light rail systems with long
hours of operation and heavy ridership is typically performed during the few hours just before the morning
commute begins. An automated track measurement system that quickly and accurately identifies track
abnormalities is essential to safe and timely operation of inner-city light rail systems.
This paper presents the design, evaluation and implementation of an automated laser-based track
measurement system for the Detroit People Mover (DPM) light rail system by CTLGroup. DPM driverless
vehicles are powered by linear induction motors, with power to the system provided through a pair of
side-mounted conducting rails. The track measurement system utilizes five non-contact scanning lasers in
order to quickly and accurately measure vertical and lateral location of power rails as well as the vertical
location of the linear induction motor (LIM) reaction rail with respect to the running rails.
Sensors and data acquisition hardware are mounted on a lightweight track maintenance cart which is
pulled by a diesel powered maintenance vehicle. The system is run via laptop computer used by the
operator inside the maintenance vehicle, which is connected to the track maintenance cart by an
electrical umbilical cord. Its Graphical User Interface (GUI) allows the operator to start measurement from
any point along the track, adjust measurement increment along the track and automatically generate
detailed work orders for the maintenance crew. Measurements along the track are compared with preset
tolerances to identify locations and make appropriate corrective actions.
INTRODUCTION
The Detroit Transportation Corporation (DTC) of Detroit, Michigan - USA, is owner and operator of the
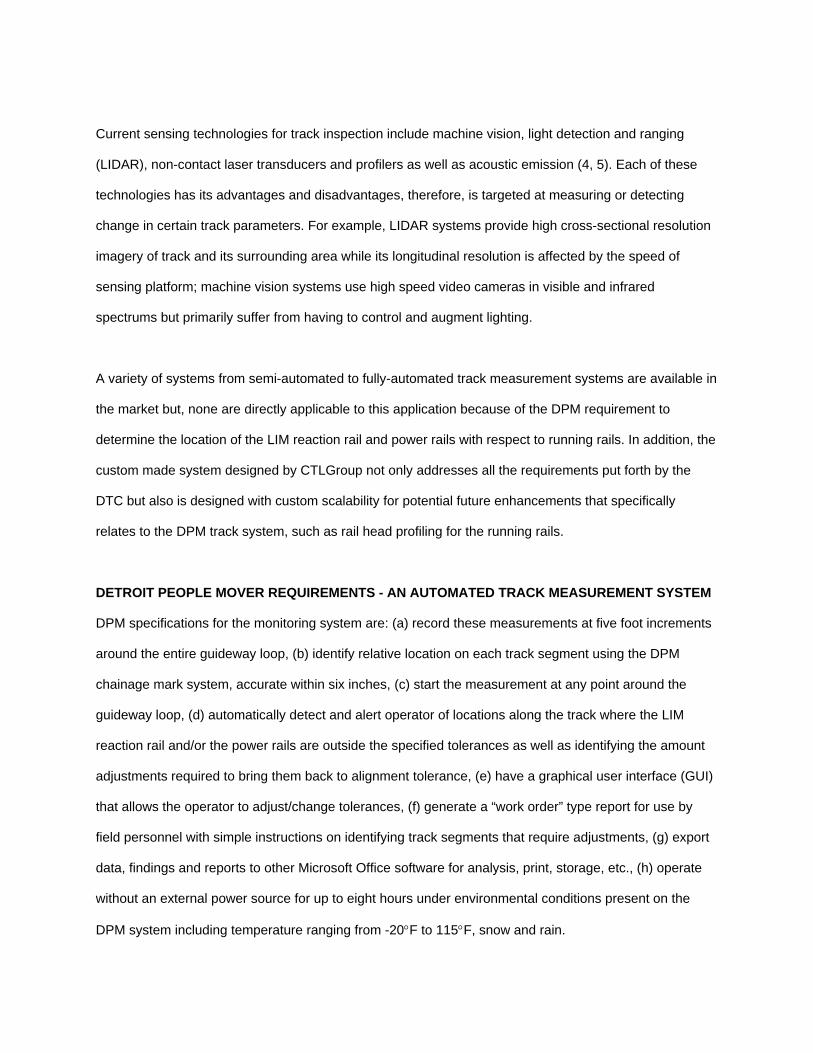
Detroit People Mover (DPM) system. The DPM system opened in 1987 and is located in the city’s central

business district. It consists of 2.9 miles (4.7 km) of a single-lane elevated concrete guideway loop
(Figure 2), 13 passenger stations, two power substations, and a Maintenance and Control Facility (MCF).
The guideway provides connections between various Downtown Detroit entities, such as:
• Courts
• Governmental administrative offices
• Sports arenas
• Exhibition centers
• Major hotels
• Commercial & personal banking centers
• Retail districts
Table 1 below shows annual vehicle miles from 2004 – 2008 (1).
Guideway & Stations
The elevated guideway offers an advantage over street level traffic: it provides the trains with a distinctive
right of way: clear of automobile and pedestrian traffic. In addition, eight (8) DPM stations are integral with
pre-existing structures (Figure 1). The structure integrated stations link over 9 million square feet where
riders can traverse within, unburdened by outside elements.
Locations around the guideway loop are identified via: surveyor’s chainage markers or local reaction rail
segments. At chainage markers, locations along the guideway begin & end at the same point near the
Bricktown Station (“0+00” to “153+12”). This represents the 15,312 ft (2.9 mi) distance around the
guideway loop. At the local level, it is simply the number reaction rail segments along the guideway and
inside the MCF beginning with segment 000/001 between Michigan Avenue & Times Square stations.
Therefore, any given track location along the guideway can reliably be designated by a chainage marker
and the number of feet past that chainage marker.
DPM track is standard gauge (4 ft. 8.5 in.) using American Railway Engineering Association (AREA)
Standard 115RE rail. Rails are continuously welded in place and secured with elastomeric direct fixation
fasteners.
Vehicles, ATC & Propulsion
The DTC fleet consists of 12 driverless vehicles operated by control operators via the automatic train
control (ATC) induction loop system. The Automatic Train Control (ATC) system conducts all daily
scheduled revenue operations automatically with a minimum of human intervention. The ATC inductive
loop system functions on three-levels:
1. Management (System Management Center - SMC);
2. Operation (Vehicle Control Center - VCC)
3. Activation (Vehicle On-Board Control - VOBC).
DPM vehicles are normally operated in pairs and remotely controlled by an automatic train control (ATC)
system from the central control, which is located at the Maintenance and Control Facility. Trains are
propelled by four linear induction motors (two per vehicle) that are capable of providing a maximum train
speed of 56 mph. However based on the short guideway distance and track curvature, the average train
speed is 12 mph (19 km/hr). Round trip on the system is approximately 15 minutes and headway ranges
from 3 to 4 minutes. The average dwell at each station is 20 seconds. (2)

The LIM produces thrust electromagnetically; therefore, vehicle movement is entirely independent of
traction between the running rails and wheels. The LIM operates in conjunction with the reaction rail,
which is located between the running rails (Figure 2). The nominal air gap between the reaction rail and
bottom of the LIM is 0.43 inches (11 mm). The basic principle of operation is as follows: from the three-
phase AC input supplied by the Power Conversion Unit (PCU), the LIM creates a travelling magnetic field
in the air gap between the LIM and reaction rail. This magnetic field cuts the reaction rail top cap and
induces circulating currents. The interaction between the magnetic field and the induced currents
produces thrust. (2)
The LIM reaction rail forms a continuous electromagnetic conductor throughout the entire length of the
track, Figure 3. The reaction rail is mounted between the running rails with its upper surface at the same
height as the top of the running rails. To maintain proper thrust parameters, the reaction rail and the LIM
are adjusted to maintain a nominal gap. Two opposite polarity power rails, mounted on the concrete
parapet walls of the guideway as shown in Figure 3, transfer power to the vehicles via vehicle mounted
power current collector shoes. To ensure smooth engagement and disengagement of the vehicle power
current collectors, power rail ramps are provided at special locations along the track. The running rails
provide a continuous, non-current carrying ground for the system.
The Problem
DPM hours of operation are 6:30 a.m. to Midnight Monday through Thursday, 6:30 a.m. to 2:00 a.m. on
Friday, 9:00 a.m. to 2 a.m. on Saturday and Noon to Midnight on Sunday. Due to its hours of operation
access to track for inspection, maintenance and repair is primarily limited to early hours of the morning
during the week. Currently, track and guideway inspection is a labor intensive procedure where a trained
technician uses a manual measuring device to inspect track gage point and other critical parameters
(Figure 4). Therefore, it takes considerable time to completely inspect the 2.9 mile long track which is
further hampered by the cold weather during the winter months. This labor and time consuming
inspection process increases the likelihood of not detecting critical problems that can jeopardize safety,
cause damage to LIMs, power collectors, power rails, etc. and loss of revenue service.
In 2008, Detroit Transportation Corporation decided that an automated track inspection system is vital to
its on time operation, safety and lowering track inspection and maintenance costs in the long run. In April
of 2008 DTC issued an invitation for proposals (IFP) to solicit design and delivery of an automated track
measurement system. In response to this IFP, CTLGroup engineers submitted a proposal for design and
integration of an automated, non-contact, laser-based, fast and accurate track measurement system.
CTLGroup system design utilizes commercial-off-the-shelf (COTS) items such as rail road maintenance
carts, electronic data acquisition systems and sensors to measure lateral and vertical distances between
the LIM reaction rail, power rails and running rails for which detail information is provided in the following
sections.
In August of 2009, CTLGroup was awarded the contract by DTC for design and fabrication of the
proposed system. This paper presents the automated track measurement system designed by and
currently being fabricated at CTLGroup. The following sections provide an overview of the currently
available track measurement systems, DTC requirements for an automated track measurement system,
CTLGroup system design, related sensor fusion and data processing.
AN OVERVIEW OF RAILROAD TRACK MEASUREMENT SYSTEMS
Visual inspection was the primary method for track inspection before the advent of modern measurement
techniques, which is inherently slow and highly prone to human errors. Since the 1970’s, both speed and
accuracy of the inspection programs have been improved drastically as a result of technological
advances (3). Although being an integral part of any track inspection program, visual inspections primarily
rely on experience and technical knowledge of individuals who perform them. Since a single segment of a
track may be inspected by different inspectors at different times, visual inspections lack long-term
tractability and cannot be used for comparative studies and trend analyses. In contrast, modern sensing
technologies, electronic data acquisition devices and data processing techniques have made track
inspection process not only more accurate but provided the possibility of performing long-term
comparative and trend analyses.
Current sensing technologies for track inspection include machine vision, light detection and ranging
(LIDAR), non-contact laser transducers and profilers as well as acoustic emission (4, 5). Each of these
technologies has its advantages and disadvantages, therefore, is targeted at measuring or detecting
change in certain track parameters. For example, LIDAR systems provide high cross-sectional resolution
imagery of track and its surrounding area while its longitudinal resolution is affected by the speed of
sensing platform; machine vision systems use high speed video cameras in visible and infrared
spectrums but primarily suffer from having to control and augment lighting.
A variety of systems from semi-automated to fully-automated track measurement systems are available in
the market but, none are directly applicable to this application because of the DPM requirement to
determine the location of the LIM reaction rail and power rails with respect to running rails. In addition, the
custom made system designed by CTLGroup not only addresses all the requirements put forth by the
DTC but also is designed with custom scalability for potential future enhancements that specifically
relates to the DPM track system, such as rail head profiling for the running rails.
DETROIT PEOPLE MOVER REQUIREMENTS - AN AUTOMATED TRACK MEASUREMENT SYSTEM
DPM specifications for the monitoring system are: (a) record these measurements at five foot increments
around the entire guideway loop, (b) identify relative location on each track segment using the DPM
chainage mark system, accurate within six inches, (c) start the measurement at any point around the
guideway loop, (d) automatically detect and alert operator of locations along the track where the LIM
reaction rail and/or the power rails are outside the specified tolerances as well as identifying the amount
adjustments required to bring them back to alignment tolerance, (e) have a graphical user interface (GUI)
that allows the operator to adjust/change tolerances, (f) generate a “work order” type report for use by
field personnel with simple instructions on identifying track segments that require adjustments, (g) export
data, findings and reports to other Microsoft Office software for analysis, print, storage, etc., (h) operate
without an external power source for up to eight hours under environmental conditions present on the
DPM system including temperature ranging from -20°F to 115°F, snow and rain.

Based on these specifications, CTLGroup engineers and scientists proposed an automated, fast and
accurate railroad track measurement system that is presented in the following section.
CTLGROUP AUTOMATED TRACK MEASUREMENT SYSTEM DESIGN
The automated railroad track measurement system proposed by CTLGroup is a non-contact
measurement system that can collect and store track information for both real-time and offline analysis. A
contact-based measurement system is not practical because of the hazard associated with having direct
contact with power rails and, interference with track elements that surround the LIM reaction rail, as well
as the existence of mechanical switches along the track, Figure 5.
Overall, the system uses five non-contact laser sensors to measure the required track parameters. Four
scanCONTROL 2700-100 laser line scanners from Micro-Epsilon™ (6) are used to measure the running
and the power rails. A single beam optoNCDT 1300-200 laser sensor from Micro-Epsilon™ (6) is used to
measure the LIM reaction rail.
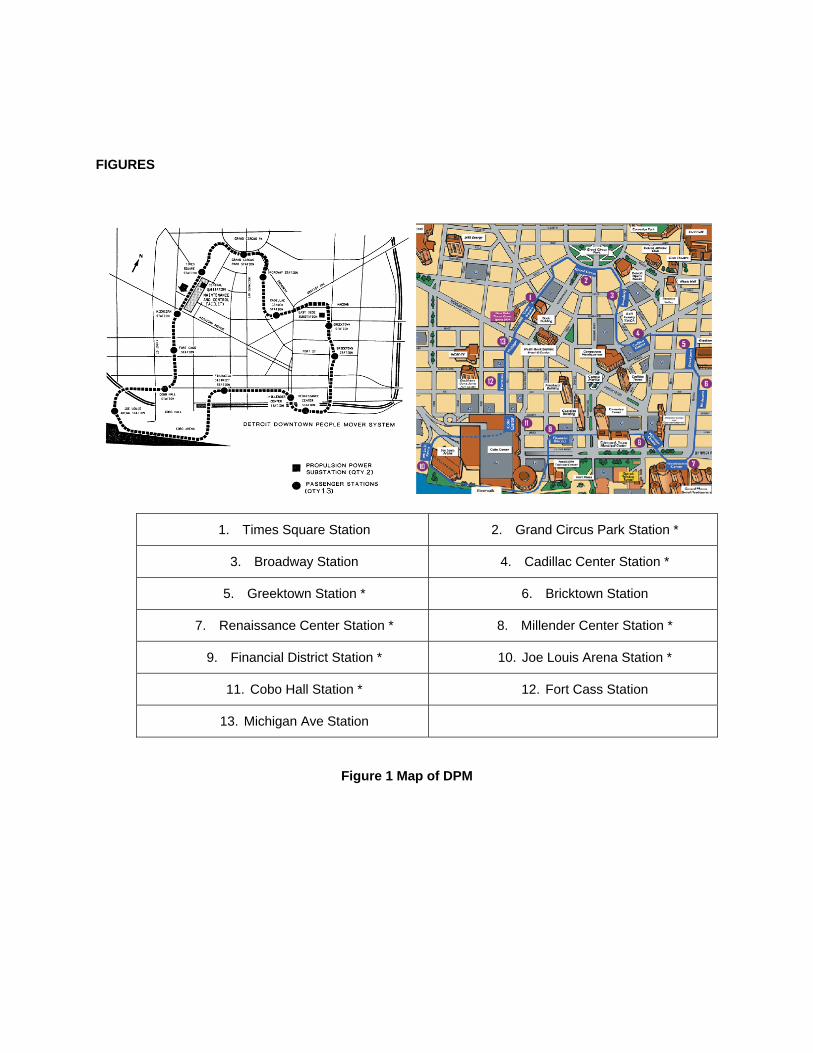
Sensors, data acquisition unit, control and computing modules are all installed on a light weight
measurement platform (TS-2) from the Nolan Company (7), as shown in Figure 6. The measurement
platform will be pulled over the track by a track maintenance diesel vehicle that also provides power to the
measurement system. All laser sensors are mounted on a rigid 80/20 aluminum modular frame system
that is mounted on the measurement platform. Figure 7 shows the schematic of laser sensor
configuration and Figure 8 is a picture of setup for initial test and assembly. Each sensor measures
distance of the objects in its field of view and/or range. These measurements are relative distances of the
objects from the rigid frame mounted on the measurement platform. Since all sensors are mounted on a
rigid frame, the vertical and horizontal distances among them are known and fixed. Therefore, one can
easily calculate the absolute vertical and horizontal distances of the power rails, the LIM reaction rail and
one of the running rails with respect to the top of the reference running rail. Either the inner or the outer
running rail can be used as the reference. The reference running rail is the one that is closer to the power

rails and since the power rails switch side around the guideway the reference running rail also switches
from side to side along the track. Presence of power rails are detected from the output of the laser line
scanners, and consequently all of the measurements are referenced to the appropriate running rail.
As shown in Figure 7, there is a global (X,Y) and several local (x,y) Cartesian coordinate systems for
measuring vertical and lateral location of power rails as well as the vertical location of the LIM reaction
rail, with respect to the reference running rail. The global (X,Y) coordinate system is used to reference all
measurements with respect to the reference running rail. The local (x,y) coordinate systems are
associated with direct measurements from individual sensors. For example, the profile obtained from
scanning one of the running rails represents the local (x,y) coordinates of the scanned points with respect
to the location and orientation of the corresponding laser line scanners.
Within the global (X,Y) coordinate system the vertical and lateral distances among all laser line scanners
and the single point laser sensor that measures the LIM reaction rail are known. These are fixed
distances that relate to the location of the sensors on the rigid sensor frame. Therefore, once individual
measurements from each sensor are transferred from corresponding local coordinate systems to the
global coordinate system, all relative vertical and lateral distances can be easily calculated.
In order to identify the relative location of the measurement platform around the guideway loop using the
chainage mark system, a high-resolution, incremental rotary encoder is mounted in line with the platform
rear axel.
Transition points along the guideway such as mechanical switches can create false alarms with regards
to track alignment. Therefore, to better detect passage over mechanical switches and to differentiate
them from actual track misalignment alarms, two single-axis accelerometers are used to measure
acceleration onboard the measurement platform.
Since the measurement platform shall operate under environmental conditions present on the DPM
system including temperature ranging from -20°F to 115°F, an onboard thermocouple is used to measure

ambient temperature during the winter time. The thermocouple output is used to automatically turn on a
series of electric heaters as needed.
An IOtech™ Personal DAQ/3001 data acquisition unit (8) is used to collect data from accelerometers,
thermocouple, encoder and single beam laser sensor. The same unit is also used to trigger laser line
scanners and heaters as needed. A GUI is developed in LabVIEW™ (9) to process sensor data, extract
relevant information, manage data storage and retrieval, generate reports and control the system. The
IOtech™ unit is connected to a laptop running the GUI via a USB connection and the four laser line
scanners are directly connected to the laptop via a USB fire-wire hub. Figure 9 shows the interconnection
of sensors, data acquisition unit and other major electrical/electronic components of the system that are
mounted on the measurement platform. The total power requirement for the system is estimated at 400
Watts and will be provided by the track maintenance diesel vehicle.
SENSOR FUSION, DATA PROCESSING AND SYSTEM OPERATION
The GUI gives the operator options for starting track measurement and managing previously stored data.
If the starting track measurement option is selected, the system then performs a series of self diagnostic
tests. Once it passes these tests successfully, it prompts the operator to select and/or enter certain
measurement settings, and to proceed with data collection. If the data management option is selected,
the system will provide the operator with commands to load, analyze and print previously collected data
and work orders.
The measurement system is periodically checked for dimensional accuracy by utilizing a manually
dimensioned section of the maintenance building track. The cart will be passed over this rail section and
the recorded data will be compared with the manually measured data (previously entered). The system
will allow adjustments to be made so that the system is always calibrated to the reference section of rail.
Once the system successfully passes the self diagnostic test, it prompts the operator to (a) enter the initial
location of the measurement platform according to the chainage mark system, (b) identify if

measurements are taken in the clockwise or counter clockwise direction with clockwise direction defined
as the direction of increasing chainage marks and (c) enter the spatial sampling or the distance between
successive data collections along the track.
At this time, the system is ready to collect data and prompts the operator to move the measurement
platform along the track at a steady and low speed. As the platform moves, the encoder records its
relative location. The system collects (a) the profiles of the running and power rails, (b) the standoff
distance of the LIM reaction rail, (c) the ambient temperature and (d) the accelerometer outputs, at the
user defined spatial intervals.
After each collection, data from all sensors is checked to confirm proper sensors operation. The ambient
temperature is checked to make sure it is within the operating range of laser sensors. If ambient
temperature is lower than the minimum operating temperature of these sensors, heaters will be turned on.
The accelerometer outputs are analyzed in time and frequency domains to identify passage over
mechanical switches and other track components that can introduce false alarms regarding tolerances. If
an out of tolerance alarm is issued while passage over such components is detected, that spatial data
point is discarded. Otherwise, required track parameters for that location are calculated, stored and
prompted to the operator.
Extensive laboratory experiments with profiling the rail head resulted in efficient algorithms for extracting
locations of the gage and top-of-the-rail points on the running rails as well as the reference location on the
power rails. In the case of running rails, the laser line scanners that capture locations of the gage and top-
of-the-rail points are mounted at an angle, as shown previously in Figure 7. A sample of such a profile is
shown in Figure 10 where different segments of the profile associated with the base of the rail head, gage
point and top-of-the-rail are presented in black, red and blue colors respectively.
Similarly, the laser line scanners that capture locations of the power rails are mounted at an angle, as
shown previously in Figure 7 and Figure 8. A sample of such a profile is shown in Figure 11, where

different segments of the profile associated with the face and parts of the upper ledge are presented in
red, blue and black colors respectively.
As mentioned previously, the reference running rail, to which all distances are measured, is the one that
is closest to the power rails. At various locations around the track, the power rails switch sides and so
does the reference running rail. Wherever this happens, there is a transition area where power rails are
present at both sides of the elevated concrete guideway. At these locations, profiles from the two laser
line scanners that are mounted on both sides of the measurement platform are processed to detect
presence of the power rails and to identify which pair to incorporate into the calculations. The elevated
concrete guideway walls are out of laser line scanner range. Therefore, wherever power rails are not
present, the sensor output will be a flat line with all data points having the same standoff distance from
the sensor. When power rails are detected on both sides, a switch from one pair to another happens
when the current power rails go out of sensor range or the other pair comes into the sensor range,
whichever happens first. Finally, the output of the single beam laser looking at the LIM reaction rail is
analyzed and incorporated into calculation of all relative horizontal and vertical distances with respect to
the reference running rail.
A special jig, which represents a small segment of the track, will be fabricated for inspection and
calibration of the system. The horizontal and vertical distances between the running rails, the LIM reaction
rail and the power rails on the jig are known. Whenever it is necessary to check system calibration, the
measurement platform will be moved over this special calibration jig. Through the GUI, the operator
selects the calibration option and then the system will collect a series of data from all laser sensors. All of
the relative horizontal and vertical distances are calculated and compared with preset tolerances. If
deviations from present tolerances are detected, the corresponding sensors are flagged for further
inspection.

CONCLUSION
There are a wide range of track measurement systems currently available. On one end of the spectrum,
there are simple handheld semi-automatic systems that cost a few thousand dollars, which can be used
for limited track inspection tasks. Then, there are fully automated track measurement platforms that can
cost several million dollars, which can inspect long track segments at the track speed. CTLGroup
automated track measurement system is tailored to the DPM specific track monitoring and maintenance
requirements. As such, it provides the DPM with means to monitor, analyze and store relevant track
parameters for immediate and long term trend analysis, with minimum human involvement. At the same
time, its intuitive design makes it easy to operate and the use of commercially-off-the-shelf (COTS)
sensors, data acquisition devices and hardware minimizes the maintenance cost. Finally, the DPM direct
involvement during the conceptual design and development provided them with the opportunity of
purchasing a custom made track measurement system that fits their budget while providing them with the
necessary information to maintain track integrity while also reducing future maintenance costs.
REFERENCES (1) National Transit Database
http://www.ntdprogram.gov/ntdprogram/cs?action=showRegionAgencies®ion=5
(2) Maintenance Manual for The Detroit Downtown People Mover, The Urban Transportation
Development Division of Lavlin Technical Publications - Kingston Ontario, Canada – Revision: Dec. 1989
(3) Swadisavi, S., Edwards, J.R., Resendiz, E., Hart, J.M., Barkan, C.P.L. and Ahuja, N., “Machine-Vision
Inspection of Railroad Track,” AREMA 2008 Annual Conference, Salt Lake City, UT, September 21-24,
2008.
http://www.arema.org/eseries/scriptcontent/custom/e_arema/library/2008_Conference_Proceedings/Mach
ine-Vision_Inspection_of_Railroad_Track_2008.pdf (accessed June 2, 2010)

(4) Clouse, A. and Kesler, K., “Advancements in Track Inspection,” AREMA 2003 Annual Conference,
Chicago, IL, October 5-8, 2003.
http://www.arema.org/eseries/scriptcontent/custom/e_arema/library/2003_Conference_Proceedings/0002
.pdf (accessed June 2, 2010)
(5) Clouse, A.L., Bloom, J. and Cook, S., “Track Inspection into the 21st Century,” Proceedings of the
AREMA 2006 Annual Conference, Louisville, KY, September 17020, 2006.
http://www.arema.org/eseries/scriptcontent/custom/e_arema/library/2006_Conference_Proceedings/053.
pdf (accessed June 2, 2010)
(6) Micro-Epsilon America, 8120 Brownleigh Drive, Raleigh, NC 27617. http://www.me-sensor.com
(accessed June 2, 2010)
(7) The Nolan Company, 1016 Ninth Street SW, Canton, Oh 44707. http://www.nolancompany.com
(accessed June 2, 2010)
(8) Measurement Computing Corporation, 10 Commerce Way, Norton, MA 02766.
http://www.mccdaq.com/index.aspx (accessed June 2, 2010)
(9) National Instruments Corporation, 11500 N Mopac Expwy, Austin, TX 78759. http://www.ni.com/
(accessed June 2, 2010)
FIGURES
1. Times Square Station 2. Grand Circus Park Station *
3. Broadway Station 4. Cadillac Center Station *
5. Greektown Station * 6. Bricktown Station
7. Renaissance Center Station * 8. Millender Center Station *
9. Financial District Station * 10. Joe Louis Arena Station *
11. Cobo Hall Station * 12. Fort Cass Station
13. Michigan Ave Station
Figure 1 Map of DPM

Figure 2 DPM Guideway Cross-section & Pictoral View
Figure 3 Linear Induction Motor (LIM) reaction rail configuration

Figure 4 Manual measurement device
(a) (b)
Figure 5 (a) Mechanical switch inside maintenance shop, (b) Location of the power rails and LIM reaction rail with respect to the running rails

Figure 6 Nolan Company, model TS-2 Cart
Figure 7 Laser sensors configuration schematic
Running Rail LIM reaction rail
Power Rails Laser Profilers Sensor Platform Single Point Laser
X
Y
x
y
y
x y
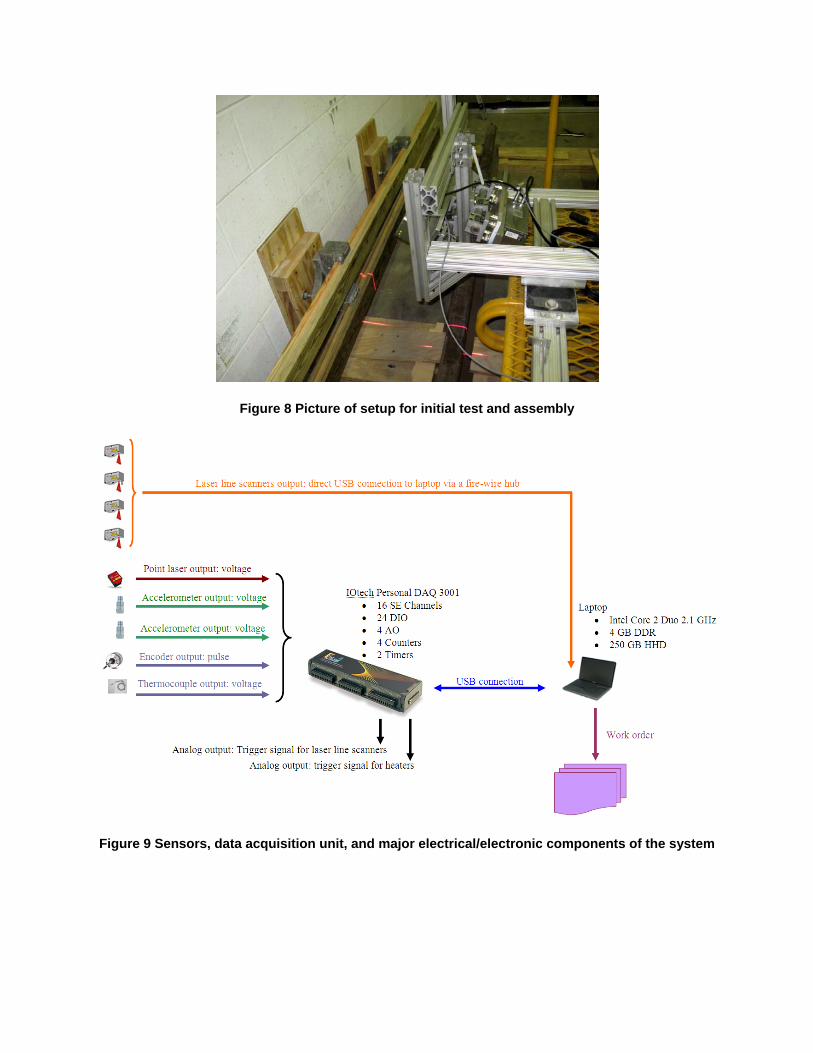
Figure 8 Picture of setup for initial test and assembly
Figure 9 Sensors, data acquisition unit, and major electrical/electronic components of the system
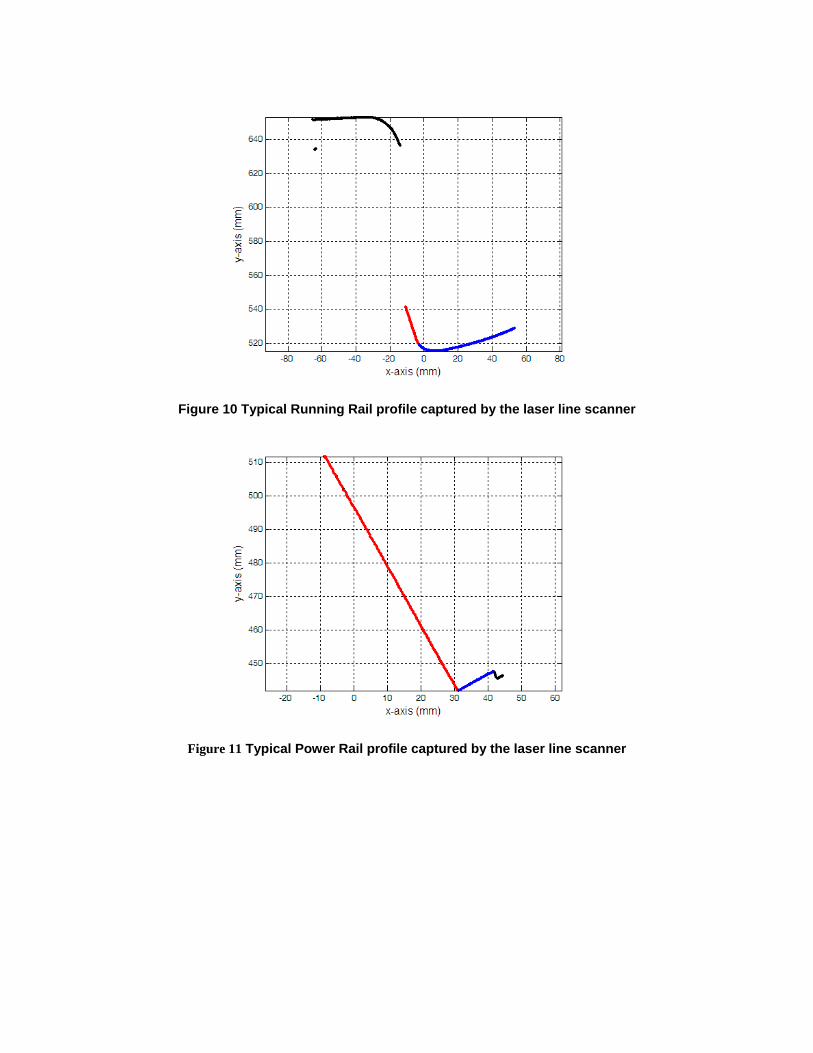
Figure 10 Typical Running Rail profile captured by the laser line scanner
Figure 11 Typical Power Rail profile captured by the laser line scanner

LIST OF FIGURES
Figure 1: Map of DPM
Figure 2: DPM Guideway Cross-section & Pictoral View
Figure 3: Linear Induction Motor (LIM) reaction rail configuration
Figure 4; Manual measurement device
Figure 5: (a) Mechanical switch inside maintenance shop, (b) Location of the power rails and
LIM reaction rail with respect to the running rails
Figure 6: Nolan Company, model TS-2 Cart
Figure 7: Laser sensors configuration schematic
Figure 8: Picture of setup for initial test and assembly
Figure 9: Sensors, data acquisition unit, and major electrical/electronic components of the
system
Figure 10: Typical Running Rail profile captured by the laser line scanner
Figure 11: Typical Power Rail profile captured by the laser line scanner