Farmer Demand for Soil Fertility Management Practices in Kenya's Grain Basket Mercy Kamau
39
Farmer Demand for Soil Fertility Management Practices in Kenya’s Grain Basket Mercy Kamau 1 , Melinda Smale 2 and Mercy Mutua 3 1 Senior Research Fellow and corresponding author, Tegemeo Institute of Egerton University, P. O. Box 1159, 00606 Nairobi, [email protected], +254722751475, +254-20-2717819. 2 Professor, Michigan State University, [email protected]. 3 Research Assistant, Tegemeo Institute of Egerton University, [email protected] Selected Paper prepared for presentation at the Agricultural & Applied Economics Association’s 2013 AAEA & CAES Joint Annual Meeting, Washington, DC, August 4-6, 2013. Copyright 2013 by Mercy Kamau, Melinda Smale and Mercy Mutua. All rights reserved. Readers may make verbatim copies of this document for non-commercial purposes by any means, provided that this copyright notice appears on all such copies.
Transcript of Farmer Demand for Soil Fertility Management Practices in Kenya's Grain Basket Mercy Kamau

Farmer Demand for Soil Fertility Management Practices in Kenya’s Grain Basket
Mercy Kamau1, Melinda Smale
2 and Mercy Mutua
3
1 Senior Research Fellow and corresponding author, Tegemeo Institute of Egerton University, P. O.
Box 1159, 00606 Nairobi, [email protected], +254722751475, +254-20-2717819.
2 Professor, Michigan State University, [email protected].
3 Research Assistant, Tegemeo Institute of Egerton University, [email protected]
Selected Paper prepared for presentation at the Agricultural & Applied Economics Association’s 2013 AAEA & CAES Joint Annual Meeting, Washington, DC, August 4-6, 2013.
Copyright 2013 by Mercy Kamau, Melinda Smale and Mercy Mutua. All rights reserved. Readers
may make verbatim copies of this document for non-commercial purposes by any means, provided
that this copyright notice appears on all such copies.

Farmer Demand for Soil Fertility Management Practices in Kenya’s Grain Basket
Abstract
Use of soil amendments, including organic materials and mineral fertilizers, is
highly recommended for the replenishment of soil nutrients, improved soil health
and more efficient use of fertilizers in sub-Saharan Africa. Along with other
constraints, underdeveloped markets are often cited as a reason for limited uptake of
recommended practices. Recognizing the potential interrelationship among
practices, we estimate seemingly-unrelated, multivariate probit models to identify
the factors that determine use of inorganic fertilizer, other soil amendments, and
practices to control erosion by smallholder farmers in Kenya. We then estimate
demand for the most common soil nutrients (N and P). We find that, consistent with
theory, farmers are price-responsive and remoteness depresses demand for mineral
fertilizers. Knowledge and plot tenure have a strong influence on use of soil fertility
management practices. Sex of household head affects use of soil fertility
management practices only in maize production, and particularly in use of N and P.
Decisions to use different categories of soil fertility management practices are
correlated.
Key words: soil management, fertility, multivariate probit, demand, plot-level,
Kenya
3
1. Introduction
Poor soils and nutrient depletion have been described as the ‘fundamental biophysical root cause of
declining per capita food production’ in sub-Saharan Africa (Sanchez 1997). Land degradation
cripples smallholder crop production in many communities, including those found in the densely-
populated, grain-basket areas of Kenya. Founding research by Smaling et al. (1997) documented
the magnitude of nutrient losses, but also characterized smallholder practices as ‘abusive.’ Soil
related problems may also be inherent1; outside the deserts and drylands that comprise 60% of the
continent, much of the land is old and weathered, requiring special attention to be of use in
agriculture (http://eusoils.jrc.ec.europa.eu/library/maps/africa_atlas/).
Although experts debate the universality of the problem, as well as the adaptive capacity of
smallholder farmers (see Place et al. 2006), there seems little doubt that when soils are degraded,
raising productivity depends on restoring soil fertility through addition of both inorganic and
organic matter (Chivenge et al. 2011; Vanlauwe et al. 2010; Zingore et al. 2007; Zingore 2011).
Soil fertility experts have recommended integrating organic matter, such as manure from livestock
or post-harvest crop waste, to raise soil carbon levels and make nutrients from mineral fertilizers
more available to plants, enhancesoil structure, and improve the efficiency of fertilizer use.
Interactions between inorganic fertilizers and available organic inputs (mixtures) results in greater
nutrient efficiency (Giller et al. 1998; Vanlauwe et al. 2001). Addition of organic matter improves
nutrient and water retention in soils and creates a better synchrony in nutrient supply and crop
demand.
1 For example, soils developed on non-calcareous parent materials (inherently acidic) or soils in
humid regions become acidic naturally due to leaching under high rainfall conditions.

4
In some countries of Sub-Saharan Africa, extension messages now emphasize the use of
more legumes, intercropping, organic manure, reduced tillage, herbicides and agroforestry, and
there are some indications that farmers are adopting such practices (e.g., Holden and Lunduka
2010, Sauer and Tchale 2009). Successful cases of restorative options designed and promoted by
coalitions of agricultural researchers, farmers, and non-governmental organizations have also been
documented (Haggblade et al. 2010; Reij et al. 2009.
Recognition of the importance of the problem does not diminish the policy challenge for
governments in sub-Saharan Africa. We see two key dimensions to the policy challenge. First,
inorganic fertilizer continues to be viewed as a panacea for smallholder productivity, and is
promoted via input subsidies and other campaigns. The social costs of such policies could be high,
especially given the evidence that returns to use of inorganic fertilizer are low because it is often
applied inefficiently. Fertilizer response varies, as does the marginal productivity of nitrogen,
according to agro-ecological and soil conditions both among and within farms (Tittonell et al.
2005a,b; Vanlauwe et al. 2006; Zingore et al. 2007). Soils experts have shown that some soils do
not respond to mineral fertilizer, as recently confirmed in Kenya by Chivenge et al. (2009) and
Marenya and Barrett (2009). Farmers in the major maize-producing areas of Kenya may have
surpassed the optimum level of inorganic fertilizer application, challenging the notion that higher
rates of fertilizer use should be encouraged without considering the physical response of soils
(Sheahan 2011). Soil acidity can generate inefficiencies due to soil acidity (Pearce and Sumner
1997; Evans and Kamprath 1970). Fixation of phosphorus also depresses returns to phosphatic
fertilizers (Kanyanjua et al. 2002). These findings imply that considerable field research is needed
to adapt an extensive menu of soil fertility management practices to locally-specific biophysical

5
and socioeconomic conditions. In recognition of this fact, Vanlauwe et al. (2010) have defined
integrated soil fertility management explicitly in terms of local adaptation.
The second dimension of the policy challenge is that adoption of the practices needed to
restore soil properties and enhance response to inorganic fertilizer remains low. Economic
incentives for adoption of soil fertility management practices are constrained by a host of factors,
depending on the combination and timing. From an economics perspective, the most obvious
impediment is the time lag between farmer investments and observable payoffs, and their public
good nature when they involve land resource allocation. Some practices simply do not offer
sufficient gains in land and labor productivity to make the investment worthwhile for farmers in the
short term (Ruben et al. 2007; Pender 2008).
Studies in Eastern and Southern Africa have shown that adoption is limited by the amounts
of land and labor required to produce, process and apply some techniques and practices, such as
organic materials (Lunduka 2009, Marenya and Barrett 2007, Mugwe et al. 2009, Odendo et al.
2009). The choice of the practice, field, and timing are all important for successful application of
principle. Extending and adopting location-specific menus of practices is knowledge-intensive,
requiring substantial, innovative forms of investment in local research and training capacity
(Sanginga and Woomer 2009; Giller et al. 2006). Human capital and social capital are thus crucial
in diffusing such practices (Katungi 2006, Njuki et a. 2008, Mapila et al. 2012, Kassie et al. 2013.
Missing or underdeveloped markets for inorganic and organic fertilizer are often cited as a
reason for low uptake, but too little is known about them to guide policy interventions and
investment decisions. In this study, we characterize the market for management of soil fertility and
land quality among smallholder farmers in the ‘grain basket’ areas of Kenya.

6
Our analysis contributes to understanding about smallholder demand for soil fertility
management practices, including organic and inorganic fertilizer (N and P nutrients), and other soil
amendments in Sub-Saharan Africa, in several ways. Recognizing that maintenance of soil
quality/fertility entails the maintenance of the physical, chemical and biological properties of soil,
including nutrient status as well as erosion control, we group soil fertility management practices
into three bundles (categories): a) inorganic fertilizers b) other soil amendments; and c) erosion
control. We derive reduced-form, input demand functions based on the underlying conceptual
framework of the non-separable model of the agricultural household. To examine the binary choice
among the three bundles of practices, we apply a seemingly unrelated, multivariate probit model to
address jointness and interdependence among soil fertility management strategies. We then
estimate demand for N and P nutrients with a censored variable regression. Data were collected
by plot in 2008/9 from 1001 households in eight agro-ecological zones of western and central
Kenya. In all models, we control for the clustered structure of the data.
The conceptual framework is presented next. Section 3 describes the data source,
econometric approaches, and variables. Results are shown and interpreted in Section 4. Section 5
draws conclusions and discusses policy implications.
2. Conceptual framework
We view farming by smallholders in the grain basket areas of Kenya from the perspective of the
non-separable model of the agricultural household. In this framework, the shadow prices faced by
farmers reflect transaction costs that vary among households depending on their capital
endowments and features of relevant markets (e.g., de Janvry and Sadoulet, 1991). We adapt the
framework in order to focus on decisions regarding the adoption of soil fertility-enhancing inputs,

7
following recent applications by Lunduka (2009) in Malawi and Marenya and Barrett (2007) in
Kenya. Like Lunduka (2009), we conceptualize the decision in a static context where fertilizer
markets are imperfect and markets for other soil amendments, such as manure, are incomplete or
missing. Farm households maximize utility over a vector of consumption goods produced on the
farm or purchased (X) and leisure time (h). The crop production technology is a function of labor
input (L), the size of the landholding (A), and application of nutrients contained in mineral
fertilizers (zf), conditional on land quality ( is ), which is plot-specific. Land quality, a stock, is
influenced by variable investments in soil amendments (za) and erosion control (ze) in the current
period, quality in the past period, and essential land characteristics. Utility is maximized
conditional on household characteristics that shape preferences (Φh) and market characteristics
(Φm,), subject to the crop production technology and an expenditure-income constraint (<=Y) that
affects purchases of tradables, hired labor and mineral fertilizer, at observable prices p. Y includes
any savings from the previous period, and cash earnings from outside the farm (O). Time allocated
to farm production includes family and hired labor.
Maximizing utility subject to production technology and income constraints, and solving
Kuhn-Tucker conditions leads to optimal input demand equations for mineral fertilizer, soil
amendments and erosion control that can be expressed as a reduced form:
z* = z* (A, L, Y, p, Φh, Φm, is ) (1)
Equation 1, which depicts demand for three classes of soil fertility inputs z*=[zf, za, ze]* as
a function of scale and plot-specific land quality, farm labor supply, prices, exogenous income,
household and market characteristics, is the starting point for the econometric model.
8
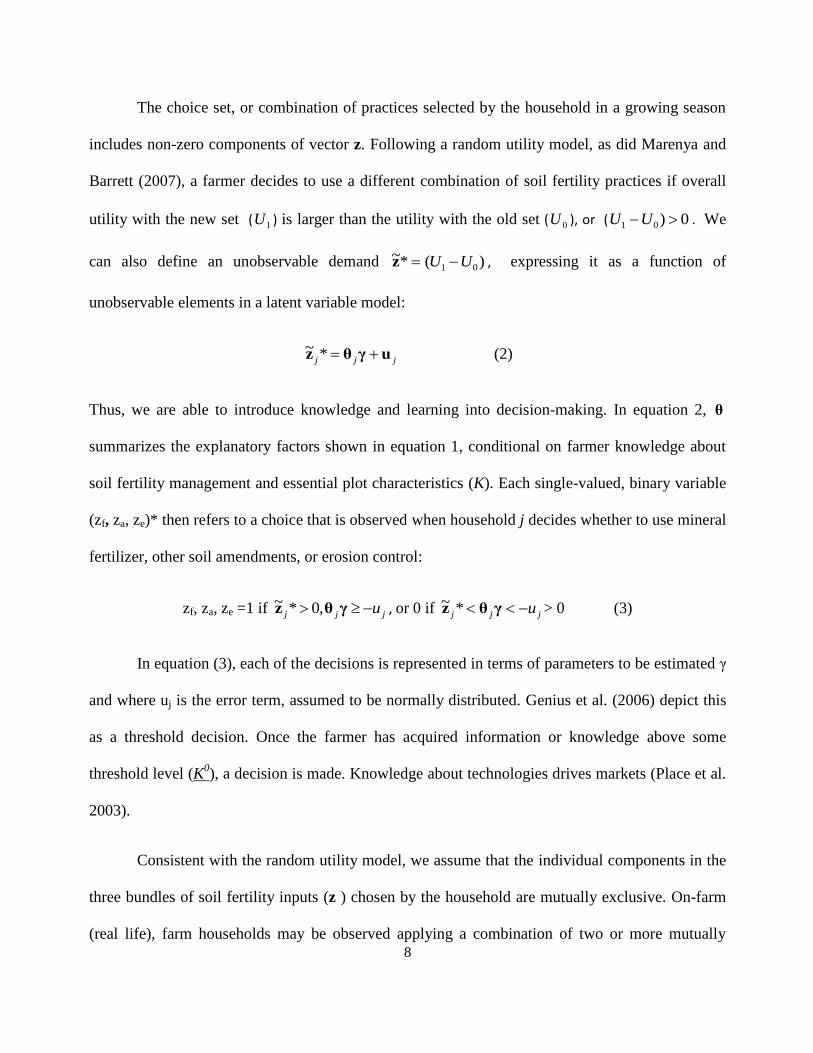
The choice set, or combination of practices selected by the household in a growing season
includes non-zero components of vector z. Following a random utility model, as did Marenya and
Barrett (2007), a farmer decides to use a different combination of soil fertility practices if overall
utility with the new set ( 1U ) is larger than the utility with the old set ( 0U ), or ( 0)01 UU . We
can also define an unobservable demand )(*~01 UU z , expressing it as a function of
unobservable elements in a latent variable model:
jjj uγθz *~ (2)
Thus, we are able to introduce knowledge and learning into decision-making. In equation 2, θ
summarizes the explanatory factors shown in equation 1, conditional on farmer knowledge about
soil fertility management and essential plot characteristics (K). Each single-valued, binary variable
(zf, za, ze)* then refers to a choice that is observed when household j decides whether to use mineral
fertilizer, other soil amendments, or erosion control:
zf, za, ze =1 if jjj u γθz ,0*~ , or 0 if jjj u γθz *~ > 0 (3)
In equation (3), each of the decisions is represented in terms of parameters to be estimated γ
and where uj is the error term, assumed to be normally distributed. Genius et al. (2006) depict this
as a threshold decision. Once the farmer has acquired information or knowledge above some
threshold level (K0), a decision is made. Knowledge about technologies drives markets (Place et al.
2003).
Consistent with the random utility model, we assume that the individual components in the
three bundles of soil fertility inputs (z ) chosen by the household are mutually exclusive. On-farm
(real life), farm households may be observed applying a combination of two or more mutually

9
exclusive strategies. Farm households may choose more than one strategy for two reasons: one,
because of the within-farm heterogeneity in terms of soil types, slope and fertility; and two, to
exploit the complementarities between alternative strategies such as controlling for soil or nutrient
loss, enriching the soil with nutrients or micro-organisms or even increasing the soils water holding
capacity. Similarly, Marenya and Barrett (2007) grouped practices in terms of stover/trash lines for
nutrient recycling, agroforestry for soil nutrient replenishment using woody species, use of
livestock manure, and the use of inorganic chemical fertilizers. The estimation approach is
described next.
3. Empirical approach
3.1. Data Source
Data were collected in ‘grain basket’ areas in Western (Western and Nyanza provinces) and
Central Kenya, which are defined by the Alliance for a Green Revolution in Africa (AGRA) as
those areas with high agricultural potential that has not been fully exploited. Within these
predominantly smallholder production systems, districts were selected according to high
inclusivity of staple crops. In the Central Highlands, these included Tigania West, Mukuruweini,
Kirinyaga West and Muranga South. In Western and Nyanza regions of Western Kenya, four
(Kakamega North, Teso North, Butula, and Bungoma) and three (Ugenya, Nyando, and Ndhiwa)
districts were selected, respectively. The randomly selected sample comprises of 1001 households
with a total of 5,967 easily identifiable farm plots. These can be easily identified as distinct units
since farmers normally delineate their farm using live hedges, terraces, ditches and paths or

10
permanent crops (Kamau et al. 2012). The number of plots per household ranged from four to
eight, with plot sizes measuring between 0.36 to 0.92 acres. A structured questionnaire was used in
collecting data. Cropping data refer to the 2008/2009 agricultural season while all other data
(household, market) refer to the calendar year 2009. The location of study sites is shown in
Figure 1.
Figure 1: Location of Study Sites
3.2. Econometric approach
Statistical challenges of modeling adoption decisions involving packages or bundles of inputs have
been addressed in a number of ways over the past few decades, particularly with regard to
sustainable farming practices. In early research, despite the recognition that adoption of technology

11
components is multivariate, econometric methods were limited to feasible approaches such as
multinomial logit, in which adoption outcomes were redefined to create an order. For example,
Caswell and Zilberman (1985) predicted the probability of adoption of either or both improved
irrigation methods (drip and sprinkler) relative to the use of traditional furrow irrigation. Dorfman
(1996) examined choices of bundles of irrigation techniques and integrated pest management
practices among apple growers, applying Gibbs sampling in a Bayesian framework to treat the
interrelationships among choices, and noting the difficulties of applying maximum-likelihood
methods. Wu and Babcock (1998) recognized that failure to treat the interdependence of choices
among soil fertility practices and techniques may under- or overestimate the influence of individual
factors on choices. Recently, Genius et al. (2006) estimated a trivariate probit model to analyze
organic farming decisions, using the simulation-based Geweke-Hajivassiliou-Keane (GHK)
algorithm to apply maximum-likelihood methods. All of these studies were conducted in the US.
In Kenya, Omamo et al. (2002) used a two-stage approach to test whether organic and
inorganic fertilizers were used as complements or substitutes, assuming a sequential adoption
process. Several recent studies about adoption of soil fertility management practices in Eastern and
Southern Africa have used a series of single probit or logit equations to model the range of
practices independently (Odendo et al. 2009, Mugwe et al. 2009, Mapila et al. 2012). Recognizing
that parameter estimates based on individual probit models may be biased by cross-practice
correlations, Marenya and Barrett (2007) applied a multivariate probit model. Kassie et al. (2013)
also analyzed the adoption of sustainable agricultural practices in Tanzania using a multivariate
probit model, demonstrating the interdependence among choices. These authors emphasize that
plot-level data are needed to control for within-farm heterogeneity and to accommodate, as much

12
as is feasible in a cross-section of households, the specificity of soil management -related
recommendations.
The data used in this study confirm that farmers in the grain basket areas of Kenya use one,
several, or complex combinations of practices to address segregated and overlapping constraints in
soil fertility. Research has also demonstrated that soil erosion lowers soil fertility through removal
of organic matter and nutrients in eroded sediment (Young, 1989). The control of erosion is
therefore necessary although not sufficient for maintaining soil fertility. Furthermore, the non-
separable model of the agricultural household predicts that market failures, imperfections or
missing markets for some components or practices may lead to variations in the way they are
applied that depend on household endowments. Heterogeneous household endowments may result
in substitution or complementary among practices.
Recognizing these features of the empirical context, and in concurrence with the recent
studies mentioned earlier, we apply seemingly-unrelated multivariate probit2 regression to estimate
the probabilities that households use one, two, or three mutually exclusive soil fertility strategies
(z), following equations 1-3. We estimate two MVP models. Given our geographical focus on the
grain basket areas of Kenya, we estimated the first model for all the plots that were cultivated in
both the main and minor seasons, while the second model as restricted to the plots that were
planted with maize. We test for dependence among decisions, report average partial effects and
2 M-equation multivariate probit model: The model has a structure similar to that of a seemingly-unrelated regression
(SUR) model, except that the dependent variables are binary indicators. As in the SUR case (sureg), the equations need
not include exactly the same set of explanatory variables.

13
also account for clustering among plots in computing robust standard errors of regression
coefficients. We also report joint probabilities for successes and failure among the three strategies.
Building on the decision to use inorganic fertilizer in the multivariate probit model, we
then use Tobit models to estimate reduced-form demand functions for nitrogen (N) and
phosphorous (P), derived from total kgs of mineral fertilizer applied, by type3. The Tobit model is
suitable for a corner solution response such as that of fertilizer use, where the variable is zero for a
nontrivial fraction of a population but continuously distributed over positive values.
All models were estimated at the plot level, thus controlling for variability across plots in
terms of slope, soil type, distance to the homestead and extent of degradation. This is consistent
with our conceptual framework, Kassie et al. (2013), Kamau et al. (2012) and experimental
research reported above. The factors affecting whether or not a household applied one or more of
the soil fertility strategy are not expected to differ from those affecting the amount demanded for
the elements, and thus the independent variables included in the Tobit models are those included in
the MVP estimation.
3.3. Variable definitions
Definitions and descriptive statistics for variables are shown in Table 1, reflecting equation (1) and
the knowledge threshold implied by equations (2-3).
Demand for three classes of soil fertility inputs z* was measured using dummy variables
with a value of one when investment was observed and zero otherwise (use of inorganic fertilizer
zf; use of erosion control ze; use of soil amendments za). The commonly used inorganic fertilizers
3 Originally, we also attempted to estimate regressions for potassium demand, but the data were sparse given that very
few farmers used fertilizers that contained this nutrient in more than zero or very small amounts,.

14
in the area of study are DAP, CAN, MAP, NPK, and urea. In the category of soil erosion control,
we included investment in windbreaks, contour farming, grass strips, afforestation, agro-forestry
and the construction of gabions, or cut off drains. Soil amendments included mulching; application
of compost, green and farmyard manure, as well as growing of legumes.
The dependent variables in the demand equations for mineral nutrients were calculated by
applying nitrogen (N) and phosphorus (P) percentages by fertilizer type to total kgs of fertilizer
applied. Constructed per acre, these express intensity of use.
The independent variables are observed at the scale of plot, household, and market.
Landholding size (A, equation 1) is measured in terms of plot size. Marenya and Barrett (2007)
found that size has a positive effect on all practices especially fertiliser and manure. Differences
among plots (size, tenure, soil fertility) affect their suitability for various investments (Tittonell
2005a,b; Abdulai et al., 2011). A dummy variable captures whether the plot is cultivated under
fixed rent contracts. We represented intercropping, which is a common practice in the study areas,
as the number of crops grown on the plot (the count, or ‘richness’ or crops). Having controlled for
intercropping with legumes, this variable may also indicate the effect of other crop enterprises such
as cash crops or vegetables on soil fertility management. The number of legume crops expresses
the potential effect of leguminous crops (beans, cowpeas, French beans, groundnuts, bambara
beans, pigeon peas, dolichos, soyabeans and green peas), which are promoted as sources of soil
nutrients, particularly nitrogen through nitrogen fixation. A negative effect is expected on use of
inorganic fertiliser since legumes are a substitute for some elements particularly N. Given that we
do not have historical data on the land quality stock ( is ), the number of legume crops provides
some indication of other underlying factors that may affect nutrient availability.

15
Household characteristics (Φh ) include human capital endowments, represented by the
number of years the household has been farming. This factor is also related to the history of past
investments in land quality ( is ) and to knowledge gained through experience. We measure wealth
by the value of livestock, which is also associated with the manure producing capacity (in quantity)
of the household. Moreover livestock ownership is positively related to households wealth so
wealthier households are more likely to use manure than poorer ones (Mekuria and Waddington
2002). However the effect of wealth on some of the investments/technologies is indeterminate
because some investments such as organic sources of nutrient are known to be more affordable to
poorer households than the inorganic sources (Soule and Shepherd 2000).
Male headship is expected to have a positive influence on all three investments in land. An
extensive literature has documented that female-headed households are known to have less access
to critical resources, especially cash and labour which are important in purchase of fertilisers, in
labour intensive soil fertility management practices, and in construction and maintenance of
erosion control measures. Women farmers are also known to have less access to information and
technology. Marenya and Barrett (2007) found male household heads were more likely to adopt
some ISFM practices (among them stover lines and agro-forestry), but found no difference between
male and female heads in the likelihood to adopt organic fertilizers.
Cash-earnings from off the farm (O) are measured as the proportion of off-farm income in
the household’s annual income. Off-farm earnings relieve seasonal cash constraints on investments
including the purchase of inorganic fertilisers and also for hiring labour to construct/maintain
erosion control structures or apply organic inputs. Farm households with greater off-farm income
often have more access to information on improved/new technologies, influencing the knowledge

16
threshold for adoption. Marenya and Barrett (2007) found that off-farm income influenced use of
soil fertility management practices in Western Kenya. On the other hand off-farm activities may
divert labour thereby reducing investments in agriculture and also labour. The effect of increasing
importance of off-farm income is therefore indeterminate a priori.
Labor input (L) is expressed in three variables calculated in terms of numbers of person-
months residing in the household, by age category. We differentiate household labor supply
according to age group, including young adults (15 - 23 years), mature adults (24 - 55 years) and
seniors (>55 years). Labor constraints are hypothesized to impede use of many soil fertility
management practices. Family labour is important for uptake of natural resource management
technologies when cash constraints are binding, but also because of the moral hazard associated
with hired labor. These variables may also reflect the role of life-cycle stage in adoption
decisions. For example, younger farmers who are expected to cultivate the land for a longer time
are better positioned to benefit from investments in soil-improving and conserving measures, if
they are not credit constrained (Abdulai 2011). Moreover, Odendo et al. (2009) found a negative
relationship of farming experience and adoption of manure, compost and chemical fertilizers.
Odendo et al. (2009) explain that as household heads advance in years they are more risk averse
and hence are less likely to adopt chemical fertilizers and other modern technologies.
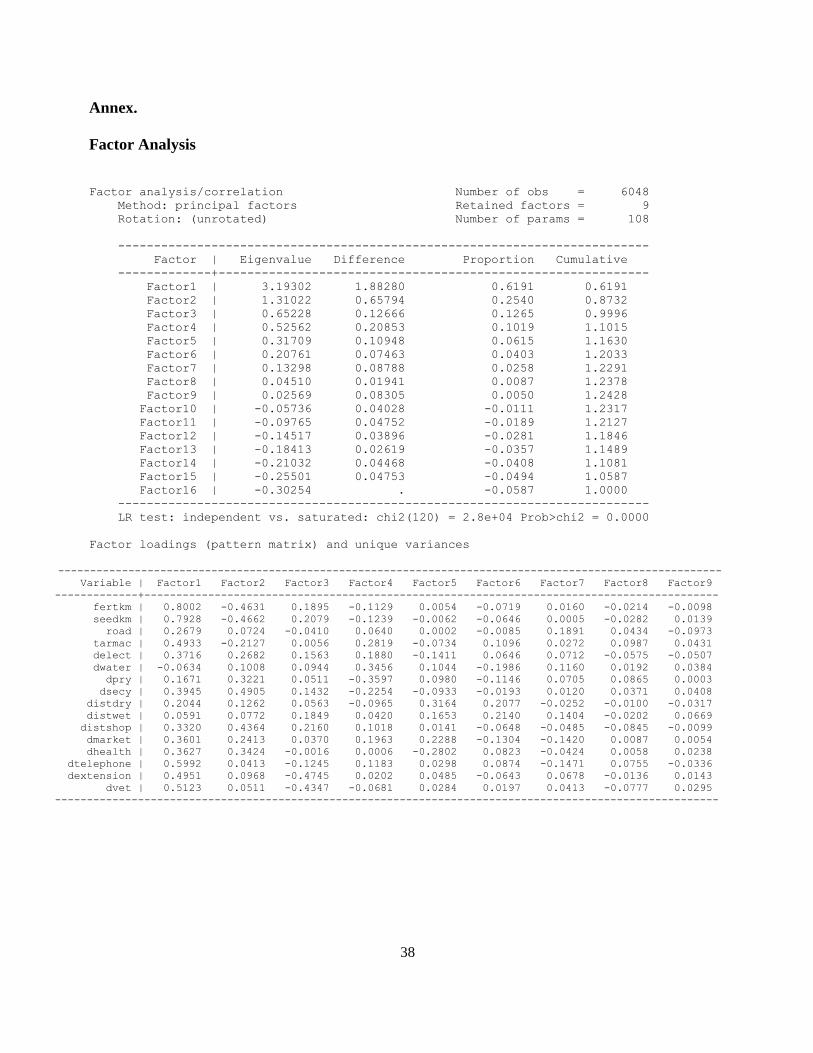
Economic principles predict that an improvement in market infrastructure (Φm) encourages
use of inputs through enhancing farm profitability. We include a factor score resulting from
principal components analysis of variables measuring distances to distance to seed and fertilizer
sellers, extension and vet service providers, tarmac road and telephone. The score represents the
relative ease with which small holder farmers access ”soft” and “hard” market infrastructure. A

17
negative sign on the regression coefficients suggests that lack of access to market services
depresses the use of soil fertility management technologies and demand for fertilizers. The factor
loading matrix is included in the Annex.
The vector p includes fertilizer prices. Not all farm households use chemical fertilizers
while those who do may use more than one type. We computed prices for those who applied
inorganic fertilizer as the kg-weighted sum of farm-gate prices across all types. For households
that did not use inorganic fertilizer, we imputed a village-level mean price. In the choice model, we
use predicted values for fertilizer price based on village effects to impute price. In the Tobit model,
we replace the fertilizer price with the ratio of fertilizer-to-maize grain price. A higher ratio is
expected to have a negative effect on the demand for inorganic fertilizers.
To represent K, we use an index computed from survey questions to proxy for knowledge
of land and soil fertility management. Respondents were asked to indicate their awareness of each
soil fertility management practice included in a pre-defined list, and then to rank knowledge of the
practice on a scale of 1 to 3 (3=very well; 2=some knowledge; 1=no knowledge). The index is a 3-
point Likert scale, in which the sum of the ranks over practices is standardized by the number of
practices about which the household is aware.
Finally, we include a dummy variable for season. The major season runs from March to
July whereas the minor season is from October to January.
4. Results
Average partial effects of explanatory factors on use of inorganic fertilizer, erosion control and
other soil amendments are shown in Table 2, for all plots and maize plots only.
18
Renting land is positively and significantly related to use of inorganic fertilizers on all plots
and on maize plots. When a farmer rents-in land, the focus is to maximize production, which may
be directly enhanced by the use of chemical fertilizers. Benefits of chemical fertilizers are captured
in the year the fertilizer is applied (Minot et al, 2000), although there may be some residual effects
in subsequent years. The coefficient is smaller and less significant for plots planted with maize
(0.232 compared with 0.472 for all plots), probably because households renting-in land mainly do
so for planting other high value crops.
By contrast, there is a lower likelihood of having other soil amendments or soil erosion
control measures on land which is rented-in, and particularly on maize plots. The large and
negative coefficient shows a strong inclination for farmers not to invest in practices like increasing
land quality (carbon content, water holding capacity etc.) and soil erosion control on land which
does not belong to them (e.g. rented land), probably because such rented land is not accessible to
them in the longer term. Overall, the magnitudes of the effects for renting-in land are relatively
large compared to those of other explanatory variables, confirming the importance of land tenure.
As expected, and based on previous research (Minot et al. 2000; Marenya and Barrett
2007), the likelihood of using inorganic fertilizer increases with plot size and so does the likelihood
of having soil erosion measures taken. The effect of plot size on fertilizer use is lower for plots
planted with maize either because there is not enough variation in plot sizes or size may be a proxy
for other factors (in the regression for all plots) which are unaccounted for in the model, such as
growing of cash crops (Marenya and Barrett 2007). Marenya and Barrett (2007) also suggest that
these technologies may not be scale-neutral (they depend on plot size).

19
As hypothesized, the likelihood that households will use soil fertility management practices
appears to be influenced by other farm practices, such as a greater cropping intensity, which is
associated positively with all three soil fertility practices on all plots and to a lesser extent (smaller
magnitudes) on maize plots. The number of legume crops is also positively associated with use of
soil amendments, but not on use of inorganic fertilizer—suggesting that legumes may be a
substitute for inorganic fertilizers rather than a complement or supplement.
Results confirm that the effect of season is generally an important consideration in the
uptake of soil fertility management practices. Households are more likely to use inorganic
fertilizer on plots planted with maize during the major season, but less likely to use other soil
amendments or engage in soil erosion control activities during this season. This finding is
consistent with the notion that farmers will tend to maximize returns to fertilizer during the main
rainy season when rains are heavier and more reliable. The lower uptake of labor intensive
activities may be explained by a relatively higher labor constraint during the main season.
Male headship (as compared to female headship) is a significant factor only on maize plots,
where the effect on use of inorganic fertilizer and soil erosion control is relatively large in
magnitude and positive. These findings are consistent with those of Minot et al. (2000) and
Marenya and Barrett (2007). Male headed household are more likely to apply erosion control
practices probably because they may be less labor constrained and also because such activities are
mainly accomplished by men.
As found in previous research, adult labor appears to constrain use of labor-intensive
practices such as soil erosion control and other soil amendments (Lunduka 2009, Marenya and
Barrett 2007, Mugwe et al. 2009, Odendo et al. 2009). However, disaggregating the family labour

20
by age categories provides the additional insight that a larger number of young adults (15 – 23
years) reduces the likelihood that a household will use inorganic fertilizers, while increasing the
supply of other adults (mature and seniors) does not influence its use. This variable may be a proxy
for other factors, such as constraints on financial liquidity, which are greater in households with
more young adults of tertiary school-going age. A higher number of seniors in the household had a
positive effect (although weakly significant) on the likelihood that household had soil erosion
control measures in place. Only an increase in mature adults (24 – 55 years) in the household
showed a positive effect (weakly significant for maize plots) on the likelihood that a household
uses soil amendments such as manure and compost, implying that family labor of this age group
enhances the uptake of other soil amendments.
Capital variables (value of livestock, human capital) have no discernible effects in these
models. The value of livestock is only a significant factor in the use of other soil amendments on
all plots. This finding may be associated with capacity to produce manure on-farm, and is
consistent with household behavior where markets are incomplete or missing (de Janvry et al.
1991; Lunduka 2009).
An increase in the share of off-farm earnings in total household income is positively
associated with soil erosion control and use of inorganic fertilizers on maize or any other plot. The
effect on erosion control is comparatively high. The result suggests that increasing off-farm income
may be an important pathway to investments in integrated soil fertility management by smallholder
farmers.
Knowledge of soil fertility management practices has a positively and significant influence
on soil fertility management, increasing the likelihood of use in all three categories of practices

21
(inorganic fertilizers, erosion control and other soil amendments). This effect was strongest and
greatest in maize plots.
Findings underscore the strong price response of farmers to the fertilizer price when
choosing soil fertility management practices. Households were less likely to use all categories of
soil fertility management practices when the price of fertilizer increased. This effect was greater in
maize plots with households being less likely to use inorganic fertilizers when the price of fertilizer
increases relative to that of grain. The negative effect of an increasing price of inorganic fertilizer
on the likelihood that soil amendments such as manure or compost will be used and on uptake of
erosion control practices suggests some input complementarity. Lastly, poor access to market
infrastructure diminishes the likelihood of use not only of inorganic fertilizers, particularly on
maize plots, but also the use of soil amendments such as manure and compost.
Table 3 shows the diagnostic tests related to the independence of the three choices, for all
plots and maize plots only. The significance and positive sign of ρ confirms a positive correlation
between the unobserved factors affecting the use of inorganic fertilizer, other soil amendments and
soil erosion control. Thus, the likelihood ratio test suggests that the multivariate probit model better
represents the underlying data process than single probit equations.
The statistics in Table 4 indicate that soil erosion control practices are more likely to be
established compared with either other soil amendments or use of inorganic fertilizers, and
inorganic fertilizers are less likely to be used than other soil amendments, for all plots and also for
maize plots. For any of the three practices, marginal probabilities are higher on maize fields than
on all plots. Predicted joint probabilities of non-use average 12% on all plots and 19% on maize

22
plots. The predicted joint probability of use for all three practices is 21% on all plots and only 12%
on maize plots.
Demand models for nitrogen (N) and phosphorus (P) are shown in Table 5. Households
applied higher rates of N and P on land which was rented-in and the effect is strong and highly
significant. Consistent with the findings reported above, the two elements are more intensively
used during the major rainy season. There was greater amount of N and P applied in plots planted
with maize, which is in line with previous findings that inorganic fertilizers are more likely to be
applied to maize than on other plots among smallholder farmers in this region. This effect was
highly significant but also largest in magnitude amongst all factors considered. Farmers also
applied N and P more intensively in larger plots, suggesting that land is a constraint to fertilizer
use. The two elements were applied more intensively in plots with more crops grown but less
intensively in plots planted with more legumes. This suggests that farmers are aware of the benefits
of nitrogen fixing leguminous crops and that legumes are substitutes for inorganic fertilizer. The
lower intensity of P applied may reduce nitrogen fixation since P is critical in nodulation in
leguminous crops.
Again, households with greater knowledge about soil fertility management applied N and P
more intensively. Male-headed households applied more N and P, a finding which is in line with
previous studies. Family labour supply also affected demand for both N and P in similar ways to
use of fertilizer in the multivariate probit model. Similarly, households with greater farming
experience were found to apply both elements less intensively, a behavior associated with greater
averseness to risk by older farmers.
The effect of markets on fertilizer demand is pronounced. Households in areas with
unfavorable market conditions (higher fertilizer prices and less access to market infrastructure)
23
applied N and P less intensively. Moreover, an increase in fertilizer price had a negative effect on
demand, particularly for N. The effect on P has the expected negative sign but is not statistically
significant.
5. Conclusions
Based on the conceptual framework of farmer decision-making with imperfect or missing markets
and a knowledge threshold, we have examined the use of soil fertility management strategies as a
multivariate probit model to allow for correlations between decisions. We then estimated the
demand for N and P per acre with a Tobit model.
Strong effects were observed for plot size and for land tenure, signaling the importance of
these variables and land use policy in encouraging greater adoption of integrated soil fertility
management practices. Findings also confirm the price responsiveness of farmers, and the
influence of market infrastructure (including various indicators of ‘hard’ and ‘soft’ infrastructure)
on their use of not only inorganic fertilizer, but soil erosion control and other soil amendments. An
increasing price of fertilizer, relative to that of grain, leads to a decline in demand for fertilizer, and
particularly N.
The analysis suggests that off-farm earnings positively influences the use of soil fertility
management practices, but reduces demand for inorganic fertilizer per acre. This finding raises
questions for further research. Are households whose off-farm earnings constitute an increasing
share of household income intensifying farm production or diversifying out of farming?
Multiple cropping and more cropping of legumes have various effects depending on the
practice, reflecting farmer objectives to maximize returns form inorganic fertilizers and the role of

24
nitrogen-fixing crops as substitutes. The higher demand for fertilizer per acre on plots planted with
maize confirms that maize is indeed the most fertilized crop on smallholder farms in the grain
basket of Kenya.
The crucial role of knowledge in uptake of integrated soil fertility management practices is
evident. Farming experience, measured simply in terms of years farming, has no perceptible effect.
The effect of numbers of household members, which we used to represent labor supply, depend on
the practice and also the age group represented, likely because life-cycle factors are confounded
with age groups. Female headship reduces uptake of soil fertility management measures on maize
and also demand for fertilizer (both N and P).
The findings point to the important ways through which commonly used proxies for family
labour influence soil fertility management, showing that different age groups within households
have different effects. It is evident that labour is the limiting factor in soil fertility management
during the main season.

25
6. Policy implications
Although the soils in smallholder farms in Kenya are highly degraded, there is less than half
a chance that households will apply inorganic fertilizers or other soil amendments. The average
intensity of fertilizer use is too low (4 kg/acre in all plots and 6 kg/acre in maize plots). From the
study findings we suggest the following policy interventions to increase demand for various soil
fertility management strategies in the study areas.
A better market environment and market-related incentives triggers the desired response of
increasing uptake of practices to manage soil better and increase fertilizer use per acre. Our
analysis suggests that policies aimed at improving the market infrastructure and services will
improve soil fertility management, and not just fertilizer use.
Although the rental-land market seems to offer adequate incentives for intensive use of
inorganic fertilizers, it currently lacks incentives that would promote the application of practices
for which economic benefits accrue over time, such as soil erosion control and use of soil
amendments. Policies aimed at improving the land rental market are necessary in this regard. For
example increasing tenant security in the long term would enable tenants to realize benefits of good
or sustainable soil fertility management.
Other than markets and infrastructure, efforts should be directed towards educating farmers
about soil fertility management strategies, and the potential for complementarity and
substitutability among practices. Targeted support is needed for households headed by women and
for young families. Innovations to reduce the laborintensivity of soil fertility management practices
should be encouraged. Further research is needed to explore the relationship between off-farm
earnings and investments in soil fertility management.
26
References
Abdulai, A., Owusu,V., and Goetz, R. 2011. "Land Tenure Differences and Investment in Land
Improvement Measures: Theoretical and Empirical Analyses." Journal of Development
Economics 96 (1): 66-78.
Cappellari, L., and S. P. Jenkins. 2003. Multivariate Probit Regression Using Simulated Maximum
Likelihood. Stata Journal 3: 278–294.
Caswell, M.F., and D. Zilberman. 1985. The choices of irrigation technologies in California.
American Journal of Agricultural Economics 67 (May): 224-34.
de Janvry, A., M. Fafchamps, and E. Sadoulet. 1991. Peasant Household Behavior with Missing
Markets: Some Paradoxes Explained. The Economic Journal 101: 1400-17.
Dorfman, J. 1996. Modeling multiple adoption decisions in a joint framework. American Journal of
Agricultural Economics 18 (August): 547-557.
Chivenge, P., Vanlauwe, B., and Six, J. 2011. “Does the Combined Application of Organic and
Mineral Nutrient Sources Influence Maize Productivity?” A Meta-Analysis. Plant Soil
342:1–30.
Chivenge, P., Vanlauwe, B., Gentile. R., Wangechi, H., Mugendi, D., vanKessel, C., Six, J. 2009.
“Organic and Mineral Input Management to Enhance Crop Productivity in Central Kenya.”
Agron J 101:1266–1275.
European Commission, Joint Research Council, Institute for Environment and Sustainability, Land
resource management unit. Soil Atlas of Africa:
http://eusoils.jrc.ec.europa.eu/library/maps/africa_atlas/
Evans, C. E., and E. J. Kamprath. 1970."Lime response as related to percent Al saturation, solution
Al, and organic matter content." Soil Science Society of America Journal 34(6): 893-896.

27
Genius, M., C. Pantzios, and V. Tzouvelekas. 2006. Information Acquisition and Adoption of
Organic Farming Practices. Journal of Agricultural and Resource Economics Vol. 31, No. 1
(April 2006), pp. 93-113
Giller, K.E., E. E. Rowe, N. de Ridder, H. van Keulen, H. 2006. Resource use dynamics
and interactions in the tropics: scaling up in space and time. Agric. Syst. 88, pp. 8-27.
Giller, K. E., Amijee, F., Brodrick, S. J., and Edje, O. T. 1998a. "Environmental Constraints to
Nodulation and Nitrogen Fixation of Phaseolus Vulgaris L in Tanzania II. Response to N
and P Fertilizers and Inoculation with Rhizobium." African Crop Science Journal 6( 2):
171-178.
Giller, K.E, Cadisch, G., and Mugwira, L.M. 1998b. “Potential Benefits from Interactions between
Mineral and Organic Nutrient Sources.” In Waddington, S.R., et al (eds) Soil Fertility
Research for Maize-Based Farming Systems in Malawi and Zimbabwe. Soil Fertility
Network and CIMMYT-Zimbabwe, Harare, pp 155–158.
Haggblade, S., G. Tembo, D. Kabore, C. Reij, O. C. Ajayi, S. Franzel, P. Mafongoya, and F. Place.
2010. Sustainable Soil Fertility Management Systems. In S. Haggblade and P. B. R. Hazell.
Successes in African Agriculture. Johns Hopkins University Press and International Food
Policy Research Institute (IFPRI), Baltimore and Washington, DC.
Holden, S., and R. Lunduka. 2010. Too Poor to be Efficient? Impacts of the Targeted Fertilizer
Subsidy Programme in Malawi on Farm Plot Level Input Use, Crop Choice and Land
Productivity. Noragric Report No. 55. Aas, Norway: Norwegian University of Life Sciences
UMB.

28
Kamau, M. W., Burger, K., Giller, K. E., and Kuyvenhoven, A. 2012. “Determinants of Labour
Mobility Within Smallholder Farms in Western Kenya and Implications for Labour Use
Efficiency.” African Journal of Agricultural Research 7(23): 3375-3384.
Kanyanjua, S. M., Ireri, L., Wambua, S., and Nandwa, S. M. 2002. “Acid Soils in Kenya:
Constraints and Remedial Options.” KARI Technical Note No. 11, KARI Headquarters,
Nairobi.
Kassie, M., Jaleta, M., Shiferaw, B., Mmbando, F., and Mekuria, M., 2013. “Adoption of
Interrelated Sustainable Agricultural Practices in Smallholder Systems: Evidence from
Rural Tanzania.” Technological Forecasting and Social Change 80: 525-540.
Katungi, E. 2006. “Social Capital and Technology Adoption on Small Farms: A Case of Banana
Production Technology in Uganda.” Ph.D. Thesis, University of Pretoria.
Lunduka, R.W. 2009. “Land Rental Markets, Investment and Productivity Under Customary Land
Tenure Systems in Malawi.” Phd. Dissertation, Department of Economics and Resource
Management. Norwegian University of Life Sciences.
Mapila, M.A.T.J., Njuki, J., Delve, R.J., Zingore, S., and Matibini, J. 2012. “Determinants of
Fertilizer Use by Smallholder Maize Farmers In The Chinyanja Triangle of Malawi,
Mozambique and Zambia. Agrekon 51: 21-41.
Marenya, P., and C. Barrett. 2009. “Soil Quality and Fertilizer Use Rates among Smallholder
Farmers in Western Kenya.”Agricultural Economics 40: 561–572.
Marenya, P.P., and C.B. Barrett. 2007. “Household-level Determinants of Adoption of Improved
Natural Resources Management Practices among Smallholder Farmers in Western Kenya.”
Food Policy 32 : 515–536.

29
Mekuria, M, and S.R.Waddington. 2002. Initiatives to encourage farmer adoption of soil fertility
technologies for maize-based cropping systems in southern Africa. In ‘Natural Resources
Management in African Agriculture: Understanding and Improving Current Practices’.
(Eds. CB Barrett, F Place and AA Aboud). pp. 219-233. CAB International, Wallingford,
UK.
Minot, N., Kherallah, M., and Berry, P. 2000. “Fertilizer Market Reform and the Determinants of
Fertilizer Use in Benin and Malawi.” MSSD Discussion Paper No. 40.
Mugwe, J., Mugendi, D., Mucheru-Muna, M., Merckx, R., Chianu, J., and Vanlauwe, B. 2009.
“Determinants of the Decision to adopt Integrated Soil Fertility Management Practices by
Smallholder Farmers in the Central Highlands of Kenya.” Experimental Agriculture 45: 66-
71.
Njuki, J., Mapila, M.T., Zingore, Z., and Delve, R. 2008. “The Dynamics of Social Capital in
Influencing Use of Soil Management Options in the Chinyanja Triangle of Southern
Africa.” Ecology and Society 13 (2): 9.
Odendo, M., Obare, G., and Salasya, B. 2009. “Factors Responsible for Differences in Uptake of
Integrated Soil Fertility Management Practices amongst Smallholders in Western Kenya.”
African Journal of Agricultural Research 4 (11): 1303-1311.
Omamo, S. W., Jeffrey C. W., Obare, G. A., and Ndiwa N. N. 2002. "Soil Fertility Management on
Small Farms in Africa: Evidence from Nakuru District, Kenya." Food policy 27 (2 ): 159-
170.
Pearce, R. C., and M. E. Sumner. 1997. Apparent Salt Sorption Reactions in an Unfertilized Acid
Subsoil. Soil Science Society of America Journal 61(3): 765-772.

30
Pender, J. 2008. “Agricultural Technology Choices for Poor Farmers in Less-favoured Areas of
South and East Asia,” Occasional Papers 5.
Place, F., J. Pender, and S. Ehui. 2006. Key issues for the sustainable development of smallholder
agriculture in the East African Highlands. In J. Penderl, F. Place, and S. Ehui, Strategies for
Sustainalbe Land Management in the East African Highlands. International Food Policy
Research Institute (IFPRI), Washington, DC.
Place, F,. Barrett, C. B., Freeman, H. A., Ramisch, J. J., and Vanlauwe B., 2003. "Prospects for
Integrated Soil Fertility Management Using Organic and Inorganic Inputs: Evidence from
Smallholder African Agricultural Systems." Food Policy 28( 4): 365-378.
Reij, C., Tappan, G., and Smale, M. 2009. “Re-Greening the Sahel: Farmer-led Innovation in
Burkina Faso and Niger.” In D. J. Spielman and R. Pandya-Lorch (ed.), Millions Fed:
Proven Successes in Agricultural Development. International Food Policy Research
Institute, Washington, D.
Ruben, R., Pender, J., and A. Kuyvenhoven 2007. “Sustainable Poverty Reduction in Less-
favoured Areas: Problems, Options and Strategies.” In Ruben, R., Pender, J., and
ArieKuyvenhoven, ed. Sustainable Poverty Reduction in Less-Favoured Areas, Boston:
Cambridge University Press.
Sanchez, P. A., Shepherd, K. D., Soule, M, J., Place, F.M., Buresh, R. J., Izac, A.N., Mokwunye,
A. U., Kwesiga, F. R., Ndiritu, C. G. and Woomer, P. L. 1997."Soil fertility replenishment
in Africa: an Investment in Natural Resource Capital." In Replenishing soil fertility in
Africa, pp.1-46.

31
Sanginga, N., and P.L Woomer. 2009. “Integrated Soil Fertility Management in Africa: Principles,
Practices and Developmental Process.” Tropical Soil Biology and Fertility Institute of the
International Centre for Tropical Agriculture, Nairobi.
Sauer, J., and H. Tchale. 2009. “The Economics of Soil Fertility Management in Malawi. Review of
Agricultural Economics 31(3): 535–560.
Sheahan, M. B. 2011. “Analysis of Fertilizer Profitability and Use in Kenya.” MSc. Thesis,
Michigan State University.
Smaling, E., Nandwa S. M., and Bert H. J. 1997. "Soil fertility in Africa is at stake." In
Replenishing soil fertility in Africa replenishingsoi, pp. 47-61.
Soule, M.J., Shepherd, K.D., 2000. An ecological and economic analysis of phosphorus
replenishment for Vihiga division, western Kenya. Agricultural Systems 64 (2), pp. 83–98.
Tittonell, P., Vanlauwe, B., Leffelaar, P.A., Shepherd, K.D., Giller, K.E.. 2005a. “Exploring
Diversity in Soil Fertility Management of Smallholder Farms in Western Kenya: I.
Heterogeneity at region and farm scale.” Agriculture, Ecosystems and Environment
110:149-165.
Tittonell, P., Vanlauwe, B., Leffelaar, P.A., Shepherd, K.D., Giller, K.E., 2005b. “Exploring
Diversity in Soil Fertility Management of Smallholder Farms in Western Kenya: II. Within-
farm Variability in Resource Allocation, Nutrient Flows and Soil Fertility Status.”
Agriculture, Ecosystems and Environment 110, 166-184.
Vanlauwe, B., Chianu, J., Giller, K.E., Merck, R., Mokwenye, U., Pypers, P., Shepherd, K.,
Smaling, E., Woomer, P.L., and Sanginga, N., 2010. “Integrated Soil Fertility Management:
Operational Definition and Consequences for Implementation and Dissemination.” Outlook
on Agriculture 39:17-24.
32
Vanlauwe, B., Kouessi, A., Aman, S., Iwuafor, E. N., Tossah, B. K., Diels, J., Sanginga, N.,
Lyasse, O., Merckx, R., and Deckers, J. 2001. "Maize Yield as Affected by Organic Inputs
and Urea in the West African Moist Savanna." Agronomy journal 93( 6 ): 1191-1199.
Vanlauwe, B., Tittonell, P., & Mukulama, J. 2006. “Within-farm Soil Fertility Gradients Affect
Response of Maize to Fertiliser Application in Western Kenya.” Nutrient Cycling in
Agroecosystems 76:171-182.
Vanlauwe. B., Bationo, A., Chianu ,J., Giller, K., Merckx, R., Mokwunye, U., Ohiokpehai, O.,
Pypers, P., Tabo, R., Shepherd, K. (2010). “Integrated Soil Fertility Management:
Operational Definition and Consequences for Implementation and Dissemination.
OutlAgric 39:17–24
Wu, J. J., and B. A., Babcock. 1998. “The Choice of Tillage, Rotation, and Soil Testing Practices:
Economic and Environmental Implications.” American Journal of Agricultural Economics
80:494-511.
Young, A. 1989. Agroforestry for soil conservation. ICRAF's Science and Practice of Agroforestry
No. 5. Nairobi: ICRAF.
Zingore, S. 2011. “Maize Productivity and Response toFertilizer Use as Affected by Soil Fertility
Variability, Manure Application, and Cropping System. Better Crops 95(1):1-6.
Zingore, S., Murwira, H.K., Delve, R.J., and Giller, K.E. 2007. “Soil Type, Historical
Management and Current Resource Allocation: Three Dimensions Regulating Variability of
Maize Yields and Nutrient Use Efficiencies on African Smallholder Farms.” Field Crops
Research 101: 296-305.

33

34
Table 1: Variable definitions and summary statistics
Definition
All plots Maize plots
Variable Mean Std. Error Mean
Std.
Error
Inorganic Whether inorganic fertilizer was used?
1=yes; 0=no 0.31 0.01 0.49 0.01
Erosion Whether erosion control structures in
plot? 1=yes; 0= no 0.59 0.01 0.68 0.01
Amendments Whether there were other soil
amendments?1=yes; 0=no 0.40 0.01 0.54 0.01
Rent land Whether land is rented-in 1=lease; 0= no 0.10 0.00 0.14 0.01
Season Season (1=major; 0=minor) 0.65 0.01 0.58 0.01
Plot size Size of plot (acres) 0.55 0.01 0.82 0.01
Ncrops Number of crops planted in plot 2.09 0.02 3.09 0.04
Nlegumes Number of legumes planted in plot 0.56 0.01 0.95 0.01
Maize Whether plot was planted with maize=1;
else 0 0.42 0.01 1.00 0.00
Phosphorus (P) use intensity (kg per acre) 4.51 0.25 6.09 0.50
Nitrogen (N) use intensity (kg per acre) 4.85 0.18 6.04 0.28
Off-farm income Proportion of household income from off-
farm activities 0.35 0.01 0.35 0.01
Female headship Sex of household head (1=male;0 female) 0.76 0.01 0.76 0.01
Labour 1 Number (person months) residing in
household (15 to 23 years) 12.42 0.45 12.41 0.45
Labour 2 Number (person months) residing in
household (24 to 55 years) 17.28 0.35 17.30 0.35
Labour 3 Number (person months) residing in
household (over 55 years) 6.69 0.27 6.69 0.28
Number of years household has been
farming 23.72 0.49 23.71 0.49
Infrastructure Market infrastructural development
(factor score) -0.03 0.00 -0.02 0.00
Livestock value Value of livestock owned by household
(KES) 32887 1264 33061 1272
Fertilizer price Fertilizer price - predicted (KES per kg) 60.89 0.45 60.87 0.45
Priceratio Fertilizer to maize grain price ratio - - 2.68 0.11
Knowledge Household knowledge on ISFM 2.54 0.01 2.54 0.01
N=6048 plots of which 2513 were maize plots; N=1000 households of which 992 planted maize. Source: Authors

35
Table 2: Multivariate probit regressions explaining investments in soil fertility management All Plots Maize Plots Only
Inorganic
Fertilizer
Soil Erosion
Control
Other Soil
Amendments
Inorganic
Fertilizer
Soil Erosion
Control
Other Soil
Amendments
Rent land 0.4721** -0.3783** -0.4423** 0.2321* -0.6444** -0.8127**
(0.080) (0.088) (0.115) (0.103) (0.110) (0.120)
Off-farm income 0.1602* 0.3284** 0.1675+ 0.2860* 0.2348+ 0.0702
(0.081) (0.119) (0.093) (0.113) (0.140) (0.108)
Season -0.0048 -0.3578** -0.3044** 0.1629** -0.2842** -0.2101**
(0.038) (0.028) (0.026) (0.055) (0.044) (0.046)
Plot size 0.4197** 0.1566** 0.0505 0.1337** -0.0081 -0.0552
(0.043) (0.043) (0.036) (0.047) (0.047) (0.049)
Ncrops 0.1177** 0.1403** 0.1404** 0.0621** 0.1198** 0.0955**
(0.012) (0.014) (0.013) (0.016) (0.019) (0.017)
Nlegumes 0.0395 0.0144 0.2054** -0.0279 -0.0236 0.1752**
(0.039) (0.037) (0.035) (0.057) (0.059) (0.055)
Female headship 0.1013 0.1042 -0.1324 0.3425** 0.2397* 0.0310
(0.083) (0.088) (0.083) (0.105) (0.108) (0.106)
Labor 1 -0.0053** 0.0024 -0.0014 -0.0050+ 0.0037 0.0020
(0.002) (0.002) (0.002) (0.003) (0.003) (0.003)
Labor 2 0.0031 0.0021 0.0073* 0.0020 0.0034 0.0072+
(0.003) (0.003) (0.003) (0.004) (0.004) (0.004)
Labor 3 -0.0053 0.0089+ 0.0022 -0.0084 0.0127+ -0.0021
(0.005) (0.005) (0.005) (0.006) (0.007) (0.006)
Experience -0.0023 0.0011 -0.0002 -0.0021 0.0007 0.0024
(0.003) (0.003) (0.002) (0.004) (0.004) (0.003)
Livestock value -0.0000 -0.0000 0.0000** 0.0000 0.0000 0.0000
(0.000) (0.000) (0.000) (0.000) (0.000) (0.000)
Markets -0.1643** 0.0179 -0.1005** -0.2237** -0.0237 -0.0749+
(0.034) (0.041) (0.032) (0.044) (0.049) (0.039)
Fertilizer price -0.0373** -0.0119* -0.0273** -0.2305** -0.0418 -0.1585*
(0.004) (0.005) (0.005) (0.070) (0.075) (0.073)
Knowledge 0.1836* 0.3444** 0.1526+ 0.5931** 0.4040** 0.3630**
(0.078) (0.091) (0.078) (0.105) (0.103) (0.102)
Constant 0.7808* -0.2955 0.7145+ -1.5595** -0.9436* -0.8625*
(0.393) (0.448) (0.405) (0.369) (0.380) (0.360)
Observations 5,801 5,801 5,801 2,413 2,413 2,413
Robust standard errors in parentheses.** p<0.01, * p<0.05, + p<0.1

36
Table 3: Diagnostic tests for multivariate probit models All Plots Maize Plots Only Inorganic fertilizer and erosion 0.0863** 0.0513 control (atrho21) (0.029) (0.045) Inorganic fertilizer and other soil 0.1820** 0.0259 amendments (atrho31) (0.028) (0.041) Erosion control and other soil 0.0699* 0.1368** amendments (atrho32) (0.032) (0.045) Chi-square for LR test of rho (ρ) = 0 90.69*** 19.58*** Source: Authors
Table 4: Predictions from the multivariate probit model (simulated maximum likelihood)
Mean (All Plots) Mean (Maize Plots)
Marginal predicted probability of inorganic fertilizer use 0.32 0.47
Marginal predicted probability of erosion control 0.60 0.66
Marginal predicted probability of soil amendment 0.40 0.51
Predicted joint probability of failure in every outcome 0.12 0.19
Predicted joint probability of success in every outcome 0.21 0.12
Note: The mvprobit program in STATA fits multivariate probit models using the simulated maximum likelihood
using the Geweke–Hajivassiliou–Keane or the so-called GHK simulator (Cappellari, L. and S. P. Jenkins, 2003).
Source: Authors

37
Table 4: Tobit regressions explaining intensity (kg per acre) of fertilizer (inorganic) use
Nitrogen
(N)
Phosphorous
(P)
Rent land 8.750*** 12.21***
(1.609) (2.644)
Off-farm income -1.370 -5.056*
(1.519) (2.649)
Season 4.711*** 5.258***
(1.176) (1.940)
Maize 17.59*** 28.78***
(1.349) (2.235)
Plot size 6.024*** 6.059***
(0.757) (1.245)
Ncrops 1.352*** 1.688***
(0.324) (0.531)
Nlegumes -6.065*** -7.513***
(1.016) (1.682)
Livestock value 2.21e-05* 3.28e-05*
(1.18e-05) (1.94e-05)
Experience -0.138*** -0.160**
(0.0462) (0.0768)
Female headship 4.986*** 5.267**
(1.448) (2.398)
Labor 1 -0.0599* -0.174***
(0.0350) (0.0589)
Labor 2 0.109** 0.197**
(0.0555) (0.0914)
Labor 3 -0.0321 -0.144
(0.0814) (0.136)
Markets -4.422*** -4.600***
(0.594) (0.955)
Fertilizer to maize price ratio -4.147*** -1.135
(0.945) (1.530)
Knowledge 8.701*** 12.39***
(1.420) (2.344)
Constant -46.37*** -87.81***
(5.101) (8.520)
Observations 5,801 5,801
Robust standard errors in parentheses. ** p<0.01, * p<0.05, + p<0.1
Source: Authors
38
Annex.
Factor Analysis
Factor analysis/correlation Number of obs = 6048
Method: principal factors Retained factors = 9
Rotation: (unrotated) Number of params = 108
--------------------------------------------------------------------------
Factor | Eigenvalue Difference Proportion Cumulative
-------------+------------------------------------------------------------
Factor1 | 3.19302 1.88280 0.6191 0.6191
Factor2 | 1.31022 0.65794 0.2540 0.8732
Factor3 | 0.65228 0.12666 0.1265 0.9996
Factor4 | 0.52562 0.20853 0.1019 1.1015
Factor5 | 0.31709 0.10948 0.0615 1.1630
Factor6 | 0.20761 0.07463 0.0403 1.2033
Factor7 | 0.13298 0.08788 0.0258 1.2291
Factor8 | 0.04510 0.01941 0.0087 1.2378
Factor9 | 0.02569 0.08305 0.0050 1.2428
Factor10 | -0.05736 0.04028 -0.0111 1.2317
Factor11 | -0.09765 0.04752 -0.0189 1.2127
Factor12 | -0.14517 0.03896 -0.0281 1.1846
Factor13 | -0.18413 0.02619 -0.0357 1.1489
Factor14 | -0.21032 0.04468 -0.0408 1.1081
Factor15 | -0.25501 0.04753 -0.0494 1.0587
Factor16 | -0.30254 . -0.0587 1.0000
--------------------------------------------------------------------------
LR test: independent vs. saturated: chi2(120) = 2.8e+04 Prob>chi2 = 0.0000
Factor loadings (pattern matrix) and unique variances
--------------------------------------------------------------------------------------------------------
Variable | Factor1 Factor2 Factor3 Factor4 Factor5 Factor6 Factor7 Factor8 Factor9
-------------+------------------------------------------------------------------------------------------
fertkm | 0.8002 -0.4631 0.1895 -0.1129 0.0054 -0.0719 0.0160 -0.0214 -0.0098
seedkm | 0.7928 -0.4662 0.2079 -0.1239 -0.0062 -0.0646 0.0005 -0.0282 0.0139
road | 0.2679 0.0724 -0.0410 0.0640 0.0002 -0.0085 0.1891 0.0434 -0.0973
tarmac | 0.4933 -0.2127 0.0056 0.2819 -0.0734 0.1096 0.0272 0.0987 0.0431
delect | 0.3716 0.2682 0.1563 0.1880 -0.1411 0.0646 0.0712 -0.0575 -0.0507
dwater | -0.0634 0.1008 0.0944 0.3456 0.1044 -0.1986 0.1160 0.0192 0.0384
dpry | 0.1671 0.3221 0.0511 -0.3597 0.0980 -0.1146 0.0705 0.0865 0.0003
dsecy | 0.3945 0.4905 0.1432 -0.2254 -0.0933 -0.0193 0.0120 0.0371 0.0408
distdry | 0.2044 0.1262 0.0563 -0.0965 0.3164 0.2077 -0.0252 -0.0100 -0.0317
distwet | 0.0591 0.0772 0.1849 0.0420 0.1653 0.2140 0.1404 -0.0202 0.0669
distshop | 0.3320 0.4364 0.2160 0.1018 0.0141 -0.0648 -0.0485 -0.0845 -0.0099
dmarket | 0.3601 0.2413 0.0370 0.1963 0.2288 -0.1304 -0.1420 0.0087 0.0054
dhealth | 0.3627 0.3424 -0.0016 0.0006 -0.2802 0.0823 -0.0424 0.0058 0.0238
dtelephone | 0.5992 0.0413 -0.1245 0.1183 0.0298 0.0874 -0.1471 0.0755 -0.0336
dextension | 0.4951 0.0968 -0.4745 0.0202 0.0485 -0.0643 0.0678 -0.0136 0.0143
dvet | 0.5123 0.0511 -0.4347 -0.0681 0.0284 0.0197 0.0413 -0.0777 0.0295
--------------------------------------------------------------------------------------------------------

39
Percentage of Households Aware of and Practicing Various Soil Fertility Management Technologies
Soil fertility management
practice
Western Nyanza Central Overall
Use of farm yard manure 93.5 69.3
Use of inorganic fertilisers 98.0 71.8
Terracing 89.8 58.6
Crop rotation 87.5 75.8
Grass trips 77.1 47.6
Wind breaks 62.8 38.9
Contour farming 56.4 38.9
Cut-off drains/soil bounding 67.1 42.6
Composting 84.0 46.4
Mulching/cover crop 68.1 38.7
Fallow 70.8 31.7
Afforestation 58.6 27.9
Agro forestry (other trees) 33.7 12.2
Growing legume crops 24.9 17.5
Slash and burn 67.3 20.7
Water pans/planting basins 11.5 7.0
Use of green manure 33.7 12.2
Minimum tillage 17.7 6.0
Agro forestry (legume trees 27.2 11.5
Gabions/storm bands 33.9 3.2
Use of lime 9.2 1.2
Use of inoculums 1.7 0.2
91.3 61.1
96.0 46.8
75.8 42.1
84.5 52.8
57.1 20.6
63.1 26.2
70.2 38.9
65.9 48.0
56.7 25.4
71.4 21.4
92.5 50.0
64.7 21.0
25.8 4.8
39.3 29.8
77.8 26.6
35.3 17.9
20.2 6.0
43.7 11.5
29.8 3.6
39.7 5.2
6.7 0.0
1.2 0.0
99.7 92.5
98.3 87.1
91.7 57.2
64.7 24.7
95.1 79.9
65.5 42.0
51.4 27.3
45.4 12.1
53.4 13.5
66.4 19.0
47.4 5.5
61.5 21.0
65.5 50.3
20.1 10.3
39.7 4.3
16.1 6.3
25.9 6.6
23.6 4.3
10.1 2.0
45.1 3.2
8.6 0.9
0.6 0.0
95.1 75.3
97.6 70.8
86.9 53.9
78.8 52.2
78.3 52.0
63.8 36.8
58.1 34.9
59.2 33.4
66.5 29.7
68.3 27.5
68.1 27.2
61.1 23.8
42.8 23.6
26.9 18.1
60.3 16.5
19.1 9.5
27.6 8.7
26.3 6.8
21.9 6.2
39.3 3.7
8.4 0.8
1.2 0.1