Farm Economic Analysis Tool (FEAT) · Section 6: Extra Tools demonstrates use of the additional...
35
Farm Economic Analysis Tool (FEAT) Version 3.1 User Guide
Transcript of Farm Economic Analysis Tool (FEAT) · Section 6: Extra Tools demonstrates use of the additional...

Farm Economic Analysis Tool (FEAT)
Version 3.1
User Guide
This publication has been compiled by Alison Collier of Regions and Industry Development, Department of Agriculture, Fisheries and Forestry. © State of Queensland, 2016 The Queensland Government supports and encourages the dissemination and exchange of its information. The copyright in this publication is licensed under a Creative Commons Attribution 3.0 Australia (CC BY) licence. Under this licence you are free, without having to seek our permission, to use this publication in accordance with the licence terms.
You must keep intact the copyright notice and attribute the State of Queensland as the source of the publication. Note: Some content in this publication may have different licence terms as indicated. For more information on this licence, visit http://creativecommons.org/licenses/by/3.0/au/deed.en The information contained herein is subject to change without notice. The Queensland Government shall not be liable for technical or other errors or omissions contained herein. The reader/user accepts all risks and responsibility for losses, damages, costs and other consequences resulting directly or indirectly from using this information.

FEAT User Guide, Department of Agriculture and Fisheries, 2016 1
Table of contents
1 Introduction ...................................................................................................................................................................................................................... 3
1.1 What is FEAT? .................................................................................................................................................................................................................. 3
1.2 Key concepts underpinning FEAT ..................................................................................................................................................................................... 3
1.3 Farm information required to use FEAT ............................................................................................................................................................................ 4
1.4 Using this guide with FEAT ............................................................................................................................................................................................... 4
2 Getting Started ................................................................................................................................................................................................................. 6
2.1 Registering FEAT .............................................................................................................................................................................................................. 6
2.2 Navigating FEAT ............................................................................................................................................................................................................... 8
2.3 Setup ............................................................................................................................................................................................................................... 10
3 Entering Data ................................................................................................................................................................................................................. 12
3.1 Cane Assumptions and Summary ................................................................................................................................................................................... 12
3.1.1 Cane Price and Harvesting Cost ...................................................................................................................................................................... 12
3.1.2 Production Data................................................................................................................................................................................................ 12
3.2 Machinery Costs .............................................................................................................................................................................................................. 13
3.2.1 Fuel and Labour ............................................................................................................................................................................................... 13
3.2.2 Tractor Costs .................................................................................................................................................................................................... 13
3.2.3 Implement Costs .............................................................................................................................................................................................. 14
3.3 Growing Costs ................................................................................................................................................................................................................. 15
3.3.1 Machinery Operations ...................................................................................................................................................................................... 15
3.3.2 Chemical Inputs................................................................................................................................................................................................ 16
3.3.3 Irrigation ........................................................................................................................................................................................................... 16
3.4 Depreciation .................................................................................................................................................................................................................... 18
3.4.1 Depreciable Items ............................................................................................................................................................................................ 18

FEAT User Guide, Department of Agriculture and Fisheries, 2016 2
3.4.2 Annual Depreciation ......................................................................................................................................................................................... 19
3.5 Assets .............................................................................................................................................................................................................................. 20
3.6 Fixed Costs ...................................................................................................................................................................................................................... 21
4 Analysing Output ........................................................................................................................................................................................................... 22
4.1 Operating Return ............................................................................................................................................................................................................. 22
4.2 Farm Performance Indicators .......................................................................................................................................................................................... 23
5 Cash flow Analysis ........................................................................................................................................................................................................ 24
5.1 Cane Payments ............................................................................................................................................................................................................... 24
5.2 Loans ............................................................................................................................................................................................................................... 25
5.3 Cash Flow ........................................................................................................................................................................................................................ 26
6 Extra Tools ..................................................................................................................................................................................................................... 28
6.1 Mill Data ........................................................................................................................................................................................................................... 28
6.2 Sugar Pricing ................................................................................................................................................................................................................... 30
6.3 Optimum Ratoons ........................................................................................................................................................................................................... 31
6.4 Labour Planning .............................................................................................................................................................................................................. 32
6.5 Contract Rates................................................................................................................................................................................................................. 33

FEAT User Guide, Department of Agriculture and Fisheries, 2016 3
1 Introduction
1.1 What is FEAT?
The Farm Economic Analysis Tool (FEAT) is a planning and decision-making tool used to assist cane farming enterprises. The main reason to use FEAT is to
gauge the economic impact of changing from one farming system to another. Other uses for FEAT include evaluating farm labour requirements, preparing
cash flow budgets and quantifying the impact of “what if?” scenarios. The type of questions FEAT can help answer include;
How do farming systems compare in economic value?
What is the best mix of crops?
How many ratoons are optimal?
Should I buy machinery or use a contractor?
What is the economic impact of changing row widths?
What is the economic impact of replacing sugarcane smut susceptible varieties?
How profitable is my farm at different sugar prices?
If the price of diesel increases, how will this affect the economic value of my farm?
How do farming systems compare in terms of labour required?
Should I purchase or lease the farm?
Which farm should I sell?
1.2 Key concepts underpinning FEAT
FEAT uses gross margins (gross income less variable costs) to gauge the economic impact of farm management decisions. Gross margin is a useful
indicator of relative profitability when comparing two farming systems with the same capital expenditure and fixed costs (i.e. comparing one farming system
with a low fertiliser rate to the identical farming system but with a high fertiliser rate).
FEAT uses operating return (gross income less total costs) as an additional measure of profitability. Operating return is a useful indicator of relative
profitability when comparing two farming systems with different capital expenditure and/or fixed costs (i.e. comparing one farming system with irrigation to
another farming system without irrigation).

FEAT User Guide, Department of Agriculture and Fisheries, 2016 4
The final profit indicator calculated in FEAT is return on investment. Return on investment measures how effectively farm assets are working to generate
profit. Return on investment is a useful indicator of relative profitability when comparing two farming systems with different assets (i.e. comparing one farming
system with old machinery to another farming system with new machinery).
A high farm operating return does not always mean that an enterprise is able to pay bills or make timely loan repayments. FEAT uses a cash flow budget to
forecast the flow of income and expenses throughout the accounting period and indicates deficits and surpluses in cash. When evaluating management
practice change it is important to evaluate the cash flow implications and determine whether the business has sufficient cash flow to cover the changes.
1.3 Farm information required to use FEAT
FEAT calculates economic performance indicators based on specific production information entered by the user. You do not require financial records to use
FEAT. In general, the information required to use FEAT includes;
Production data
Harvest costs
Sugar price (net of applicable levies / penalties)
Agronomic practices in cane (plant, ratoons and rotational crops) such as;
o Land preparation and planting operations (implements used and number of operations, contractor rates)
o Chemical input; type, rate and cost
o Irrigation; volume applied and cost
o Machinery and implement information (repairs and maintenance costs, speed, field efficiency)
Fixed costs (insurance, land rates, etc.)
Asset values (land value, value of machinery)
1.4 Using this guide with FEAT
Begin in Section 1: Getting Started to learn how to register FEAT and how to navigate around the spreadsheet. Customise FEAT to your farm by selecting the
relevant growing cost worksheets and any additional tools you wish to use.

FEAT User Guide, Department of Agriculture and Fisheries, 2016 5
Work methodically through Section 3: Entering Data keying data for your current farming system in the light blue cells. Start on the Cane Assumptions and
Summary sheet (Section 3.1: Cane Assumptions and Summary) by entering production data, harvesting costs and sugar price. Enter machinery and
implement data on the Machinery Costs sheet (Section 3.2: Machinery Costs). Enter details on agronomic practices in cane (plant, ratoons and rotational
crops) on the Growing Costs sheets (Section 3.3 Growing Costs). Use the Depreciation sheet to calculate depreciation (Section 3.4: Depreciation). Complete
the analysis by entering assets (Section 3.5: Assets) and fixed costs (Section 3.6: Fixed Costs).
Having completed data entry in Section 3, move on to Section 2: Analysing Output. Note down the gross margin, operating return and return on investment
for your current farming system. To compare your current farming system with an alternative system, save the file with a new name and repeat the data entry
process in Section 3 for the alternative system. Once the changes have been made, return to the Profit sheet to view the new gross margin, operating profit
and return on investment.
Section 5: Cash Flow Analysis shows how to use FEAT to prepare a cash flow budget. Use FEAT to graph the results of your analysis and identify any cash
flow deficits. Compare the cash flow budget for your current and alternative farming systems.
Section 6: Extra Tools demonstrates use of the additional worksheet tools available in FEAT. Use of theses sheets is optional and farm economic evaluations
may be performed without them. Use the Mill Data sheet (Section 6.1: Mill Data) to aid variety choice to maximise sugar production and minimise disease
risk. Use the Sugar Pricing sheet (Section 6.2: Sugar Pricing) to gauge the impact of different sugar pricing options. Section 6.3: Optimum Ratoons
demonstrates how to identify the optimum number of ratoons based on the average gross margin for a crop cycle using the Optimum Ratoons sheet. Use the
labour planning calculator to calculate weekly and monthly labour demand by job type and crop class (Section 6.4: Labour Planning). Use the contract rate
calculator (Section 6.5: Contract Rates), found on the Machinery sheet, to calculate machinery contracting rates.

FEAT User Guide, Department of Agriculture and Fisheries, 2016 6
2 Getting Started
2.1 Registering FEAT
A password is required to use FEAT. Follow the instructions on the FEAT registration page to obtain a password and register FEAT.
1. Check that a number is displayed in the black registration number box. If you see the words “Enable Macros”, refer to the warning below.
2.2 Heading 2
– Style 1
This bulleted list includes the following types of bullet styles:
Bullet point 1
Bullet point 2
Bullet point 3
WARNING! FEAT uses a series of commands and functions in Excel called macros. Before following these instructions you must ensure
that you have enabled macros in Excel. Click on the orange oval (1a) corresponding to your version of Excel for instructions on how to
enable macros.
1a
a
2
1

FEAT User Guide, Department of Agriculture and Fisheries, 2016 7
2. Select “Click here” to receive a password by email.
3. A new window is displayed. Complete your registration details and click ‘Send Email’.
4. You will receive a FEAT password by email. Re-open FEAT and return to the registration page. Enter your password in the yellow password box and
press Enter.
If you do not have internet access or access your email via a web browser please phone DAFF and quote your registration number to obtain
a password. FEAT does not require internet access to run.
4
3

FEAT User Guide, Department of Agriculture and Fisheries, 2016 8
2.2 Navigating FEAT
The FEAT spreadsheet can be navigated using either the home page and/or tabs.
1. On the home page use the green buttons to navigate to a sheet.
2. Return to the home page by clicking the ‘Home’ button in the top right-hand corner of every page.
3. Alternatively, navigate around the spreadsheet using the tabs at the bottom of each page
3
2
1

FEAT User Guide, Department of Agriculture and Fisheries, 2016 9
4. Throughout FEAT, the formatting of a cell identifies its function. Cells with a light blue background are for data input (4a). Cells with a grey background
show the results of calculations and are protected against accidental change (4b). Cells with a turquoise background contain formulas but may be
changed (4c).
4b 4a
4c

FEAT User Guide, Department of Agriculture and Fisheries, 2016 10
2.3 Setup
FEAT has been designed for use by a wide range of different cane farming enterprises. The Setup worksheet is used to customise FEAT to your farm and to
select additional tools.
1. Click “Version” on the homepage.
2. A new window will open. If your farm is in the Mackay region select “Mackay”. For all other Queensland cane-growing regions, select “Standard”.
Click OK.
3. On the home page click “Setup” to go to the Setup sheet.
4. Click the checkboxes for the Growing Cost sheets applicable to your farm (i.e. Legume Growing Costs).
5. Click the checkboxes for any additional tools you wish to use (i.e. Sugar Pricing).
6. Click “Done” to return to the homepage.
1
2
3

FEAT User Guide, Department of Agriculture and Fisheries, 2016 11
6
5
4

FEAT User Guide, Department of Agriculture and Fisheries, 2016 12
3 Entering Data
3.1 Cane Assumptions and Summary
This sheet is used to calculate the cane price, net revenue and the cost of harvesting. This sheet also provides a summary of the growing costs and gross
margin for each crop class.
3.1.1 Cane Price and Harvesting Cost
1. Select your mill area from the drop down list
2. Enter the current sugar price, levies paid and bonuses received
3. Enter the harvesting cost (a) in $/tonne and, if relevant, harvest fuel cost (b)
3.1.2 Production Data
4. For each crop class that applies to your farm, enter an area in hectares.
5. Enter long term average yield and CCS data.
1
5
4
2 3b
3a

FEAT User Guide, Department of Agriculture and Fisheries, 2016 13
3.2 Machinery Costs
This sheet is used to calculate the cost per hectare of tractor operations, including the cost of fuel, oil, repairs and maintenance. Tractor (labour) hours per
hectare are also calculated here.
3.2.1 Fuel and Labour
1. Begin by entering the price paid for fuel (after the diesel rebate and without GST).
2. Enter the wage rate for tractor operations in $/hour
3.2.2 Tractor Costs
3. Enter a name for your tractor.
4. Enter tractor power.
5. Based on tractor power, FEAT will calculate the expected fuel
use in litres/hour. This is the fuel use when the tractor is
performing at maximum load (change this figure if required).
6. Estimate tractor productive life in hours.
7. Estimate the total amount spent on repairs and maintenance
over the tractor’s productive life.
8. Enter the number of hours per year the tractor is used out of
field (i.e. time spent driving between farms).
Labour Costs for the Owner/Operator
Labour costs may be entered in FEAT by either:
A. Entering a $/hour cost for labour on the machinery worksheet to account for
the cost of time spent performing machinery operations. And accounting for
the cost of time spent in the workshop and/or office by entering an additional
cost on the Fixed Cost Worksheet.
B. Leaving the $/hour cost for labour as $0 in the machinery sheet. And entering
all labour costs on the Fixed Cost Worksheet.
Remember, when analysing the performance of your business it is important to
include a cost for your own labour. Think of the hourly cost of your own labour
as what you would earn if you were employed on a farm owned by someone
else.
7
2
6 8 4
3
1
5

FEAT User Guide, Department of Agriculture and Fisheries, 2016 14
3.2.3 Implement Costs
1. Starting with the first tractor, enter all the implements used with that tractor.
2. Beginning with the first implement, estimate (as a percentage of full load) how hard the tractor is
typically working when the implement is used. For example, a tractor performing a tillage
operation on heavy ground may require full power (enter 100%), while a spraying operation may
only require the tractor to operate at half power (enter 50%).
3. Enter the number of hectares per year the implement is used.
4. Estimate the productive life of the implement in hours.
5. Estimate the total amount spent on repairs and maintenance over the implement’s productive
life.
6. Enter the width of the implement’s pass.
7. Estimate the speed at which the implement is typically operated.
8. Estimate the implement’s field efficiency.
9. The total cost per hectare to perform a machinery operation is calculated.
Estimating Field Efficiency
Put simply, field efficiency is a measure of
the time spent using an implement relative
to the time spent actually performing the
task at hand.
For example, if you are using a ripper you
will spend most of your time ripping
(90secs/row) and some of your time
turning at the end of each row (22sec/row).
In this case your field efficiency is 80%
(90secs/(90secs+22secs)).
Chemical application is likely to have lower
field efficiency than tilling due to time spent
refilling tanks.
You can judge the accuracy of your field
efficiency estimate by checking the implied
work rate (ha/hour).
9 8 7 6 5 4 3 2 1

FEAT User Guide, Department of Agriculture and Fisheries, 2016 15
3.3 Growing Costs
These sheets are used to calculate the cost per hectare of growing cane, including the cost of machinery operations, fertiliser, pesticides and irrigation. There
are growing cost sheets for plant cane, ratoons, bare fallow and fallow crops. Use the Setup sheet (see 1.3: Setup) to select growing sheets relevant to your
farm.
Growing Cost sheets are divided into the following management aspects; Land Preparation/Cultivation, Planting, Fertiliser, Weed Control, Insect Control,
Disease Control and Irrigation. For each management aspect, follow the steps below to enter machinery operations, chemical inputs and irrigation data.
3.3.1 Machinery Operations
1. To add a machinery operation click on the “+” symbol.
2. A new window is displayed. Choose a tractor for your operation.
3. Choose an Implement and click “Insert these figures”.
4. Enter the number of operations performed
5. FEAT will calculate the total cost (a) and time (b) to perform the operation.
2
3
5b 5a
4
1

FEAT User Guide, Department of Agriculture and Fisheries, 2016 16
3.3.2 Chemical Inputs
1. Enter each chemical input and number of applications.
2. Enter the application rate per hectare (a) and cost per unit (b).
3. The total chemical input cost per hectare is calculated.
4. For each chemical input, make sure to include the machinery item used in application.
3.3.3 Irrigation
1. Enter the amount of water applied in ML/ha
2. If you pay for water by the ML, go to the Fixed Cost sheet (see Section 3.6: Fixed Costs) and enter the cost per ML. Return to the Growing Cost sheet
where the cost is now displayed.
3. Enter the proportion of your total irrigated water that is recycled.
4. Enter the proportion of pumps that are electric and/or diesel.
5. For electric pumps, estimate the average KW and flow rate.
6. Enter the proportion of pumping done in the day and at night.
3 2b
4
2a 1

FEAT User Guide, Department of Agriculture and Fisheries, 2016 17
7. Enter the electricity cost for day time and night time use.
8. For diesel pumps, estimate the L/hour diesel used and flow rate.
9. Enter the proportion of irrigation that is applied by traveller, pivot, or other system (i.e. flood).
10. For each irrigation type, estimate labour time (hours/ha).
11. A $/hour cost for labour may be entered here. Alternatively, leave blank and enter all labour costs on the Fixed Cost sheet.
11 10
8
7
9
5
6
4
2 3
1

FEAT User Guide, Department of Agriculture and Fisheries, 2016 18
3.4 Depreciation
This sheet is used to calculate depreciation. Use of this sheet is optional.
3.4.1 Depreciable Items
1. Make a list of all the depreciable items on your farm. Depreciable
items are items that are expected to lose value over time (i.e. tractors,
pumps etc.).
2. For each item, estimate its current value.
3. Estimate the number of years of use remaining.
4. Estimate the value of each item at the end of its useful life (salvage
value).
Why include depreciation?
In economics depreciation is regarded as a fixed cost. Unlike other
fixed costs there is no cash flow for depreciation. So why include it
when calculating profit?
At some point assets will wear out and need to be replaced.
Including depreciation ensures that profit is sufficient to cover their
eventual replacement.
7 8a
6 5 4 3 2 1
8b

FEAT User Guide, Department of Agriculture and Fisheries, 2016 19
3.4.2 Annual Depreciation
5. Annual depreciation is calculated in FEAT according to the formula:
Annual depreciation = (Value at beginning of year – Residual salvage value) Number of years of use remaining
6. Value at end of year = value at beginning of year – annual depreciation
7. Total annual depreciation is transferred to the Fixed Cost sheet under “depreciation expense”.
8. The average of the opening value of all items (a) and the closing value (b) is transferred to the Asset sheet under “plant and machinery value”.

FEAT User Guide, Department of Agriculture and Fisheries, 2016 20
3.5 Assets
This sheet is used to calculate total farm assets, including the value of land, fixed improvements and machinery.
1. Estimate the value of your land including the value of all fixed improvements (i.e. dams, buildings, etc.).
2. If applicable, enter the value of any livestock.
3. If you have completed the Depreciation sheet, the value of plant and machinery will be shown here (see Section 3.4: Depreciation).
4. If you have not completed the Depreciation sheet, estimate the current value of plant and machinery.
5. Estimate the value of any inventory (i.e. fertiliser, pesticide, etc.).
6. Enter additional assets as required.
5
4
3
6
2
1

FEAT User Guide, Department of Agriculture and Fisheries, 2016 21
3.6 Fixed Costs
This sheet is used to calculate fixed costs, including the cost of labour.
1. List fixed cost items and estimate annual costs.
2. Use the farm labour calculator to determine annual labour costs. Alternatively enter a cost for farm labour directly as a list item. Recall that labour
costs for time spent operating machinery may have already been costed on the Machinery sheet. Avoid double counting.
3. If you have completed the Depreciation sheet, a value for depreciation will be shown here.
4. If you have not completed the Depreciation sheet, enter a rate of depreciation. FEAT will calculate depreciation as the value of plant and machinery
on the Assets sheet multiplied by the rate of depreciation.
5. If water is paid on a per hectare basis, enter the total annual cost of water.
6. If water is paid on an allocation basis, enter the total water allocation, the $/ML fixed supply charge and the $/ML variable usage charge.
4 3
6 5
2 1

FEAT User Guide, Department of Agriculture and Fisheries, 2016 22
4 Analysing Output
4.1 Operating Return
This sheet provides a summary of all the data entered in FEAT. Based on the growing costs, fixed costs, cane price and yield entered, FEAT will calculate
your farm gross margin, operating return and return on investment.
1. If applicable, enter the area of fallow crop grown.
2. For a complete analysis of your farming business, include any income from contact work, plant/machinery hire or lease of land.
3. Click “record this scenario” to record a summary of data. This feature can be used to compare the profitability of different farming systems.
3 2
1

FEAT User Guide, Department of Agriculture and Fisheries, 2016 23
4.2 Farm Performance Indicators
This sheet provides a summary of data entered in FEAT.
1. Enter the date and location for your analysis.
2. Click the yellow button to view an indicator’s definition.
2
1

FEAT User Guide, Department of Agriculture and Fisheries, 2016 24
5 Cash flow Analysis
5.1 Cane Payments
This sheet is used to forecast monthly cane income.
1. Enter last season’s harvest data.
2. Enter the current season’s harvest schedule as the percent of total cane cut per month.
3. Enter your mill’s pay schedule as the percent of full payment received each month.
4. FEAT will calculate monthly cane income (including GST).
5. Net cane income (cane income less harvest cost, less levies and plus premiums) is transferred to the Cash Flow sheet (see Section 5.3: Cash Flow).
5
4
3
2
1

FEAT User Guide, Department of Agriculture and Fisheries, 2016 25
5.2 Loans
This sheet is used to record cash inflow from borrowings and cash outflow from repayments.
1. Enter a name for your loan (i.e. new tractor).
2. Enter the amount of money borrowed in the relevant month/s.
3. Cash inflow from borrowings (total loan income) is transferred to the Cash Flow sheet (see Section 5.3: Cash Flow).
4. Enter the name for your loan (i.e. new tractor)
5. Enter the amount of money to be repaid in the relevant month/s.
6. Cash outflow from loan repayments (total repayments) is transferred to the Cash Flow sheet (see Section 5.3: Cash Flow).
4
1
6
5
2

FEAT User Guide, Department of Agriculture and Fisheries, 2016 26
5.3 Cash Flow
This sheet is used to prepare a cash flow forecast.
Cash flow is divided into the following cash flow streams; operating income, variable expenses (land preparation/cultivation, planting, fertiliser, weed control,
insect control, disease control and irrigation), fixed expenses, investment and finance.
1. Select if you report GST monthly or quarterly.
2. Monthly operating income from cane is determined using the Cane Payments sheet (see Section 5.1: Cane Payments).
3. For each additional income item, specify the percentage of the income amount received each month. For example, if you receive two equal payments
one in July and one in August you would enter 50% in July and 50% in August.
4. All cash amounts entered in FEAT are without GST. For income streams which include GST select ‘Add GST’.
5. For each expense item, specify the percentage of the expense amount paid monthly. For example, if you make four equal payments in June, July,
August and September you would enter 25% in June, 25% in July, 25% in August and 25% in September.
6. All cash amounts entered in FEAT are without GST. For expense items which include GST select ‘Add GST’.
6
3
5
4
2
1

FEAT User Guide, Department of Agriculture and Fisheries, 2016 27
7. Enter the total cash amount paid for machinery, property or other asset in the month when the purchase is forecast. Enter the total cash amount
received from the sale of machinery, property or other asset in the month when the sale is forecast.
8. Cash inflows from borrowings and cash outflow from loan repayments are determined using the Loans sheet (see Section 5.2 Loans). Enter the total
cash amount of proceeds from owners in the month when cash is received. Enter the total cash outflow from drawings in the relevant month/s.
9. Enter total GST paid/collected in the final month of the last accounting period.
10. Enter your cash balance in the final month of the last accounting period.
11. Enter the interest rate charged on cash overdrafts and the investment rate paid on short term deposits.
12. The monthly progressive balance is calculated. Click the orange button at the top of the sheet to display a cash flow bar chart.
8
9
12
11
10
7

FEAT User Guide, Department of Agriculture and Fisheries, 2016 28
6 Extra Tools
6.1 Mill Data
This sheet is used to aid variety choice to maximise sugar production and minimise disease risk (i.e. sugarcane smut).
1. Select your region from the drop down list.
2. Enter your mill yield data.
2
1

FEAT User Guide, Department of Agriculture and Fisheries, 2016 29
3. Enter the percentage of expected smut loss for smut susceptible varieties.
4. A yield summary by crop class is calculated.
5. Smut susceptible variety mix is calculated.
6. Click to transfer yield summary data to the Cane Assumptions and Summary sheet.
7. Click to advance blocks one season.
7
5
6
3
4

FEAT User Guide, Department of Agriculture and Fisheries, 2016 30
6.2 Sugar Pricing
This sheet is used to determine your average sugar price when cane is priced separately from the mill pool.
1. Enter your mill’s IPS conversion factor.
2. Enter the name of the pricing contract.
3. Enter the Net IPS price (net of levies and bonuses) for the contract.
4. Enter the tonnes of sugar allocated to the contract.
5. Compare the average sugar price under different pricing options.
5
4 3 2
1

FEAT User Guide, Department of Agriculture and Fisheries, 2016 31
6.3 Optimum Ratoons
This sheet shows the optimum number of ratoons based on the crop cycle average gross margin.
1. Ensure you have completed the Cane Assumptions and Summary sheet (see Section 3.1 Cane Assumptions and Summary) and Growing Cost
sheets (see Section 3.3 Growing Costs).
2. Use Table 1 if cane is planted in spring, Table 2 if cane is planted in autumn or Table 3 for plough-out replant.
3. Select your fallow type.
4. The optimum number of ratoons is displayed.
3
2
FEAT User Guide, Department of Agriculture and Fisheries, 2016 32
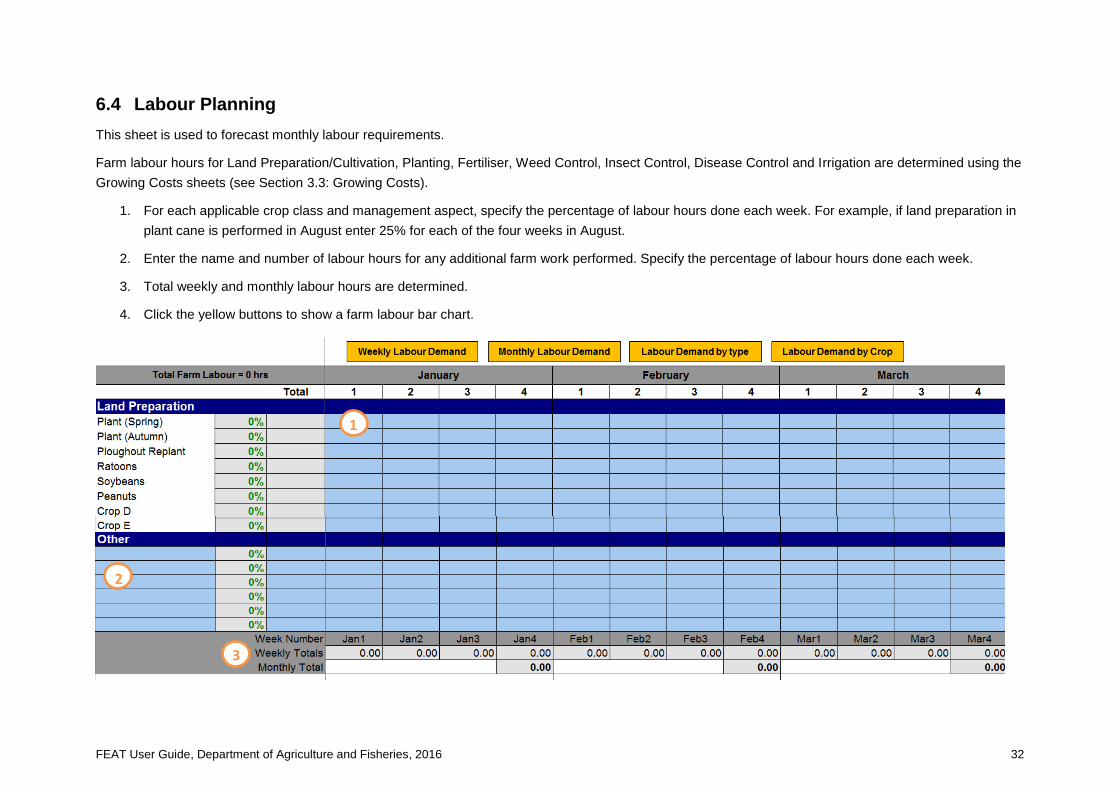
6.4 Labour Planning
This sheet is used to forecast monthly labour requirements.
Farm labour hours for Land Preparation/Cultivation, Planting, Fertiliser, Weed Control, Insect Control, Disease Control and Irrigation are determined using the
Growing Costs sheets (see Section 3.3: Growing Costs).
1. For each applicable crop class and management aspect, specify the percentage of labour hours done each week. For example, if land preparation in
plant cane is performed in August enter 25% for each of the four weeks in August.
2. Enter the name and number of labour hours for any additional farm work performed. Specify the percentage of labour hours done each week.
3. Total weekly and monthly labour hours are determined.
4. Click the yellow buttons to show a farm labour bar chart.
3
2
1

FEAT User Guide, Department of Agriculture and Fisheries, 2016 33
6.5 Contract Rates
The contract rate calculator is an additional tool found on the Machinery Costs sheet (see Section 3.2: Machinery Costs).
1. Enter machinery items (see Section 3.2: Machinery Costs).
2. Enter the interest rate paid on money borrowed.
3. Enter a labour pay rate ($/hr).
4. Enter a suitable profit margin (%).
5. For each tractor/implement enter a price when new.
6. For each tractor/implement estimate the value of the item at the end of its productive life (salvage value).
7. The recommended contracting rate ($/ha) is calculated.
2 3
7 6 5
4