Fall Business Update - About Schwab · Fall Business Update October 21, ... the impact of the final...
32
Fall Business Update October 21, 2016
Transcript of Fall Business Update - About Schwab · Fall Business Update October 21, ... the impact of the final...

Fall
Business Update
October 21, 2016

Charles Schwab Corporation
Introduction Rich Fowler
2
Senior Vice President Investor Relations

Charles Schwab Corporation
Agenda Joe Martinetto, Senior EVP & Chief Financial Officer Walt Bettinger, President & Chief Executive Officer
3

Charles Schwab Corporation
Forward-Looking Statements
4
This presentation contains “forward-looking statements” within the meaning of Section 27A of the Securities Act of 1933 and Section 21E of the Securities Exchange Act of 1934. Forward-looking statements include statements that refer to expectations, projections or other characterizations of future events or circumstances and are identified by words such as “believe,” “expect,” “will,” “may,” “should,” “could,” “continue,” “growth,” “deliver,” “scenario,” “remain,” “focus,” “assume,” “estimate,” “optimize,” “drive,” “improve,” “pace,” “manage,” “maintain,” “deliberate,” “opportunity,” “anticipate,” “current,” and other similar expressions.
These forward-looking statements relate to the monetization of client cash balances; levers; expenses; strategy, scale and efficiency; net interest margin; balance sheet growth and strength; capital needs and management; bank deposit growth; the timing, amount and impact of transfers of money fund client balances to bank sweep; issuance of preferred stock; target dividend payout ratio; impact of fluctuations in the S&P 500 index, short-term interest rates, long-term interest rates and trading activity on the company’s results of operations; growth in revenues, earnings and profits; gap between revenue and expense growth; pre-tax profit margin; baseline scenario assumptions and financial expectations; impact of the December 2015 interest rate increase and any future interest rate increases; interest rates; increased yields for money fund and Schwab Bank portfolio balances; continued investment in relationships, technology and value; growth in the client base, accounts and assets; client demand for the company’s wealth management capabilities, including advisory solutions; development of products and services designed to meet client needs; net new assets; the impact of the final Department of Labor regulation concerning fiduciary duty standards; the company’s view of trends relating to growth, servicing clients, pricing and competition; and registered investment advisors growth and market share.
These forward-looking statements, which reflect management’s beliefs, objectives and expectations as of today, are estimates based on the best judgment of the company’s senior management. Achievement of the expressed beliefs, expectations and objectives is subject to risks and uncertainties that could cause actual results to differ materially from those beliefs, expectations or objectives.
Important factors that may cause such differences are discussed in the company’s filings with the Securities and Exchange Commission, including our Annual Report on Form 10-K and Quarterly Reports on Form 10-Q. Other important factors include the timing and amount of bulk transfers; client sensitivity to interest rates; regulatory guidance; the company’s ability to manage expenses; headcount, marketing and project spend; the volume of prepayments in the company’s mortgage-backed securities portfolio; the quality of the company’s balance sheet assets; general market conditions, including the level of interest rates, equity valuations and trading activity; the company’s ability to attract and retain clients and registered investment advisors and grow those relationships and client assets; competitive pressures on rates and fees; the company’s ability to develop and launch new products, services and capabilities in a timely and successful manner; client use of the company’s investment advisory services and other products and services; the level of client assets, including cash balances; the company’s ability to monetize client assets; capital needs and management; the impact of changes in market conditions on money fund fee waivers, revenues, expenses and pre-tax margin; SIFMA Municipal Swap Index level; net interest margin; the effect of adverse developments in litigation or regulatory matters and the extent of any charges associated with legal matters; and any adverse impact of financial reform legislation and related regulations.
The information in this presentation speaks only as of October 21, 2016 (or such earlier date as may be specified herein). The company makes no commitment to update any of this information.

Charles Schwab Corporation
Today’s Dial-in Number
(800) 871-6752
Conference ID: 70693374
5

Charles Schwab Corporation
Joe Martinetto
6
Senior Executive Vice President & Chief Financial Officer

Charles Schwab Corporation
Today we’ll discuss: Q3 results Capital/balance sheet picture 2016 financial outlook 2017 planning considerations
7
Record performance and continued investment to drive the business
Implementing our plan to more
effectively monetize client cash balances
Managing levers under our
control to apply flexibility as necessary
We delivered a record-setting third quarter.

Charles Schwab Corporation 8
Our client base grew to new records in the third quarter…
Total Client Assets (EOP)
$2.73 trillion
13%
Average Interest-Earning Assets
$195 billion
22%
Total Brokerage Accounts
10 million
4%
Q3 2016 vs. Q3 2015:

Charles Schwab Corporation
$1.0 $1.1
3Q15 3Q16
…driving significant revenue growth and the highest pre-tax profit margin in Schwab’s history.
9
Fifth consecutive quarter of record revenue
Asset management and administration fees were a record $798 million, up 20%
Net interest revenue reached a record $845 million, up 33%
$1.6
$1.9
3Q15 3Q16
20%
10%
10% Q3 2016 expense growth reflects healthy investment in the business while supporting strong profitability
We continue to expand our scale and efficiency with tools for risk management, CRM and business process transformation
36.5%
38.1% 37.1%
39.4%
41.5%
3Q15 4Q15 1Q16 2Q16 3Q16
Q3 2016 represents an all-time company high
YTD Q3 2016 = 39.4%
Tota
l Net
R
even
ues*
(bill
ions
) To
tal E
xpen
ses
(bill
ions
)
Pre-tax Profit Margin
* Revenues include net litigation proceeds relating to RMBS settlements totaling $14M in Q3 2016 and $2M in Q3 2015.

Charles Schwab Corporation
$71 $88
$149 $184 $198
3Q15 4Q15 1Q16 2Q16 3Q16
Net Money Market Fund Revenue (millions)
18
49
Average Yield (basis points)
Short-term rates and balance growth helped to build money market fund and net interest revenues.
Q3 2016 net money fund revenue was more than 2.5x Q3 2015
Elevated 1M and 3M LIBOR rates, driven by technical factors related to money fund reform, helped to generate a sequential increase in Prime Money Fund revenue
Higher SIFMA Muni Index levels persisted, producing continued strong Muni Money Fund revenue
$635 $690
$772 $798 $845
3Q15 4Q15 1Q16 2Q16 3Q16
Net Interest Revenue (millions)
1.57%
1.72%
Net Interest Margin (NIM)
10
Net interest revenue in Q3 was aided primarily by strong sweep balance growth (organic and bulk transfer) and increases in 1M and 3M LIBOR rates
Q3 2016 NIM was a bit under Q2 2016 NIM due to lower reinvestment rates for fixed-rate securities and slightly lower loan yields, partially offset by short-term rates and strength in securities lending
Modest incremental pressure on NIM is likely to continue under the current rate environment

Charles Schwab Corporation
We are growing our balance sheet and maintaining adequate capital...
(in millions, EOP) 3Q15 4Q15 1Q16 2Q16 3Q16*
Total Assets $170,391 $183,705 $190,998 $198,052 $209,337
Bank Deposits $119,017 $129,502 $135,689 $137,295 $149,630
Payables to Brokerage Clients $31,040 $33,185 $32,282 $32,679 $32,961
Short-Term Borrowings - - $800 $5,000 $3,001
Long-Term Debt $2,882 $2,877 $2,877 $2,876 $2,876
Stockholders’ Equity $13,196 $13,402 $14,513 $14,990 $15,470
Parent Liquidity $1,970 $1,781 $2,345 $1,916 $1,604
CSC Capital Ratios
Tier 1 Capital 20.8% 20.7% 21.8% 21.3% 21.3%
Tier 1 Leverage 7.3% 7.1% 7.3% 7.2% 7.1%
Common Equity Tier 1 18.3% 18.2% 18.3% 17.9% 18.0%
Note: Parent Liquidity equals Parent Working Capital plus Level 1 Securities (market value) as defined by the Liquidity Coverage Ratio rule.
* Preliminary.
Total assets now at $209B and we are being deliberate in our approach to $250B
Bank deposits continued to grow, now at $150B
Utilizing FHLB advances ahead of bulk transfers
ROE at 14%, highest in 21 quarters
11

Charles Schwab Corporation 12
…and we are making progress in the Bank sweep cash opportunity.
$3 $3 $1
$5 $3
$4 $4
$2
$2
$1
$5
$0
$4 $4
$7 $7
$2
$7
$4
2008 2009 2010 2011 2012 2013 2014 2015 YTD 2016
Bulk Transfers to Schwab Bank Since 2008 (billions) Schwab One to Bank Sweep
MMFs to Bank Sweep
*
We’re moving sweep money fund balances to the Bank to:
− Implement Money Fund reform
− Optimize the spread earned on yield insensitive client cash
o We’ve estimated that up to half of the total sweep money fund balances could be eligible for migration
Since 2008, we have migrated approximately $22B from sweep money funds to the balance sheet; we’ve also moved $17B from Schwab One to the Bank to better optimize yield
Because sweep money fund balances have continued to grow, the estimated opportunity remains about half of current sweep money fund balances, or ~$70B
* In 2012, “MMFs to Bank Sweep” includes ~$1.3B of OptionsXpress sweep transfer to Bank sweep

Charles Schwab Corporation
Bulk transfers to the Bank totaled ~$3B in Q3; we anticipate up to $4B for Q4
− We are utilizing bridge funding (FHLB advances) in order to pre-invest ahead of the pending Q4 bulk transfers
As of June 1, we have migrated away from money market funds as a sweep option for new accounts
− New accounts default to bank sweep; existing accounts will be affected in coming years as capital is available
− Preliminary data suggests incremental balances of $2-3 billion for 2H 2016 as a result of this sweep feature change
We expect an additional preferred issuance in Q4 to help support balance sheet growth
In this environment, our capital management priorities will continue to be maintaining our target dividend payout ratio of 20-30% and realizing the sweep cash opportunity
13
…and we are making progress in the Bank sweep cash opportunity. (cont.)

Charles Schwab Corporation
2016 Baseline Scenario Assumptions YTD Actual
S&P appreciates 6.5% Short-term rates: additional 25 bps Fed
Funds rate hike in June 2016 to 0.50-0.75%
Long-term rates: average 10-year Treasury at 2.27%
DARTs down 9% year-over-year
S&P up 6% year-to-date Short-term rates: No Fed Funds rate hikes,
certain short-term rates have increased due to technical factors
Long-term rates: Long end of the curve has improved from Q2 but still below Q4 2015 levels
DARTs down 1% year-over-year
2016 Baseline Financial Expectations YTD Actual
Revenue growth in the mid-teens Gap between revenue and expense
growth of approximately 500 basis points Pre-tax profit margin of around 39%
Revenue growth = 17.4% Expense growth = 9.2% Pre-tax profit margin = 39.4%
Market
Interest Rates
Trading
14
Our YTD results have outperformed our baseline 2016 scenario, even without any 2016 rate hikes.
Revenue
Expense
Margin
Largest percentage
increase was in project spend

Charles Schwab Corporation
As we near the end of 2016, we remain consistent in our approach.
15
Even without a rate hike in 2016, we now expect revenue growth in the mid-teens
− If the Fed raises short-term rates in December, the 2016 impact will be de minimis
− If LIBOR/SIFMA rates stay at elevated rates, could see some Q4 benefit as portfolios reprice
We now expect a pre-tax profit margin of around 40%
Revenues
Expenses
We have used and will continue to use our flexibility to manage expenses to adjust to the economic environment
− Key levers are managing headcount increases, marketing growth, and project spend growth to set an appropriate pace of spending as we head into 2017
Our expense actions and the unanticipated strength in 2H 2016 revenues are leading to an expanded gap between revenue and expense growth relative to our initial expectation
Pre-tax Profit
Margin

Charles Schwab Corporation
We have several factors to consider as we head into 2017. To Date:
Impacts from the December 2015 rate hike are largely embedded in our run rate − The lack of a parallel shift in the yield curve has mitigated additional upside from longer-duration investments
Looking Ahead:
The incremental effect of the next 25 bp hike could be muted − Recent technical factors are driving certain short-term rates higher and delivering increased yields for portions
of our money fund and Schwab Bank portfolio balances; these rates may not move in lockstep with the next hike
− To the extent the technical factors dissipate and the Fed holds off on further rate hikes, our returns could decline from Q3 levels
We face headwinds from long-term interest rates that are lower today than one year ago
Expense planning will remain conservative while recognizing necessary outlays for regulatory, infrastructure and other critical-path projects
We will continue to assess the revenue outlook pending the Fed’s December meeting
16

Charles Schwab Corporation 17
Record performance and continued investment to drive the business
Implementing our plan to more
effectively monetize client cash balances
Managing levers under our
control to apply flexibility as necessary
Our financial discipline persists through this economic uncertainty.
Our financial story remains simple: Solid business growth through
our client-first strategy Solid revenue growth through
diversified sources Expense discipline leading to
improved performance

Charles Schwab Corporation
Walt Bettinger
18
President & Chief Executive Officer

Charles Schwab Corporation
Our remarkable third quarter results reflect the combined power of our strategy and scale. Our full-service investing solutions, wealth management capabilities,
and industry-leading support for RIAs are attracting clients and building our asset base
Providing help and advice remains an important component of our strategy and we believe we are well positioned to adapt to the evolving regulatory environment
We continue to innovate “through clients’ eyes” with investments in relationships, technology and value
Long-term industry trends place Schwab in a position of strength
19

Charles Schwab Corporation
Clients engaged with our investing, wealth management and service capabilities…
20
Total Advised Assets
$1.4 trillion 14%
Q3 2016 vs. Q3 2015:
Proprietary ETFs
$53.9 billion 58%
Web & Mobile Logins
127 million 31%
Pledged Asset Line Balances
$3.6 billion 13%

Charles Schwab Corporation
…bringing us meaningful asset flows...
21
Core Net New Assets (billions)
On pace to gather $100B+ in annual NNA for fifth consecutive year
Note: Core net new assets is defined as net new assets before significant one-time flows, such as acquisitions/divestitures or extraordinary (greater than $10 billion) mutual fund clearing transfers. * Includes all clearing flows under $10 billion.
$112.4
$140.8 $124.8
$134.7
$102.0 $88.6
2012 2013 2014 2015 YTD 3Q15 YTD 3Q16
IS + AS (ex-Clearing) Clearing*
Charles Schwab Corporation
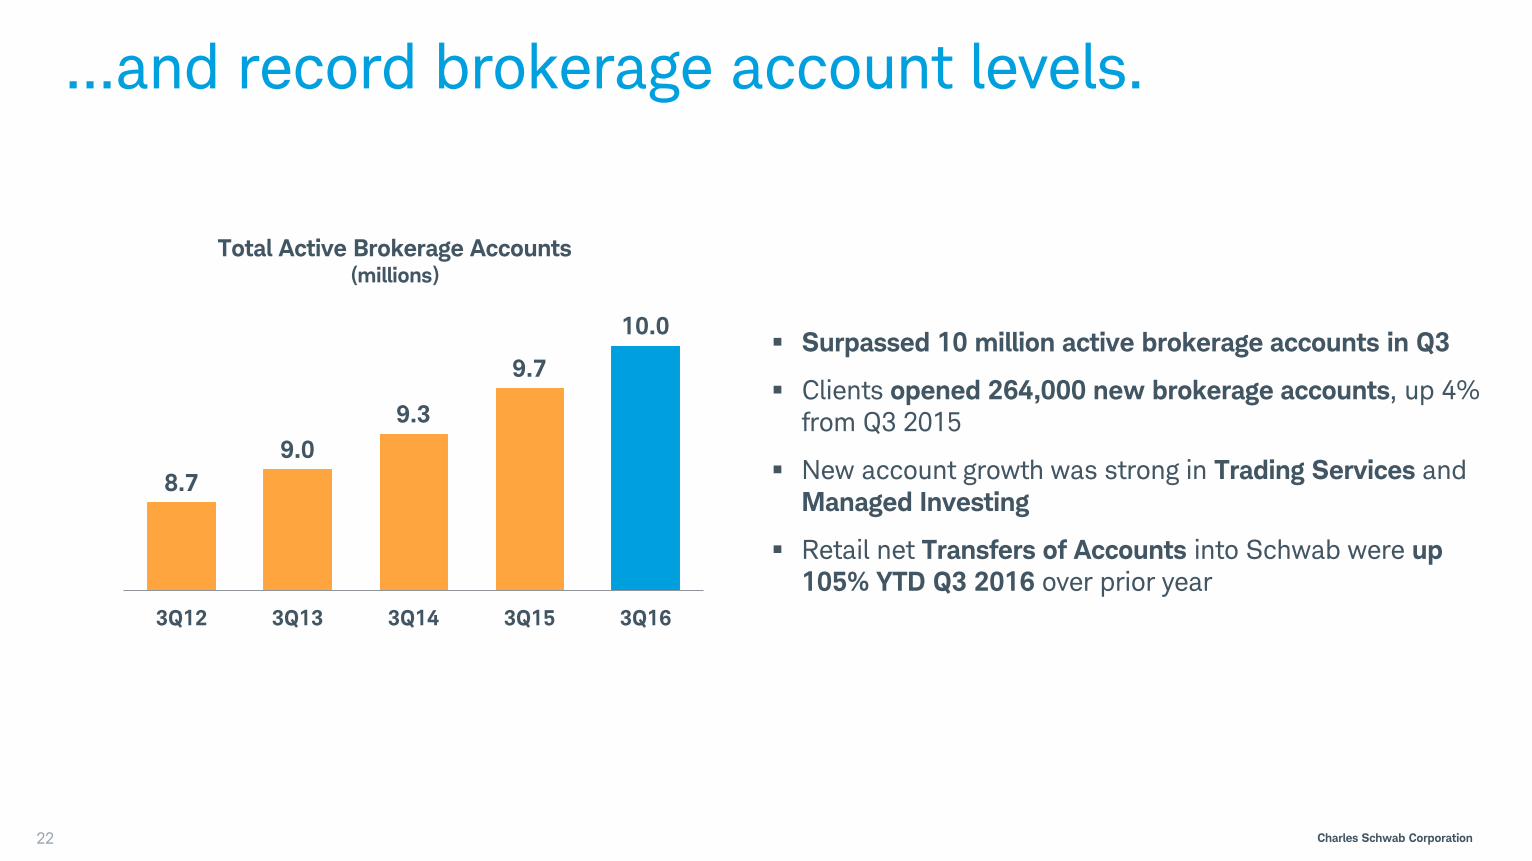
…and record brokerage account levels.
22
8.7 9.0
9.3
9.7
10.0
3Q12 3Q13 3Q14 3Q15 3Q16
Total Active Brokerage Accounts (millions)
Surpassed 10 million active brokerage accounts in Q3
Clients opened 264,000 new brokerage accounts, up 4% from Q3 2015
New account growth was strong in Trading Services and Managed Investing
Retail net Transfers of Accounts into Schwab were up 105% YTD Q3 2016 over prior year

Charles Schwab Corporation
We continued to support investors with planning and advisory solutions…
23
29 29
34 33 34
3Q15 4Q15 1Q16 2Q16 3Q16
Quarterly Planning Conversations (clients in thousands)
Financial Consultants are engaging in conversations with clients, up 17% from Q3 2015 and 22% YTD, representing more than 100,000 conversations thus far in 2016
550 560
567
581
597
3Q15 4Q15 1Q16 2Q16 3Q16
Total Accounts in Retail Advisory Solutions (thousands)
Total accounts in retail advisory solutions were up 9% year-over-year
Intelligent Portfolios rose to $10.2B in AUM*
ThomasPartners® grew 35% from Q3 2015 to $9.2B in AUM*
*Represents AS and IS.

Charles Schwab Corporation
...while preparing for the upcoming DOL regulation concerning fiduciary standards. We are actively preparing for the April 2017 deadline:
Our strategy is built around operating with our clients’ best interests in mind, so at this point, we aren’t anticipating dramatic changes to our business model or client experience
We planned for this new regulation in our 2016 Project budget, and we currently anticipate staying within that allocation
A cross-functional team has been focused on assessing the impact to Schwab and our clients, and mapping our path forward
Currently, the work to prepare for the regulation involves modifications – not significant overhauls – to processes, systems, training, staffing, and oversight
We believe the regulation will have industrywide effects, all of which have the potential to play to Schwab’s strengths in the future
24

Charles Schwab Corporation
During the third quarter, we’ve continued with investments in relationships, technology and value.
25
Schwab Target Index FundsTM
Fees are top of mind when 401(k) participants choose target date funds*
Schwab OpenView Gateway®
Helping advisors maximize efficiency through a flexible, open-architecture platform
Q3 Provider Additions
Morningstar Total Rebalance Expert ModestSpark
2,500 RIA firms 10,000 professionals
Q3 Enhanced Integration
SS&C Advent’s Black Diamond®
Junxure Cloud CRM Orion Advisor Services *Source: 2016 401(k) Participant Survey conducted by Koski Research for Schwab Retirement Plan Services, Inc.
For more information about Schwab Target Index Funds, see csimfunds.com
Institutional Pricing Retail Pricing
13 bps: $100 minimum 8 bps: $0 minimum for Retirement Plans
Portfolio Management and Reporting
CRM
Client Portals Financial Planning
Trading and Rebalancing

Charles Schwab Corporation
During the third quarter, we’ve continued with investments in relationships, technology and value.
26
Equity Award Center® on Schwab.com
Enhanced experience includes:
Easy to use, modern interface integrated with Schwab.com
Detailed view of equity awards and share holdings
An events and activities module to see near term and future awards-related events
Display of upcoming vest dates and award amounts

Charles Schwab Corporation
Our industry has and will continue to be characterized by limited growth and an oversupply of providers. Meaningful growth will be driven by market share gains.
RIA growth will continue to outpace other segments due to breakaway brokers.
We expect a continuation of very modest growth in retail investor trading volumes, coupled with likely strategic pricing pressure.
Success will accrue to firms focused on relationships and planning, as opposed to those focused on elusive “outperformance”.
Investment advice will increasingly trend toward a mix of technology and live professionals.
In certain asset classes, new forms of indexing are likely to supplant a significant share of the active investment management space.
Irrespective of the DOL, fee awareness and fiduciary expectations will impact the products and services delivered to clients.
401(k) plans will grow more fee-conscious and look for ways to deliver more personalized advice to their employees.
Higher interest rates will make price competition for self-directed investors and RIA custody services more intense.
Scale will play an increasingly large role in determining the “winners”, as investors, RIAs and 401(k) plans demand a better value.
Brand loyalty is more transient than ever. Today’s more informed consumers are willing to consider alternatives that are more transparent and embody ease of use.
27
Looking further out: our views on longer-term trends. G
row
th
Ser
ving
Clie
nts
P
rici
ng
Com
peti
tion

Charles Schwab Corporation
Irrespective of the DOL, fee awareness and fiduciary expectations will impact the products and services delivered to clients.
28
Sources: Investment Company Institute and Lipper. All data is domestic. Expense ratios are measured as asset-weighted averages. Data excludes mutual funds available as investment choices in variable annuities and mutual funds that invest primarily in other mutual funds. Equity fund flows include net new cash flow and reinvested dividends.
Expense Ratios (bps)
95 84
17
11 0
20
40
60
80
100
120
2007 2008 2009 2010 2011 2012 2013 2014 2015
Index Equity Mutual Funds
Actively Managed Equity Mutual Funds
Cumulative Flows (billions)
($1,000)
($800)
($600)
($400)
($200)
$0
$200
$400
$600
$800
$1,000
$1,200
$1,400
Actively Managed Equity Mutual Funds
Index Equity Mutual Funds
Index Equity ETFs
$425
($835)
$730
2007 2008 2009 2010 2011 2012 2013 2014 2015

Charles Schwab Corporation
Scale will play an increasingly large role in determining the “winners”, as investors, RIAs and 401(k) plans demand a better value.
29
58 53
43
28
17
MorganStanley WM
B of A GWIM E*Trade TDAmeritrade
CharlesSchwab
Expense to Average Client Assets YTD Q3 2016 (bps)*
Our scale and efficiency is a competitive advantage, making it difficult for competitors to replicate our client offerings
*Source: Publicly available company reports 2015 through Q3 2016. All are YTD Q3 2016 except for TD Ameritrade as Q3 results not available.

Charles Schwab Corporation
We are focused on execution as we head into 2017. Our full-service investing solutions, wealth management capabilities,
and industry-leading support for RIAs are attracting clients and building our asset base
Providing help and advice remains an important component of our strategy and we believe we are well positioned to adapt to the evolving regulatory environment
We continue to innovate “through clients’ eyes” with investments in relationships, technology and value
Long-term industry trends place Schwab in a position of strength
30

Charles Schwab Corporation
31
Q&A

Fall
Business Update
October 21, 2016