
Failure modes of end-plate connections with outer flange ...
15
Failure modes of end-plate connections with outer flange stiffeners: an experimental and numerical study MAHYAR MAALI Department of Civil Engineering, Architecture and Engineering Faculty, Erzurum Technical University, Erzurum, Turkey e-mail: [email protected] MS received 9 April 2018; revised 28 October 2019; accepted 9 December 2019 Abstract. This paper presents the experimental and numerical results of six full-scale beam-to-column con- nections with bolted end plates in two groups. The effects of vertical and horizontal stiffeners on the static behaviour of the semi-rigid beam-to-column bolted connections were investigated. In addition, the aim of this research was to analyse the influence of end-plate connections that utilize the IPE profile with stiffeners welded on the behaviour of steel connections, to provide the necessary data for improving Eurocode 3, efficient use of residue IPE profiles and back to the consumption cycle. Furthermore, finite-element and experimental models of semi-rigid vertical and horizontal stiffened bolted connections were tested and compared. The main parameters observed are the evolution of the resistance, the stiffness, the rotation capacity, the ductility of a joint, failure mode and the energy dissipation. Keywords. Vertical and horizontal stiffeners; beam-to-column bolted connections; experimental; numerical; failure mode. 1. Introduction Well-designed connections can be made by analysing behaviour of non-linear steel frames, improving overall structural behaviour. Here, proper rotational capacity of the bolted connection is possible. Instead of creating cracks, it can be by non-elastic shapes and energy absorption, pre- vention of lateral displacement of the frame and reducing the need for ductility in beams and columns. This shows the need for an accurate analysis of the connections [1–3]. Structural steel framework with welded joints (rigid con- nection) was considered as one of the best moments resisting framed structural system till the 1994 Northridge earthquake. In this earthquake, many structural steel frames failed due to the occurrence of brittle fractures at the con- nections. This caused the loss of reliability on steel welded moment-resisting frames. Since then, as an alternative, bolted connections, often called semi-rigid connections, are considered for design of steel moment-resisting frames and retrofitting works [4, 5]. End-plate bolted connections are used in steel structures as bending fittings. In a general classification, the end-plate bolt connections can be divided into two groups: (1) end-to-end connection without edge and (2) end-plate edges. Each of these two categories can be designed and used with stiffeners or without stiffeners. In conventional methods for designing steel frames, beam- to-column joints are assumed to be jointly or fully assem- bled. In recent years, studying the behaviour of joints has attracted the attention of researchers in order to know the actual behaviour of joints and determine their semi-rigid rates. Bahaari and Sherburne (2000) [6] investigated bolt connections modelled with ANSYS finite-element (FE) software and examined their two-dimensional behaviour. Their research showed how the pressure distribution of the lever forces was distributed in the bolt couplings. In their research, they developed and examined 34 different models of stiffener upper edges and 19 non-stiffener models. In 2006, Urbonas and Daniunas [7] at the University of Salt Lake City in London conducted studies on bolt connec- tions. The basis of their research was based on the model of the component of the European Code, and they assessed the accuracy of their modelling based on the experimental results of da Silva from the University of Prague [8]. In this work, this laboratory database is used to evaluate the accuracy of finite-element models (FEMs). Shi et al [9] investigated the experimental and theoretical analysis for the moment–rotation behaviour of stiffened extended end- plate connections. The authors derived the moment moment–rotation relationship for stiffened and extended end-plate connections, by a new theoretical model. The end-plate connection was broken down into several com- ponents, including the panel zone, bolt, end plate and col- umn flange. Abidelah et al [10] researched the experimental and analytical behaviour of bolted end-plate connections with or without stiffeners. The results were analysed for the moment–rotation curves and the evolution of the tension Sådhanå (2020)45:18 Ó Indian Academy of Sciences https://doi.org/10.1007/s12046-019-1262-2
Transcript of Failure modes of end-plate connections with outer flange ...

Failure modes of end-plate connections with outer flange stiffeners:an experimental and numerical study
MAHYAR MAALI
Department of Civil Engineering, Architecture and Engineering Faculty, Erzurum Technical University,
Erzurum, Turkey
e-mail: [email protected]
MS received 9 April 2018; revised 28 October 2019; accepted 9 December 2019
Abstract. This paper presents the experimental and numerical results of six full-scale beam-to-column con-
nections with bolted end plates in two groups. The effects of vertical and horizontal stiffeners on the static
behaviour of the semi-rigid beam-to-column bolted connections were investigated. In addition, the aim of this
research was to analyse the influence of end-plate connections that utilize the IPE profile with stiffeners welded
on the behaviour of steel connections, to provide the necessary data for improving Eurocode 3, efficient use of
residue IPE profiles and back to the consumption cycle. Furthermore, finite-element and experimental models of
semi-rigid vertical and horizontal stiffened bolted connections were tested and compared. The main parameters
observed are the evolution of the resistance, the stiffness, the rotation capacity, the ductility of a joint, failure
mode and the energy dissipation.
Keywords. Vertical and horizontal stiffeners; beam-to-column bolted connections; experimental; numerical;
failure mode.
1. Introduction
Well-designed connections can be made by analysing
behaviour of non-linear steel frames, improving overall
structural behaviour. Here, proper rotational capacity of the
bolted connection is possible. Instead of creating cracks, it
can be by non-elastic shapes and energy absorption, pre-
vention of lateral displacement of the frame and reducing
the need for ductility in beams and columns. This shows the
need for an accurate analysis of the connections [1–3].
Structural steel framework with welded joints (rigid con-
nection) was considered as one of the best moments
resisting framed structural system till the 1994 Northridge
earthquake. In this earthquake, many structural steel frames
failed due to the occurrence of brittle fractures at the con-
nections. This caused the loss of reliability on steel welded
moment-resisting frames. Since then, as an alternative,
bolted connections, often called semi-rigid connections, are
considered for design of steel moment-resisting frames and
retrofitting works [4, 5]. End-plate bolted connections are
used in steel structures as bending fittings. In a general
classification, the end-plate bolt connections can be divided
into two groups: (1) end-to-end connection without edge
and (2) end-plate edges. Each of these two categories can
be designed and used with stiffeners or without stiffeners.
In conventional methods for designing steel frames, beam-
to-column joints are assumed to be jointly or fully assem-
bled. In recent years, studying the behaviour of joints has
attracted the attention of researchers in order to know the
actual behaviour of joints and determine their semi-rigid
rates. Bahaari and Sherburne (2000) [6] investigated bolt
connections modelled with ANSYS finite-element (FE)
software and examined their two-dimensional behaviour.
Their research showed how the pressure distribution of the
lever forces was distributed in the bolt couplings. In their
research, they developed and examined 34 different models
of stiffener upper edges and 19 non-stiffener models. In
2006, Urbonas and Daniunas [7] at the University of Salt
Lake City in London conducted studies on bolt connec-
tions. The basis of their research was based on the model of
the component of the European Code, and they assessed the
accuracy of their modelling based on the experimental
results of da Silva from the University of Prague [8]. In this
work, this laboratory database is used to evaluate the
accuracy of finite-element models (FEMs). Shi et al [9]
investigated the experimental and theoretical analysis for
the moment–rotation behaviour of stiffened extended end-
plate connections. The authors derived the moment
moment–rotation relationship for stiffened and extended
end-plate connections, by a new theoretical model. The
end-plate connection was broken down into several com-
ponents, including the panel zone, bolt, end plate and col-
umn flange. Abidelah et al [10] researched the experimental
and analytical behaviour of bolted end-plate connections
with or without stiffeners. The results were analysed for the
moment–rotation curves and the evolution of the tension
Sådhanå (2020) 45:18 � Indian Academy of Sciences
https://doi.org/10.1007/s12046-019-1262-2Sadhana(0123456789().,-volV)FT3](0123456789().,-volV)

forces in the bolts. The main parameters observed were the
failure modes, the evolution of the resistance, the stiffness
and the rotation capacity. Aydın et al [11] investigated
experimental assessment of the semi-rigid connections’
behaviour with angles and stiffeners. Their research showed
that stiffeners play a decisive role in semi-rigid connec-
tions. Maali et al [12, 13] investigated experimental model
for predicting the semi-rigid connections’ behaviour with
angles and stiffeners. They also showed that thickness of
stiffener plays a decisive role in semi-rigid angles con-
nections. As a result, the objectives of the proposed
research can be listed as follows:
• In today’s widely used calculation methods, the effects
of the combination of analysis and design of steel
structures are not considered [14]. The aim of this
research was to analyse the influence of end-plate
connections that utilize the IPE standard profile with
vertical and horizontal stiffeners welded on the beha-
viour of steel connections, and to provide the necessary
data for improving Eurocode 3, efficient use of residue
IPE standard profiles and back to the consumption cycle.
• Analysis of combinatorial behaviour from real-scale
experiments is limited in the literature. The real-scale
behaviour of the combination of the models to be
prepared in this study and the literature will be
observed. Furthermore, the experimental and numeri-
cal models (the FEMs by ANSYS) were investigated
for the relevant connections.
• The study was to analyse the influence on the vertical
and horizontal stiffener end-plate connection created
by IPE profile and thickness of end-plate joints on the
behaviour of beam-to-column semi-rigid connections.
The author tested and analysed the models to charac-
terize the behaviour of the connections using the
moment–rotation curves.
2. Experimental and numerical investigation
2.1 Geometry of models
Figure 1 and table 1 show the geometry and details of the
models. The failure modes of the experimental and
numerical models are designed and tested for six models.
The models, end-plate connections under static loading, are
labelled as vertical and horizontal stiffener groups.
The behaviours of the end plate with vertical and hori-
zontal stiffener joints were compared within their groups
and FEMs. The column stiffeners with a thickness of 10
mm and vertical and horizontal end-plate stiffener were
arc-welded with a continuous 45� fillet. The columns were
chosen with large cross-section, and the use of stiffeners
prevented excessive deflection in the flange column
(HE160B was selected for columns, and IPE160 was
selected for beams; beam and column profile sections were
S235). The procedure involves manual metal arc welding
using a proper consumable electrode. For each steel quality,
there are often many electrode types to choose from
[16–19]. The covered electrode used in manual welding
was E43. The minimum thickness of the down-hand fillet
welds was 5 mm. Hand-tightened full-threaded grade 8.8
M12 bolts in 14 mm drilled holes were kept constant for all
tested specimens. Tension tests were carried out following
the provisions of relevant standard [20]. Three tensile
coupons were done of the end plate and stiffener. The mean
value of three coupons tests results is calculated and shown
in table 2 and figure 2.
2.2 Test set-up
The experimental models were developed to predict of
failure modes the end-plate connections with horizontal and
vertical stiffeners under static loading in two groups. Fig-
ure 3 shows the test set-up. In the test set-up section, the
descriptions are divided into three parts:
• experimental tools,
• modelling experiments and applying them correctly,
• conversion of experimental data to the desired data by
formulas.
Experimental tools: The tools used in this research are
similar tools [21–26]. Themaximum load of themachinewas
900 kN, which was employed with a maximum stroke of 300
mm and a constant speed of 0.016 mm/s, up to the collapse of
the specimens. The displacement transducers are used to
measure deformations under load. Five linear variable dis-
placement transducers, with amaximumdisplacement of 100
mm, are used to measure the relevant displacement (location
of LVDTs are shown asDT in figure 3). FourTMLYEFLA-5
(value of resistance is 121 X ± 0.5%, coefficient of sensi-
tivity is 2.1± 2% and size is 5 mm9 3mm) strain gauges are
added to the system to observe the strain distribution (ST1 =
parallel to column on top end plate, ST2 = vertical to column
on top end plate, ST3 = parallel to column on bottom end
plate, ST4 = vertical to column on bottom end plate). The
location of placed strain gauge should be artificially buffed
and cleaned, then the strain gauge should be stuck with a glue
named CN in Japon. The results are collected using a data-
logging device that records all measurements from the load
cells at one-second intervals.
Modelling experiments and applying them correctly: In
this study, the frame dimensions were chosen on 1/1 scale
to conduct real-scale experiments. The lengths of the beam
and column were chosen as 1500 mm. In order to prevent
the lateral torsional buckling of the beam while loading, a
two-column guidance device was provided for the beam.
The lateral torsional buckling of the beam did not, in fact,
occur during loading in the experiments (figure 3). This
study aimed to obtain a realistic stress pattern at the con-
nection, and the fracture of several specimens, i.e., ultimate
18 Page 2 of 15 Sådhanå (2020) 45:18

X
Y
A
B
C
D
FE
Beam= IPE 160
Beam= IPE 160C
olum
n= H
EB 1
60C
olum
n= H
EB 1
60
a) Vertical stiffener group
c) Horizantal stiffener group
2d
2d
Figure 1. Geometry of the models (d = diagonal of bolts).
Sådhanå (2020) 45:18 Page 3 of 15 18

load, was attained using a specific testing machine. The
locations of the strain gauges and LVDTs are shown in
figure 3.
Conversion of experimental data to the desired data by
formulas: The purpose of this experimental investigation is
to examine the moment–rotation (M–h) behaviour. For this
reason, the support of the beam is fixed and the moment at
the supports is calculated by the following formula:
M ¼ PLload ð1Þ
where Lload is the distance between the load application
point and beam end and P is the applied load.
Table 1. Experimental and finite-element models.
Group Model
A
(mm)
B
(mm)
X and C
(mm)
Y
(mm)
D
(mm)
E
(mm)
F
(mm)
ts(mm)
tp(mm)
Vertical Ex-V-IPE140 and FE-V-IPE140 36 60 160 73 – – – 6.9 6
Ex-V-IPE160 and FE-V-IPE160[15] 36 60 160 82 – – – 7.4 6
Ex-V-IPE200 and FE-V-IPE200[15] 36 60 160 100 – – – 8 6
Horizontal Ex-H-IPE140 and FE-H-IPE140 – – 160 – 73 60 36 6.9 6
Ex-H-IPE160 and FE-H-IPE160 – – 160 – 82 60 36 7.4 6
Ex-H-IPE200 and FE-H-IPE200 – – 160 – 100 60 36 8 6
tp = thickness of vertical and horizontal stiffener, ts = thickness of end plate.
Table 2. Average characteristic values for structural steels and bolt (8.8).
E (MPa) Est (MPa) fy (MPa) fu (MPa) qy = fy/fu est euni ef
10 mm plate (column stiffener) 205352 1798 687 721 0.95 2.71 9 10-22.68 9 10-21.62 9 10-1
6.9 mm (end-plate IPE140) 203911 1581 612 647 0.94 2.66 9 10-22.61 9 10-21.55 9 10-1
7.4 mm (end-plate IPE160) 204227 1698 627 663 0.94 2.67 9 10-22.63 9 10-21.57 9 10-1
8 mm (end-plate IPE200) 204995 1718 669 702 0.95 2.69 9 10-22.66 9 10-21.60 9 10-1
6 mm (vertical and horizontal stiffener) 203891 1545 608 643 0.94 2.59 9 10-22.56 9 10-21.50 9 10-1
Bolt (M12) – – 1127 1247 0.90 – – –
E = Young’s modulus, Est = strain hardening modulus, fy = static yield, fu = tensile stresses, est = strain at the strain hardening point, euni = uniform strain, ef= strain at rupture load.
Figure 2. Tensile coupons of 7.4 mm (end-plate IPE160) specimen.
18 Page 4 of 15 Sådhanå (2020) 45:18

As shown in figure 3, displacements are measured with
LVDTs and the rotation in beams and joints will be cal-
culated with the following formulas:
ZZZEIddx ¼ �P ) ð2Þ
ZZEIddx ¼ �PX þ C1 ) ð3Þ
ZEId dx ¼ �PX2
2
� �þ C1X þ C2 ) ð4Þ
EId ¼ PX3
6
� �þ C1X
2
2
� �þ C2X þ C3: ð5Þ
For the fixed joint:
when x ¼ 0 ) h ¼ 0 ð4Þ; d ¼ 0 ð5Þ; and thusC3 ¼ 0: ð6Þ
For the free end of the beam:
when x ¼ L;M ¼ 0 ð3Þ ) C1 ¼ PL ð7Þ
dbel DTið Þ ¼ � P
EbIbX3 DTi
6
� �� Lload X2 DTi
2
� �ð8Þ
h ¼ arctanðdDT1� dDT5� dbel DT1ð Þ
L1
� �ð9Þ
where h is the rotation of beam, I is themoment of inertia, d isthe displacement and E is the Young’s modulus of the beam.
DT2DT1
DT3
DT4
DT5
Pload
250mm250mm
250mm
250mm250mm
XLload
L1
column
Hydraulic Jack
Strain gauges (T3 and T4)
Strain gauges (T1 and T2) LVDT
Figure 3. Experimental set-up.
Sådhanå (2020) 45:18 Page 5 of 15 18

2.3 Moment–rotation curve
Figure 4 shows the major features of the moment–rotation
curve. This curve shows the plastic flexural resistance
(MjRd), the rotation of plastic flexural resistance (hMRd), the
maximum bending moment (Mjmax), the rotation of maxi-
mum bending moment (hMjmax), the knee-range of the M–hcurve, the bending moment capacity (MhCd) and the rota-
tion of bending moment capacity (hCd) [27–35].The ductility of a joint (Wj), the maximum load and
corresponding ductility levels (Wjmax load) are calculated as
given in Eqs. (10) and (11):
Wj ¼ hCdhMRd
; ð10Þ
Wjmaxload ¼hMjmax
hMRd: ð11Þ
The dissipated energy is the area under moment–rotation
curve.
3. FEM
The FEMs of semi-rigid vertical and horizontal stiffened
bolted connections were made and their results were
compared to experimental results. The models have been
used to predict main parameters of the moment–rotation
curve. The FE analysis is realized by the experimental
database to simulate the moment–rotation behaviour of
semi-rigid connections. Thus, the behaviour of connections,
which are not tested before, can be predicted thanks to the
analytical model fitted by tests. The ANSYS-Workbench
[36] is used for predicting main parameters of moment–
rotation curve of the numeric models. This paper consists of
the end-plate connections with horizontal and vertical
stiffener and bolts in the connection arrangement. The
column was considered fixed at the bottom. The beam was
considered fixed in the X direction. The end plate and
stiffeners were connected to the cross-section of the beam
as welded connection. The ANSYS model is as shown in
figure 6; 20 nodded SOLID 186 elements were used for the
modelling of the elements in ANSYS Workbench. The
connections between the elements were provided using the
contact option in the ANSYS Workbench. Bonded contacts
were provided for welded connections, and frictionless
contact was provided between the column flange and the
end plate. Friction contact, with the friction coefficients of
0.2, was provided between the bolt hole and the bolts. The
contact between the end plate and beam element was pro-
vided as bonded contact since it was a welded connection.
The contact between the stiffener plate and beam element
was provided bonded contact since it was a welded con-
nection. In the FEMs, the beam and column structures are
divided into small elements for calculated individual
deformation easily. In most research works, tetrahedron
type FE meshes are selected in the modelling of beams and
columns [37–40]. The sweep, automatically generated,
tetrahedrons and hex-dominant are meshing methods in
ANSYS-Workbench program. The sweep method cannot
used in beam–column connection models. The non-
sweepable bodies force the sweep method controlling. The
automatically generated, tetrahedrons and hex-dominant
method meshings are compared for their created nodes and
elements of the same mesh sizing. FE-V-IPE140 model is
used to mesh with these generation types. The mesh size is
taken as 50 mm for each method. It is observed from
table 3 that automatically generated, tetrahedrons and hex-
Figure 4. Moment–rotation curve characteristics.
18 Page 6 of 15 Sådhanå (2020) 45:18

dominant meshing methods give different values for nodes
and elements.
Therefore, tetrahedronmeshingwith 10 nodes (every node
of this volume has three degrees of freedom) is selected for
solving FE models. Mesh sizing is important for accurate
stress and displacement values. For this purpose, selected
meshing type, the tetrahedron mesh divides various sizing
meshes starting with 200 mm. When the stress and dis-
placement values are stable, this mesh sizing can be appli-
cable for FEM analysis. Table 4 and figure 5 illustrate that
mesh sizing is important to find the exact stress values.
Figure 5 shows maximum stress values of models.
Values of 10, 25 and 50 mm mesh sizing are near each
other. Hence, 50 mm mesh size can be used for FEM
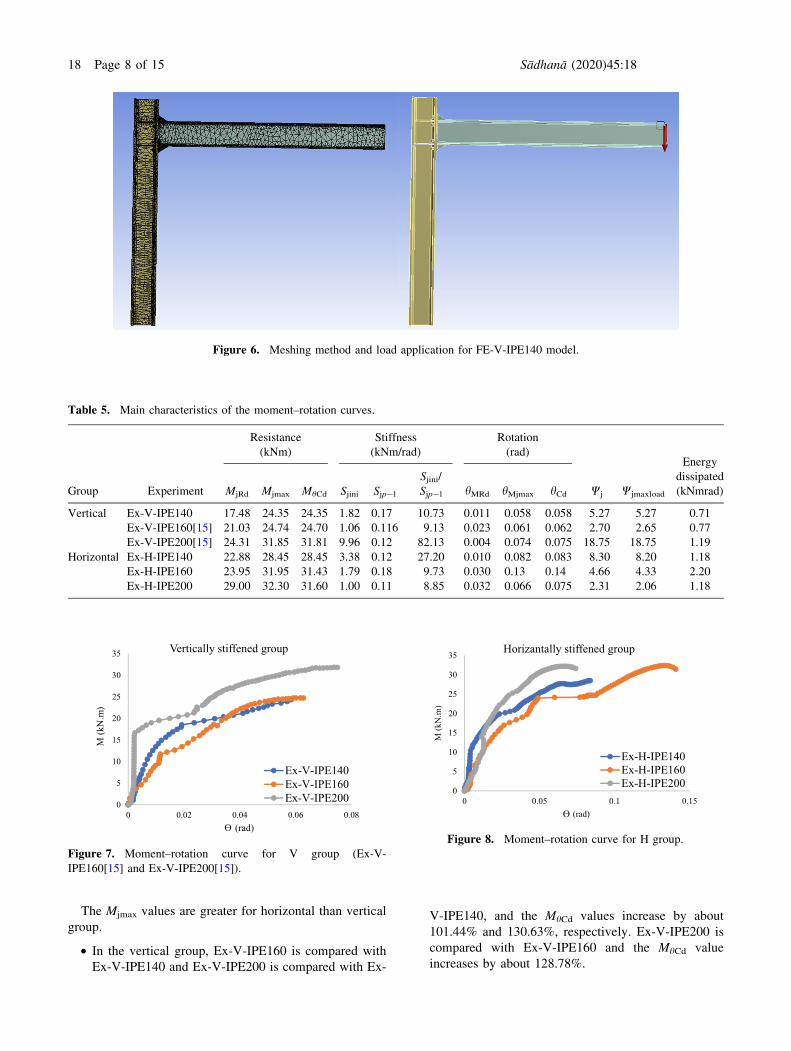
analysis. Figure 6 shows the meshing method and load
application for FE-V-IPE140 model. Moreover, the mate-
rial properties used in the FE analysis are presented in
table 2.
4. Results
4.1 Experimental results
Table 5 shows that moment resistance, stiffness, rotation
ductility of a joint (Wj), the maximum load, corresponding
ductility levels (Wjmax load) and dissipated energy of the
experimental models (figures 7 and 8).
• For the vertical stiffeners at outer surfaces of the
flanges: Ex-V-IPE160 is compared with Ex-V-IPE140
and Ex-V-IPE200 is compared with Ex-V-IPE140, and
the MjRd values increase by about 120.31% and
139.07%, respectively.
• Ex-V-IPE200 specimen is compared with Ex-V-
IPE160 for the Mj.Rd value and it increases by about
115.59%.
• For the horizontal stiffeners at outer surfaces of the
flanges: Ex-H-IPE160 is compared with Ex-H-IPE140
and the Ex-H-IPE200 is compared with the Ex-H-
IPE140, and the MjRd values increase by about
104.68% and 126.75%, respectively.
• Ex-H-IPE200 is compared with Ex-H-IPE160 and the
MjRd values are increased by about 121.08%. The MjRd
values increase with an increase in thickness of end
plate for all groups.
• Ex-H-IPE140 is compared with Ex-V-IPE140 Ex-H-
IPE160 is compared with Ex-V-IPE160 and Ex-H-
IPE200 is compared with Ex-V-IPE200, and the MjRd
values are increased by about 130.89%, 113.88% and
119.29%, respectively.
The MjRd values of the horizontal group are greater than
the vertical group ones.
• For the vertical stiffeners at outer surfaces of the
flanges: Ex-V-IPE160 is compared with Ex-V-IPE140
and Ex-V-IPE200 is compared with Ex-V-IPE140
specimen, and the Mjmax values increase by about
101.60% and 130.80%, respectively. Furthermore, Ex-
V-IPE200 is compared with Ex-V-IPE160 and the
Mjmax increases by about 128.74%.
• For the horizontal stiffeners at outer surfaces of the
flanges: Ex-H-IPE160 specimen is compared with Ex-
H-IPE140 and Ex-H-IPE200 is compared with Ex-H-
IPE140, and the Mjmax values increase by about
112.30% and 113.53%, respectively.
• Ex-H-IPE200 is compared with Ex-H-IPE160 and the
Mjmax value increases by about 101.95%. The Mjmax
values increase with an increase in thickness of end
plate for all groups. Moreover, Ex-H-IPE140 is
compared with Ex-V-IPE140, Ex-H-IPE160 is com-
pared with Ex-V-IPE160 and Ex-H-IPE200 is com-
pared with Ex-V-IPE200, and the Mjmax values
increase by about 116.83%, 129.14% and 101.41%,
respectively.
Table 3. Numbers of nodes and elements for FE-V-IPE140
model.
Mesh type
Number of
nodes
Number of
elements
Automatically
generated
19463 8379
Hex-dominant 15330 4317
Tetrahedrons 20520 8841
Table 4. Numbers of nodes and elements for FE-V-IPE140
model.
10
mm
25
mm
50
mm
100
mm
150
mm
200
mm
Von Mises
(MPa)
3576.5 3576.2 3575.7 3568.6 3560.5 3549.1
3545
3550
3555
3560
3565
3570
3575
3580
0 50 100 150 200 250
Equi
vale
nt S
tress
(MPa
)
Mesh Size (mm)
Figure 5. Different mesh sizes and stress values.
Sådhanå (2020) 45:18 Page 7 of 15 18
The Mjmax values are greater for horizontal than vertical
group.
• In the vertical group, Ex-V-IPE160 is compared with
Ex-V-IPE140 and Ex-V-IPE200 is compared with Ex-
V-IPE140, and the MhCd values increase by about
101.44% and 130.63%, respectively. Ex-V-IPE200 is
compared with Ex-V-IPE160 and the MhCd value
increases by about 128.78%.
Figure 6. Meshing method and load application for FE-V-IPE140 model.
Table 5. Main characteristics of the moment–rotation curves.
Group Experiment
Resistance
(kNm)
Stiffness
(kNm/rad)
Rotation
(rad)
Wj Wjmaxload
Energy
dissipated
(kNmrad)MjRd Mjmax MhCd Sjini Sjp-l
Sjini/
Sjp-l hMRd hMjmax hCd
Vertical Ex-V-IPE140 17.48 24.35 24.35 1.82 0.17 10.73 0.011 0.058 0.058 5.27 5.27 0.71
Ex-V-IPE160[15] 21.03 24.74 24.70 1.06 0.116 9.13 0.023 0.061 0.062 2.70 2.65 0.77
Ex-V-IPE200[15] 24.31 31.85 31.81 9.96 0.12 82.13 0.004 0.074 0.075 18.75 18.75 1.19
Horizontal Ex-H-IPE140 22.88 28.45 28.45 3.38 0.12 27.20 0.010 0.082 0.083 8.30 8.20 1.18
Ex-H-IPE160 23.95 31.95 31.43 1.79 0.18 9.73 0.030 0.13 0.14 4.66 4.33 2.20
Ex-H-IPE200 29.00 32.30 31.60 1.00 0.11 8.85 0.032 0.066 0.075 2.31 2.06 1.18
0
5
10
15
20
25
30
35
0 0.02 0.04 0.06 0.08
M (k
N.m
)
(rad)
Vertically stiffened group
Ex-V-IPE140Ex-V-IPE160Ex-V-IPE200
Figure 7. Moment–rotation curve for V group (Ex-V-
IPE160[15] and Ex-V-IPE200[15]).
0
5
10
15
20
25
30
35
0 0.05 0.1 0.15
M (k
N.m
)
(rad)
Horizantally stiffened group
Ex-H-IPE140Ex-H-IPE160Ex-H-IPE200
Figure 8. Moment–rotation curve for H group.
18 Page 8 of 15 Sådhanå (2020) 45:18
• In the horizontal group, Ex-H-IPE160 is compared
with Ex-H-IPE140 and Ex-H-IPE200 is compared
with Ex-H-IPE140, and the MhCd values increase by
about 110.47% and 111.07%, respectively.
• Ex-H-IPE200 is compared with Ex-H-IPE160 and the
MhCd value increases by about 100.54%. By the way,
the MhCd values increase with an increase in thickness
of end plate for vertical and horizontal groups.
Moreover, Ex-H-IPE140 is compared with Ex-V-
IPE140 and Ex-H-IPE160 is compared with Ex-V-
IPE160, and the MhCd values increase by about
116.83% and 127.25%, respectively.
As a conclusion, the moment resistance increased with
increased thickness of end plate and moment resistant in
horizontal stiffener group models. The moment resistances
of horizontally stiffened group are greater than those of
vertically stiffened models.
• In the vertically stiffened group, Sjini/Sj.p-l value for
Ex-V-IPE160 is 0.85 times that of Ex-V-IPE140 and
for Ex-V-IPE200, it is 7.65 times that of Ex-V-
IPE140 specimen. Furthermore, Sjini/Sj.p-l value for
0
5
10
15
20
25
30
0 0.01 0.02 0.03 0.04 0.05 0.06 0.07 0.08
M (k
N.m
)
(rad)
FE-Vertically stiffened group
FE-V-IPE140FE-V-IPE160FE-V-IPE200
Figure 9. Moment–rotation curve for FE-V group.
0
5
10
15
20
25
30
35
40
0 0.02 0.04 0.06 0.08 0.1 0.12
M (k
N.m
)
(rad)
FE-Horizantally s�ffened group
FE-H-IPE140FE-H-IPE160FE-H-IPE200
Figure 10. Moment–rotation curve for FE-H group. Table
6.
Comparisonofexperim
entalandFEmodels.
Group
Experim
ent
Resistance
(kNm)
Stiffness
(kNm/rad)
Rotation
(rad)
E1=energy
dissipated
(kNmrad)
(ex)
E2=energy
dissipated
(kNmrad)
(FE)
E1/
E2
Mjm
ax
(Ex)
Mjm
ax
(FE)
Mjm
ax(Ex)/
Mjm
ax(FE)
S1=
Sjini/
Sj.p-l
(Ex)
S2=
Sjini/
Sj.p-l
(FE)
S1/
S2
h Mjm
ax
(Ex)
h Mjm
ax
(FE)
h Mjm
ax(Ex)/
h Mj.max(FE)
Vertical
Ex-V
-IPE140andFE-V
-IPE140
24.35
24.8
0.98
10.73
70.14
0.15
0.058
0.055
1.05
0.71
1.13
0.63
Ex-V
-IPE160[15]andFE-V
-IPE160
24.74
25.1
0.98
9.13
38.63
0.24
0.061
0.06
1.02
0.77
1.29
0.60
Ex-V
-IPE200[15]andFE-V
-IPE200
31.85
27
1.18
82.13
67.86
1.21
0.074
0.064
1.16
1.19
1.54
0.77
HorizontalEx-H
-IPE140andFE-H
-IPE140
28.45
27.3
1.04
27.20
46.75
0.58
0.082
0.082
11.18
1.88
0.63
Ex-H
-IPE160andFE-H
-IPE160
31.95
32.20
0.99
9.73
25.32
0.38
0.13
0.084
1.55
2.20
2.27
0.97
Ex-H
-IPE200andFE-H
-IPE200
32.30
35.4
0.91
8.85
53.38
0.17
0.066
0.091
0.73
1.18
3.03
0.39
Sådhanå (2020) 45:18 Page 9 of 15 18

the Ex-V-IPE200 specimen is 8.99 times that of Ex-V-
IPE160.
• In the horizontally stiffened group, Sjini/Sjp-l value for
Ex-H-IPE160 is 0.36 times that of Ex-H-IPE140 and
for Ex-H-IPE200, it is 0.32 times that of the Ex-H-
IPE140 specimen. The Sjini/Sj.p-l value for Ex-H-
IPE200 is 0.91 times that of Ex-H-IPE160. Thus, Sjini/
Sjp-l increases with an increase in thickness of end
plate for vertically stiffened group. However, it
decreases with an increase in thickness of end plate
for the horizontally stiffened group. Moreover, the
Sjini/Sjp-l value for Ex-H-IPE140 is compared with that
of Ex-V-IPE140, and Ex-H-IPE160 is compared with
Ex-V-IPE160. The Sjini/Sjp-l values increase by about
253.49% and 106.57%, respectively. Ex-H-IPE200 is
compared with Ex-V-IPE200, and the Sjini/Sjp-l value
decreases by about 10.77%.
The stiffness increases with increased thickness of end
plate for vertically stiffened connections and decreases with
increased thickness of end plate for horizontally stiffened
connections. The stiffness of horizontally stiffened samples
is greater than vertical ones, but not for Ex-V-IPE200.
• In the vertically stiffened group, Ex-V-IPE160 is
compared with Ex-V-IPE140 and Ex-V-IPE200 is
compared with Ex-V-IPE140, and the hMjmax values
increase by about 105.17% and 127.59%, respectively.
• Ex-V-IPE200 is compared with Ex-V-IPE160 and
hMj.max increases by about 121.31%. In the horizontally
stiffened group, Ex-H-IPE160 is compared with Ex-H-
IPE140 and the hMj.max value increases by about
158.54%.
• Ex-H-IPE200 is compared with Ex-H-IPE140 and
hMjmax decreases by about 89.16%. Ex-H-IPE200 is
compared with Ex-H-IPE160 and hMj.max decreases by
about 50.77%. Thus, hMjmax increases with an increase
in thickness of end plate for all groups. Moreover, Ex-
H-IPE140 is compared with Ex-V-IPE140 and Ex-H-
IPE160 is compared with Ex-V-IPE160, and the hMjmax
Figure 11. Failure mode for V group (Ex-V-IPE160[15] and Ex-V-IPE200[15]).
18 Page 10 of 15 Sådhanå (2020) 45:18

Figure 12. Failure mode for H group.
Table 7. Failure modes of experimental models.
Mode
Top flange of model
Ex-V-IPE140 Ex-V-IPE160 [15] Ex-V-IPE200 [15] Ex-H-IPE140 Ex-H-IPE160 Ex-H-IPE200
Mode 1 – – – – – –
Mode 2 4 4 4 4 4 4
Mode 3 – – – – – –
Sådhanå (2020) 45:18 Page 11 of 15 18

0
5
10
15
20
25
30
-1000 0 1000 2000 3000
M (k
N.m
)
Strain (µm/m)
Ex-V-IPE140
0
5
10
15
20
25
30
35
-5000 0 5000 10000
M (k
N.m
)
Strain (µm/m)
Ex-V-IPE200[15]
0
5
10
15
20
25
30
-1000 0 1000 2000 3000 4000
M (k
N.m
)
Strain (µm/m)
Ex-V-IPE160[15]
0
5
10
15
20
25
30
-500 0 500 1000 1500 2000 2500
M (k
N.m
)
Strain (µm/m)
Ex-H-IPE140
0
5
10
15
20
25
30
35
-500 0 500 1000 1500 2000 2500
M (k
N.m
)
Strain (µm/m)
Ex-H-IPE160
0
5
10
15
20
25
30
35
-6000 -4000 -2000 0 2000 4000
M (k
N.m
)
Strain (µm/m)
Ex-H-IPE200
Figure 13. The moment–strain curves of all experimental specimens. (T1 = blue line, T2 = orange line, T3 = grey line and T4 = yellow
line).
18 Page 12 of 15 Sådhanå (2020) 45:18

values increase by about 141.38% and 213.11%,
respectively.
• The hMjmax values for horizontally stiffened group are
greater than vertical ones, but not for Ex-H-IPE200.
• In the vertically stiffened models, Ex-V-IPE160 is
compared with Ex-V-IPE140 and Ex-V-IPE200 is
compared with Ex-V-IPE140, and the hCd values
increase by about 106.90% and 129.31%, respectively.
• Ex-V-IPE200 is compared with Ex-V-IPE160 and hCdincreases by about 120.97%.
• For the horizontal stiffeners at outer surfaces of the
flanges: Ex-H-IPE160 is compared with Ex-H-IPE140
and hCd increases by about 167.67%. Ex-H-IPE200 is
compared with Ex-H-IPE140 specimen and hCddecreases by about 89.15%.
• Ex-H-IPE200 is compared with Ex-H-IPE160 and hCddecreases by about 52.86%. Thus, the hCd values
increase with an increase in thickness of end plate for
all groups. Moreover, Ex-H-IPE140 is compared with
Ex-V-IPE140 and Ex-H-IPE160 is compared with Ex-
V-IPE160, and the hCd values increase by about
143.10% and 225.81%, respectively. Thus, the hCdvalues for the horizontal groups are greater than the
vertically stiffened ones, but not for Ex-H-IPE200.
In consolidation, the rotation value increased with
increased thickness of end plate. The rotation value in the
horizontal group is greater than vertically stiffened ones.
The ductility of a joint (Wj) and the maximum load and
corresponding ductility levels (Wjmax load) increase with
increased thickness of end plate in the vertical group; they
decrease with increased thickness of end plate in the hori-
zontally stiffened ones. The ductility of a joint (Wj) and the
maximum load and corresponding ductility levels (Wj.-
max load) in the horizontally stiffened models are greater
than vertically stiffened ones, but not for Ex-H-IPE200.
Dissipated energy increases with increased thickness of end
plate in all groups. Dissipated energies in the horizontal
group are greater than the vertical ones.
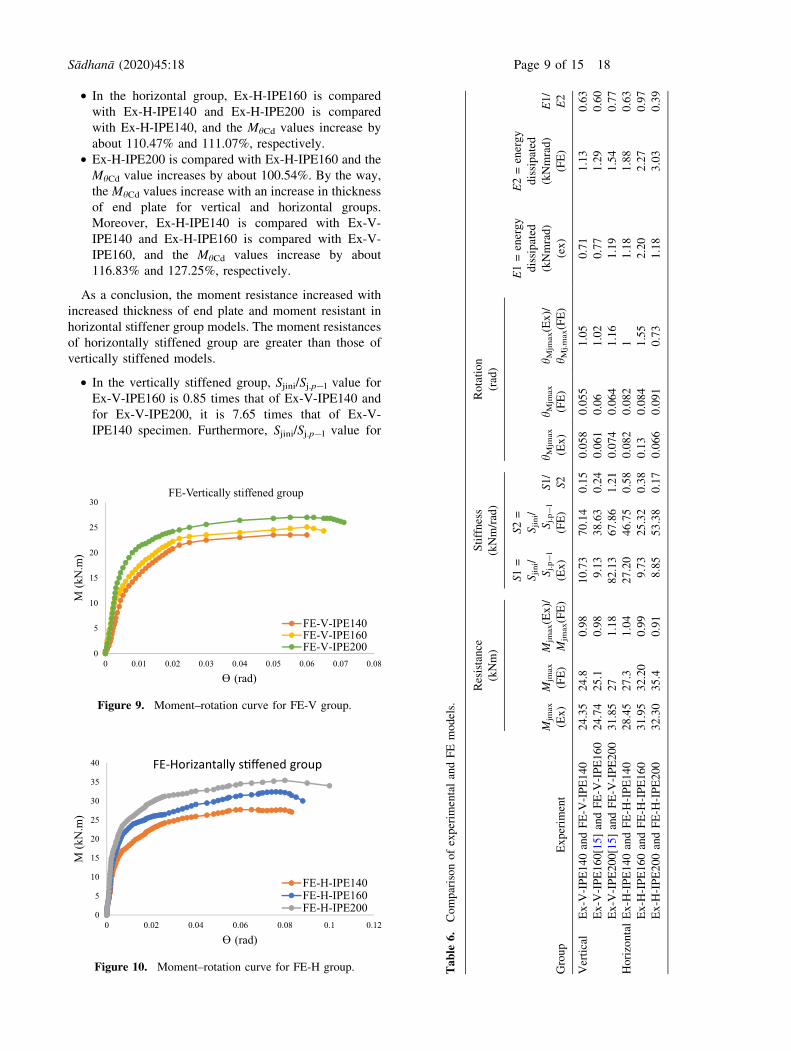
4.2 Comparison of experimental and FEMs
Figures 9 and 10 show the moment–rotation curves,
obtained from the ANSYS models. Table 6 and figures 9
and 10 showthe comparison of the experimental data with
FE data. There appears to be good agreement between the
experimental and FEM results. The average ratios of
Mjmax(Ex)/Mjmax(FE) vary between 0.91 and 1.18, and the
minimum Mj.max(Ex)/Mjmax(FE) ratio is for Ex-H-IPE200
and FE-H-IPE200. The maximum Mjmax(Ex)/Mj.max(FE)
ratio is for Ex-V-IPE200 and FE-V-IPE200. The average
ratios of hMj.max(Ex)/hMj.max(FE) vary between 0.73 and
1.55, and the minimum hMj.max(Ex)/hMj.max(FE) ratio is for
Ex-H-IPE200 and FE-H-IPE200. The maximum hMjmax(-
Ex)/hMj.max(FE) ratio is for Ex-H-IPE160 and FE-H-
IPE160. Furthermore, the S1/S2 ratio for vertically stiff-
ened group increases with increased thickness of end
plate, and it decreases for horizontal group with increased
thickness of end plate. The average ratios of E1/E2 vary
between 0.39 and 0.97, and the minimum E1/E2 ratio is
for Ex-H-IPE200 and FE-H-IPE200. The maximum E1/E2
ratio is for Ex-H-IPE160 and FE-H-IPE160. Thus, the
FEM is an efficient tool to predict the moment–rotation
curve of semi-rigid connection.
4.3 Failure modes of specimens
There are three failure modes in the Eurocode 3 [31] for
the T-stub connections. Mode 1 is the complete flange
yielding without bolt failure. Mode 2 is the flange
yielding with bolt failure, and Mode 3 is the bolt failure.
Figures 11 and 12 show the failure modes and table 7
shows the failure types of all models. All the models
showed the failure mode as Mode 2. Thus, all models’
collapse is with the fracture positions of all the failed
bolts appearing on the thread portion in the top-end-plate
connections. Furthermore, all top-end-plate connections
present V-shaped form at failure, and the depth of
V-shape of vertically stiffened models is greater than the
horizontal ones.
Figure 13 shows the moment–strain graph of all models.
From these curves, the following conclusions can be drawn:
• There is a correlation between the moment–rotation
and moment–strain plots of these two completely
different tools, which can be taken as further proof
of the installation and measurement precisions.
• T1 and T2 strain gauges come in plastic region after
loading starts. These strain gauges have been installed
on top-end-plate connections. However, T3 and T4
strain gauges in the bottom end plate were in the elastic
region.
5. Conclusions
In this paper, the effect of vertical and horizontal stiffeners
on static behaviour of the semi-rigid beam-to-column bol-
ted connections in steel frames was investigated. This paper
presents the experimental results of six full-scale specimens
of bolted connections beam-to-column with end plate in
two groups, labelled as vertical and horizontal stiffener
groups. The aim of this research was to analyse the influ-
ence of end-plate connections to utilize the IPE profile with
vertical and horizontal stiffener welded on the behaviour of
steel connections, to provide the necessary data for
improving Eurocode 3, efficient use of residue IPE profiles
Sådhanå (2020) 45:18 Page 13 of 15 18
and back to the consumption cycle. The main conclusions
of paper can be summarized as follows:
• The moment resistance increases with increased
thickness of end plate and it is greater for the
horizontally stiffened models than the vertical ones.
• The Sjini/Sjp-l value for vertical groups increases with
an increase in thickness of end plate, and it decreases
for the horizontal groups with an increase in thickness
of end plate.
• The rotation increases with increased thickness of end
plate and the rotation value in the horizontal stiffener
group of models is greater than the vertical ones.
• The joint ductility (Wj), the maximum load and the
corresponding ductility levels (Wjmaxload) increase with
increased thickness of end plate in the vertical group,
and they decrease with increased thickness of end plate
in the horizontal group. The ductility of a joint (Wj),
the maximum load and corresponding ductility levels
(Wj.max load) in horizontally stiffened models are
greater than the vertical ones.
• The dissipated energy increases with increased thick-
ness of end plate in all groups, and for the horizontally
stiffened group, it is greater than those of the vertical
models.
• There appears to be good agreement between the
experimental and FE model results.
• In all models, the failure mode is mode 2 in the top
flange. Thus, collapse of all the models is with the
fracture positions of all the failed bolts appearing on
the thread portion in the top-end-plate connections, and
in the form of V-shape for all top-end-plate connec-
tions. In addition, the depths of V shape in the V group
are greater than those of H models.
NomenclatureMjRd The plastic flexural resistance
hMRd The rotation of plastic flexural resistance
Mjmax The maximum bending moment
hMjmax The rotation of maximum bending moment
MhCd The bending moment capacity
hCd The rotation of bending moment capacity
Wj The ductility of a joint
Wjmaxload The maximum load and corresponding ductility
levels
References
[1] Simoes da Silva L, Lima L, Vellasco P, De Andrade S and
De Castro R A 2008 Nonlinear dynamic analysis of steel
portal frames with semi rigid connections. Engineering
Structures 30: 2566–2579
[2] Mirghaderi S R and Dehghani Renani M 2008 The rigid
seismic connection of continuous beams to column. Journal
of Constructional Steel Research 64: 1516–1529
[3] Pirmoz A, Seyed Khoei A, Mohammadrezapour E and Saedi
Daryan A 2009 Moment–rotation behavior of bolted top–seat
angle connections. Journal of Constructional Steel Research
65:http://www.sciencedirect.com/science/journal/0143974X/
65/4973–984
[4] Babu S S and Sreekumar S 2012 A study on the ductility of
bolted beam–column connections. International Journal of
Modern Engineering Research 5: 3517–3521
[5] Dubina D and Stratan A 2002 Behavior of welded connec-
tions of moment resisting frames beam-to-column joints.
Engineering Structures 24: 1431–1440
[6] Bahaari M R and Sherburne Archibald N 2000 Behavior of
eight-bolt large capacity end-plate connections. Computers
& Structures 77: 315–325
[7] Urbonas K and Daniunas A 2006 Behavior of semi-rigid
steel beam-to-beam joints under bending and axial forces.
Journal of Construction Steel Research 62: 1244–1249
[8] Simoes da Silva L, Lima L, Vellasco P and De Andrade S
2001 Experimental behavior of end-plate beam to column
joints under bending and axial force. ECCS Technical
Committee 10 ‘‘Connections’’ twg10.2, Department of Civil
Engineering, University of Coimbra
[9] Shi Y, Shi G and Wang Y 2007 Experimental and theoretical
analysis of the moment–rotation behaviour of stiffened
extended end-plate connections. Journal of Constructional
Steel Research 63: 1279–1293
[10] Abidelah A, Bouchaır A and Kerdal D E 2012 Experimental
and analytical behavior of bolted end-plate connections with
or without stiffeners. Journal of Constructional Steel
Research 76: 13–27
[11] Aydın A C, Kılıc M, Maali M and Sagıroglu M 2015
Experimental assessment of the semi-rigid connections
behavior with angles and stiffeners. Journal of Construc-
tional Steel Research 114: 338–348
[12] Maali M, Kılıc M and Aydın A C 2016 experimental
model of the behaviour of bolted angles connections with
stiffeners. International Journal of Steel Structures 16:
1–15
[13] Maali M, Kılıc M, Sagiroglu M and Aydın A C 2017
Experimental model for predicting the semi-rigid connec-
tions’ behaviour with angles and stiffeners. Advances in
Structural Engineering 20: 884–895
[14] Sagiroglu M and Aydin A C 2015 Design and analysis of
non-linear space frames with semi-rigid connections. Steel
and Composite Structures 18: 1405–1421
[15] Maali M 2018 Dikey Berkitmeli Alın Levhalı Kiris-KolonBirlesimlerin Davranısının Deneysel Olarak Incelenmesi.
GUFBED/GUSTIJ 8(2): 255–263
[16] Aydın A C, Maali M, Kılıc M and Sagıroglu M 2015
Experimental investigation of sinus beams with end-plate
connections. Thin-Walled Structures 97: 35–43
[17] Rodrigues D M, Menezes L F, Loureiro A and Fernandes J
V 2004 Numerical study of the plastic behavior in tension
of welds in high strength steels. Journal of Plasticity 20:
1–18
[18] Davies A C 1992 The science and practice of welding—
welding science and technology, vol. I. Cambridge: Cam-
bridge University Press
18 Page 14 of 15 Sådhanå (2020) 45:18

[19] Maali M, Aydın AC and Sagıroglu M 2015 Investigation of
innovative steel runway beam in industrial building. Sad-
hana – Academy Proceedings in Engineering Sciences 40:
2239–2251
[20] Metallic materials—tensile testing—part 1: method of test at
room temperature. GB/T228.1-2010. Beijing: China Stan-
dard Press, 2010 [in Chinese]
[21] Popov E P and Takhirov S M 2002 Bolted large seismic steel
beam-to-column connections—part 1: experimental study.
Engineering Structures 24: 1523–1534
[22] Limaa LRO, Andradea SAL, Vellascob PCG and Silvac L S
2002 Experimental and mechanical model for predicting the
behaviour of minor axis beam-to-column semi-rigid joints.
International Journal of Mechanical Sciences 44: 1047–1065
[23] Coelho A M G, Bijlaard F S K and Kolstein H 2009
Experimental behaviour of high-strength steel web shear
panels. Engineering Structures 31: 1543–1555
[24] Cabrero J M and Bayo E 2007 The semi-rigid behaviour of
three-dimensional steel beam-to-column joints subjected to
proportional loading—part I: experimental evaluation. Jour-
nal of Constructional Steel Research 63: 1241–1253
[25] Shi Y, Shi G and Wang Y 2007 Experimental and theoretical
analysis of the moment–rotation behaviour of stiffened
extended end-plate connections. Journal of Constructional
Steel Research 63: 1279–1293
[26] Piluso V and Rizzano G 2008 Experimental analysis and
modelling of bolted T-stubs under cyclic loads. Journal of
Constructional Steel Research 64: 655–669
[27] Bose B, Youngson G K and Wang Z M 1996 An appraisal of
the design rules in Eurocode 3 for bolted end plate joints by
comparison with experimental results. Proceedings of the
Institute of Civil Engineers Structures and Buildings 116(2):
221–234
[28] Bose B, Sarkar S and Bahrami M 1991 Finite element
analysis of unstiffened extended end plate connections.
Structural Engineering Review 3: 211–224
[29] Schleich JB,Chantrain P,ChabrolinB,Gal�eaY,BureauA and
Anza J 1998Promotion of plastic design for steel and composite
cross sections: new required conditions in Eurocodes 3 and 4,
practical tools for designers. European Commission
[30] Gil B, Cabrero J M, Goni R and Bayo E 2003 An assessment
of the rotation capacity required by structural hollow
sections for plastic analysis. In: Jaurrieta M A, Alonso A
and Chica J A (Eds.) Tubular Structures X. Lisse, Holland:
A.A. Balkema Publishers, pp. 277–292
[31] European Committee for Standardization 2005 Design of
steel structures—part 1.8: design of joints—stage 49 draft.
Brussels: CEN
[32] Maali M, Sagiroglu M and Solak M S 2018 Experimental
behaviour of screwed beam-to-column connections in cold-
formed steel frames.Arabian Journal ofGeosciences11(9): 205
[33] Maali M, Kılıc M and Aydın A C 2019 Experimental
behaviour of bolted connections with stiffeners. Steel
Construction Design and Research 12(2): 105–113
[34] Sagiroglu M, Maali M, Kılıc M and Aydın A C 2018 A novel
approach for bolted t-stub connections. International Journal
of Steel Structures 18(3): 891–909
[35] Sagiroglu M 2018 Experimental evaluation of the post-fire
behavior of steel T-component in the beam-to-column
connection. Fire Safety Journal 96: 153–164
[36] Ansys Inc. 2016 ANSYS documentation 17.0. Southpointe,
Canonsburg, PA
[37] Erdal F and Saka M P 2013 Ultimate load carrying capacity
of optimally designed steel cellular beams. Journal of
Constructional Steel Research 80: 355–368
[38] Maali M 2019 Experimental and numerical prediction of
torsional behavior of steel beam with sinusoidal web. Iranian
Journal of Science and Technology Transactions of Civil
Engineering, https://doi.org/10.1007/s40996-019-00304-9
[39] Sagıroglu M, Maali M and Aydın A C 2018 Installation and
maintenance principles of seismic isolators: Erzurum health
campus. The Open Civil Engineering Journal 12: 83–95
[40] Maali M, Aydın A C, Showkati H, Sagıroglu M and Kılıc M2018 The effect of longitudinal imperfections on the thin-
walled conical shells. Journal of Building Engineering 20:
424–441
Sådhanå (2020) 45:18 Page 15 of 15 18