Failure Analysis of NOL-Ring Specimens by Acoustic · PDF fileFailure Analysis of NOL-Ring...
12
Failure Analysis of NOL-Ring Specimens by Acoustic Emission M. PLÖCKL 1 , M. G. R. SAUSE 1 , J. SCHARRINGHAUSEN 2 and S. HORN 1 1 University of Augsburg, Institute for Physics, Experimental Physics II, Augsburg, Germany Phone: +49 821 598-3413, Fax: +49 821 598-3411; e-mail: [email protected], [email protected], [email protected] 2 MT Aerospace AG, Augsburg, Germany e-mail: [email protected] Abstract Measurements of acoustic emission signals during loading of carbon fiber reinforced plastic NOL (Naval Ordnance Laboratory) - ring specimens were performed to analyse failure mechanisms. By means of a self- aligning split disk test fixture tensile stress was applied to the test ring. Four broadband sensors were mounted on the split disk to detect the acoustic emission signals. Thus the acoustic emission signals were detected without placing the sensors directly on the specimen. A hyperbolic localization of the acoustic emission sources, which are correlated to damages in the material, could be performed. Furthermore, an unsupervised pattern recognition technique was applied to separate the recorded signals into distinct types of classes. A correlation of different failure mechanisms such as matrix cracking, interfacial failure and fiber breakage to respective signal classes was achieved by analysis of signal features. Keywords: acoustic emission, fiber reinforced plastics, pattern recognition, source localization 1. Introduction In history of aviation, lightweight construction has always been of great interest. Nowadays the reduction of weight for energy efficiency or larger carrying capacity for a better competitiveness is a key requirement. The joint research project for efficient manufacturing technologies for composite booster cases (ComBo) has a focus on the development of a key technology for manufacturing lightweight structures made of carbon fiber reinforced polymers (CFRP) for the successor of Ariane 5. With regard to future aerospace applications, new automated and cost-effective manufacturing processes for cylindrical CFRP high pressure vessels are developed. Usage of composite materials with extraordinary strength to weight and stiffness to weight ratios will contribute to optimize the mechanical performance of the structure due to predictable load limits. In the current study NOL (Naval Ordnance Laboratory) ring tests in combination with acoustic emission (AE) analysis are performed to investigate micromechanical material failure of CFRP. The composite integrity and stability is strongly influenced by the occurrence of various failure mechanisms, like inter-fiber matrix cracking, fiber breakage and interfacial failure machanisms, which in turn depend on the application and type of loading. Therefore it is essential to record their position of occurrence and subsequent evolution as a function of loading. Failure identification by suitable interpretation of the recorded AE-signals is still an emerging field of AE research [1-9]. It is a major conclusion of many recent investigations, that pattern recognition techniques are a suitable tool to identify distinct failure types based on various features extracted from the recorded signals [2,3,5,6,9-14]. The correlation between a particular failure mechanism and a cluster is not part of the pattern recognition approach. This task can solely be achieved by additional microscopic investigations or comparison of experimental and theoretical acoustic emission signals. In the spirit of reference [15], for CFRP the distinction between matrix cracking, interfacial failure and fiber breakage is physically based on the source radiation direction and the elastic properties of the source. In 30th European Conference on Acoustic Emission Testing & 7th International Conference on Acoustic Emission University of Granada, 12-15 September 2012 www.ndt.net/EWGAE-ICAE2012/
Transcript of Failure Analysis of NOL-Ring Specimens by Acoustic · PDF fileFailure Analysis of NOL-Ring...

Failure Analysis of NOL-Ring Specimens
by Acoustic Emission
M. PLÖCKL 1, M. G. R. SAUSE 1, J. SCHARRINGHAUSEN 2 and S. HORN 1
1University of Augsburg, Institute for Physics, Experimental Physics II, Augsburg, Germany Phone: +49 821 598-3413, Fax: +49 821 598-3411; e-mail: [email protected],
[email protected], [email protected] 2MT Aerospace AG, Augsburg, Germany
e-mail: [email protected]
Abstract
Measurements of acoustic emission signals during loading of carbon fiber reinforced plastic NOL (Naval Ordnance Laboratory) - ring specimens were performed to analyse failure mechanisms. By means of a self-aligning split disk test fixture tensile stress was applied to the test ring. Four broadband sensors were mounted on the split disk to detect the acoustic emission signals. Thus the acoustic emission signals were detected without placing the sensors directly on the specimen. A hyperbolic localization of the acoustic emission sources, which are correlated to damages in the material, could be performed. Furthermore, an unsupervised pattern recognition technique was applied to separate the recorded signals into distinct types of classes. A correlation of different failure mechanisms such as matrix cracking, interfacial failure and fiber breakage to respective signal classes was achieved by analysis of signal features. Keywords: acoustic emission, fiber reinforced plastics, pattern recognition, source localization
1. Introduction In history of aviation, lightweight construction has always been of great interest. Nowadays the reduction of weight for energy efficiency or larger carrying capacity for a better competitiveness is a key requirement. The joint research project for efficient manufacturing technologies for composite booster cases (ComBo) has a focus on the development of a key technology for manufacturing lightweight structures made of carbon fiber reinforced polymers (CFRP) for the successor of Ariane 5. With regard to future aerospace applications, new automated and cost-effective manufacturing processes for cylindrical CFRP high pressure vessels are developed. Usage of composite materials with extraordinary strength to weight and stiffness to weight ratios will contribute to optimize the mechanical performance of the structure due to predictable load limits. In the current study NOL (Naval Ordnance Laboratory) ring tests in combination with acoustic emission (AE) analysis are performed to investigate micromechanical material failure of CFRP. The composite integrity and stability is strongly influenced by the occurrence of various failure mechanisms, like inter-fiber matrix cracking, fiber breakage and interfacial failure machanisms, which in turn depend on the application and type of loading. Therefore it is essential to record their position of occurrence and subsequent evolution as a function of loading.
Failure identification by suitable interpretation of the recorded AE-signals is still an emerging field of AE research [1-9]. It is a major conclusion of many recent investigations, that pattern recognition techniques are a suitable tool to identify distinct failure types based on various features extracted from the recorded signals [2,3,5,6,9-14]. The correlation between a particular failure mechanism and a cluster is not part of the pattern recognition approach. This task can solely be achieved by additional microscopic investigations or comparison of experimental and theoretical acoustic emission signals. In the spirit of reference [15], for CFRP the distinction between matrix cracking, interfacial failure and fiber breakage is physically based on the source radiation direction and the elastic properties of the source. In
30th European Conference on Acoustic Emission Testing & 7th International Conference on Acoustic Emission University of Granada, 12-15 September 2012
www.ndt.net/EWGAE-ICAE2012/
order to stay with the nomenclature introduced in previous work [6,15-17] and used in this investigation the following correlation is expected between micromechanical failure modes and acoustic emission source properties (notated in brackets) for failure of CFRP:
• Interfiber fracture (matrix cracking or interfacial failure, in-plane) • Fiber-matrix debonding (interfacial failure, in-plane and out-of-plane) • Fiber-matrix pull-out (interfacial failure, in-plane and out-of-plane) • Interply delamination (matrix cracking or interfacial failure, out-of-plane) • Fiber fracture (fiber breakage, in-plane)
A precise description of the implementation used in the particular source types is found in [15,17] and is thus not repeated here. The description of mesoscopic failure modes (i.e. fiber bridging) is beyond the scope of the proposed acoustic emission source models.
In addition, in [16,18] it was demonstrated that the experimental setup and geometry of the specimen have a significant influence on the identification of AE-signal clusters. Furthermore, existence of AE-sources, which are not correlated to specimen failure, has to be taken into account. The current study presents the experimental approach for testing of NOL-rings, followed by a discussion of the localization results and the results from the pattern recognition technique as proposed by [17] in application to the experimental data.
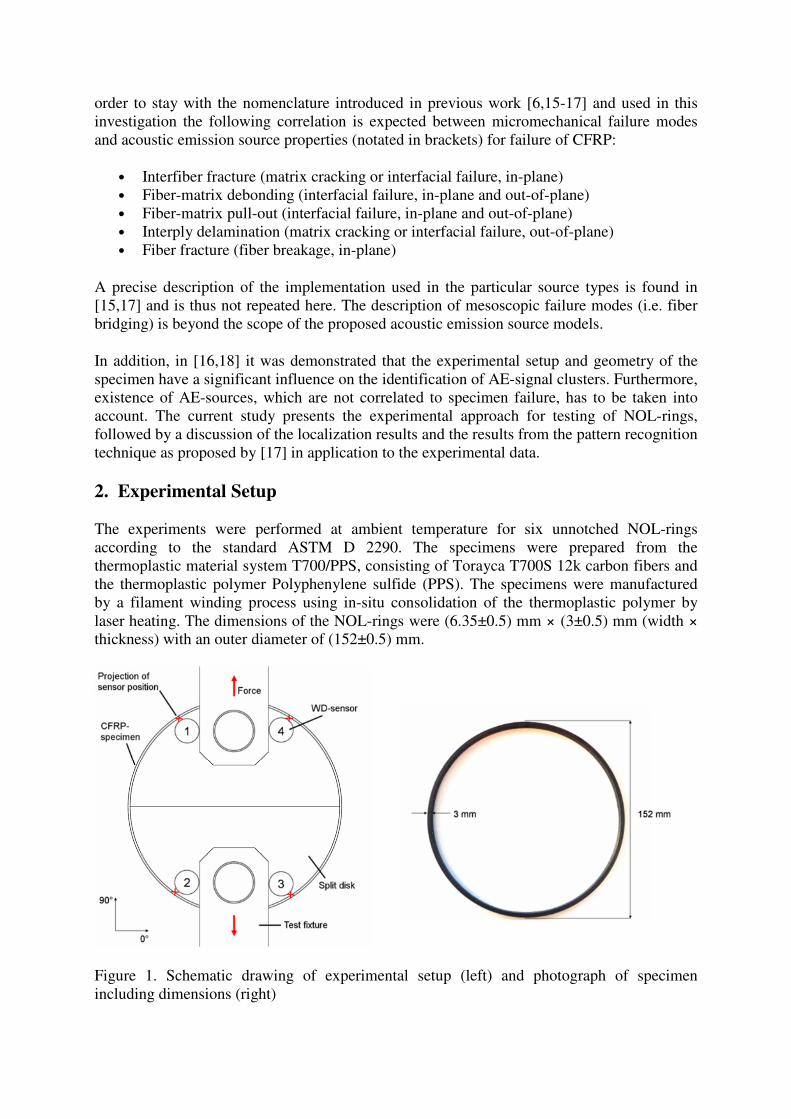
2. Experimental Setup The experiments were performed at ambient temperature for six unnotched NOL-rings according to the standard ASTM D 2290. The specimens were prepared from the thermoplastic material system T700/PPS, consisting of Torayca T700S 12k carbon fibers and the thermoplastic polymer Polyphenylene sulfide (PPS). The specimens were manufactured by a filament winding process using in-situ consolidation of the thermoplastic polymer by laser heating. The dimensions of the NOL-rings were (6.35±0.5) mm × (3±0.5) mm (width × thickness) with an outer diameter of (152±0.5) mm.
Figure 1. Schematic drawing of experimental setup (left) and photograph of specimen including dimensions (right)

A Zwick/Roell spindle-driven machine (Type Z250) was used for loading of the specimens at a displacement rate of 0.1 in/min. The force was measured using a 250 kN load cell. The tensile strength � is defined as
� = �2��.(1)
Here � is the ultimate rupture force in Newton and � and � are the thickness and width of the NOL-ring in millimeters, respectively. Acoustic emission was recorded using a Physical Acoustic PCI-2 acquisition system and the software AEwin. Threshold based trigger parameters were optimized for the respective specimen geometry to inhibit triggering of noise signals. A Peak-Definition-Time/Hit-Definition-Time/Hit-Lockout-Time of 10/80/300 µs was used at 35 dB threshold with 40 dB preamplification and a sampling rate of 10 MS/s. In addition, a band-pass filter was used ranging from 20 kHz up to 1 MHz to suppress detection of low frequency friction signals and high frequency electromagnetic noise. The signals were detected by four piezoelectric sensors of type WD which were attached using suitable clamp systems to ensure reproducible mounting pressure. To provide proper acoustic coupling, Baysilone silicone grease (Bayer Materials Science) of medium viscosity was used. The four sensors were mounted on the side surface of the split disk fixture in a rectangular arrangement as illustrated in figure 1. The acoustic emission signals caused by material failure propagate to the sensor position partially guided within the test specimen, but also radiate into the split disk fixture. Hence, compared to conventional approaches, the signals were not detected directly on the specimen surface but on the split disk fixture. To validate sensor coupling, one sensor is used as pulser 50 times while the others receive. This procedure is repeated subsequently for each of the four sensors. The amplitudes measured by two sensors mounted on the same half of the split disk were found to differ only by about 0.5 dB. Signal amplitudes detected by sensors mounted on opposite halves, were found to differ typically by 43 dB to each other. Based on a hyperbolic localization technique the acoustic emission source position was calculated. Due to the fiber orientation in the circumferential direction of the ring the acoustic emission signals were localized with an anisotropic cylinder localization scheme. That means the velocity in the circumference of the ring was set to 8000 m/s, which is close to the expected wave velocity of the fundamental order symmetric Lamb wave mode (S0) in fiber direction. Perpendicular to the fiber orientation a velocity of 200 m/s was found to be appropriate for valid source localization. Within this approach virtual sensor positions were chosen to be located at the edge of the split disc fixture as marked in figure 1. Signals erroneously localized at the virtual sensor positions were excluded from the investigation. To visualize the localization results, density diagrams calculated by the software DensityVille were used [19]. The pseudo-colour range indicates the density of acoustic emission source positions at a certain position from low (blue) to high (red). For analysis by pattern recognition, only signals which could be localized were taken into account. To this end, data selection and preprocessing steps like feature extraction and pattern recognition were performed with the software package Noesis.
3. Methods
3.1 Acoustic emission source localization In the chosen experimental configuration acoustic emission can originate from material failure or friction at the interface between NOL-ring and split disk fixture as well as internal friction. Since all of the specimens investigated show macroscopic failure by spiral burst or explosion

burst of the NOL-rings, matrix cracking, interface failure and fiber breakage are expected to be dominating sources of acoustic emission. Hyperbolic localization of acoustic emission source positions is an important concept for interpretation of acoustic emission signals, because then acoustic emission events can be correlated with microscopic observations. For the current specimen geometry, the recorded signals were localized using one group of four sensors. To evaluate the performance of the localization method, pencil lead fracture tests on distinct positions between 90° and 270° were performed (s. figure 2). It could be shown that pencil lead fracture positions are in acceptable agreement with the calculated source positions. The average localization error of the pencil lead fracture positions was found to be 6.7 mm with standard deviation 2.4 mm. Figure 2. Red dots show localization results of acoustic emission signals in comparison to pencil lead fracture test positions 3.2 Application of pattern recognition method
Acoustic emission signals are not only influenced by the source type, but also by attenuation, dispersion and the source position within the specimen [16,20]. Due to these numerous factors of influence, the identification of different acoustic emission signal types by single feature analysis is often not feasible or error-prone. A suitable alternative are parameter based pattern recognition techniques, which are based on a multitude of features. The methodology applied in this investigation is based on the approach proposed by Sause et al. [17]. It is a generalization of the unsupervised pattern recognition technique of Anastassopoulos et al. [21] combined with a two-stage voting scheme after Günter et al. [22]. This ensures that natural clusters of the entirety of acoustic emission signals are identified automatically with a minimum of initial assumptions concerning the cluster structure. First of all, an educated preselection of promising signal features is performed. The extracted features for this investigation are listed in table 1 and are obtained from the first 100 µs after arrival of the S0-mode. Subsequent to feature extraction, the total number of feature combinations � was determined with = 5 minimum and � = 10 totally selected features:
� = � �����
���= 638(2)
For each combination all features were normalized to their unit variance. Then, in the first step of the pattern recognition process the respective partitions for 2, 3, 4,..., 10 clusters are calculated utilizing the k-means algorithm with Euclidean distance measure. To assess the partitions quality, the Tou-index �, the Davies-Bouldin-index �, Rousseeuw’s silhouette value � and Hubert’s Gamma statistic � were calculated as cluster validity indices. The voting scheme of Günter et al. [22] was applied for evaluation of the numerical performance of each

partition. For each cluster validity index, the number of cluster with best index performance was given 10 points, for the second-best 9 and so forth. Finally all points for each number of clusters were accumulated and their global maximum in points was evaluated. As second step of the pattern recognition process, the feature combination with the best global performance was determined in a second voting scheme as described by Sause et al. in [17]. Table 1. Definition of acoustic emission signal features used for pattern recognition
method
Feature Definition Unit Peak Frequency !"#$: frequency of maximum frequency intensity Hz
Frequency Centroid %"&'(. =) ∙ +,( )- )+,( )- �.�ℎ+,( ): 1123 +(�)⁄
Weighted Peak Frequency
⟨ !"#$⟩ = 7 !"#$ ∙ %"&'(. Hz
Average Frequency ⟨ ⟩ = �89 �89⁄ �89: number of signal threshold crossings �89 : time between first and last threshold crossing
Hz
Reverberation Frequency (": = (�89 −�!"#$) (�89⁄ − �!"#$) �!"#$: number of signal threshold crossings till �!"#$ �!"#$ : time of maximum signal voltage
Hz
Initiation Frequency <&<' = �!"#$ �!"#$⁄ Hz
Partial Power 1-4
) +,=>?>@ ( )- ) +,=>ABC
>DEFGE ( )- H
Partial Power 1: I = 0kHz; = = 150kHz Partial Power 2: I = 150kHz; = = 300kHz Partial Power 3: I = 300kHz; = = 450kHz Partial Power 4: I = 450kHz; = = 1200kHz
%
To find a feature combination suitable to cluster all experimental datasets, the data of all specimens were merged, resulting in a total number of 25049 objects. The algorithm introduced was then applied to 10 random subsets of 1000 objects. It turned out that the optimal feature combination for clustering of the AE-signals results in 2 natural clusters with the feature combination listed in table 2. In figure 3-a the diagram of two selected features (Partial Power 2 over Weighted Peak Frequency) shows the cluster structure after this step. The two clusters are well separated from each other. However, in the region below 450 kHz Weighted Peak-Frequency, it appears, that two clusters exist. They were attributed to the occurrence of matrix cracking and interface failure in previous work [6,16-18]. Initially, these clusters were not identified by the proposed method, since the signal cluster attributed to fiber breakage seems to dominate the classification process. In a second attempt, the dataset was reduced to 19921 objects by omitting the signals of the cluster attributed to fiber breakage. The algorithm was then applied once more to this new dataset choosing 10 random subsets of 2000 objects. This step yields 2 clusters for the optimal feature combination as listed in table 2. In combination with the signals omitted in the second step, the final partition appears as shown in figure 3-b. In order to obtain the contribution of particular failure mechanisms for each specimen, the same approach was subsequently applied to each of the experimental datasets.

Table 2. Optimal feature combination for clustering of AE-signals from NOL-rings
Figure 3. Result of the first separation step (a) and second separation step (b) of the pattern recognition method for one representative specimen shown as diagram of Partial Power 2 over Weighted Peak Frequency
4. Results and Discussion 4.1 Static loading
To analyse weak-spots within the specimen, the localized source positions can be used. The density diagram shown in figure 4 visualizes the localized source positions of one representative specimen until load levels of σ ≤ 13%, σ ≤ 30% and σ ≤ 42% with respect to the rupture stress (2200 MPa). The split disk and test fixture are marked in white. Only few signals are localized at 90° and 270° positions. In contrast, numerous signals are localized at 45°, 135°, 225° and 315° positions. In this region the specimen is subject to combined compressive and tensile forces. The initial acoustic emission sources originate from these regions and grow in intensity with increased stress level as seen from figure 4. Here, all sorts of microscopic failure mechanisms are expected. At the 0° and 180° positions the ring is not supported and the specimen experiences almost solely tensile forces with intense stress concentration occurring at the contact position between specimen and split disk. Ultimately, the fibers cannot withstand the applied load at this position and the specimen bursts at the 0° and 180° position of the ring.
Clusters Optimal feature combination First separation 2 Peak Frequency
Weighted Peak Frequency Average Frequency Partial Power 2 Partial Power 4
Second separation 2 Peak Frequency Weighted Peak Frequency Frequency Centroid Partial Power 1 Partial Power 2
(a) (b)

Figure 4. Density diagrams of localized source positions in NOL-ring at increasing load levels of σ ≤ 13%, σ ≤ 30% and σ ≤ 42% with respect to the rupture stress All of the specimens investigated show saturation of signal activity with increasing load level before burst, i.e. the accumulated number of signals does not increase further. If the load level is kept constant at 74% of the burst load, stress-relaxation occurs, which causes instant acoustic emission. The saturation effect has been reported by various authors. In contrast to this investigation they found additional contributions of signal activity near ultimate failure of the specimen [23-25]. To further investigate the saturation of acoustic emission activity cyclic loading steps of NOL-ring and scanning electron microscopy were applied. Figure 5-a shows a scanning electron microscopy image of an unloaded NOL-ring. Fibers partially covered by matrix appear as dark gray vertical lines, matrix rich regions exhibit a lighter gray. The reason for the irregular distribution of fibers close to the surface is the distribution of fibers within the prepreg and the filament winding process using in-situ consolidation of the thermoplastic polymer by laser heating. Figure 5-b shows a specimen loaded until saturation of AE-signals occurs. Here fundamental differences are observed in the surface structure. Single carbon fiber filaments breakage and inter-fiber matrix cracks can be observed. Figure 5. Top view scanning electron microscopy images of unloaded NOL-ring (a) and NOL-ring loaded until saturation of AE signals (b)
(a) (b)

4.2 Cyclic loading Cyclic loading was performed using the same experimental setup as before. The specimen was loaded up to 70% of the static rupture stress at which AE-signal saturation is reached (s. figure 6) and then unloaded within a short time interval (curve not included in figure 6). This step of loading and unloading was repeated twice using the same specimen. The accumulated number of signals for the second and the third loading cycle increases continuously in contrast to the signal saturation observed in the first loading cycle. Separation of signals can be achieved by application of pattern recognition using the feature combinations listed in table 2. For the first loading cycle three clusters are obtained which can be attributed to different failure mechanisms. Significant signal contribution originates from matrix cracking followed by interface failure. A smaller contribution is found for signals generated by fiber breakage. The late onset of fiber breakage in the second cycle indicates, that this mechanism is subject to the felicity effect from first to second load cycle with a felicity ratio of 0.76. During unloading of the NOL-ring the introduced cracks close and partially jam.
Figure 6. Force-Time curve shows sequence of three loading cycles of specimen in comparison to temporal evolution of accumulated number of signals separated into contributions from matrix cracking, interface failure and fiber breakage
The average amplitude per signal is calculated as sum of all absolute amplitudes within one class and divided by the number of signals from this class. The average amplitude per fiber breakage signal for first loading (32 mV) is significant lower than for the second (39 mV) and third (39 mV) loading cycle. Typically carbon fibers show a Weibull like tensile strength distribution [26]. In subsequent loading cycles signals identified as fiber breakage have to originate predominantly from stronger filaments, since weak filaments have already failed during the initial loading cycle. This is supported by the felicity ratio of 0.76 reported above. A direct correlation between the mechanical energy release of the filament and the signal amplitude is expected. In contrast, the values for average amplitude per matrix cracking signal is lower for the second (20 mV) and the third (20 mV) load cycle compared to the first load

cycle (28 mV). Here, re-opening of existing crack faces is expected to cause acoustic emission signals with lower amplitude than the initiation of cracks. The average amplitude per interface signal shows no significant change during subsequent cycles. Acoustic emission source localization results are plotted in figure 7 as density diagrams. These show one complete loading or unloading cycle with its localized source positions, respectively. The first diagram represents the accumulated source positions for the first loading cycle with signals at 45°, 135° and 225°. These acoustic emission signals are due to initiation of inter-fiber matrix cracks and fiber breakage. This interpretation is consistent with scanning electron microscopy imaging (s. figure 5-b). Only few signals are localized at 315°. During unloading of the specimen (s. figure 7-b) acoustic emission is localized at similar positions as for loading, probably due to jamming crack faces. Density diagrams of localized source positions after the second (s. figure 7-c) and the third (s. figure 7-d) cyclic loading step show similar localization patterns like the first cycle. However, increased density of AE-sources is observed, which originates from re-opening of crack faces and additional occurrence of single filament breakage and inter-fiber cracks.
Figure 7. Density diagrams of localized source positions in NOL-ring after first cyclic loading step (a), during unloading (b), after second (c) and third (d) cyclic loading step
(a) (b)
(c) (d)

5. Conclusion Acoustic emission signals were acquired during loading of carbon fiber reinforced plastic NOL-ring specimens using a self-aligning split disk test fixture. In order to record acoustic emission signals four broadband sensors were mounted on the split disk. It was demonstrated, that localization of acoustic emission source positions was possible without placing the sensors directly on the specimen surface. The analysis of the localization results was used to detect areas of high acoustic emission activity and to assess the evolution of failure in the NOL-ring. Using scanning electron microscopy and cyclic loading steps, the origin for saturation of acoustic emission in static loading was investigated. It was shown that most signals occur at the 45°, 135°, 225° and 315° positions during static loading. Using pattern recognition techniques, cluster structures similar to those obtained in tensile and flexural testing of CFRP were found. Differences in the frequency spectra were identified by analysis of the extracted features, which yields three distinguishable types of AE-signals for all specimens investigated. Based on conclusions of previous investigations those are attributed to different failure mechanisms, namely matrix cracking, interface failure and fiber breakage. Those failure mechanisms were quantified as a function of loading to analyse their evolution. In summary, using the presented combination of source localization and source identification a better understanding of the evolution of failure for NOL-rings was achieved.
Acknowledgments
We thank Florian Henne from the Chair for Carbon Composites (LCC) of the Technical University Munich for providing the specimens used in this investigation and the Free State of Bavaria for providing funding within the program “BayernFIT”.
References
1. W Haselbach and B. Lauke, 'Acoustic emission of debonding between fibre and matrix
to evaluate local adhesion', Composites Science and Technology, Vol 63, No 15, pp 2155-2162, 2003.
2. C R Ramirez-Jimenez, N Papadakis, N Reynolds, T Gan, P Purnell and M Pharaoh, 'Identification of failure modes in glass/polypropylene composites by means of the primary frequency content of the acoustic emission event', Composites Science and Technology, Vol 64, pp 1819-1827, 2004.
3. S Huguet, N Godin, R Gaertner, L Salmon and D Villard, 'Use of acoustic emission to identify damage modes in glass fibre reinforced polyester', Composites Science and Technology, Vol 62, pp 1433-1444, 2002.
4. M Giordano, A Calabro, C Esposito, A D'Amore and L Nicolais, 'An acoustic-emission characterization of the failure modes in polymer-composite materials', Composites Science and Technology, Vol 58, pp 1923-1928, 1998.
5. J J Scholey, P D Wilcox, C K Lee, M I Friswell and M R Wisnom, 'Acoustic Emission in Wide Composite Specimens', Advanced Materials Research, Vol 13-14, pp 325-332, 2006.

6. M G R Sause, T Müller, A Horoschenkoff and S Horn, 'Quantification of failure mechanisms in mode-I loading of fiber reinforced plastics utilizing acoustic emission analysis', Composite Science and Technology, Vol 72, pp 167-174, 2012.
7. J Bohse, 'Acoustic emission characteristics of micro-failure processes in polymer blends and composites', Composites Science and Technology, Vol 60, pp 1213-1226, 2000.
8. J Bohse, 'Acoustic Emission Examination of Polymer-Matrix Composites', Journal of Acoustic Emission, Vol 22, pp 208-223, 2004.
9. M Eaton, K Holford, C Featherston and R Pullin, 'Damage in Carbon Fibre Composites: The Discrimination of Acoustic Emission Signals Using Frequency', Journal of Acoustic Emission, Vol 25, pp 140-148, 2007.
10. X Li, C Ramirez, E L Hines, M S Leeson, P Purnell and M Pharaoh, 'Pattern Recognition of Fiber-reinforced Plastic Failure Mechanism using Computational Intelligence Techniques', Neural Networks, pp 2340-2345, IEEE World Congress on Computational Intelligence, 2008.
11. V Kostopoulos, P Karapappas, T Loutas, A Vavouliotis, A Paipetis and P Tsotra, 'Interlaminar Fracture Toughness of Carbon Fibre-Reinforced Polymer Laminates with Nano- and Micro-Fillers', Strain, Vol 47, pp 269-282, 2011.
12. A Marec, J H Thomas and R Guerjouma, 'Damage characterization of polymer-based composite materials: Multivariable analysis and wavelet transform for clustering acoustic emission data', Mechanical Systems and Signal Processing, Vol 22, pp 1441-1464, 2008.
13. T Philippidis, V Nikolaidis and A Anastassopoulos, 'Damage Characterisation of C/C laminates using Neural Network Techniques on AE signals', NDT&E International, Vol 31, pp 329-340, 1998.
14. N Ativitavas, T Pothisiri and T J Fowler, 'Identification of Fiber-reinforced Plastic Failure Mechanisms from Acoustic Emission Data using Neural Networks', Journal of Composite Materials, Vol 40, No 3, pp 193-226, 2006.
15. M G R Sause and S Horn, 'Simulation of acoustic emission in planar carbon fiber reinforced plastic specimens', Journal of Nondestructive Evaluation, Vol 29, No 2, pp 123-142, 2010.
16. M G R Sause, 'Identification of failure mechanisms in hybrid materials utilizing pattern recognition techniques applied to acoustic emission signals', PhD-Thesis, mbv-Verlag, Berlin, 2010.
17. M G R Sause, A Gribov, A R Unwin and S Horn, 'Pattern recognition approach to identify natural clusters of acoustic emission signals', Pattern Recognition Letters, Vol 33, No 1, pp 17-23, 2012.
18. M G R Sause and S Horn, 'Influence of Specimen Geometry on Acoustic Emission Signals in Fiber Reinforced Composites: FEM-Simulations and Experiments', 29th European Conference on Acoustic Emission Testing, Vienna, Austria, 2010.
19. W Skopalik, M G R Sause, Density Ville Rev. 0.99. University of Augsburg, http: //www.physik.uni-augsburg.de/exp2/downloads.de.shtml, 2009.
20. M G R Sause and S Horn, 'Simulation of Lamb Wave Excitation for Different Elastic Properties and Acoustic Emission Source Geometries', Journal of Acoustic Emission 28, pp 109-121, 2010.
21. A A Anastassopoulos and T P Philippidis, 'Clustering Methodology for the Evaluation of Acoustic Emission from Composites', Journal of Acoustic Emission, Vol 13, pp 11-21, 1995.
22. S Günter and H Bunke, 'Validation indices for graph clustering', Pattern Recognition Letters, Vol 24, pp 1107-1113, 2003.
23. M A Hamstad, 'A Review: Acoustic Emission, a Tool for Composite-Materials Studies', Experimental Mechanics, Springer Boston, Vol 26, pp 7-13, 1986.
24. M A Hamstad and T T Chiao, 'A physical mechanism for the early acoustic emission in an organic-fiber/epoxy pressure vessel', SAMPE Quarterly, Vol 5, No 2, January 1974.
25. M A Hamstad, 'Correlation of Residual Strength with Acoustic Emission from Impact-Damaged Composite Structures under Constant Biaxial Load', J. Composite Materials, Vol 26, No 15, 1992.
26. T Tanaka, H Nakayama, A Sakaida and N Horikawa, 'Estimation of Tensile Strength Distribution for Carbon Fiber with Diameter Variation Along Fiber', Materials Science Research International, Vol 5, No 2, pp 90-70, 1999.