Factor Analysis Istijanto MM, MCom. Definition Factor analysis Data reduction technique and...
17
Factor Analysis Istijanto MM, MCom
-
Upload
rachel-short -
Category
Documents
-
view
215 -
download
0
Transcript of Factor Analysis Istijanto MM, MCom. Definition Factor analysis Data reduction technique and...
Factor Analysis
Istijanto MM, MCom

Definition
Factor analysis
Data reduction technique and summarization
Identifying the underlying factors/ dimensions
Based on interdependence relationships
Example:
Store image consists of six dimensions (article: “The alternative modes of measuring store image”)

StatisticsBartlett’s test of sphericity to test H0 that the variables are uncorrelated
Correlation matrix the correlation between all possible pairs of variables included in analysis
Eigenvalue total variance explained by each factor
Factor loadings correlation between the variables and the factors
Kaiser-Meyer-Olkin measure of sampling adequacy

Conducting Factor AnalysisFig. 19.3
Construction of the Correlation Matrix
Method of Factor Analysis
Determination of Number of Factors
Determination of Model Fit
Problem Formulation
Calculation ofFactor Scores
Interpretation of Factors
Rotation of Factors
Selection ofSurrogate Variables
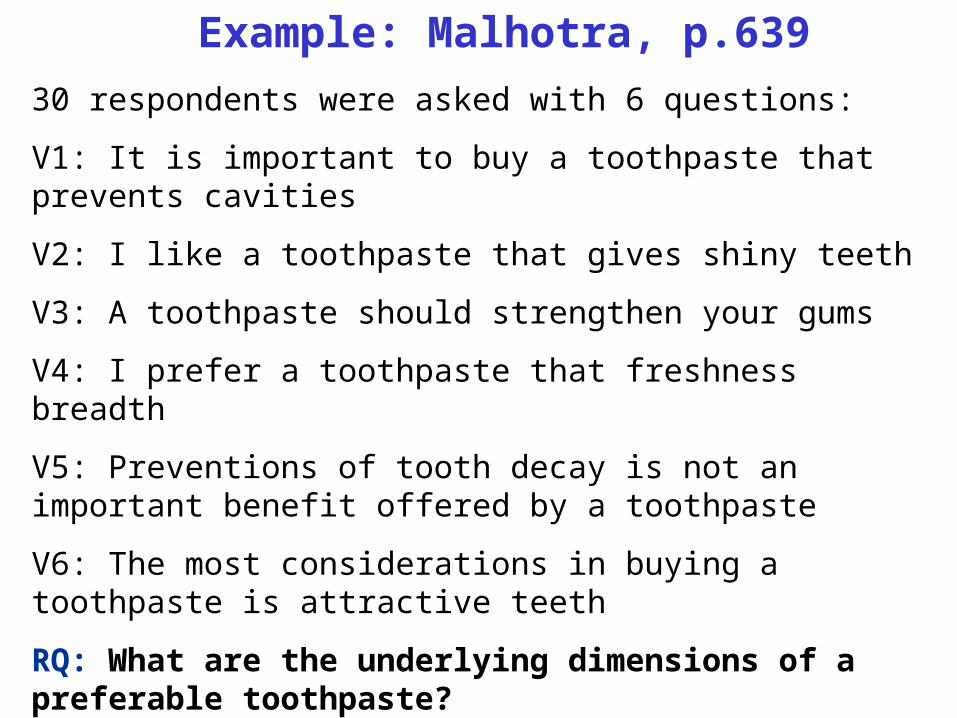
Example: Malhotra, p.639
30 respondents were asked with 6 questions:
V1: It is important to buy a toothpaste that prevents cavities
V2: I like a toothpaste that gives shiny teeth
V3: A toothpaste should strengthen your gums
V4: I prefer a toothpaste that freshness breadth
V5: Preventions of tooth decay is not an important benefit offered by a toothpaste
V6: The most considerations in buying a toothpaste is attractive teeth
RQ: What are the underlying dimensions of a preferable toothpaste?
Using a seven-point scale (1=STS, 7=SS)

Procedures
Construct correlation matrix
Prerequisites:
Correlation matrix between variables: must be correlated
Barlett test of sphericity, H0: variables are uncorrelated, should be rejected
KMO, measure sampling adequacy, should be > 0,5
Method of factor analysis
Principal component analysis the total variance in the data is considered. (recommended)
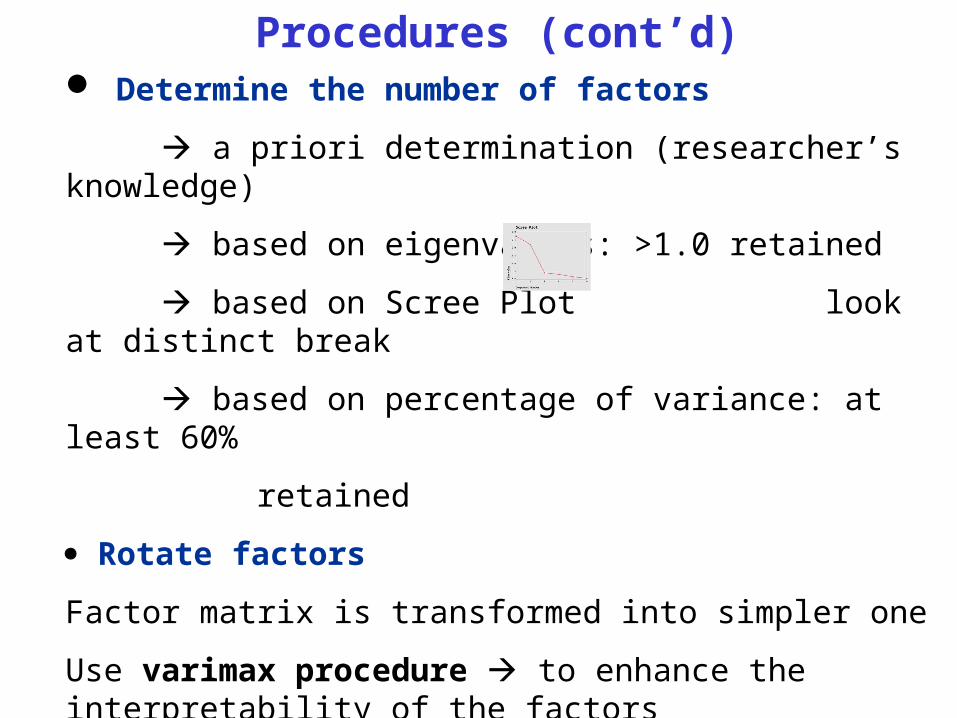
Procedures (cont’d) Determine the number of factors
a priori determination (researcher’s knowledge)
based on eigenvalues: >1.0 retained
based on Scree Plot look at distinct break
based on percentage of variance: at least 60%
retained
Rotate factors
Factor matrix is transformed into simpler one
Use varimax procedure to enhance the interpretability of the factors
Intepret factor

Example: Malhotra, p.563
30 respondents were asked with 6 questions:
V1: It is important to buy a toothpaste that prevents cavities
V2: I like a toothpaste that gives shiny teeth
V3: A toothpaste should strengthen your gums
V4: I prefer a toothpaste that freshness breadth
V5: Preventions of tooth decay is not an important benefit offered by a toothpaste
V6: The most considerations in buying a toothpaste is attractive teeth
RQ: What are the underlying dimensions of a preferable toothpaste?
Using a seven-point scale (1=STS, 7=SS)

Conducting Factor AnalysisRESPONDENT
NUMBER V1 V2 V3 V4 V5 V61 7.00 3.00 6.00 4.00 2.00 4.002 1.00 3.00 2.00 4.00 5.00 4.003 6.00 2.00 7.00 4.00 1.00 3.004 4.00 5.00 4.00 6.00 2.00 5.005 1.00 2.00 2.00 3.00 6.00 2.006 6.00 3.00 6.00 4.00 2.00 4.007 5.00 3.00 6.00 3.00 4.00 3.008 6.00 4.00 7.00 4.00 1.00 4.009 3.00 4.00 2.00 3.00 6.00 3.00
10 2.00 6.00 2.00 6.00 7.00 6.0011 6.00 4.00 7.00 3.00 2.00 3.0012 2.00 3.00 1.00 4.00 5.00 4.0013 7.00 2.00 6.00 4.00 1.00 3.0014 4.00 6.00 4.00 5.00 3.00 6.0015 1.00 3.00 2.00 2.00 6.00 4.0016 6.00 4.00 6.00 3.00 3.00 4.0017 5.00 3.00 6.00 3.00 3.00 4.0018 7.00 3.00 7.00 4.00 1.00 4.0019 2.00 4.00 3.00 3.00 6.00 3.0020 3.00 5.00 3.00 6.00 4.00 6.0021 1.00 3.00 2.00 3.00 5.00 3.0022 5.00 4.00 5.00 4.00 2.00 4.0023 2.00 2.00 1.00 5.00 4.00 4.0024 4.00 6.00 4.00 6.00 4.00 7.0025 6.00 5.00 4.00 2.00 1.00 4.0026 3.00 5.00 4.00 6.00 4.00 7.0027 4.00 4.00 7.00 2.00 2.00 5.0028 3.00 7.00 2.00 6.00 4.00 3.0029 4.00 6.00 3.00 7.00 2.00 7.0030 2.00 3.00 2.00 4.00 7.00 2.00
Table 19.1

Correlation Matrix
1.000 -.053 .873 -.086 -.858 .004
-.053 1.000 -.155 .572 .020 .640
.873 -.155 1.000 -.248 -.778 -.018
-.086 .572 -.248 1.000 -.007 .640
-.858 .020 -.778 -.007 1.000 -.136
.004 .640 -.018 .640 -.136 1.000
V1
V2
V3
V4
V5
V6
CorrelationV1 V2 V3 V4 V5 V6
Construct correlation matrix
KMO and Bartlett's Test
.660
111.314
15
.000
Kaiser-Meyer-Olkin Measure of SamplingAdequacy.
Approx. Chi-Square
df
Sig.
Bartlett's Test ofSphericity
> 0.5
Ho tolak

Method of Factor analysisCommunalities
1.000 .926
1.000 .723
1.000 .894
1.000 .739
1.000 .878
1.000 .790
V1
V2
V3
V4
V5
V6
Initial Extraction
Extraction Method: Principal Component Analysis.Total Variance Explained
2.731 45.520 45.520 2.731
2.218 36.969 82.488 2.218
.442 7.360 89.848
.341 5.688 95.536
.183 3.044 98.580
8.521E-02 1.420 100.000
Component1
2
3
4
5
6
Total % of Variance Cumulative % Total
Initial Eigenvalues Extraction Sums of Squared Loadings
Extraction Method: Principal Component Analysis.

Determine the number of factorsTotal Variance Explained
2.731 45.520 45.520 2.731
2.218 36.969 82.488 2.218
.442 7.360 89.848
.341 5.688 95.536
.183 3.044 98.580
8.521E-02 1.420 100.000
Component1
2
3
4
5
6
Total % of Variance Cumulative % Total
Initial Eigenvalues Extraction Sums of Squared Loadings
Extraction Method: Principal Component Analysis.
retained

Rotate factorsComponent Matrixa
.928 .253
-.301 .795
.936 .131
-.342 .789
-.869 -.351
-.177 .871
V1
V2
V3
V4
V5
V6
1 2
Component
Extraction Method: Principal Component Analysis.
2 components extracted.a.
Rotated Component Matrixa
.962 -2.66E-02
-5.72E-02 .848
.934 -.146
-9.83E-02 .854
-.933 -8.40E-02
8.337E-02 .885
V1
V2
V3
V4
V5
V6
1 2
Component
Extraction Method: Principal Component Analysis. Rotation Method: Varimax with Kaiser Normalization.
Rotation converged in 3 iterations.a.
Sometimes, difficult to interpret
Easier and simpler to interpret

Interpret factors
Component Plot in Rotated Space
Component 1
1.0.50.0-.5-1.0
Co
mp
on
en
t 2
1.0
.5
0.0
-.5
-1.0
v6
v5
v4
v3
v2
v1
Factor 1: V1, V3, V5 health benefit factor/ dimension
Factor 2: V2, V4, V6 social benefit factor/ dimension

SPSS Workshops
Open file: table 19-1.sav

SPSS Workshops
Menu: Analyze Data Reduction Factor

SPSS Workshops
Move the variables