Business Research Methods - Mcom & Mcom CA
56
BUSINESS RESEARCH METHODS Unit – I 1. Business Research Methods Meaning 2. Scope and significance 3. Utility of business research 4. Qualities of good researcher 5. Types of Research 6. Research Process 7. Identification, Selection and formulation of Research Problem 8. Hypothesis 9. Research Design INTRODUCTION AND MEANING Research in common parlance refers to a search for knowledge. Once can also define research as a scientific and systematic search for pertinent information on a specific topic. In fact, research is an art of scientific investigation. The Advanced Learner’s Dictionary of Current English lays down the meaning of research as “a careful investigation or inquiry specially through search for new facts in any branch of knowledge.” Redman and Mory define research as a “systematized effort to gain new knowledge.” OBJECTIVES OF RESEARCH The purpose of research is to discover answers to questions through the application of scientific procedures. The main aim of research is to find out the truth which is hidden and which has not been discovered as yet. Though each research study has its own specific purpose, we may think of research objectives as falling into a number of following broad groupings: 1. To gain familiarity with a phenomenon or to achieve new insights into it (studies with this object in view are termed as exploratory or formulative research studies); 2. To portray accurately the characteristics of a particular individual, situation or a group (studies with this object in view are known as descriptive research studies); 3. To determine the frequency with which something occurs or with which it is associated with something else (studies with this 1
-
Upload
sengottu-vel -
Category
Documents
-
view
301 -
download
3
description
Research Methods notes for M.Com and M.Com CA
Transcript of Business Research Methods - Mcom & Mcom CA
BUSINESS RESEARCH METHODS
Unit – I1. Business Research Methods Meaning
2. Scope and significance
3. Utility of business research
4. Qualities of good researcher
5. Types of Research
6. Research Process
7. Identification, Selection and formulation of Research Problem
8. Hypothesis
9. Research Design
INTRODUCTION AND MEANING
Research in common parlance refers to a search for knowledge. Once can also define research as a
scientific and systematic search for pertinent information on a specific topic. In fact, research is an art
of scientific investigation. The Advanced Learner’s Dictionary of Current English lays down the meaning
of research as “a careful investigation or inquiry specially through search for new facts in any branch of
knowledge.” Redman and Mory define research as a “systematized effort to gain new knowledge.”
OBJECTIVES OF RESEARCH
The purpose of research is to discover answers to questions through the application of scientific procedures. The main aim of research is to find out the truth which is hidden and which has not been discovered as yet. Though each research study has its own specific purpose, we may think of research objectives as falling into a number of following broad groupings:
1. To gain familiarity with a phenomenon or to achieve new insights into it (studies with this object in view are termed as exploratory or formulative research studies);
2. To portray accurately the characteristics of a particular individual, situation or a group (studies with this object in view are known as descriptive research studies);
3. To determine the frequency with which something occurs or with which it is associated with something else (studies with this object in view are known as diagnostic research studies);
4. To test a hypothesis of a causal relationship between variables (such studies are known as hypothesis-testing research studies).
TYPES OF RESEARCH
The basic types of research are as follows:
(i) Descriptive vs. Analytical: Descriptive research includes surveys and fact-finding enquiries of different kinds. Example, frequency of shopping, preferences of people, or similar data. In analytical research, on the other hand, the researcher has to use facts or information already available, and analyse these to make a critical evaluation of the material.
(ii) Applied vs. Fundamental: Research can either be applied (or action) research or fundamental (to basic or pure) research. Applied research aims at finding a solution for an immediate problem facing a society or an industrial/business organisation, whereas fundamental research is mainly concerned with generalisations and with the formulation of a theory.
1
(iii) Quantitative vs. Qualitative: Quantitative research is based on the measurement of quantity or amount. It is applicable to phenomena that can be expressed in terms of quantity. Qualitative research, on the other hand, is concerned with qualitative phenomenon, i.e., phenomena relating to or involving quality or kind.
(iv) Conceptual vs. Empirical: Conceptual research is that related to some abstract idea(s) or theory. It is generally used by philosophers and thinkers to develop new concepts or to reinterpret existing ones. On the other hand, empirical research relies on experience or observation alone, often without due regard for system and theory. It is data-based research, coming up with conclusions which are capable of being verified by observation or experiment.
(iv) Some Other Types of Research: i. One-time research or longitudinal research.
ii. Field-setting research or laboratory research iii. Clinical or diagnostic research. iv. Exploratory v. Historical research
vi. Conclusion-oriented and decision-oriented.
SIGNIFICANCE OF RESEARCH
“All progress is born of inquiry. Doubt is often better than overconfidence, for it leads to inquiry, and inquiry leads to invention” is a famous Hudson Maxim in context of which the significance of research can well be understood.
Increased amounts of research make progress possible. Research inculcates scientific and inductive thinking and it promotes the development of logical habits of thinking and organisation.
The role of research in several fields of applied economics, whether related to business or to the economy as a whole, has greatly increased in modern times.
The increasingly complex nature of business and government has focused attention on the use of research in solving operational problems. Research, as an aid to economic policy, has gained added importance, both for government and business.
Research provides the basis for nearly all government policies in our economic system.
In the context of government, research as a tool to economic policy has three distinct phases of operation, viz.,
(i) Investigation of economic structure through continual compilation of facts; (ii) Diagnosis of events that are taking place and the analysis of the forces underlying them; and (iii) The prognosis, i.e., the prediction of future developments.
Research has its special significance in solving various operational and planning problems of business and industry. Research is equally important for social scientists in studying social relationships and in seeking answers to various social problems.
In addition to what has been stated above, the significance of research can also be understood keeping in view the following points:
(a) To those students who are to write a master’s or Ph.D. thesis, research may mean a careerism or a way to attain a high position in the social structure;
(b) To professionals in research methodology, research may mean a source of livelihood; (c) To philosophers and thinkers, research may mean the outlet for new ideas and insights;
(d) To literary men and women, research may mean the development of new styles and creative work; (e) To analysts and intellectuals, research may mean the generalisations of new theories.
2
Thus, research is the fountain of knowledge for the sake of knowledge and an important source of providing guidelines for solving different business, governmental and social problems.
RESEARCH PROCESS
(1) Formulating the research problem; (2) Extensive literature survey;(3) Developing the hypothesis; (4) preparing the research design; (5) Determining sample design; (6) collecting the data; (7) execution of the project; (8) Analysis of data; (9) hypothesis testing; (10) generalisations and interpretation, (11) Preparation of the report or presentation of the results,
A brief description of the above stated steps
1. Formulating the research problem: The formulation of a general topic into a specific research problem, thus, constitutes the first step in a
scientific enquiry. Essentially two steps are involved in formulating the research problem, viz., understanding the problem thoroughly, and rephrasing the same into meaningful terms from an analytical point of view.
The researcher must at the same time examine all available literature to get himself acquainted with the
selected problem. He may review two types of literature—the conceptual literature concerning the concepts
and theories, and the empirical literature consisting of studies made earlier which are similar to the one
proposed.
2. Extensive literature survey: The earlier studies, if any, which are similar to the study in hand should be carefully studied. A good library will be a great help to the researcher at this stage.
3. Development of working hypotheses: After extensive literature survey, researcher should state in clear terms the working hypothesis or hypotheses. Working hypothesis is tentative assumption made in order to draw out and test its logical or empirical consequences.
How does one go about developing working hypotheses? The answer is by using the following approach:
(a) Discussions with colleagues and experts about the problem, its origin and the objectives in seeking a solution;
(b) Examination of data and records, if available, concerning the problem for possible trends, peculiarities and other clues;
(c) Review of similar studies in the area or of the studies on similar problems; and
(d) Exploratory personal investigation which involves original field interviews on a limited scale with interested parties and individuals with a view to secure greater insight into the practical aspects of the problem.
4. Preparing the research design: To state the conceptual structure within which research would be conducted. In other words, the
function of research design is to provide for the collection of relevant evidence with minimal expenditure of effort, time and money.
Research purposes may be grouped into four categories, viz., (i) Exploration, (ii) Description, (iii) Diagnosis, and (iv) Experimentation
The preparation of the research design, appropriate for a particular research problem, involves usually the consideration of the following:
(i) The means of obtaining the information; (ii) The availability and skills of the researcher and his staff (if any);
3
(iii) Explanation of the way in which selected means of obtaining information will be organised and the reasoning leading to the selection;
(iv) The time available for research; and (v) The cost factor relating to research, i.e., the finance available for the purpose.
5. Determining sample design: All the items under consideration in any field of inquiry constitute a ‘universe’ or ‘population’. A complete enumeration of all the items in the ‘population’ is known as a census inquiry.
The researcher must decide the way of selecting a sample or what is popularly known as the sample design. In other words, a sample design is a definite plan determined before any data are actually collected for obtaining a sample from a given population.
Samples can be either probability samples or non-probability samples. With probability samples each element has a known probability of being included in the sample but the non-probability samples do not allow the researcher to determine this probability.
Probability samples are those based on simple random sampling, systematic sampling, stratified sampling, cluster/area sampling whereas non-probability samples are those based on convenience sampling, judgement sampling and quota sampling techniques. A brief mention of the important sample designs is as follows:
(i) Deliberate sampling: Deliberate sampling is also known as purposive or non-probability sampling. When population elements are selected for inclusion in the sample based on the ease of access, it can be called convenience sampling. In judgement sampling the researcher’s judgement is used for selecting items which he considers as representative of the population.
(ii) Simple random sampling: This type of sampling is also known as chance sampling or probability sampling where each and every item in the population has an equal chance of inclusion in the sample and each one of the possible samples, in case of finite universe, has the same probability of being selected.
(iii) Systematic sampling: In some instances the most practical way of sampling is to select every 15th name on a list, every 10th house on one side of a street and so on. Sampling of this type is known as systematic sampling.
(iv) The Stratified sampling: If the population from which a sample is to be drawn does not constitute a homogeneous group, then stratified sampling technique is applied so as to obtain a representative sample. In this technique, the population is stratified into a number of non-overlapping subpopulations or strata and sample items are selected from each stratum. If the items selected from each stratum is based on simple random sampling the entire procedure, first stratification and then simple random sampling, is known as stratified random sampling.
v) Quota sampling: In stratified sampling the cost of taking random samples from individual strata is often so expensive that interviewers are simply given quota to be filled from different strata, the actual selection of items for sample being left to the interviewer’s judgement.
vi)Cluster sampling and area sampling: Cluster sampling involves grouping the population and then selecting the groups or the clusters rather than individual elements for inclusion in the sample. Area sampling is quite close to cluster sampling and is often talked about when the total geographical area of interest happens to be big one. vii) Multi-stage sampling: Under multi-stage sampling the first stage may be to select large primary sampling units such as states, then districts, then towns and finally certain families within towns.viii) Sequential sampling: The ultimate size of the sample is not fixed in advance but is determined according to mathematical decisions on the basis of information yielded as survey progresses.
4
The sample design to be used must be decided by the researcher taking into consideration the nature of the inquiry and other related factors.
6. Collecting the data: Primary data can be collected either through experiment or through survey. But in the case of a survey, data can be collected by any one or more of the following ways:
(i) By observation: This method implies the collection of information by way of investigator’s own observation, without interviewing the respondents.
(ii) Through personal interview: The investigator follows a rigid procedure and seeks answers to a set of pre-conceived questions through personal interviews. This method of collecting data is usually carried out in a structured way where output depends upon the ability of the interviewer to a large extent.
(iii) Through telephone interviews: This method of collecting information involves contacting the respondents on telephone itself.
(iv) By mailing of questionnaires: The researcher and the respondents do come in contact with each other if this method of survey is adopted. Questionnaires are mailed to the respondents with a request to return after completing the same. Before applying this method, usually a Pilot Study for testing the questionnaire is conduced which reveals the weaknesses, if any, of the questionnaire.
(v) Through schedules: Under this method the enumerators are appointed and given training. They are provided with schedules containing relevant questions.
The researcher should select one of these methods of collecting the data taking into consideration the nature of investigation, objective and scope of the inquiry, finanical resources, available time and the desired degree of accuracy.
7. Execution of the project: Execution of the project is a very important step in the research process. If the execution of the project proceeds on correct lines, the data to be collected would be adequate and dependable.
8. Analysis of data: After the data have been collected, the researcher turns to the task of analysing them. Coding operation is usually done at this stage through which the categories of data are transformed into symbols that may be tabulated and counted. Editing is the procedure that improves the quality of the data for coding. With coding the stage is ready for tabulation. Tabulation is a part of the technical procedure wherein the classified data are put in the form of tables.
9. Hypothesis-testing: After analysing the data as stated above, the researcher is in a position to test the hypotheses, if any, he had formulated earlier. Do the facts support the hypotheses or they happen to be contrary? This is the usual question which should be answered while testing hypotheses. Various tests, such as Chi square test, t-test, F-test, have been developed by statisticians for the purpose. The hypotheses may be tested through the use of one or more of such tests, depending upon the nature and object of research inquiry. Hypothesis-testing will result in either accepting the hypothesis or in rejecting it.
10.Generalisations and interpretation: If a hypothesis is tested and upheld several times, it may be possible for the researcher to arrive at generalisation, i.e., to build a theory. To explain his findings on the basis of some theory it is known as interpretation.
11. Preparation of the report or the thesis: Finally, the researcher has to prepare the report of what has been done by him. Writing of report must be done with great care keeping in view the following:
1. The layout of the report should be as follows: (i) the preliminary pages; (ii) the main text, and (iii) the end matter.
In its preliminary pages the report should carry title and date followed by acknowledgements and foreword. Then there should be a table of contents followed by a list of tables and list of graphs
5
and charts, if any, given in the report.
The main text of the report should have the following parts:
(a) Introduction: It should contain a clear statement of the objective of the research and an explanation of the methodology adopted in accomplishing the research. The scope of the study along with various limitations should as well be stated in this part.
(b) Summary of findings: After introduction there would appear a statement of findings and recommendations in non-technical language. If the findings are extensive, they should be summarised.
(c) Main report: The main body of the report should be presented in logical sequence and broken-down into readily identifiable sections.
(d) Conclusion: Towards the end of the main text, researcher should again put down the results of his research clearly and precisely. In fact, it is the final summing up.
At the end of the report, appendices should be enlisted in respect of all technical data. Bibliography, i.e., list of books, journals, reports, etc., consulted, should also be given in the end. Index should also be given specially in a published research report.
2. Report should be written in a concise and objective style in simple language avoiding vague expressions such as ‘it seems,’ ‘there may be’, and the like.
3. Charts and illustrations in the main report should be used only if they present the information more clearly and forcibly.
4. Calculated ‘confidence limits’ must be mentioned and the various constraints experienced in conducting research operations may as well be stated.
CRITERIA OF GOOD RESEARCH
1. The purpose of the research should be clearly defined and common concepts be used.
2. The research procedure used should be described in sufficient detail to permit another researcher to repeat the research for further advancement, keeping the continuity of what has already been attained.
3. The procedural design of the research should be carefully planned to yield results that are as objective as possible.
4. The researcher should report with complete frankness, flaws in procedural design and estimate their effects upon the findings.
5. The analysis of data should be sufficiently adequate to reveal its significance and the methods of analysis used should be appropriate. The validity and reliability of the data should be checked carefully.
6. Conclusions should be confined to those justified by the data of the research and limited to those for which the data provide an adequate basis.
7. Greater confidence in research is warranted if the researcher is experienced, has a good reputation in research and is a person of integrity.
In other words, we can state the qualities of a good research as under:
1. Good research is systematic: It means that research is structured with specified steps to be taken in a specified sequence in accordance with the well defined set of rules.
2. Good research is logical: This implies that research is guided by the rules of logical reasoning and the logical.
3. Good research is empirical: It implies that research is related basically to one or more aspects of a real situation and deals with concrete data that provides a basis for external validity to research results.
4. Good research is replicable: This characteristic allows research results to be verified by replicating the study and thereby building a sound basis for decisions.
6
Problems Encountered by Researchers in IndiaResearchers in India, particularly those engaged in empirical research, are facing several problems. Some
of the important problems are as follows:
1. The lack of a scientific training in the methodology of research2. There is insufficient interaction between the university research departments on one side and
business establishments, government departments and research institutions on the other side.
3. Most of the business units in our country do not have the confidence that the material supplied by them to researchers will not be misused and as such they are often reluctant in supplying the needed information to researchers.
4. Research studies overlapping one another are undertaken quite often for want of adequate information.
5. There does not exist a code of conduct for researchers 6. Many researchers in our country also face the difficulty of adequate and timely secretarial assistance,
including computerial assistance.
7. Library management and functioning is not satisfactory at many places and much of the time and energy of researchers are spent in tracing out the books, journals, reports, etc., rather than in tracing out relevant material from them.
8. There is also the problem that many of our libraries are not able to get copies of old and new Acts/Rules, reports and other government publications in time.
9. There is also the difficulty of timely availability of published data from various government and other agencies doing this job in our country.
DEFINING THE RESEARCH PROBLEMIn research process, the first and foremost step happens to be that of selecting and properly defining a
research problem. A researcher must find the problem and formulate it so that it becomes susceptible to research. Like a medical doctor, a researcher must examine all the symptoms concerning a problem before he can diagnose correctly. To define a problem correctly, a researcher must know: what a problem is?
What is a research problem?A research problem, in general, refers to some difficulty which a researcher experiences in the
context of either a theoretical or practical situation and wants to obtain a solution for the same.
The components1 of a research problem as under:
(i) There must be an individual or a group which has some difficulty or the problem.
(ii) There must be some objective(s) to be attained at. If one wants nothing, one cannot have a problem.
(iii) There must be alternative means (or the courses of action) for obtaining the objective(s) one wishes to attain. This means that there must be at least two means available to a researcher for if he has no choice of means, he cannot have a problem.
(iv) There must remain some doubt in the mind of a researcher with regard to the selection of alternatives. This means that research must answer the question concerning the relative efficiency of the possible alternatives.
Thus, a research problem is one which requires a researcher to find out the best solution for the given problem, i.e., to find out by which course of action the objective can be attained optimally in the context of a given environment.
SELECTING THE PROBLEM
The research problem undertaken for study must be carefully selected. The task is a difficult one, although it may not appear to be so. Help may be taken from a research guide in this connection.
7
Nevertheless, every researcher must find out his own salvation for research problems cannot be borrowed.
The following points may be observed by a researcher in selecting a research problem
(i) Subject which is overdone should not be normally chosen, for it will be a difficult task to throw any new light in such a case.
(ii) Controversial subject should not become the choice of an average researcher. (iii) Too narrow or too vague problems should be avoided.
(iv) The subject selected for research should be familiar and feasible
(v) The importance of the subject, the qualifications and the training of a researcher, the costs involved, the time factor are few other criteria that must also be considered in selecting a problem. (a) Whether he is well equipped in terms of his background to carry out the research? (b) Whether the study falls within the budget he can afford?
(c) Whether the necessary cooperation can be obtained from those who must participate in research as subjects?
(vi) The selection of a problem must be preceded by a preliminary study.
TECHNIQUE INVOLVED IN DEFINING A PROBLEM
Defining a research problem properly and clearly is a crucial part of a research study and must in no case be accomplished hurriedly. However, in practice this a frequently overlooked which causes a lot of problems later on. Hence, the research problem should be defined in a systematic manner, giving due weightage to all relating points.
The technique for the purpose involves the undertaking of the following steps generally one after the other:
(i) Statement of the problem in a general way; (ii) Understanding the nature of the problem;(iii) Surveying the available literature (iv) Developing the ideas through discussions; and (v) Rephrasing the research problem into a working proposition.
MEANING OF RESEARCH DESIGN
The formidable problem that follows the task of defining the research problem is the preparation of
the design of the research project, popularly known as the “research design”. Decisions regarding what,
where, when, how much, by what means concerning an inquiry or a research study constitute a research
design.
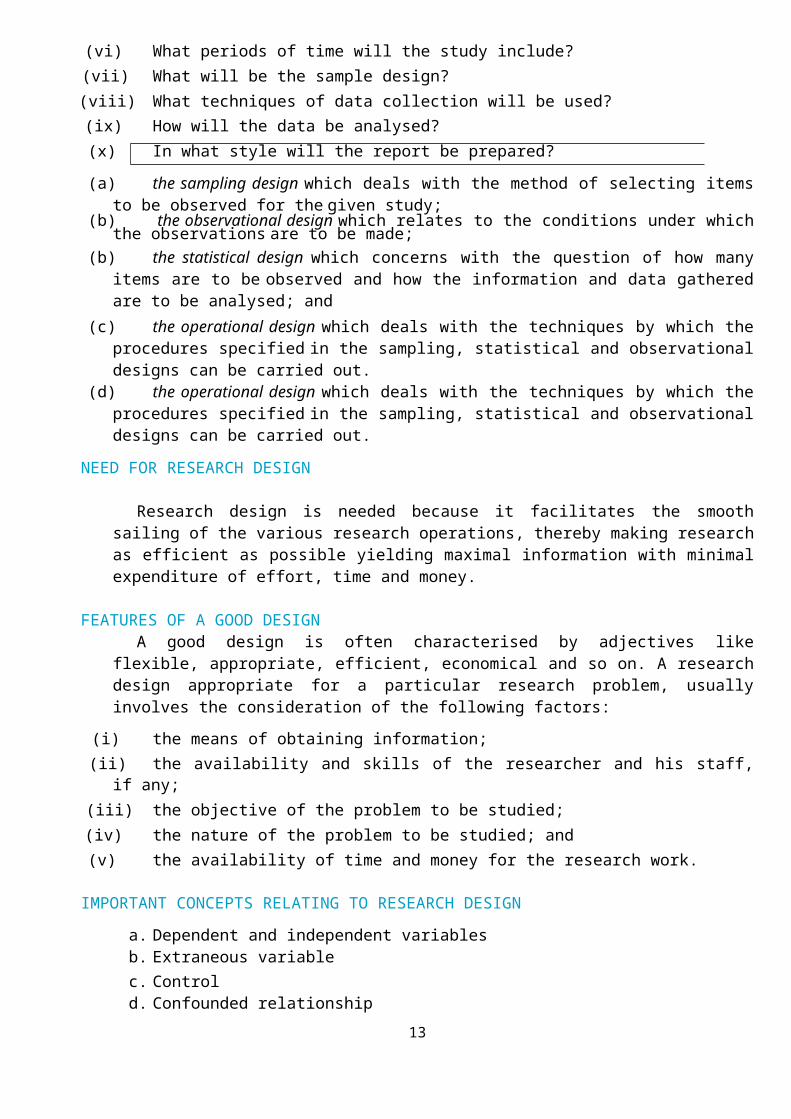
(i) What is the study about? (ii) Why is the study being made? (iii) Where will the study be carried out? (iv) What type of data is required? (v) Where can the required data be found? (vi) What periods of time will the study include?
(vii) What will be the sample design? (viii)What techniques of data collection will be used? (ix) How will the data be analysed?
8
(x) In what style will the report be prepared?
(a) the sampling design which deals with the method of selecting items to be observed for the given study;
(b) the observational design which relates to the conditions under which the observations are to be made;
(b) the statistical design which concerns with the question of how many items are to be observed and how the information and data gathered are to be analysed; and
(c) the operational design which deals with the techniques by which the procedures specified in the sampling, statistical and observational designs can be carried out.
(d) the operational design which deals with the techniques by which the procedures specified in the sampling, statistical and observational designs can be carried out.
NEED FOR RESEARCH DESIGN
Research design is needed because it facilitates the smooth sailing of the various research operations, thereby making research as efficient as possible yielding maximal information with minimal expenditure of effort, time and money.
FEATURES OF A GOOD DESIGNA good design is often characterised by adjectives like flexible, appropriate, efficient,
economical and so on. A research design appropriate for a particular research problem, usually involves the consideration of the following factors:
(i) the means of obtaining information; (ii) the availability and skills of the researcher and his staff, if any; (iii) the objective of the problem to be studied; (iv) the nature of the problem to be studied; and (v) the availability of time and money for the research work.
IMPORTANT CONCEPTS RELATING TO RESEARCH DESIGN
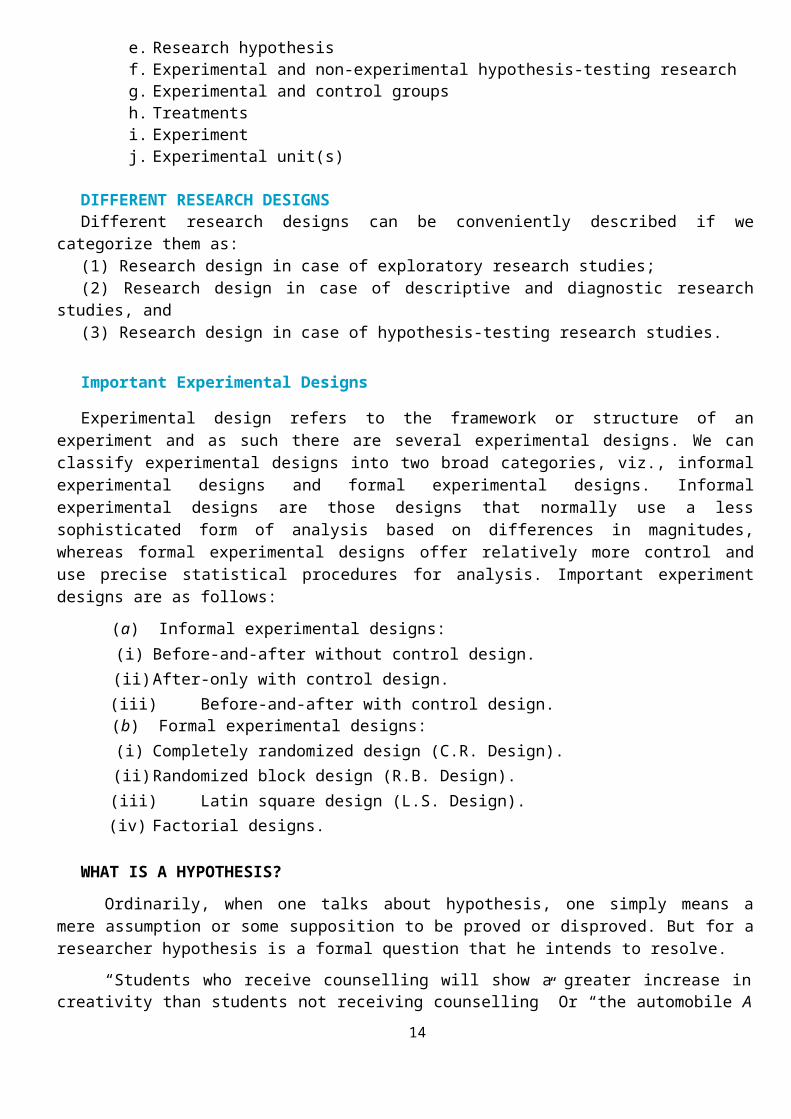
a. Dependent and independent variablesb. Extraneous variablec. Controld. Confounded relationshipe. Research hypothesisf. Experimental and non-experimental hypothesis-testing researchg. Experimental and control groupsh. Treatmentsi. Experimentj. Experimental unit(s)
DIFFERENT RESEARCH DESIGNSDifferent research designs can be conveniently described if we categorize them as: (1) Research design in case of exploratory research studies; (2) Research design in case of descriptive and diagnostic research studies, and (3) Research design in case of hypothesis-testing research studies.
Important Experimental Designs
Experimental design refers to the framework or structure of an experiment and as such there are several experimental designs. We can classify experimental designs into two broad categories, viz., informal experimental designs and formal experimental designs. Informal experimental designs are those designs that
9
normally use a less sophisticated form of analysis based on differences in magnitudes, whereas formal experimental designs offer relatively more control and use precise statistical procedures for analysis. Important experiment designs are as follows:
(a) Informal experimental designs:(i) Before-and-after without control design. (ii) After-only with control design. (iii) Before-and-after with control design. (b) Formal experimental designs:(i) Completely randomized design (C.R. Design). (ii) Randomized block design (R.B. Design). (iii) Latin square design (L.S. Design). (iv) Factorial designs.
WHAT IS A HYPOTHESIS?
Ordinarily, when one talks about hypothesis, one simply means a mere assumption or some supposition to be proved or disproved. But for a researcher hypothesis is a formal question that he intends to resolve.
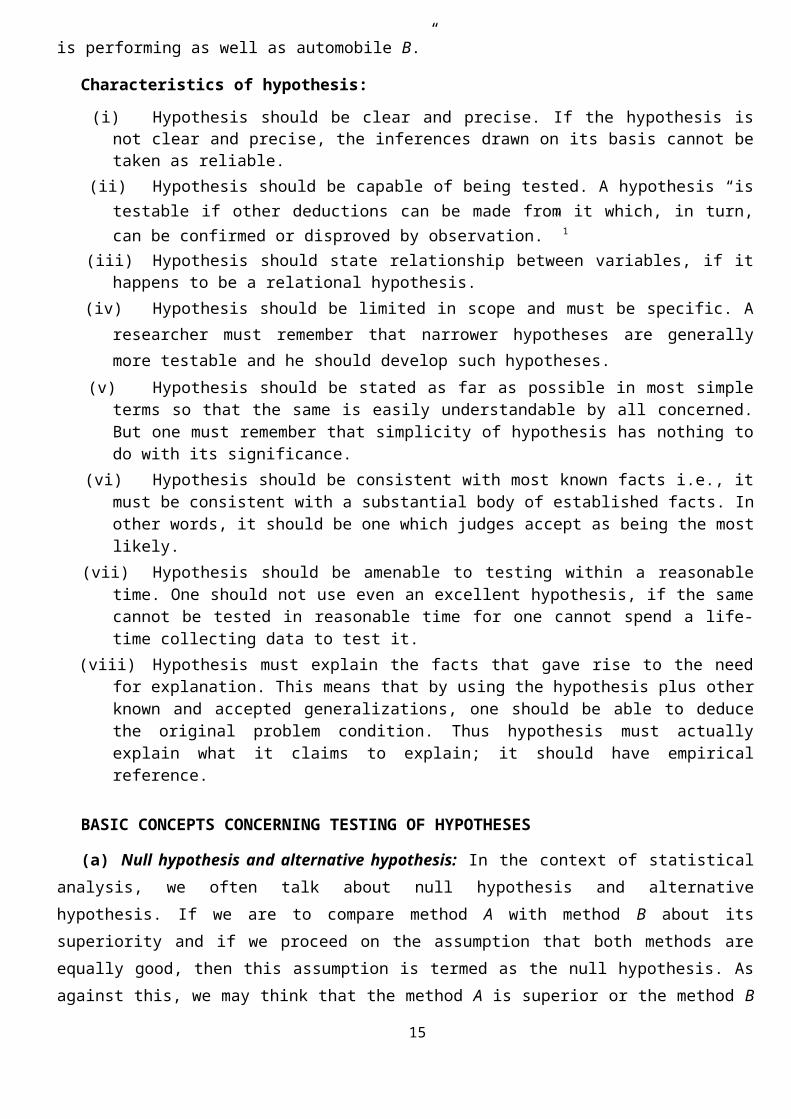
“Students who receive counselling will show a greater increase in creativity than students not receiving counselling” Or “the automobile A is performing as well as automobile B.”
Characteristics of hypothesis:
(i) Hypothesis should be clear and precise. If the hypothesis is not clear and precise, the inferences drawn on its basis cannot be taken as reliable.
(ii) Hypothesis should be capable of being tested. A hypothesis “is testable if other deductions can be made from it which, in turn, can be confirmed or disproved by observation.” 1
(iii) Hypothesis should state relationship between variables, if it happens to be a relational hypothesis.
(iv) Hypothesis should be limited in scope and must be specific. A researcher must remember that narrower hypotheses are generally more testable and he should develop such hypotheses.
(v) Hypothesis should be stated as far as possible in most simple terms so that the same is easily understandable by all concerned. But one must remember that simplicity of hypothesis has nothing to do with its significance.
(vi) Hypothesis should be consistent with most known facts i.e., it must be consistent with a substantial body of established facts. In other words, it should be one which judges accept as being the most likely.
(vii) Hypothesis should be amenable to testing within a reasonable time. One should not use even an excellent hypothesis, if the same cannot be tested in reasonable time for one cannot spend a life-time collecting data to test it.
(viii)Hypothesis must explain the facts that gave rise to the need for explanation. This means that by using the hypothesis plus other known and accepted generalizations, one should be able to deduce the original problem condition. Thus hypothesis must actually explain what it claims to explain; it should have empirical reference.
BASIC CONCEPTS CONCERNING TESTING OF HYPOTHESES
(a) Null hypothesis and alternative hypothesis: In the context of statistical analysis, we often talk about
null hypothesis and alternative hypothesis. If we are to compare method A with method B about its
superiority and if we proceed on the assumption that both methods are equally good, then this assumption is
10

termed as the null hypothesis. As against this, we may think that the method A is superior or the method B is
inferior, we are then stating what is termed as alternative hypothesis. The null hypothesis is generally
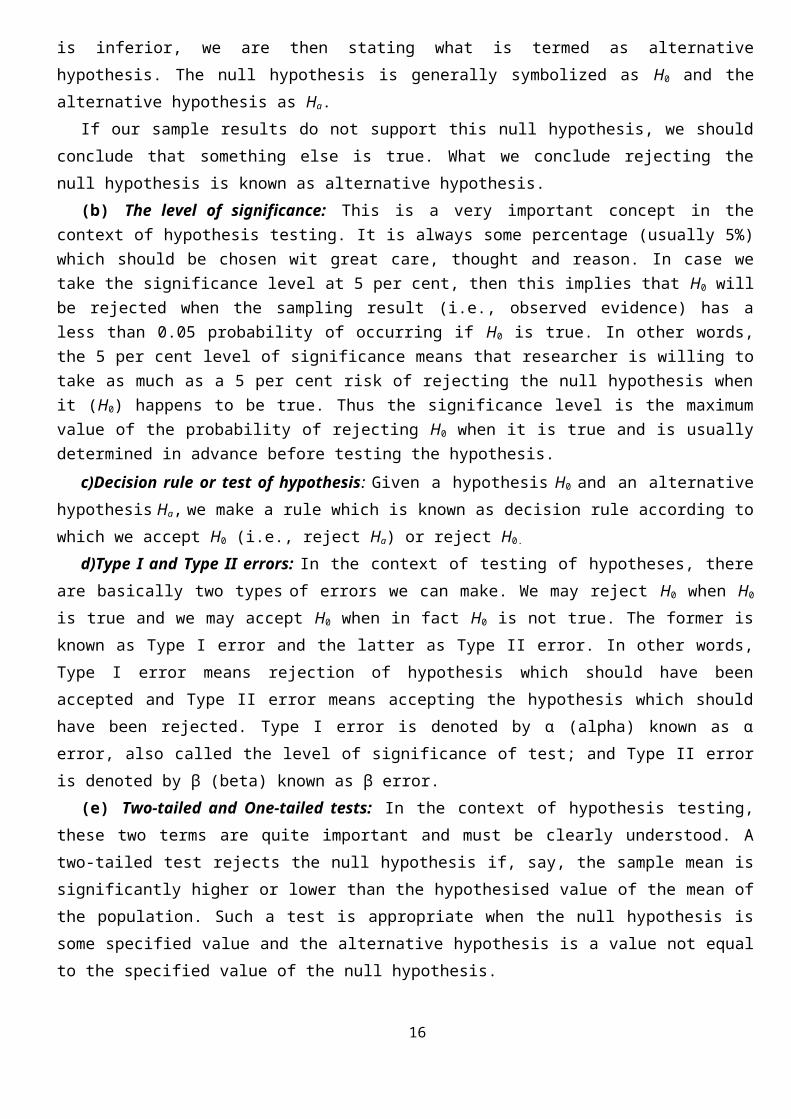
symbolized as H0 and the alternative hypothesis as Ha.
If our sample results do not support this null hypothesis, we should conclude that something else is true.
What we conclude rejecting the null hypothesis is known as alternative hypothesis.
(b) The level of significance: This is a very important concept in the context of hypothesis testing. It is always some percentage (usually 5%) which should be chosen wit great care, thought and reason. In case we take the significance level at 5 per cent, then this implies that H0 will be rejected when the sampling result (i.e., observed evidence) has a less than 0.05 probability of occurring if H0 is true. In other words, the 5 per cent level of significance means that researcher is willing to take as much as a 5 per cent risk of rejecting the null hypothesis when it (H0) happens to be true. Thus the significance level is the maximum value of the probability of rejecting H0 when it is true and is usually determined in advance before testing the hypothesis.
c)Decision rule or test of hypothesis: Given a hypothesis H0 and an alternative hypothesis Ha, we make a
rule which is known as decision rule according to which we accept H0 (i.e., reject Ha) or reject H0.
d)Type I and Type II errors: In the context of testing of hypotheses, there are basically two types of
errors we can make. We may reject H0 when H0 is true and we may accept H0 when in fact H0 is not true. The
former is known as Type I error and the latter as Type II error. In other words, Type I error means rejection
of hypothesis which should have been accepted and Type II error means accepting the hypothesis which
should have been rejected. Type I error is denoted by α (alpha) known as α error, also called the level of
significance of test; and Type II error is denoted by β (beta) known as β error.
(e) Two-tailed and One-tailed tests: In the context of hypothesis testing, these two terms are quite
important and must be clearly understood. A two-tailed test rejects the null hypothesis if, say, the sample
mean is significantly higher or lower than the hypothesised value of the mean of the population. Such a test
is appropriate when the null hypothesis is some specified value and the alternative hypothesis is a value not
equal to the specified value of the null hypothesis.
PROCEDURE FOR HYPOTHESIS TESTING
(i) Making a formal statement: The step consists in making a formal statement of the null hypothesis (H0) and also of the alternative hypothesis (Ha). This means that hypotheses should be clearly stated, considering the nature of the research problem.
(ii)Selecting a significance level: The hypotheses are tested on a pre-determined level of significance and as such the same should be specified. Generally, in practice, either 5% level or 1% level is adopted for the purpose. The factors that affect the level of significance are: (a) the magnitude of the difference between sample means; (b) the size of the samples; (c) the variability of measurements within samples; and (d) whether the hypothesis is directional or non-directional
(iii) Deciding the distribution to use: After deciding the level of significance, the next step in hypothesis testing is to determine the appropriate sampling distribution. The choice generally remains between normal distribution and the t-distribution. The rules for selecting the correct distribution are similar to those which we have stated earlier in the context of estimation.
(iv) Selecting a random sample and computing an appropriate value: Another step is to select a random sample(s) and compute an appropriate value from the sample data concerning the test statistic utilizing the relevant distribution. In other words, draw a sample to furnish empirical data.
(v) Calculation of the probability: One has then to calculate the probability that the sample result would diverge as widely as it has from expectations, if the null hypothesis were in fact true.
Comparing the probability: Yet another step consists in comparing the probability thus calculated with
11
the specified value for , the significance level. If the calculated probability is equal to or smaller than the value in case of one-tailed test (and /2 in case of two-tailed test), then reject the null hypothesis (i.e., accept the alternative hypothesis), but if the calculated probability is greater, then accept the null hypothesis.
TESTS OF HYPOTHESES
As has been stated above that hypothesis testing determines the validity of the assumption (technically described as null hypothesis) with a view to choose between two conflicting hypotheses about the value of a population parameter. Hypothesis testing helps to decide on the basis of a sample data, whether a hypothesis about the population is likely to be true or false.
Statisticians have developed several tests of hypotheses (also known as the tests of significance) for the purpose of testing of hypotheses which can be classified as: (a) Parametric tests or standard tests of hypotheses; and (b) Non-parametric tests or distribution-free test of hypotheses.
Parametric tests usually assume certain properties of the parent population from which we draw samples. Assumptions like observations come from a normal population, sample size is large, assumptions about the population parameters like mean, variance, etc., must hold good before parametric tests can be used. But there are situations when the researcher cannot or does not want to make such assumptions. In such situations we use statistical methods for testing hypotheses which are called non-parametric tests because such tests do not depend on any assumption about the parameters of the parent population. Besides, most non-parametric tests assume only nominal or ordinal data, whereas parametric tests require measurement equivalent to at least an interval scale. As a result, non-parametric tests need more observations than parametric tests to achieve the same size of Type I and Type II errors.
IMPORTANT PARAMETRIC TESTS
The important parametric tests are: (1) z-test; (2) t-test; (*3) 2-test, and (4) F-test. All these tests are based on the assumption of normality i.e., the source of data is considered to be normally distributed.
12
Unit – II
CENSUS AND SAMPLE SURVEY
All items in any field of inquiry constitute a ‘Universe’ or ‘Population.’ A complete enumeration of all items in the
‘population’ is known as a census inquiry. It can be presumed that in such an inquiry, when all items are covered, no
element of chance is left and highest accuracy is obtained.
When field studies are undertaken in practical life, considerations of time and cost almost invariably lead to a selection
of respondents i.e., selection of only a few items. The respondents selected should be as representative of the total
population as possible in order to produce a miniature cross-section. The selected respondents constitute what is technically
called a ‘sample’ and the selection process is called ‘sampling technique.’ The survey so conducted is known as ‘sample
survey’. Algebraically, let the population size be N and if a part of size n (which is < N) of this population is selected
according to some rule for studying some characteristic of the population, the group consisting of these n units is known as
‘sample’.
STEPS IN SAMPLE DESIGN
While developing a sampling design, the researcher must pay attention to the following points:
(i) Type of universe: The first step in developing any sample design is to clearly define the set of objects, technically called the Universe, to be studied. The universe can be finite or infinite. In finite universe the number of items is certain, but in case of an infinite universe the number of items is infinite, i.e., we cannot have any idea about the total number of items.
(ii) Sampling unit: A decision has to be taken concerning a sampling unit before selecting sample. Sampling unit may be a geographical one such as state, district, village, etc., or a construction unit such as house, flat, etc., or it may be a social unit such as family, club, school, etc., or it may be an individual.
(iii) Source list: It is also known as ‘sampling frame’ from which sample is to be drawn. It contains the names of all items of a universe (in case of finite universe only). If source list is not available, researcher has to prepare it. Such a list should be comprehensive, correct, reliable and appropriate. It is extremely important for the source list to be as representative of the population as possible.
(iv) Size of sample: This refers to the number of items to be selected from the universe to constitute a sample. This a major problem before a researcher. The size of sample should neither be excessively large, nor too small. It should be optimum. An optimum sample is one which fulfills the requirements of efficiency, representativeness, reliability and flexibility. While deciding the size of sample, researcher must determine the desired precision as also an acceptable confidence level for the estimate.
(v) Parameters of interest: In determining the sample design, one must consider the question of the specific population parameters which are of interest. For instance, we may be interested in estimating the proportion of persons with some characteristic in the population, or we may be interested in knowing some average or the other measure concerning the population.
(vi) Budgetary constraint: Cost considerations, from practical point of view, have a major impact upon decisions relating to not only the size of the sample but also to the type of sample.
(vii) Sampling procedure: Finally, the researcher must decide the type of sample he will use i.e., he must decide about the technique to be used in selecting the items for the sample. In fact, this technique or procedure stands for the sample design itself.
CRITERIA OF SELECTING A SAMPLING PROCEDURE
In this context one must remember that two costs are involved in a sampling analysis viz., the cost of collecting the data and the cost of an incorrect inference resulting from the data.
Researcher must keep in view the two causes of incorrect inferences viz., systematic bias and sampling error. A systematic bias results from errors in the sampling procedures, and it cannot be reduced or eliminated by increasing
the sample size. At best the causes responsible for these errors can be detected and corrected. Usually a systematic bias is the result of one or more of the following factors:
1. Inappropriate sampling frame: If the sampling frame is inappropriate i.e., a biased representation of the universe,
13
it will result in a systematic bias. 2. Defective measuring device: If the measuring device is constantly in error, it will result in systematic bias. In survey work, systematic bias can result if the questionnaire or the interviewer is biased. Similarly, if the physical measuring device is defective there will be systematic bias in the data collected through such a measuring device.
3. Non-respondents: If we are unable to sample all the individuals initially included in the sample, there may arise a systematic bias. The reason is that in such a situation the likelihood of establishing contact or receiving a response from an individual is often correlated with the measure of what is to be estimated. 4. Indeterminancy principle: Sometimes we find that individuals act differently when kept under observation than what they do when kept in non-observed situations. For instance, if workers are aware that somebody is observing them in course of a work study on the basis of which the average length of time to complete a task will be determined and accordingly the quota will be set for piece work, they generally tend to work slowly in comparison to the speed with which they work if kept unobserved. Thus, the indeterminancy principle may also be a cause of a systematic bias.
5. Natural bias in the reporting of data: Natural bias of respondents in the reporting of data is often the cause of a systematic bias in many inquiries. There is usually a downward bias in the income data collected by government taxation department, whereas we find an upward bias in the income data collected by some social organisation. People in general understate their incomes if asked about it for tax purposes, but they overstate the same if asked for social status or their affluence. Generally in psychological surveys, people tend to give what they think is the ‘correct’ answer rather than revealing their true feelings.
Sampling errors are the random variations in the sample estimates around the true population parameters. Sampling error decreases with the increase in the size of the sample, and it happens to be of a smaller magnitude in case of homogeneous population.
Sampling error can be measured for a given sample design and size. The measurement of sampling error is usually called the ‘precision of the sampling plan’. If we increase the sample size, the precision can be improved. But increasing the size of the sample has its own limitations viz., a large sized sample increases the cost of collecting data and also enhances the systematic bias. Thus the effective way to increase precision is usually to select a better sampling design which has a smaller sampling error for a given sample size at a given cost.
In brief, while selecting a sampling procedure, researcher must ensure that the procedure causes a relatively small sampling error and helps to control the systematic bias in a better way.
CHARACTERISTICS OF A GOOD SAMPLE DESIGN
(a)Sample design must result in a truly representative sample. (b) Sample design must be such which results in a small sampling error.
(c)Sample design must be viable in the context of funds available for the research study. (d) Sample design must be such so that systematic bias can be controlled in a better way.
Sample should be such that the results of the sample study can be applied, in general, for the universe with a reasonable level of confidence.
DIFFERENT TYPES OF SAMPLE DESIGNS
Probability sampling is based on the concept of random selection, whereas non-probability sampling is ‘non-random’ sampling. On element selection basis, the sample may be either unrestricted or restricted. When each sample element is drawn individually from the population at large, then the sample so drawn is known as ‘unrestricted sample’, whereas all other forms of sampling are covered under the term ‘restricted sampling’.
The, sample designs are basically of two types viz., non-probability sampling and probability sampling.
Non-probability sampling: Non-probability sampling is that sampling procedure which does not afford any basis for estimating the probability that each item in the population has of being included in the sample. Non-probability sampling is also known by different names such as deliberate sampling, purposive sampling and judgement sampling. In this type of sampling, items for the sample are selected deliberately by the researcher; his choice concerning the items remains supreme.
14
Probability sampling: Probability sampling is also known as ‘random sampling’ or ‘chance sampling’. Under this
sampling design, every item of the universe has an equal chance of inclusion in the sample. Random sampling from a finite
population refers to that method of sample selection which gives each possible sample combination an equal
probability of being picked up and each item in the entire population to have an equal chance of being included in the
sample.
DATA COLLECTIONThe researcher should keep in mind two types of data viz., primary and secondary. The primary data are
those which are collected afresh and for the first time, and thus happen to be original in character. The secondary data, on the other hand, are those which have already been collected by someone else and which have already been passed through the statistical process.
COLLECTION OF PRIMARY DATA
We collect primary data during the course of doing experiments in an experimental research but in case we do research of the descriptive type and perform surveys, whether sample surveys or census surveys, then we can obtain primary data either through observation or through direct communication with respondents in one form or another or through personal interviews.
There are several methods of collecting primary data, particularly in surveys and descriptive researches. Important ones are:
(i) Observation method, (ii) Interview method, (iii) Through questionnaires, (iv)Through schedules, and (v) Other methods which include (a) warranty cards; (b) distributor audits; (c) pantry audits; (d) consumer panels; (e) using mechanical devices; (f) through projective techniques; (g) depth interviews, and (h) content analysis. We briefly take up each method separately.
Observation Method
The observation method is the most commonly used method specially in studies relating to behavioural sciences. In a way we all observe things around us, but this sort of observation is not scientific observation. Observation becomes a scientific tool and the method of data collection for the researcher, when it serves a formulated research purpose, is systematically planned and recorded and is subjected to checks and controls on validity and reliability. Under the observation method, the information is sought by way of investigator’s own direct observation without asking from the respondent.
Type of observation: (i) The researcher is enabled to record the natural behaviour of the group. (ii) The researcher can even gather information which could not easily be obtained if he observes in a disinterested fashion. (iii) The researcher can even verify the truth of statements made by informants in the context of a questionnaire or a schedule.
Interview Method(a) Personal interviews: Personal interview method requires a person known as the interviewer asking
15
questions generally in a face-to-face contact to the other person or persons.
The method of collecting information through personal interviews is usually carried out in a structured way. As such we call the interviews as structured interviews. Such interviews involve the use of a set of predetermined questions and of highly standardised techniques of recording. The unstructured interviews are characterised by a flexibility of approach to questioning. Unstructured interviews do not follow a system of pre-determined questions and standardised techniques of recording information.
Focussed interview is meant to focus attention on the given experience of the respondent and its effects. The clinical interview is concerned with broad underlying feelings or motivations or with the course of individual’s life experience. In case of non-directive interview, the interviewer’s function is simply to encourage the respondent to talk about the given topic with a bare minimum of direct questioning.
(b) Telephone interviews: This method of collecting information consists in contacting respondents on telephone itself. It is not a very widely used method, but plays important part in industrial surveys, particularly in developed regions. The chief merits of such a system are:
1. It is more flexible in comparison to mailing method. 2. It is faster than other methods i.e., a quick way of obtaining information. 3. It is cheaper than personal interviewing method; here the cost per response is relatively low. 4. Recall is easy; callbacks are simple and economical. 5. There is a higher rate of response than what we have in mailing method; the non-response is
generally very low. 6. Replies can be recorded without causing embarrassment to respondents. 7. Interviewer can explain requirements more easily. 8. At times, access can be gained to respondents who otherwise cannot be contacted for one reason or
the other. 9. No field staff is required.
10. Representative and wider distribution of sample is possible.
COLLECTION OF DATA THROUGH QUESTIONNAIRES
This method of data collection is quite popular, particularly in case of big enquiries. It is being adopted by private individuals, research workers, private and public organisations and even by governments. In this method a questionnaire is sent (usually by post) to the persons concerned with a request to answer the questions and return the questionnaire. A questionnaire consists of a number of questions printed or typed in a definite order on a form or set of forms.
Before using this method, it is always advisable to conduct ‘pilot study’ (Pilot Survey) for testing the questionnaires. In a big enquiry the significance of pilot survey is felt very much. Pilot survey is infact the replica and rehearsal of the main survey. Such a survey, being conducted by experts, brings to the light the weaknesses (if any) of the questionnaires and also of the survey techniques. From the experience gained in this way, improvement can be effected.
Main aspects of a questionnaire: Quite often questionnaire is considered as the heart of a survey operation.
1. General form: The form of the question may be either closed (i.e., of the type ‘yes’ or ‘no’) or open (i.e., inviting free response) but should be stated in advance and not constructed during questioning.
16
2. Question sequence: In order to make the questionnaire effective and to ensure quality to the replies received, a researcher should pay attention to the question-sequence in preparing the questionnaire.
3. Question formulation and wording: In general, all questions should meet the following standards—(a) should be easily understood; (b) should be simple i.e., should convey only one thought at a time; (c) should be concrete and should conform as much as possible to the respondent’s way of thinking.
Essentials of a good questionnaire: To be successful, questionnaire should be comparatively short and simple i.e., the size of the questionnaire should be kept to the minimum. Questions should proceed in logical sequence moving from easy to more difficult questions. Personal and intimate questions should be left to the end.
Technical terms and vague expressions capable of different interpretations should be avoided in a questionnaire. Questions may be dichotomous (yes or no answers), multiple choice (alternative answers listed) or open-ended. The latter types of questions are often difficult to analyse and hence should be avoided in a questionnaire to the extent possible. There should be some control questions in the questionnaire which indicate the reliability of the respondent.
COLLECTION OF DATA THROUGH SCHEDULES
This method of data collection is very much like the collection of data through questionnaire, with little difference which lies in the fact that schedules (proforma containing a set of questions) are being filled in by the enumerators who are specially appointed for the purpose. These enumerators along with schedules, go to respondents, put to them the questions from the proforma in the order the questions are listed and record the replies in the space meant for the same in the proforma. In certain situations, schedules may be handed over to respondents and enumerators may help them in recording their answers to various questions in the said schedules. Enumerators explain the aims and objects of the investigation and also remove the difficulties which any respondent may feel in understanding the implications of a particular question or the definition or concept of difficult terms.
This method requires the selection of enumerators for filling up schedules or assisting respondents to fill up schedules and as such enumerators should be very carefully selected. The enumerators should be trained to perform their job well and the nature and scope of the investigation should be explained to them thoroughly so that they may well understand the implications of different questions put in the schedule. Enumerators should be intelligent and must possess the capacity of cross-examination in order to find out the truth. Above all, they should be honest, sincere, hard working and should have patience and perseverance.
This method of data collection is very useful in extensive enquiries and can lead to fairly reliable results. It is, however, very expensive and is usually adopted in investigations conducted by governmental agencies or by some big organisations. Population census all over the world is conducted through this method.
DIFFERENCE BETWEEN QUESTIONNAIRES AND SCHEDULES
1) The questionnaire is generally sent through mail to informants to be answered as specified in a covering letter, but otherwise without further assistance from the sender. The schedule is generally filled out by the research worker or the enumerator, who can interpret questions when necessary.
2) To collect data through questionnaire is relatively cheap and economical since we have to spend money only in preparing the questionnaire and in mailing the same to respondents. Here no field staff required. To collect data through schedules is relatively more expensive since considerable amount of money has to be spent in appointing enumerators and in importing training to them. Money is also spent in preparing schedules.
3) Non-response is usually high in case of questionnaire as many people do not respond and many return the
17
questionnaire without answering all questions. Bias due to non-response often remains indeterminate. As against this, non-response is generally very low in case of schedules because these are filled by enumerators who are able to get answers to all questions. But there remains the danger of interviewer bias and cheating.
4) In case of questionnaire, it is not always clear as to who replies, but in case of schedule the identity of respondent is known.
5) The questionnaire method is likely to be very slow since many respondents do not return the questionnaire in time despite several reminders, but in case of schedules the information is collected well in time as they are filled in by enumerators.
6) Personal contact is generally not possible in case of the questionnaire method as questionnaires are sent to respondents by post who also in turn return the same by post. But in case of schedules direct personal contact is established with respondents.
7) Questionnaire method can be used only when respondents are literate and cooperative, but in case of schedules the information can be gathered even when the respondents happen to be illiterate.
8) Wider and more representative distribution of sample is possible under the questionnaire method, but in respect of schedules there usually remains the difficulty in sending enumerators over a relatively wider area.
9) Risk of collecting incomplete and wrong information is relatively more under the questionnaire method, particularly when people are unable to understand questions properly. But in case of schedules, the information collected is generally complete and accurate as enumerators can remove the difficulties, if any, faced by respondents in correctly understanding the questions. As a result, the information collected through schedules is relatively more accurate than that obtained through questionnaires.
10) The success of questionnaire method lies more on the quality of the questionnaire itself, but in the case of schedules much depends upon the honesty and competence of enumerators.
11) In order to attract the attention of respondents, the physical appearance of questionnaire must be quite attractive, but this may not be so in case of schedules as they are to be filled in by enumerators and not by respondents.
12) Along with schedules, observation method can also be used but such a thing is not possible while collecting data through questionnaires.
SOME OTHER METHODS OF DATA COLLECTION
Let us consider some other methods of data collection, particularly used by big business houses in modern times.
1. Warranty cards: Warranty cards are usually postal sized cards which are used by dealers of consumer durables to collect information regarding their products. The information sought is printed in the form of questions on the ‘warranty cards’ which is placed inside the package along with the product with a request to the consumer to fill in the card and post it back to the dealer.
2. Distributor or store audits: Distributor or store audits are performed by distributors as well as manufactures through their salesmen at regular intervals. 3. Pantry audits: Pantry audit technique is used to estimate consumption of the basket of goods at the consumer level. In this type of audit, the investigator collects an inventory of types, quantities and prices of commodities consumed. Thus in pantry audit data are recorded from the examination of consumer’s pantry. 4. Consumer panels: An extension of the pantry audit approach on a regular basis is known as ‘consumer panel’, where a set of consumers are arranged to come to an understanding to maintain detailed daily records of their consumption and the same is made available to investigator on demands. In other words, a consumer panel is essentially a sample of consumers who are interviewed repeatedly over a period of time. Mostly consume panels are of two types viz., the transitory consumer panel and the continuing consumer panel. A transitory consumer panel is set up to measure the effect of a particular phenomenon. A continuing consumer panel is often set up for an indefinite period with a view to collect data on a particular aspect of consumer behaviour over time, generally at periodic intervals or may be meant to serve as a general purpose panel for researchers on a variety of subjects.
18
5. Use of mechanical devices: The use of mechanical devices has been widely made to collect information by way of indirect means. Eye camera, Pupilometric camera, Psychogalvanometer, Motion picture camera and Audiometer are the principal devices so far developed and commonly used by modern big business houses, mostly in the developed world for the purpose of collecting the required information.
6. Projective techniques: Projective techniques (or what are sometimes called as indirect interviewing techniques) for the collection of data have been developed by psychologists to use projections of respondents for inferring about underlying motives, urges, or intentions which are such that the respondent either resists to reveal them or is unable to figure out himself.7. Depth interviews: Depth interviews are those interviews that are designed to discover underlying motives and desires and are often used in motivational research. Such interviews are held to explore needs, desires and feelings of respondents.
8. Content-analysis: Content-analysis consists of analysing the contents of documentary materials such as books, magazines, newspapers and the contents of all other verbal materials which can be either spoken or printed. Content-analysis prior to 1940’s was mostly quantitative analysis of documentary materials concerning certain characteristics that can be identified and counted
COLLECTION OF SECONDARY DATA
Secondary data means data that are already available i.e., they refer to the data which have already been collected and analysed by someone else. When the researcher utilises secondary data, then he has to look into various sources from where he can obtain them. In this case he is certainly not confronted with the problems that are usually associated with the collection of original data. Secondary data may either be published data or unpublished data. Usually published data are available in: (a) various publications of the central, state are local governments; (b) various publications of foreign governments or of international bodies and their subsidiary organisations; (c) technical and trade journals; (d) books, magazines and newspapers; (e) reports and publications of various associations connected with business and industry, banks, stock exchanges, etc.; (f) reports prepared by research scholars, universities, economists, etc. in different fields; and (g) public records and statistics, historical documents, and other sources of published information. The sources of unpublished data are many; they may be found in diaries, letters, unpublished biographies and autobiographies and also may be available with scholars and research workers, trade associations, labour bureaus and other public/ private individuals and organisations.
Characteristics of Secondary Data:
1. Reliability of data: The reliability can be tested by finding out such things about the said data: (a) Who collected the data? (b) What were the sources of data? (c) Were they collected by using proper methods (d) At what time were they collected?(e) Was there any bias of the compiler? (t) What level of accuracy was desired? Was it achieved ?
2. Suitability of data: The data that are suitable for one enquiry may not necessarily be found suitable in another enquiry. Hence, if the available data are found to be unsuitable, they should not be used by the researcher.
3. Adequacy of data: If the level of accuracy achieved in data is found inadequate for the purpose of the present enquiry, they will be considered as inadequate and should not be used by the researcher. The data
19
will also be considered inadequate, if they are related to an area which may be either narrower or wider than the area of the present enquiry.
SELECTION OF APPROPRIATE METHOD FOR DATA COLLECTION
1. Nature, scope and object of enquiry: This constitutes the most important factor affecting the choice of a particular method. The method selected should be such that it suits the type of enquiry that is to be conducted by the researcher. This factor is also important in deciding whether the data already available (secondary data) are to be used or the data not yet available (primary data) are to be collected.
2. Availability of funds: Availability of funds for the research project determines to a large extent the method to be used for the collection of data. When funds at the disposal of the researcher are very limited, he will have to select a comparatively cheaper method which may not be as efficient and effective as some other costly method. Finance, in fact, is a big constraint in practice and the researcher has to act within this limitation.
3.Time factor: Availability of time has also to be taken into account in deciding a particular method of data collection. Some methods take relatively more time, whereas with others the data can be collected in a comparatively shorter duration. The time at the disposal of the researcher, thus, affects the selection of the method by which the data are to be collected.
4. Precision required: Precision required is yet another important factor to be considered at the time of selecting the method of collection of data.
CASE STUDY METHOD
The case study method is a very popular form of qualitative analysis and involves a careful and complete observation of a social unit, be that unit a person, a family, an institution, a cultural group or even the entire community. It is a method of study in depth rather than breadth. The case study places more emphasis on the full analysis of a limited number of events or conditions and their interrelations.
20
Unit – III
MEASUREMENT IN RESEARCH
Technically speaking, measurement is a process of mapping aspects of a domain onto other aspects of a range according to some rule of correspondence. In measuring, we devise some form of scale in the range (in terms of set theory, range may refer to some set) and then transform or map the properties of objects from the domain (in terms of set theory, domain may refer to some other set) onto this scale.
For example, in case we are to find the male to female attendance ratio while conducting a study of persons who attend some show, then we may tabulate those who come to the show according to sex. The rule of correspondence is: If the object in the domain appears to be male, assign to “0” and if female assign to “1”. Similarly, we can record a person’s marital status as 1, 2, 3 or 4, depending on whether the person is single, married, widowed or divorced. We can as well record “Yes or No” answers to a question as “0” and “1” (or as 1 and 2 or perhaps as 59 and 60).
Nominal data are numerical in name only, because they do not share any of the properties of the numbers we deal in ordinary arithmetic. For instance if we record marital status as 1, 2, 3, or 4 as stated above, we cannot write 4 > 2 or 3 < 4 and we cannot write 3 – 1 = 4 – 2, 1 + 3 = 4 or 4 2 = 2.
In those situations when we cannot do anything except set up inequalities, we refer to the data as ordinal data.
When in addition to setting up inequalities we can also form differences, we refer to the data as interval data. Suppose we are given the following temperature readings (in degrees Fahrenheit): 58°, 63°, 70°, 95°, 110°, 126° and 135°. In this case, we can write 100° > 70° or 95° < 135° which simply means that 110° is warmer than 70° and that 95° is cooler than 135°. We can also write for example 95° – 70° = 135° – 110°, since equal temperature differences are equal in the sense that the same amount of heat is required to raise the temperature of an object from 70° to 95° or from 110° to 135°.
When in addition to setting up inequalities and forming differences we can also form quotients (i.e., when we can perform all the customary operations of mathematics), we refer to such data as ratio data. In this sense, ratio data includes all the usual measurement (or determinations) of length, height, money amounts, weight, volume, area, pressures etc.
MEASUREMENT SCALESThe most widely used classification of measurement scales are: (a) nominal scale; (b) ordinal scale; (c)
interval scale; and (d) ratio scale.(a) Nominal scale: Nominal scale is simply a system of assigning number symbols to events in order to
label them. The usual example of this is the assignment of numbers of basketball players in order to identify them. Such numbers cannot be considered to be associated with an ordered scale for their order is of no consequence; the numbers are just convenient labels for the particular class of events and as such have no quantitative value.
(b) Ordinal scale: The lowest level of the ordered scale that is commonly used is the ordinal scale. The ordinal scale places events in order, but there is no attempt to make the intervals of the scale equal in terms of some rule. Rank orders represent ordinal scales and are frequently used in research relating to qualitative phenomena. A student’s rank in his graduation class involves the use of an ordinal scale.
21
(c) Interval scale: In the case of interval scale, the intervals are adjusted in terms of some rule that has been established as a basis for making the units equal. The units are equal only in so far as one accepts the assumptions on which the rule is based. Interval scales can have an arbitrary zero, but it is not possible to determine for them what may be called an absolute zero or the unique origin.
(d) Ratio scale: Ratio scales have an absolute or true zero of measurement. The term ‘absolute zero’ is not as precise as it was once believed to be. We can conceive of an absolute zero of length and similarly we can conceive of an absolute zero of time. Ratio scale represents the actual amounts of variables. Measures of physical dimensions such as weight, height, distance, etc. are examples. Generally, all statistical techniques are usable with ratio scales and all manipulations that one can carry out with real numbers can also be carried out with ratio scale values. Example : Number of children in the family.
Sources of Error in Measurement(a) Respondent: At times the respondent may be reluctant to express strong negative feelings or it is just possible that he may have very little knowledge but may not admit his ignorance. All this reluctance is likely to result in an interview of ‘guesses.’ Transient factors like fatigue, boredom, anxiety, etc. may limit the ability of the respondent to respond accurately and fully. (b)Situation: Situational factors may also come in the way of correct measurement. Any condition which places a strain on interview can have serious effects on the interviewer-respondent rapport. For instance, if someone else is present, he can distort responses by joining in or merely by being present. If the respondent feels that anonymity is not assured, he may be reluctant to express certain feelings. (c) Measurer: The interviewer can distort responses by rewording or reordering questions. His behaviour, style and looks may encourage or discourage certain replies from respondents. Careless mechanical processing may distort the findings. Errors may also creep in because of incorrect coding, faulty tabulation and/or statistical calculations, particularly in the data-analysis stage. (d)Instrument: Error may arise because of the defective measuring instrument. The use of complex words, beyond the comprehension of the respondent, ambiguous meanings, poor printing, inadequate space for replies, response choice omissions, etc. are a few things that make the measuring instrument defective and may result in measurement errors. Another type of instrument deficiency is the poor sampling of the universe of items of concern.
Tests of Sound MeasurementSound measurement must meet the tests of validity, reliability and practicality. In fact, these are the
three major considerations one should use in evaluating a measurement tool. 1. Test of Validity
Validity is the most critical criterion and indicates the degree to which an instrument measures what it is supposed to measure. Validity can also be thought of as utility. In other words, validity is the extent to which differences found with a measuring instrument reflect true differences among those being tested. There are three types of validity in this connection: (i) Content validity; (ii) Criterion-related validity and (iii) Construct validity.
22
(i) Content validity is the extent to which a measuring instrument provides adequate coverage of the topic under study. If the instrument contains a representative sample of the universe, the content validity is good. Its determination is primarily judgemental and intuitive. It can also be determined by using a panel of persons who shall judge how well the measuring instrument meets the standards, but there is no numerical way to express it.
(ii)Criterion-related validity relates to our ability to predict some outcome or estimate the existence of some current condition. This form of validity reflects the success of measures used for some empirical estimating purpose. The concerned criterion must possess the following qualities: Relevance: (A criterion is relevant if it is defined in terms we judge to be the proper measure.) Freedom from bias: (Freedom from bias is attained when the criterion gives each subject an equal opportunity to score well.) Reliability: (A reliable criterion is stable or reproducible.) Availability: (The information specified by the criterion must be available.) In fact, a Criterion-related validity is a broad term that actually refers to
(i) Predictive validity and (ii) Concurrent validity. The former refers to the usefulness of a test in predicting some future performance whereas the latter refers to the usefulness of a test in closely relating to other measures of known validity. Criterion-related validity is expressed as the coefficient of correlation between test scores and some measure of future performance or between test scores and scores on another measure of known validity.
(iii) Construct validity is the most complex and abstract. A measure is said to possess construct validity to the degree that it confirms to predicted correlations with other theoretical propositions. Construct validity is the degree to which scores on a test can be accounted for by the explanatory constructs of a sound theory.2. Test of Reliability
The test of reliability is another important test of sound measurement. A measuring instrument is reliable if it provides consistent results. Reliable measuring instrument does contribute to validity, but a reliable instrument need not be a valid instrument. For instance, a scale that consistently overweighs objects by five kgs., is a reliable scale, but it does not give a valid measure of weight. But the other way is not true i.e., a valid instrument is always reliable. Accordingly reliability is not as valuable as validity, but it is easier to assess reliability in comparison to validity.
Two aspects of reliability viz., stability and equivalence deserve special mention. The stability aspect is concerned with securing consistent results with repeated measurements of the same person and with the same instrument. We usually determine the degree of stability by comparing the results of repeated measurements. The equivalence aspect considers how much error may get introduced by different investigators or different samples of the items being studied.3. Test of Practicality
The practicality characteristic of a measuring instrument can be judged in terms of economy, convenience and interpretability. From the operational point of view, the measuring instrument ought to be practical i.e., it should be economical, convenient and interpretable.
TECHNIQUE OF DEVELOPING MEASUREMENT TOOLSThe technique of developing measurement tools involves a four-stage process, consisting of the
following: (a) Concept development; (b) Specification of concept dimensions; (c) Selection of indicators; and (d) Formation of index.
23
The first and foremost step is that of concept development which means that the researcher should arrive at an understanding of the major concepts pertaining to his study. This step of concept development is more apparent in theoretical studies than in the more pragmatic research, where the fundamental concepts are often already established.
The second step requires the researcher to specify the dimensions of the concepts that he developed in the first stage. This task may either be accomplished by deduction i.e., by adopting a more or less intuitive approach or by empirical correlation of the individual dimensions with the total concept and/or the other concepts. Once the dimensions of a concept have been specified, the researcher must develop indicators for measuring each concept element. Indicators are specific questions, scales, or other devices by which respondent’s knowledge, opinion, expectation, etc., are measured.
The last step is that of combining the various indicators into an index, i.e., formation of an index. When we have several dimensions of a concept or different measurements of a dimension, we may need to combine them into a single index. One simple way for getting an overall index is to provide scale values to the responses and then sum up the corresponding scores.
Meaning of ScalingScaling describes the procedures of assigning numbers to various degrees of opinion, attitude and
other concepts. This can be done in two ways viz., (i) making a judgement about some characteristic of an individual and then placing him directly on a scale that has been defined in terms of that characteristic and (ii) constructing questionnaires in such a way that the score of individual’s responses assigns him a place on a scale.
Scale Classification BasesThe number assigning procedures or the scaling procedures may be broadly classified on one or more of
the following bases: (a) subject orientation; (b) response form; (c) degree of subjectivity; (d) scale properties; (e) number of dimensions and (f) scale construction techniques. (a)Subject orientation: Under it a scale may be designed to measure characteristics of the respondent who completes it or to judge the stimulus object which is presented to the respondent. In the latter approach, we ask the respondent to judge some specific object in terms of one or more dimensions and we presume that the between-respondent variation will be small as compared to the variation among the different stimuli presented to respondents for judging. (b) Response form: Under this we may classify the scales as categorical and comparative. Categorical scales are also known as rating scales. These scales are used when a respondent scores some object without direct reference to other objects. Under comparative scales, which are also known as ranking scales, the respondent is asked to compare two or more objects. (c) Degree of subjectivity: With this basis the scale data may be based on whether we measure subjective personal preferences or simply make non-preference judgements. In the former case, the respondent is asked to choose which person he favours or which solution he would like to see employed, whereas in the latter case he is simply asked to judge which person is more effective in some aspect or which solution will take fewer resources without reflecting any personal preference. (d)Scale properties: Considering scale properties, one may classify the scales as nominal, ordinal, interval and ratio scales. Nominal scales merely classify without indicating order, distance or unique origin. Ordinal scales indicate magnitude relationships of ‘more than’ or ‘less than’, but indicate no distance or unique origin. (e) Number of dimensions: In respect of this basis, scales can be classified as ‘unidimensional’ and
24
‘multidimensional’ scales. Under the former we measure only one attribute of the respondent or object, whereas multidimensional scaling recognizes that an object might be described better by using the concept of an attribute space of ‘n’ dimensions, rather than a single-dimension continuum. (f) Scale construction techniques: Following are the five main techniques by which scales can be developed.
(i) Arbitrary approach: It is an approach where scale is developed on ad hoc basis. This is the most widely used approach. It is presumed that such scales measure the concepts for which they have been designed, although there is little evidence to support such an assumption.
(ii) Consensus approach: Here a panel of judges evaluate the items chosen for inclusion in the instrument in terms of whether they are relevant to the topic area and unambiguous in implication.
(iii) Item analysis approach: Under it a number of individual items are developed into a test which is given to a group of respondents. After administering the test, the total scores are calculated for every one.
(iv) Cumulative scales are chosen on the basis of their conforming to some ranking of items with ascending and descending discriminating power.
(v) Factor scales may be constructed on the basis of inter correlations of items which indicate that a common factor accounts for the relationship between items. This relationship is typically measured through factor analysis method.
Important Scaling TechniquesRating scales: The rating scale involves qualitative description of a limited number of aspects of a thing or of traits of a
person. When we use rating scales (or categorical scales), we judge an object in absolute terms against some specified criteria i.e., we judge properties of objects without reference to other similar objects. These ratings may be in such forms as “like-dislike”, “above average, average, below average”, or other classifications with more categories such as “like very much—like some what—neutral—dislike somewhat—dislike very much”; “excellent—good—average—below average—poor”, “always—often—occasionally—rarely—never”, and so on. There is no specificrule whether to use a two-points scale, three-points scale or scale with still more points.
Ranking scales: Under ranking scales (or comparative scales) we make relative judgements against other similar objects. The respondents under this method directly compare two or more objects and make choices among them. There are two generally used approaches of ranking scales viz.
(a) Method of paired comparisons: Under it the respondent can express his attitude by making a choice between two objects, say between a new flavour of soft drink and an established brand of drink. But when there are more than two stimuli to judge, the number of judgements required in a paired comparison is given by the formula:
N n b n 1g2
where N = number of judgementsn = number of stimuli or objects to be judged.
(b) Method of rank order: Under this method of comparative scaling, the respondents are asked to rank their choices. This method is easier and faster than the method of paired comparisons stated above. For example, with 10 items it takes 45 pair comparisons to complete the task, whereas the method of rank order simply requires ranking of 10 items only.
Summated scales (or Likert-type scales) are developed by utilizing the item analysis approach wherein a particular item is evaluated on the basis of how well it discriminates between those persons whose total score is high and those whose score is low. Those items or statements that best meet this sort of discrimination test are included in the final instrument. For example, when asked to express opinion whether one considers his job quite pleasant, the respondent may respond in any one of the following ways: (i) strongly agree, (ii) agree, (iii) undecided, (iv) disagree, (v) strongly disagree.
25
Processing and Analysis of DataThe data, after collection, has to be processed and analysed in accordance with the outline laid down for
the purpose at the time of developing the research plan. This is essential for a scientific study and for ensuring that we have all relevant data for making contemplated comparisons and analysis. Technically speaking, processing implies editing, coding, classification and tabulation of collected data so that they are amenable to analysis.
PROCESSING OPERATIONSWith this brief introduction concerning the concepts of processing and analysis, we can now proceed
with the explanation of all the processing operations.
1. Editing: Editing of data is a process of examining the collected raw data (specially in surveys) to detect errors and omissions and to correct these when possible. As a matter of fact, editing involves a careful scrutiny of the completed questionnaires and/or schedules.2. Coding: Coding refers to the process of assigning numerals or other symbols to answers so that responses can be put into a limited number of categories or classes. Such classes should be appropriate to the research problem under consideration.3. Classification: Most research studies result in a large volume of raw data which must be reduced into homogeneous groups if we are to get meaningful relationships. This fact necessitates classification of data which happens to be the process of arranging data in groups or classes on the basis of common characteristics.
Classification according to attributes: As stated above, data are classified on the basis of common characteristics which can either be descriptive (such as literacy, sex, honesty, etc.) or numerical (such as weight, height, income, etc.). Classification according to class-intervals
4. Tabulation: When a mass of data has been assembled, it becomes necessary for the researcher to arrange the same in some kind of concise and logical order.
Tabulation is essential because of the following reasons.
1. It conserves space and reduces explanatory and descriptive statement to a minimum.
2. It facilitates the process of comparison.
3. It facilitates the summation of items and the detection of errors and omissions.
4. It provides a basis for various statistical computations. Generally accepted principles of tabulation: Such principles of tabulation, particularly of constructing
statistical tables, can be briefly states as follows:*
1. Every table should have a clear, concise and adequate title so as to make the table intelligible without reference to the text and this title should always be placed just above the body of the table.
2. Every table should be given a distinct number to facilitate easy reference.
3. The column headings (captions) and the row headings (stubs) of the table should be clear and brief.
4. The units of measurement under each heading or sub-heading must always be indicated. 26
5. Explanatory footnotes, if any, concerning the table should be placed directly beneath the table, along with the reference symbols used in the table.
6. Source or sources from where the data in the table have been obtained must be indicated just below the table.
7. Usually the columns are separated from one another by lines which make the table more readable and attractive. Lines are always drawn at the top and bottom of the table and below the captions.
8. There should be thick lines to separate the data under one class from the data under another class and the lines separating the sub-divisions of the classes should be comparatively thin lines.
9. The columns may be numbered to facilitate reference.
10. Those columns whose data are to be compared should be kept side by side. Similarly, percentages and/or averages must also be kept close to the data.
11. It is generally considered better to approximate figures before tabulation as the same would reduce unnecessary details in the table itself.
12. In order to emphasise the relative significance of certain categories, different kinds of type, spacing and indentations may be used.
13. It is important that all column figures be properly aligned. Decimal points and (+) or (–) signs should be in perfect alignment.
14. Abbreviations should be avoided to the extent possible and ditto marks should not be used in the table.
15. Miscellaneous and exceptional items, if any, should be usually placed in the last row of the table.
16. Table should be made as logical, clear, accurate and simple as possible. If the data happen to be very large, they should not be crowded in a single table for that would make the table unwieldy and inconvenient.
17. Total of rows should normally be placed in the extreme right column and that of columns should be placed at the bottom.
ELEMENTS/TYPES OF ANALYSIS“ Descriptive analysis is largely the study of distributions of one variable. This study provides us
with profiles of companies, work groups, persons and other subjects on any of a multiple of characteristics such as size. Composition, efficiency, preferences, etc.” this sort of analysis may be in respect of one variable (described as unidimensional analysis), or in respect of two variables (described as bivariate analysis) or in respect of more than two variables (described as multivariate analysis). In this context we work out various measures that show the size and shape of a distribution(s) along with the study of measuring relationships between two or more variables. We may as well talk of correlation analysis and
27
causal analysis. Correlation analysis studies the joint variation of two or more variables for determining the amount of correlation between two or more variables. Causal analysis is concerned with the study of how one or more variables affect changes in another variable.
In modern times, with the availability of computer facilities, there has been a rapid development of multivariate analysis which may be defined as “all statistical methods which simultaneously analyse more than two variables on a sample of observations”
(a) Multiple regression analysis: This analysis is adopted when the researcher has one dependent variable which is presumed to be a function of two or more independent variables. The objective of this analysis is to make a prediction about the dependent variable based on its covariance with all the concerned independent variables.
(b) Multiple discriminate analysis: This analysis is appropriate when the researcher has a single dependent variable that cannot be measured, but can be classified into two or more groups on the basis of some attribute. The object of this analysis happens to be to predict an entity’s possibility of belonging to a particular group based on several predictor variables.
(c) Multivariate analysis of variance (or multi-ANOVA): This analysis is an extension of two-way ANOVA, wherein the ratio of among group variance to within group variance is worked out on a set of variables.
Canonical analysis: This analysis can be used in case of both measurable and non-measurable variables for the purpose of simultaneously predicting a set of dependent variables from their joint covariance with a set of independent variables.
Inferential analysis is concerned with the various tests of significance for testing hypotheses in order to determine with what validity data can be said to indicate some conclusion or conclusions. It is also concerned with the estimation of population values. It is mainly on the basis of inferential analysis that the task of interpretation (i.e., the task of drawing inferences and conclusions) is performed.
STATISTICS IN RESEARCHThe role of statistics in research is to function as a tool in designing research, analysing its data and
drawing conclusions there from.there are two major areas of statistics viz., descriptive statistics and inferential statistics. Descriptive
statistics concern the development of certain indices from the raw data, whereas inferential statistics concern with the process of generalisation. Inferential statistics are also known as sampling statistics and are mainly concerned with two major type of problems: (i) the estimation of population parameters, and (ii) the testing of statistical hypotheses.
The important statistical measures* that are used to summarise the survey/research data are:
(1) measures of central tendency or statistical averages; (2) measures of dispersion; (3) measures of asymmetry (skewness); (4) measures of relationship; and (5) other measures.
Amongst the measures of central tendency, the three most important ones are the arithmetic average or mean, median and mode. Geometric mean and harmonic mean are also sometimes used.
From among the measures of dispersion, variance, and its square root—the standard deviation are the most often used measures. Other measures such as mean deviation, range, etc. are also used. For comparison
28
purpose, we use mostly the coefficient of standard deviation or the coefficient of variation.
In respect of the measures of skewness and kurtosis, we mostly use the first measure of skewness based on mean and mode or on mean and median. Other measures of skewness, based on quartiles or on the methods of moments, are also used sometimes. Kurtosis is also used to measure the peakedness of the curve of the frequency distribution.
Amongst the measures of relationship, Karl Pearson’s coefficient of correlation is the frequently used measure in case of statistics of variables, whereas Yule’s coefficient of association is used in case of statistics of attributes. Multiple correlation coefficient, partial correlation coefficient, regression analysis, etc., are other important measures often used by a researcher.
Index numbers, analysis of time series, coefficient of contingency, etc., are other measures that may as well be used by a researcher, depending upon the nature of the problem under study.
We give below a brief outline of some important measures (our of the above listed measures) often used in the context of research studies.
MEASURES OF CENTRAL TENDENCYMeasures of central tendency (or statistical averages) tell us the point about which items have a tendency
to cluster. Such a measure is considered as the most representative figure for the entire mass of data. Measure of central tendency is also known as statistical average. Mean, median and mode are the most popular averages. Mean, also known as arithmetic average, is the most common measure of central tendency and may be defined as the value which we get by dividing the total of the values of various given items in a series by the total number of items.
MEASURES OF DISPERSIONAn averages can represent a series only as best as a single figure can, but it certainly cannot reveal the
entire story of any phenomenon under study. Specially it fails to give any idea about the scatter of the values of items of a variable in the series around the true value of average. In order to measure this scatter, statistical devices called measures of dispersion are calculated. Important measures of dispersion are (a) range, (b) mean deviation, and (c) standard deviation.
MEASURES OF RELATIONSHIPSo far we have dealt with those statistical measures that we use in context of univariate population
i.e., the population consisting of measurement of only one variable. But if we have the data on two variables, we are said to have a bivariate population and if the data happen to be on more than two variables, the population is known as multivariate population. If for every measurement of a variable, X, we have corresponding value of a second variable, Y, the resulting pairs of values are called a bivariate population. In addition, we may also have a corresponding value of the third variable, Z, or the forth variable, W, and so on, the resulting pairs of values are called a multivariate population. In case of bivariate or multivariate populations, we often wish to know the relation of the two and/or more variables in the data to one another.
In case of bivariate population: Correlation can be studied through (a) cross tabulation;
(b) Charles Spearman’s coefficient of correlation; (c) Karl Pearson’s coefficient of correlation; whereas cause and effect relationship can be studied through simple regression equations.
29
In case of multivariate population: Correlation can be studied through (a) coefficient of multiple correlation; (b) coefficient of partial correlation; whereas cause and effect relationship can be studied through multiple regression equations. We can now briefly take up the above methods one by one.
Cross tabulation approach is specially useful when the data are in nominal form. Under it we classify each variable into two or more categories and then cross classify the variables in these sub-categories. Then we look for interactions between them which may be symmetrical, reciprocal or asymmetrical. A symmetrical relationship is one in which the two variables vary together, but we assume that neither variable is due to the other.Charles Spearman’ s coefficient of correlation (or rank correlation) is the technique of determining the degree of correlation between two variables in case of ordinal data where ranks are given to the different values of the variables. The main objective of this coefficient is to determine the extent to which the two sets of ranking are similar or dissimilar.
Karl Pearson’s coefficient of correlation (or simple correlation) is the most widely used method of measuring the degree of relationship between two variables. This coefficient assumes the following:
(i) that there is linear relationship between the two variables; (ii) that the two variables are casually related which means that one of the variables is independent and
the other one is dependent; and (iii) a large number of independent causes are operating in both variables so as to produce a normal distribution. Karl Pearson’s coefficient of correlation is also known as the product moment correlation coefficient.
SIMPLE REGRESSION ANALYSISRegression is the determination of a statistical relationship between two or more variables. In simple
regression, we have only two variables, one variable (defined as independent) is the cause of the behaviour of another one (defined as dependent variable). Regression can only interpret what exists physically i.e., there must be a physical way in which independent variable X can affect dependent variable Y.
MULTIPLE CORRELATION AND REGRESSIONWhen there are two or more than two independent variables, the analysis concerning relationship is
known as multiple correlation and the equation describing such relationship as the multiple regression equation. We here explain multiple correlation and regression taking only two independent variables and one dependent variable (Convenient computer programs exist for dealing with a great number of variables).
PARTIAL CORRELATION Partial correlation measures separately the relationship between two variables in such a way that the
effects of other related variables are eliminated. In other words, in partial correlation analysis, we aim at measuring the relation between a dependent variable and a particular independent variable by holding all other variables constant. Thus, each partial coefficient of correlation measures the effect of its independent variable on the dependent variable.
INTERPRETATION AND REPORT WRITINGInterpretation refers to the task of drawing inferences from the collected facts after an analytical
30
and/or experimental study. In fact, it is a search for broader meaning of research findings. The task of interpretation has two major aspects viz., (i) the effort to establish continuity in research through linking the results of a given study with those of another, and (ii) the establishment of some explanatory concepts. “In one sense, interpretation is concerned with relationships within the collected data, partially overlapping analysis. Interpretation also extends beyond the data of the study to include the results of other research, theory and hypotheses.”
TECHNIQUE OF INTERPRETATION
The technique of interpretation often involves the following steps:
(i) Researcher must give reasonable explanations of the relations which he has found and he must interpret the lines of relationship in terms of the underlying processes and must try to find out the thread of uniformity that lies under the surface layer of his diversified research findings. In fact, this is the technique of how generalization should be done and concepts be formulated.
(ii) Extraneous information, if collected during the study, must be considered while interpreting the final results of research study, for it may prove to be a key factor in understanding the problem under consideration.
(iii) It is advisable, before embarking upon final interpretation, to consult someone having insight into the study and who is frank and honest and will not hesitate to point out omissions and errors in logical argumentation. Such a consultation will result in correct interpretation and, thus, will enhance the utility of research results.
(iv) Researcher must accomplish the task of interpretation only after considering all relevant factors affecting the problem to avoid false generalization. He must be in no hurry while interpreting results, for quite often the conclusions, which appear to be all right at the beginning, may not at all be accurate.
SIGNIFICANCE OF REPORT WRITING
Research report is considered a major component of the research study for the research task remains incomplete till the report has been presented and/or written. As a matter of fact even the most brilliant hypothesis, highly well designed and conducted research study, and the most striking generalizations and findings are of little value unless they are effectively communicated to others. The purpose of research is not well served unless the findings are made known to others. Research results must invariably enter the general store of knowledge. All this explains the significance of writing research report. There are people who do not consider writing of report as an integral part of the research process. But the general opinion is in favour of treating the presentation of research results or the writing of report as part and parcel of the research project. Writing of report is the last step in a research study and requires a set of skills somewhat different from those called for in respect of the earlier stages of research.
DIFFERENT STEPS IN WRITING REPORT
Research reports are the product of slow, painstaking, accurate inductive work. The usual steps involved in writing report are: (a) logical analysis of the subject-matter; (b) preparation of the final outline; (c) preparation of the rough draft; (d) rewriting and polishing; (c) preparation of the final bibliography; and (f) writing the final draft. Though all these steps are self explanatory, yet a brief mention of each one of these will be appropriate for better understanding.
Logical analysis of the subject matter: It is the first step which is primarily concerned with the development of a subject. There are two ways in which to develop a subject (a) logically and
(b) chronologically. The logical development is made on the basis of mental connections and associations between the one thing and another by means of analysis. Logical treatment often consists in
31
developing the material from the simple possible to the most complex structures. Chronological development is based on a connection or sequence in time or occurrence. The directions for doing or making something usually follow the chronological order.
Preparation of the final outline: It is the next step in writing the research report “Outlines are the framework upon which long written works are constructed. They are an aid to the logical organisation of the material and a reminder of the points to be stressed in the report.” 3
Preparation of the rough draft: This follows the logical analysis of the subject and the preparation of the final outline. Such a step is of utmost importance for the researcher now sits to write down what he has done in the context of his research study. He will write down the procedure adopted by him in collecting the material for his study along with various limitations faced by him, the technique of analysis adopted by him, the broad findings and generalizations and the various suggestions he wants to offer regarding the problem concerned.
Rewriting and polishing of the rough draft: This step happens to be most difficult part of all formal writing. Usually this step requires more time than the writing of the rough draft. The careful revision makes the difference between a mediocre and a good piece of writing. While rewriting and polishing, one should check the report for weaknesses in logical development or presentation. The researcher should also “see whether or not the material, as it is presented, has unity and cohesion; does the report stand upright and firm and exhibit a definite pattern, like a marble arch? Or does it resemble an old wall of moldering cement and loose brick.” 4 In addition the researcher should give due attention to the fact that in his rough draft he has been consistent or not. He should check the mechanics of writing—grammar, spelling and usage.
Preparation of the final bibliography: Next in order comes the task of the preparation of the final bibliography. The bibliography, which is generally appended to the research report, is a list of books.
The bibliography should be arranged alphabetically and may be divided into two parts; the first part may contain the names of books and pamphlets, and the second part may contain the names of magazine and newspaper articles. Generally, this pattern of bibliography is considered convenient and satisfactory from the point of view of reader, though it is not the only way of presenting bibliography. The entries in bibliography should be made adopting the following order:
For books and pamphlets the order may be as under:1. Name of author, last name first. 2. Title, underlined to indicate italics. 3. Place, publisher, and date of publication. 4. Number of volumes.
ExampleKothari, C.R., Quantitative Techniques, New Delhi, Vikas Publishing House Pvt. Ltd., 1978.
For magazines and newspapers the order may be as under:1. Name of the author, last name first. 2. Title of article, in quotation marks. 3. Name of periodical, underlined to indicate italics. 4. The volume or volume and number. 5. The date of the issue. 6. The pagination.
Example
Robert V. Roosa, “Coping with Short-term International Money Flows”, The Banker, London, September, 1971, p. 995.
The above examples are just the samples for bibliography entries and may be used, but one should also remember that they are not the only acceptable forms. The only thing important is that, whatever method one selects, it must remain consistent.
32
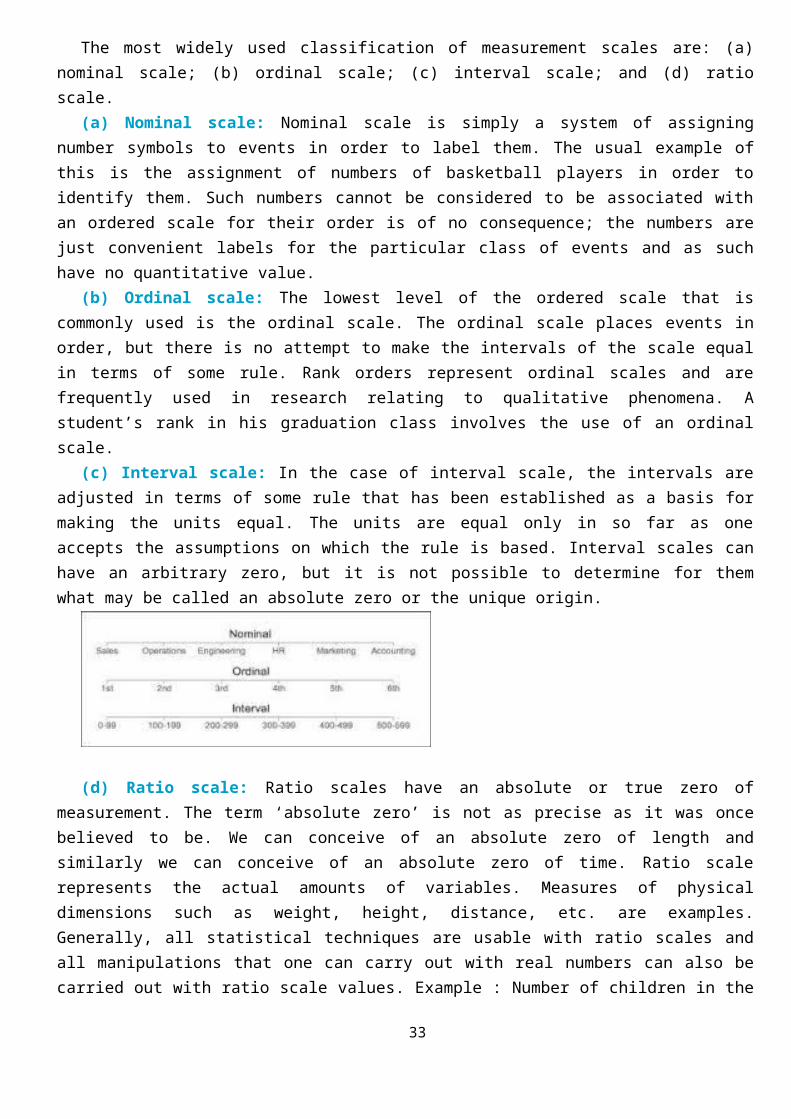
Writing the final draft: This constitutes the last step. The final draft should be written in a concise and objective style and in simple language, avoiding vague expressions such as “it seems”, “there may be”, and the like ones. While writing the final draft, the researcher must avoid abstract terminology and technical jargon. Illustrations and examples based on common experiences must be incorporated in the final draft as they happen to be most effective in communicating the research findings to others.
LAYOUT OF THE RESEARCH REPORTThe layout of the report means as to what the research report should contain. A comprehensive layout of
the research report should comprise (A) preliminary pages; (B) the main text; and (C) the end matter. Let us deal with them separately.
(A) Preliminary Pages - In its preliminary pages the report should carry a title and date, followed by acknowledgements in the form of ‘Preface’ or ‘Foreword’. Then there should be a table of contents followed by list of tables and illustrations so that the decision-maker or anybody interested in reading the report can easily locate the required information in the report.
(B) Main Text - The main text provides the complete outline of the research report along with all details. Title of the research study is repeated at the top of the first page of the main text and then follows the other details on pages numbered consecutively, beginning with the second page. Each main section of the report should begin on a new page. The main text of the report should have the following sections: (i) Introduction; (ii) Statement of findings and recommendations; (iii) The results; (iv) The implications drawn from the results; and (v) The summary.
(i) Introduction: The purpose of introduction is to introduce the research project to the readers. It should contain a clear statement of the objectives of research i.e., enough background should be given to make clear to the reader why the problem was considered worth investigating.
(ii) Statement of findings and recommendations: After introduction, the research report must contain a statement of findings and recommendations in non-technical language so that it can be easily understood by all concerned. If the findings happen to be extensive, at this point they should be put in the summarised form.
Results: A detailed presentation of the findings of the study, with supporting data in the form of tables and charts together with a validation of results, is the next step in writing the main text of the report.
TYPES OF REPORTS(A) Technical Report - In the technical report the main emphasis is on (i) the methods employed, (it)
assumptions made in the course of the study, (iii) the detailed presentation of the findings including their limitations and supporting data.
A general outline of a technical report can be as follows:
1. Summary of results: A brief review of the main findings just in two or three pages.
2. Nature of the study: Description of the general objectives of study, formulation of the problem in operational terms, the working hypothesis, the type of analysis and data required, etc. 3. Methods employed: Specific methods used in the study and their limitations. For instance, in sampling studies we should give details of sample design viz., sample size, sample selection, etc. 4. Data: Discussion of data collected, their sources, characteristics and limitations. If secondary data are used, their suitability to the problem at hand be fully assessed. In case of a survey, the manner in which data were collected should be fully described. 5. Analysis of data and presentation of findings: The analysis of data and presentation of the findings of the study with supporting data in the form of tables and charts be fully narrated. This, in fact, happens to be the main body of the report usually extending over several chapters. 6. Conclusions: A detailed summary of the findings and the policy implications drawn from the results be explained. 7. Bibliography: Bibliography of various sources consulted be prepared and attached.
8. Technical appendices: Appendices be given for all technical matters relating to questionnaire,
33
mathematical derivations, elaboration on particular technique of analysis and the like ones. 9. Index: Index must be prepared and be given invariably in the report at the end.
(B) Popular Report
The popular report is one which gives emphasis on simplicity and attractiveness. The simplification should be sought through clear writing, minimization of technical, particularly mathematical, details and liberal use of charts and diagrams.
We give below a general outline of a popular report.1. The findings and their implications: Emphasis in the report is given on the findings of most practical interest and on the implications of these findings.
2. Recommendations for action: Recommendations for action on the basis of the findings of the study is made in this section of the report.
3. Objective of the study: A general review of how the problem arise is presented along with the specific objectives of the project under study.
4. Methods employed: A brief and non-technical description of the methods and techniques used, including a short review of the data on which the study is based, is given in this part of the report.
5. Results: This section constitutes the main body of the report wherein the results of the study are presented in clear and non-technical terms with liberal use of all sorts of illustrations such as charts, diagrams and the like ones.
6. Technical appendices: More detailed information on methods used, forms, etc. is presented in the form of appendices. But the appendices are often not detailed if the report is entirely meant for general public.
MECHANICS OF WRITING A RESEARCH REPORTThere are very definite and set rules which should be followed in the actual preparation of the research
report or paper. Once the techniques are finally decided, they should be scrupulously adhered to, and no deviation permitted. The criteria of format should be decided as soon as the materials for the research paper have been assembled. The following points deserve mention so far as the mechanics of writing a report are concerned:
1. Size and physical design: The manuscript should be written on unruled paper 8 1 2 × 11 in size. If it is to be written by hand, then black or blue-black ink should be used. A margin of at least one and one-half inches should be allowed at the left hand and of at least half an inch at the right hand of the paper. There should also be one-inch margins, top and bottom. The paper should be neat and legible. If the manuscript is to be typed, then all typing should be double-spaced on one side of the page only except for the insertion of the long quotations.2. Procedure: Various steps in writing the report should be strictly adhered (All such steps have already been explained earlier in this chapter). 3. Layout: Keeping in view the objective and nature of the problem, the layout of the report should be thought of and decided and accordingly adopted (The layout of the research report and various types of reports have been described in this chapter earlier which should be taken as a guide for report-writing in case of a particular problem).4. Treatment of quotations: Quotations should be placed in quotation marks and double spaced, forming an immediate part of the text. But if a quotation is of a considerable length (more than four or five type written lines) then it should be single-spaced and indented at least half an inch to the right of the normal text margin. 5. The footnotes: Regarding footnotes one should keep in view the followings:
The footnotes serve two purposes viz., the identification of materials used in quotations in the report and the notice of materials not immediately necessary to the body of the research text but still of supplemental value. In other words, footnotes are meant for cross references, citation of authorities and sources, acknowledgement and elucidation or explanation of a point of view.6. Documentation style: Regarding documentation, the first footnote reference to any given work should be complete in its documentation, giving all the essential facts about the edition used. Such documentary
34
footnotes follow a general sequence. The common order may be described as under:
(i) Regarding the single-volume reference
1. Author’s name in normal order (and not beginning with the last name as in a bibliography) followed by a comma;
2. Title of work, underlined to indicate italics; 3. Place and date of publication; 4. Pagination references (The page number).
ExampleJohn Gassner, Masters of the Drama, New York: Dover Publications, Inc. 1954, p. 315.
(ii) Regarding multivolumed reference
1. Author’s name in the normal order; 2. Title of work, underlined to indicate italics; 3. Place and date of publication; 4. Number of volume; 5. Pagination references (The page number).
(iii) Regarding works arranged alphabetically
For works arranged alphabetically such as encyclopedias and dictionaries, no pagination reference is usually needed. In such cases the order is illustrated as under:
Example 1“Salamanca,” Encyclopaedia Britannica, 14th Edition.
Example 2“Mary Wollstonecraft Godwin,” Dictionary of national biography.
But if there should be a detailed reference to a long encyclopedia article, volume and pagination reference may be found necessary.
(iv) Regarding periodicals reference
1. Name of the author in normal order; 2. Title of article, in quotation marks; 3. Name of periodical, underlined to indicate italics; 4. Volume number; 5. Date of issuance; 6. Pagination.
(v) Regarding anthologies and collections reference
Quotations from anthologies or collections of literary works must be acknowledged not only by author, but also by the name of the collector.
(vi) Regarding second-hand quotations referenceIn such cases the documentation should be handled as follows:
1. Original author and title; 2. “quoted or cited in,”; 3. Second author and work.
Example
J.F. Jones, Life in Ploynesia, p. 16, quoted in History of the Pacific Ocean area, by R.B. Abel, p. 191.
(vii) Case of multiple authorship
35
If there are more than two authors or editors, then in the documentation the name of only the first is given and the multiple authorship is indicated by “et al.” or “and others”.
Subsequent references to the same work need not be so detailed as stated above. If the work is cited again without any other work intervening, it may be indicated as ibid, followed by a comma and
7. Punctuation and abbreviations in footnotes: The first item after the number in the footnote is the author’s name, given in the normal signature order. This is followed by a comma. After the comma, the title of the book is given: the article (such as “A”, “An”, “The” etc.) is omitted and only the first word and proper nouns and adjectives are capitalized. The title is followed by a comma. Information concerning the edition is given next.9. The final draft: Revising and rewriting the rough draft of the report should be done with great care before writing the final draft. For the purpose, the researcher should put to himself questions like: Are the sentences written in the report clear? Are they grammatically correct? Do they say what is meant’? Do the various points incorporated in the report fit together logically? “10.Bibliography: Bibliography should be prepared and appended to the research report as discussed earlier.
Preparation of the index: At the end of the report, an index should invariably be given, the value of which lies in the fact that it acts as a good guide, to the reader. Index may be prepared both as subject index and as author index.
***
36