Fact Book 2010 2011 - Tusculum Collegeweb.tusculum.edu/.../uploads/2013/07/FACT-BOOK-2010-11.pdfFact...
14
Fact Book 2010 – 2011
Transcript of Fact Book 2010 2011 - Tusculum Collegeweb.tusculum.edu/.../uploads/2013/07/FACT-BOOK-2010-11.pdfFact...
Fact Book
2010 – 2011
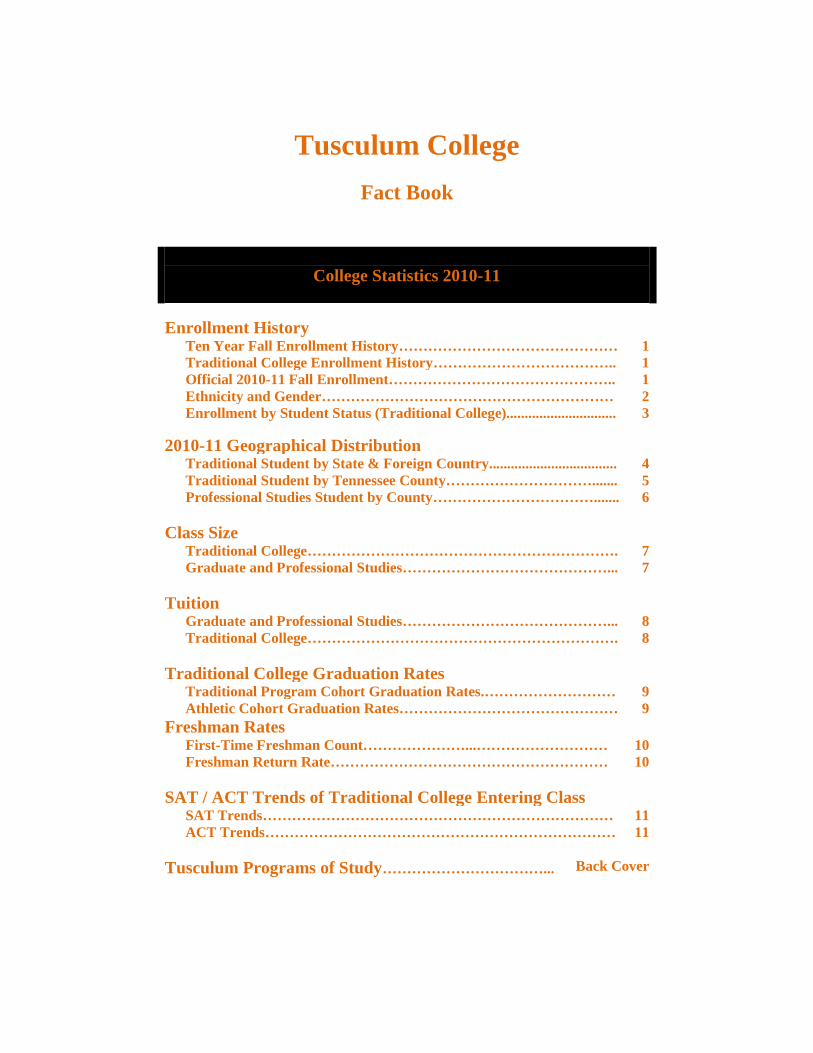
Tusculum College
Fact Book
College Statistics 2010-11
Enrollment History
Ten Year Fall Enrollment History……………………………………… 1
Traditional College Enrollment History……………………………….. 1
Official 2010-11 Fall Enrollment……………………………………….. 1
Ethnicity and Gender…………………………………………………… 2
Enrollment by Student Status (Traditional College).............................. 3
2010-11 Geographical Distribution
Traditional Student by State & Foreign Country................................... 4
Traditional Student by Tennessee County…………………………....... 5
Professional Studies Student by County……………………………....... 6
Class Size
Traditional College………………………………………………………. 7
Graduate and Professional Studies……………………………………... 7
Tuition
Graduate and Professional Studies……………………………………... 8
Traditional College………………………………………………………. 8
Traditional College Graduation Rates
Traditional Program Cohort Graduation Rates.……………………… 9
Athletic Cohort Graduation Rates……………………………………… 9
Freshman Rates
First-Time Freshman Count…………………...……………………… 10
Freshman Return Rate………………………………………………… 10
SAT / ACT Trends of Traditional College Entering Class
SAT Trends……………………………………………………………… 11
ACT Trends……………………………………………………………… 11
Tusculum Programs of Study……………………………...
Back Cover
1
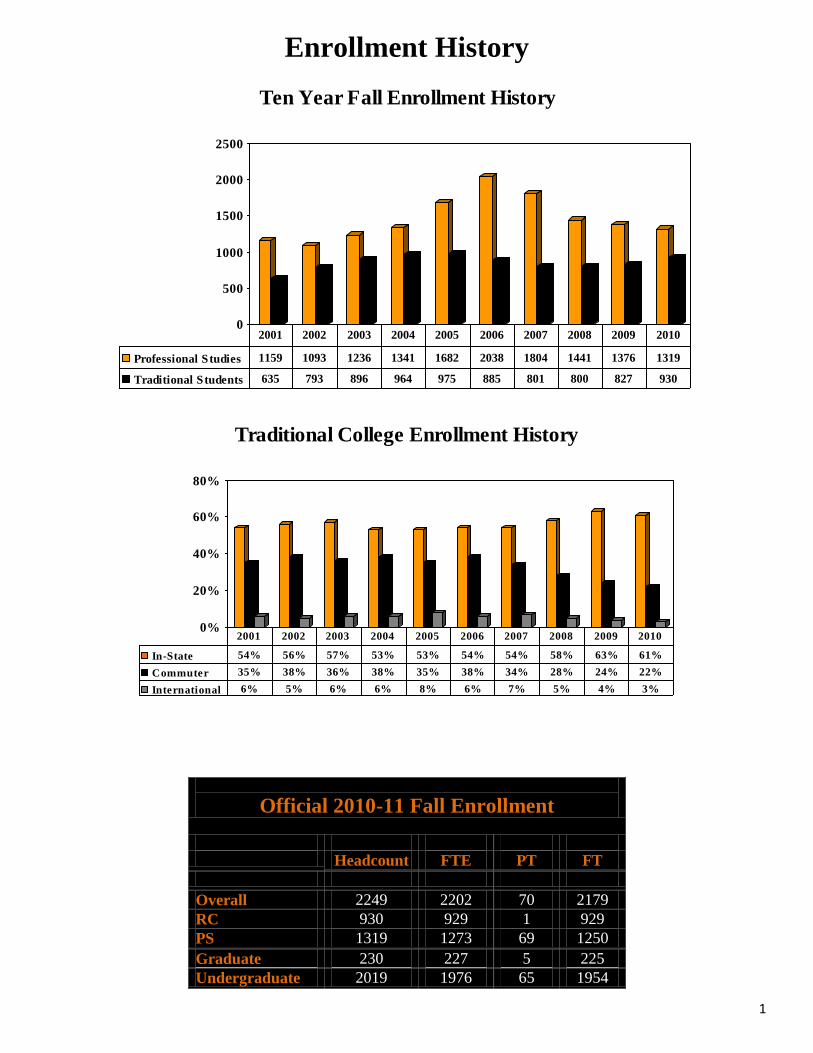
Enrollment History
Official 2010-11 Fall Enrollment
Headcount FTE PT FT
Overall 2249 2202 70 2179
RC 930 929 1 929
PS 1319 1273 69 1250
Graduate 230 227 5 225
Undergraduate 2019 1976 65 1954
0%
20%
40%
60%
80%
Traditional College Enrollment History
In-State 54% 56% 57% 53% 53% 54% 54% 58% 63% 61%
Commuter 35% 38% 36% 38% 35% 38% 34% 28% 24% 22%
International 6% 5% 6% 6% 8% 6% 7% 5% 4% 3%
2001 2002 2003 2004 2005 2006 2007 2008 2009 2010
0
500
1000
1500
2000
2500
Ten Year Fall Enrollment History
Professional Studies 1159 1093 1236 1341 1682 2038 1804 1441 1376 1319
Traditional Students 635 793 896 964 975 885 801 800 827 930
2001 2002 2003 2004 2005 2006 2007 2008 2009 2010
2
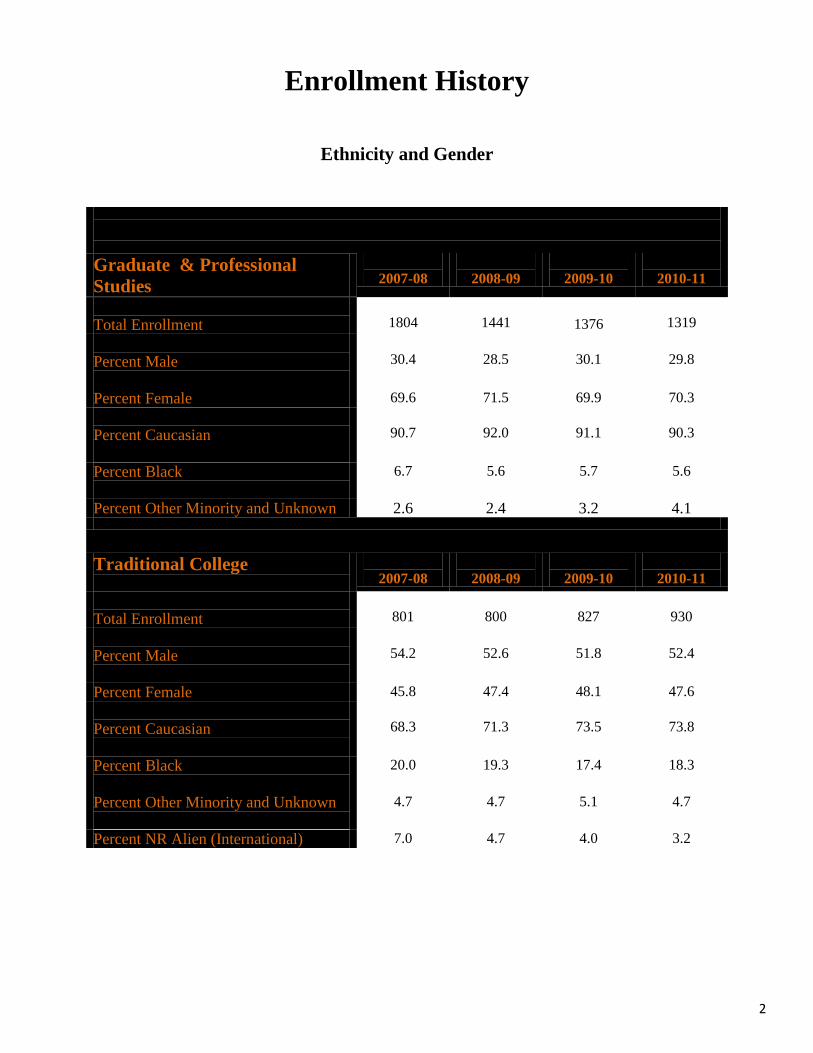
Enrollment History
Ethnicity and Gender
Graduate & Professional
Studies
2007-08
2008-09
2009-10
2010-11
Total Enrollment
1804
1441
1376
1319
Percent Male
30.4
28.5
30.1
29.8
Percent Female 69.6 71.5 69.9 70.3
Percent Caucasian
90.7
92.0
91.1
90.3
Percent Black
6.7 5.6 5.7
5.6
Percent Other Minority and Unknown 2.6 2.4 3.2 4.1
Traditional College
2007-08
2008-09
2009-10
2010-11
Total Enrollment
801
800
827
930
Percent Male
54.2
52.6
51.8
52.4
Percent Female 45.8 47.4 48.1 47.6
Percent Caucasian
68.3
71.3
73.5
73.8
Percent Black
20.0 19.3 17.4
18.3
Percent Other Minority and Unknown
4.7 4.7 5.1 4.7
Percent NR Alien (International) 7.0 4.7 4.0 3.2
3
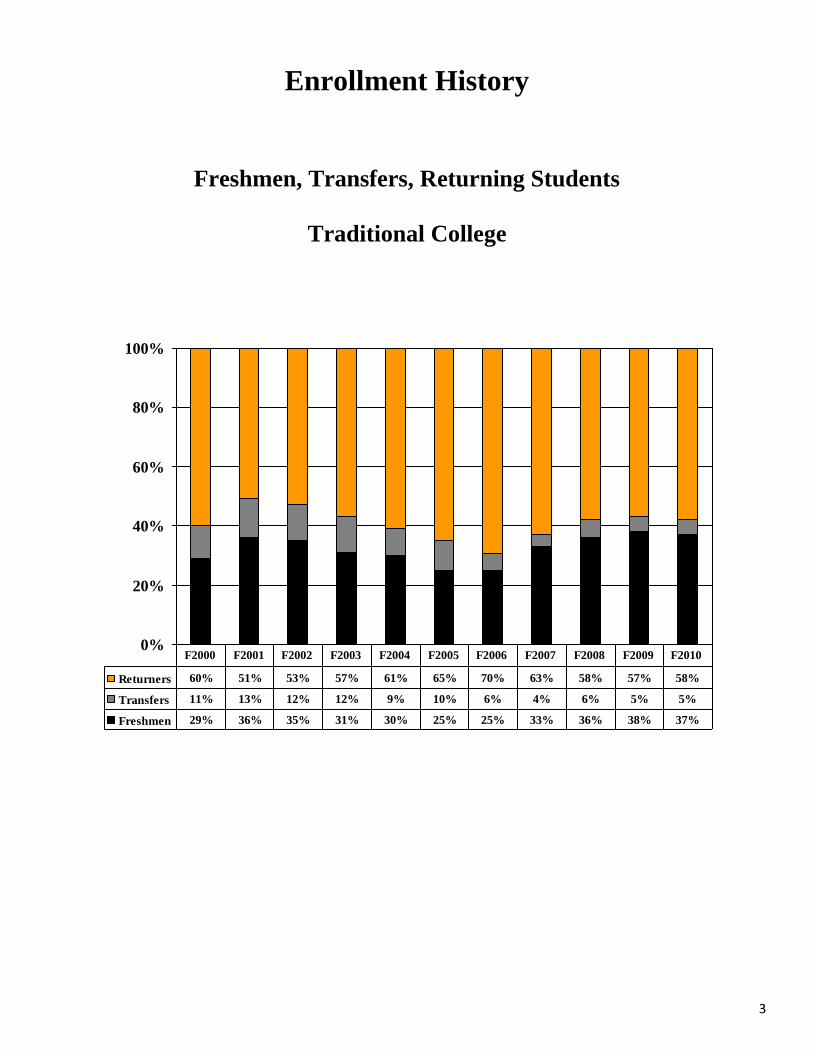
Enrollment History
Freshmen, Transfers, Returning Students
Traditional College
0%
20%
40%
60%
80%
100%
Returners 60% 51% 53% 57% 61% 65% 70% 63% 58% 57% 58%
Transfers 11% 13% 12% 12% 9% 10% 6% 4% 6% 5% 5%
Freshmen 29% 36% 35% 31% 30% 25% 25% 33% 36% 38% 37%
F2000 F2001 F2002 F2003 F2004 F2005 F2006 F2007 F2008 F2009 F2010
4
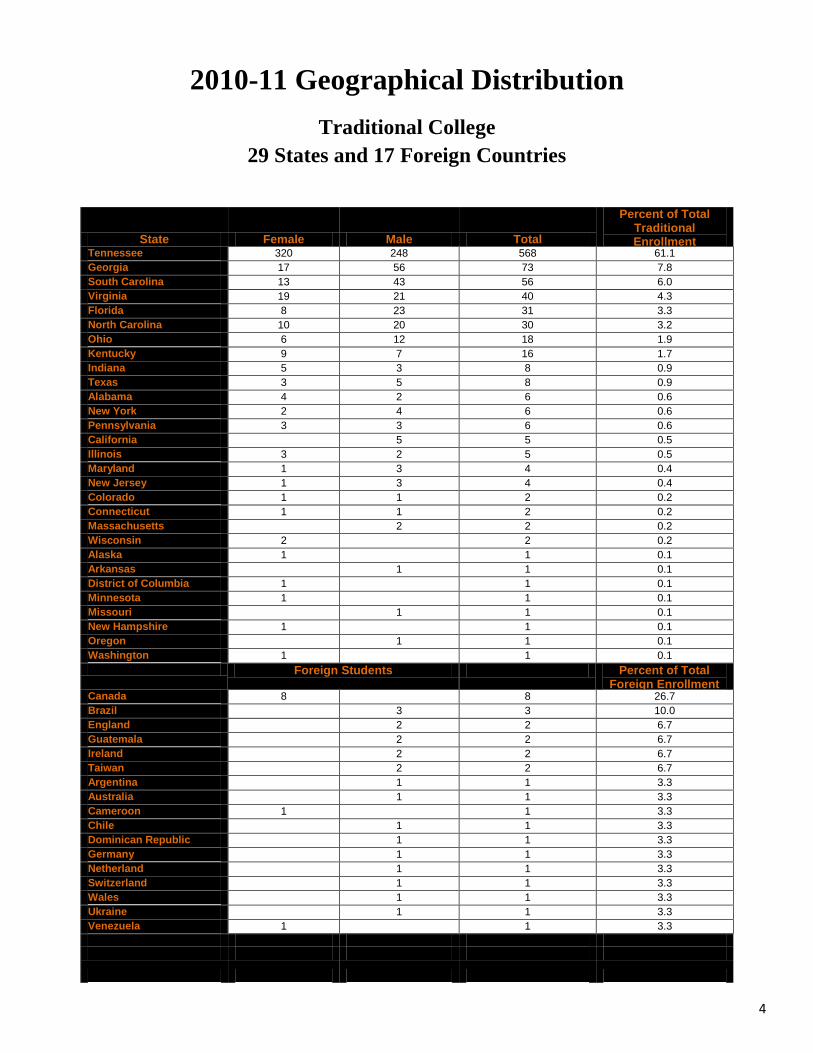
2010-11 Geographical Distribution
Traditional College
29 States and 17 Foreign Countries
State Female Male Total
Percent of Total Traditional Enrollment
Tennessee 320 248 568 61.1
Georgia 17 56 73 7.8
South Carolina 13 43 56 6.0
Virginia 19 21 40 4.3
Florida 8 23 31 3.3
North Carolina 10 20 30 3.2
Ohio 6 12 18 1.9
Kentucky 9 7 16 1.7
Indiana 5 3 8 0.9
Texas 3 5 8 0.9
Alabama 4 2 6 0.6
New York 2 4 6 0.6
Pennsylvania 3 3 6 0.6
California 5 5 0.5
Illinois 3 2 5 0.5
Maryland 1 3 4 0.4
New Jersey 1 3 4 0.4
Colorado 1 1 2 0.2
Connecticut 1 1 2 0.2
Massachusetts 2 2 0.2
Wisconsin 2 2 0.2
Alaska 1 1 0.1
Arkansas 1 1 0.1
District of Columbia 1 1 0.1
Minnesota 1 1 0.1
Missouri 1 1 0.1
New Hampshire 1 1 0.1
Oregon 1 1 0.1
Washington 1 1 0.1
Foreign Students Percent of Total Foreign Enrollment
Canada 8 8 26.7
Brazil 3 3 10.0
England 2 2 6.7
Guatemala 2 2 6.7
Ireland 2 2 6.7
Taiwan 2 2 6.7
Argentina 1 1 3.3
Australia 1 1 3.3
Cameroon 1 1 3.3
Chile 1 1 3.3
Dominican Republic 1 1 3.3
Germany 1 1 3.3
Netherland 1 1 3.3
Switzerland 1 1 3.3
Wales 1 1 3.3
Ukraine 1 1 3.3
Venezuela 1 1 3.3
5
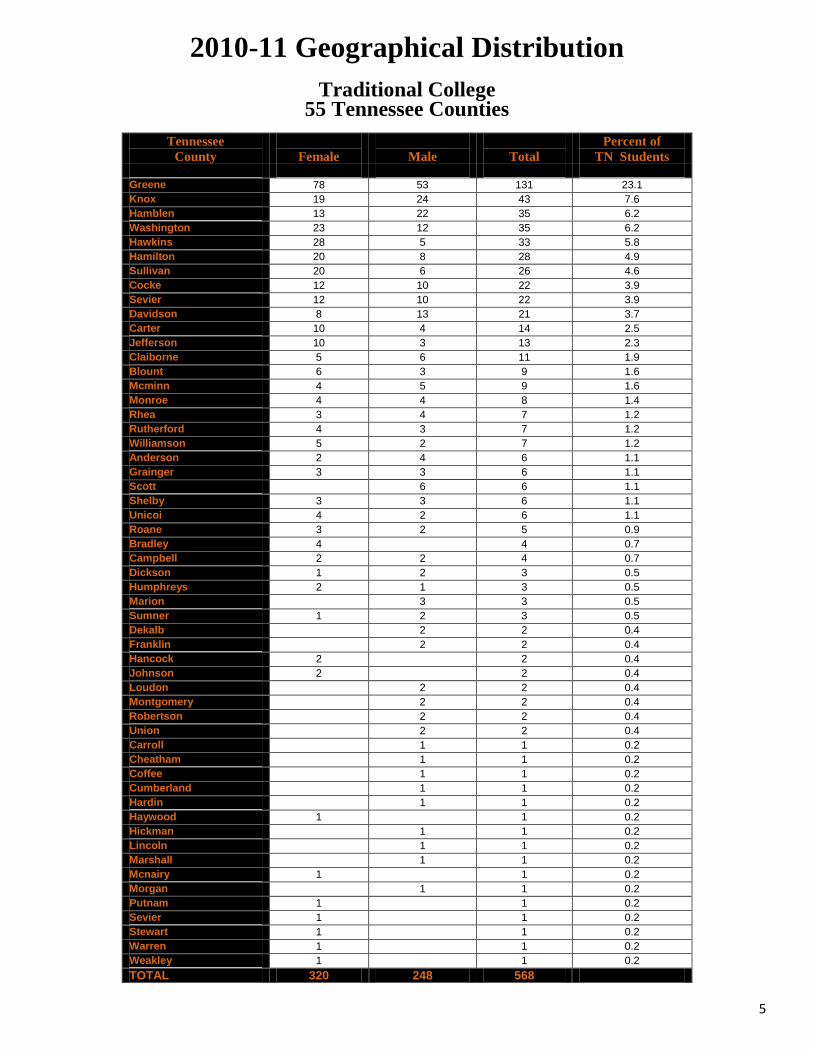
2010-11 Geographical Distribution
Traditional College
55 Tennessee Counties
Tennessee
County
Female
Male
Total
Percent of
TN Students Greene 78 53 131 23.1
Knox 19 24 43 7.6
Hamblen 13 22 35 6.2
Washington 23 12 35 6.2
Hawkins 28 5 33 5.8
Hamilton 20 8 28 4.9
Sullivan 20 6 26 4.6
Cocke 12 10 22 3.9
Sevier 12 10 22 3.9
Davidson 8 13 21 3.7
Carter 10 4 14 2.5
Jefferson 10 3 13 2.3
Claiborne 5 6 11 1.9
Blount 6 3 9 1.6
Mcminn 4 5 9 1.6
Monroe 4 4 8 1.4
Rhea 3 4 7 1.2
Rutherford 4 3 7 1.2
Williamson 5 2 7 1.2
Anderson 2 4 6 1.1
Grainger 3 3 6 1.1
Scott 6 6 1.1
Shelby 3 3 6 1.1
Unicoi 4 2 6 1.1
Roane 3 2 5 0.9
Bradley 4 4 0.7
Campbell 2 2 4 0.7
Dickson 1 2 3 0.5
Humphreys 2 1 3 0.5
Marion 3 3 0.5
Sumner 1 2 3 0.5
Dekalb 2 2 0.4
Franklin 2 2 0.4
Hancock 2 2 0.4
Johnson 2 2 0.4
Loudon 2 2 0.4
Montgomery 2 2 0.4
Robertson 2 2 0.4
Union 2 2 0.4
Carroll 1 1 0.2
Cheatham 1 1 0.2
Coffee 1 1 0.2
Cumberland 1 1 0.2
Hardin 1 1 0.2
Haywood 1 1 0.2
Hickman 1 1 0.2
Lincoln 1 1 0.2
Marshall 1 1 0.2
Mcnairy 1 1 0.2
Morgan 1 1 0.2
Putnam 1 1 0.2
Sevier 1 1 0.2
Stewart 1 1 0.2
Warren 1 1 0.2
Weakley 1 1 0.2
TOTAL 320 248 568
6
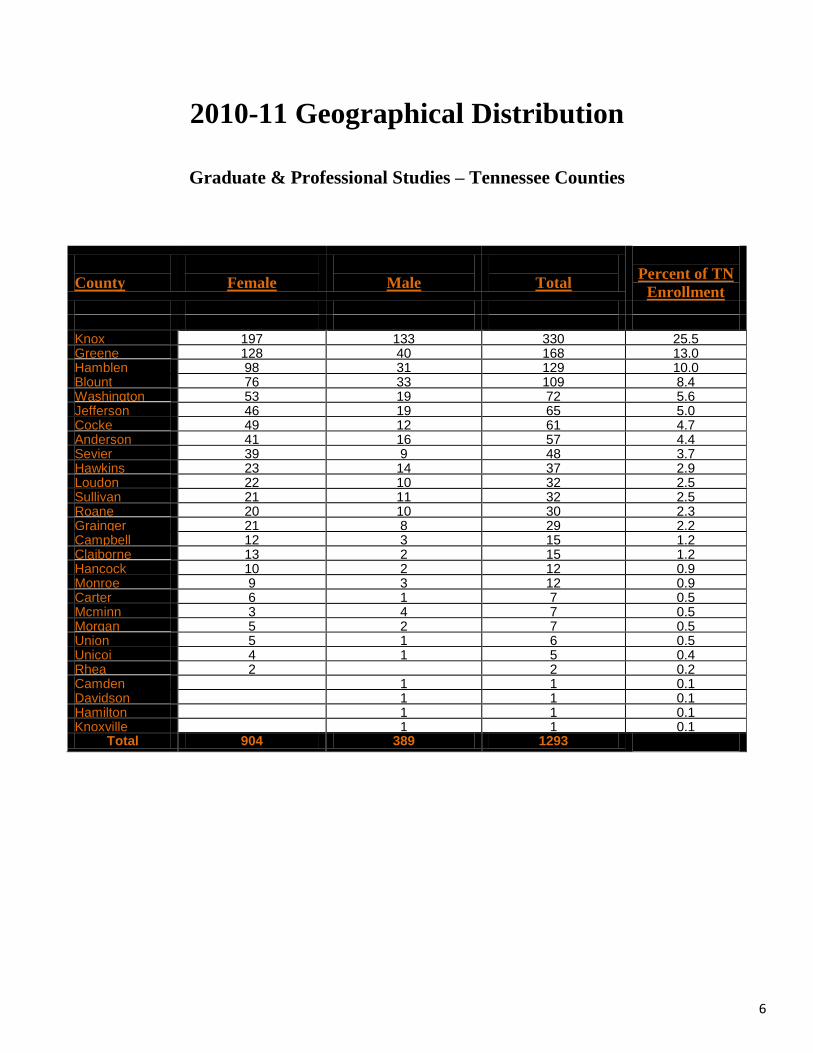
2010-11 Geographical Distribution
Graduate & Professional Studies – Tennessee Counties
County
Female
Male
Total
Percent of TN
Enrollment
Knox 197 133 330 25.5 Greene 128 40 168 13.0 Hamblen 98 31 129 10.0 Blount 76 33 109 8.4 Washington 53 19 72 5.6 Jefferson 46 19 65 5.0 Cocke 49 12 61 4.7 Anderson 41 16 57 4.4 Sevier 39 9 48 3.7 Hawkins 23 14 37 2.9 Loudon 22 10 32 2.5 Sullivan 21 11 32 2.5 Roane 20 10 30 2.3 Grainger 21 8 29 2.2 Campbell 12 3 15 1.2 Claiborne 13 2 15 1.2 Hancock 10 2 12 0.9 Monroe 9 3 12 0.9 Carter 6 1 7 0.5 Mcminn 3 4 7 0.5 Morgan 5 2 7 0.5 Union 5 1 6 0.5 Unicoi 4 1 5 0.4 Rhea 2 2 0.2 Camden 1 1 0.1 Davidson 1 1 0.1 Hamilton 1 1 0.1 Knoxville 1 1 0.1
Total 904 389 1293
7
0
10
20
30
40
50
60
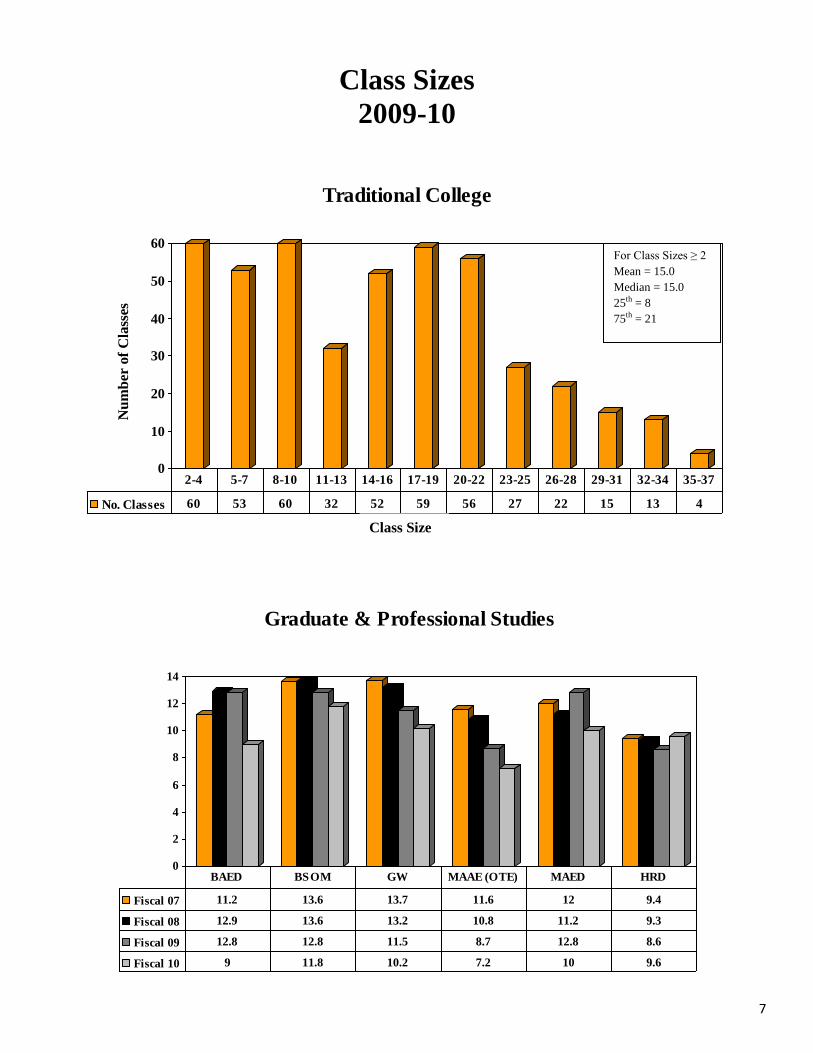
Traditional College
No. Classes 60 53 60 32 52 59 56 27 22 15 13 4
2-4 5-7 8-10 11-13 14-16 17-19 20-22 23-25 26-28 29-31 32-34 35-37
Class Sizes
2009-10
For Class Sizes ≥ 2
Mean = 15.0
Median = 15.0
25th = 8
75th = 21
Nu
mb
er o
f C
lass
es
Class Size
0
2
4
6
8
10
12
14
Graduate & Professional Studies
Fiscal 07 11.2 13.6 13.7 11.6 12 9.4
Fiscal 08 12.9 13.6 13.2 10.8 11.2 9.3
Fiscal 09 12.8 12.8 11.5 8.7 12.8 8.6
Fiscal 10 9 11.8 10.2 7.2 10 9.6
BAED BSOM GW MAAE (OTE) MAED HRD
8
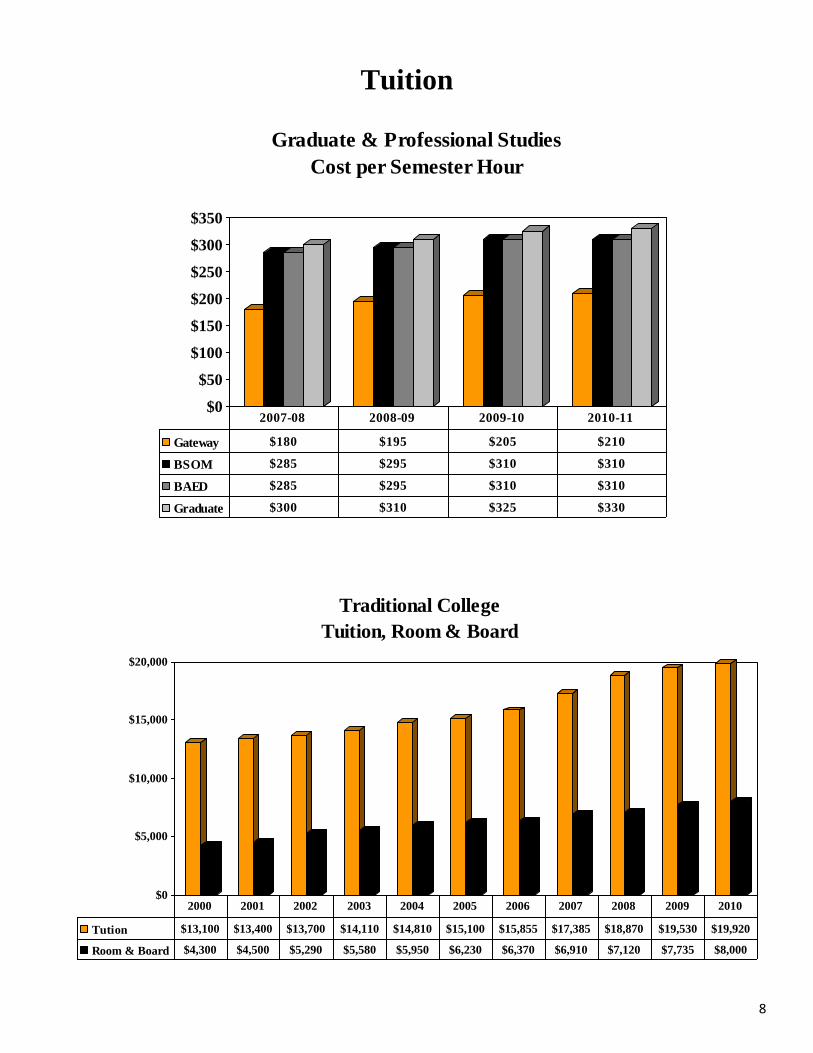
Tuition
$0
$50
$100
$150
$200
$250
$300
$350
Graduate & Professional Studies
Cost per Semester Hour
Gateway $180 $195 $205 $210
BSOM $285 $295 $310 $310
BAED $285 $295 $310 $310
Graduate $300 $310 $325 $330
2007-08 2008-09 2009-10 2010-11
$0
$5,000
$10,000
$15,000
$20,000
Traditional College
Tuition, Room & Board
Tution $13,100 $13,400 $13,700 $14,110 $14,810 $15,100 $15,855 $17,385 $18,870 $19,530 $19,920
Room & Board $4,300 $4,500 $5,290 $5,580 $5,950 $6,230 $6,370 $6,910 $7,120 $7,735 $8,000
2000 2001 2002 2003 2004 2005 2006 2007 2008 2009 2010
9
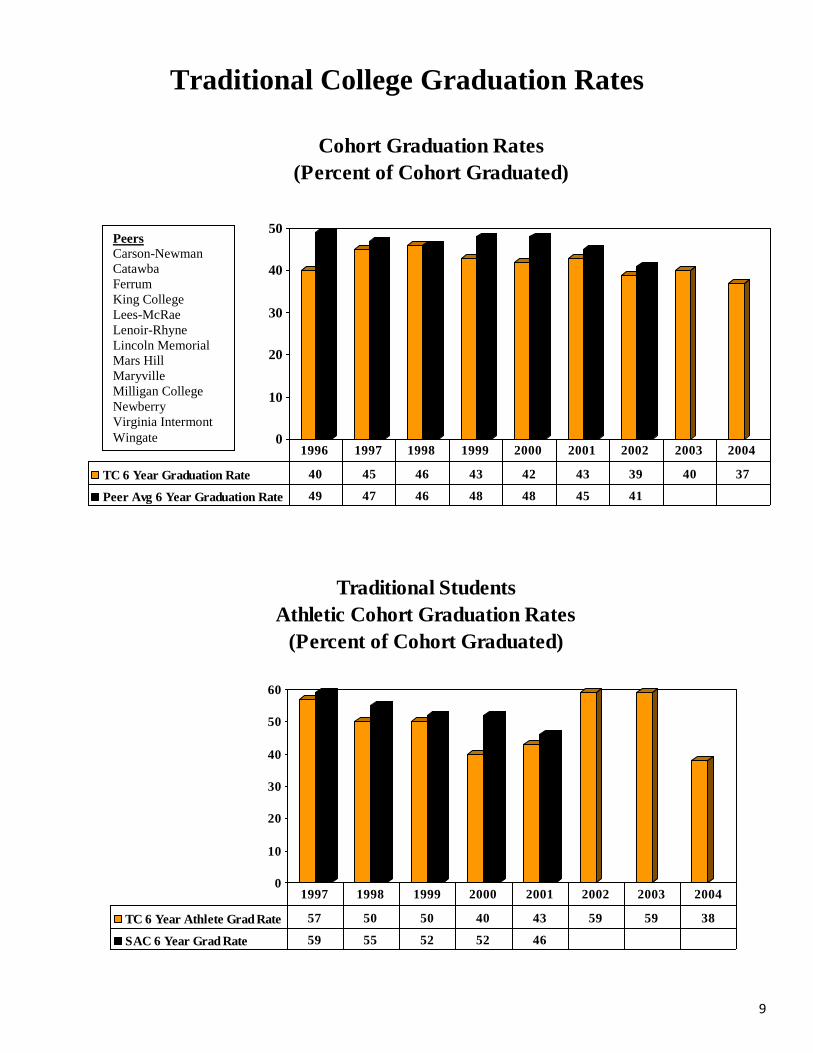
Traditional College Graduation Rates
0
10
20
30
40
50
Cohort Graduation Rates
(Percent of Cohort Graduated)
TC 6 Year Graduation Rate 40 45 46 43 42 43 39 40 37
Peer Avg 6 Year Graduation Rate 49 47 46 48 48 45 41
1996 1997 1998 1999 2000 2001 2002 2003 2004
Peers
Carson-Newman
Catawba
Ferrum
King College
Lees-McRae
Lenoir-Rhyne
Lincoln Memorial
Mars Hill
Maryville
Milligan College
Newberry
Virginia Intermont
Wingate
0
10
20
30
40
50
60
Traditional Students
Athletic Cohort Graduation Rates
(Percent of Cohort Graduated)
TC 6 Year Athlete Grad Rate 57 50 50 40 43 59 59 38
SAC 6 Year Grad Rate 59 55 52 52 46
1997 1998 1999 2000 2001 2002 2003 2004
10
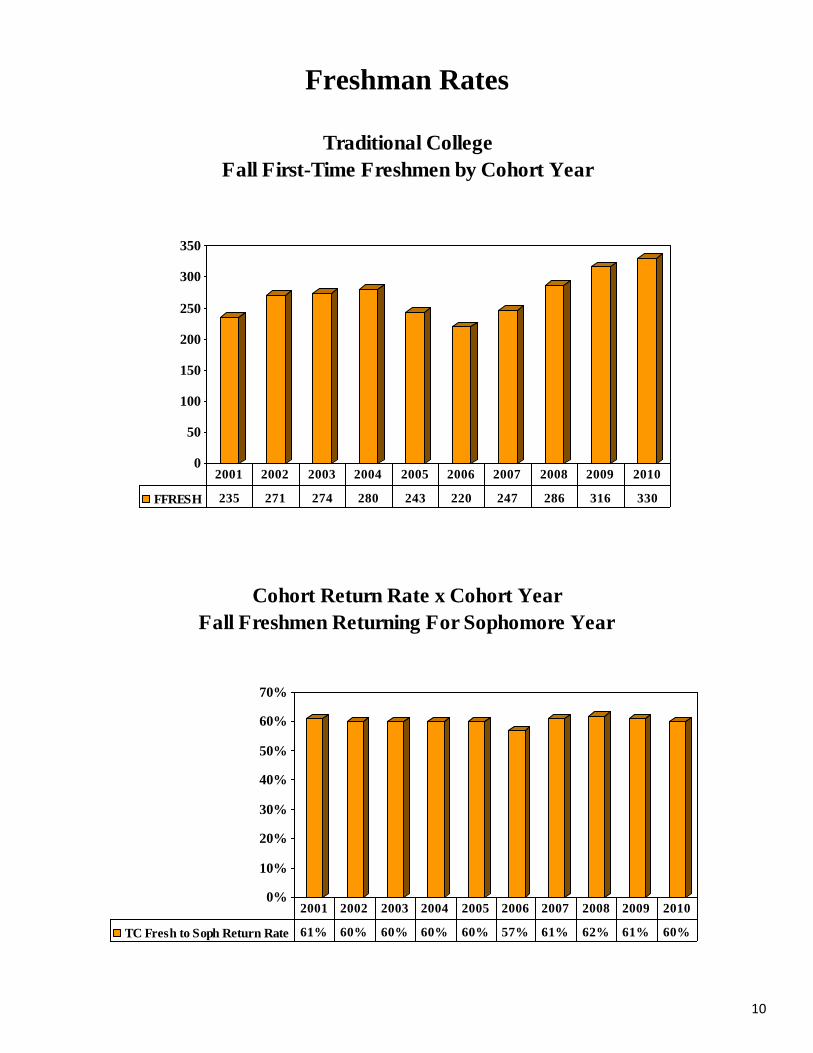
Freshman Rates
0
50
100
150
200
250
300
350
Traditional College
Fall First-Time Freshmen by Cohort Year
FFRESH 235 271 274 280 243 220 247 286 316 330
2001 2002 2003 2004 2005 2006 2007 2008 2009 2010
0%
10%
20%
30%
40%
50%
60%
70%
Cohort Return Rate x Cohort Year
Fall Freshmen Returning For Sophomore Year
TC Fresh to Soph Return Rate 61% 60% 60% 60% 60% 57% 61% 62% 61% 60%
2001 2002 2003 2004 2005 2006 2007 2008 2009 2010
11
19
19.5
20
20.5
21
21.5
22
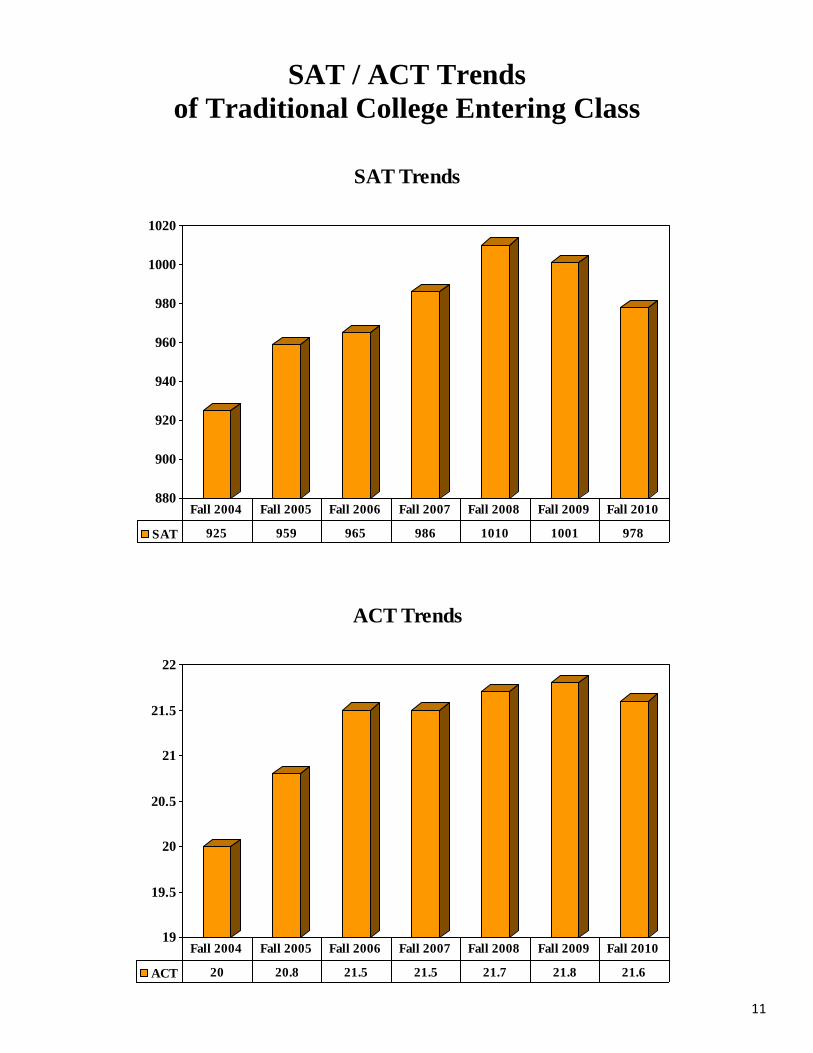
ACT Trends
ACT 20 20.8 21.5 21.5 21.7 21.8 21.6
Fall 2004 Fall 2005 Fall 2006 Fall 2007 Fall 2008 Fall 2009 Fall 2010
SAT / ACT Trends
of Traditional College Entering Class
880
900
920
940
960
980
1000
1020
SAT Trends
SAT 925 959 965 986 1010 1001 978
Fall 2004 Fall 2005 Fall 2006 Fall 2007 Fall 2008 Fall 2009 Fall 2010
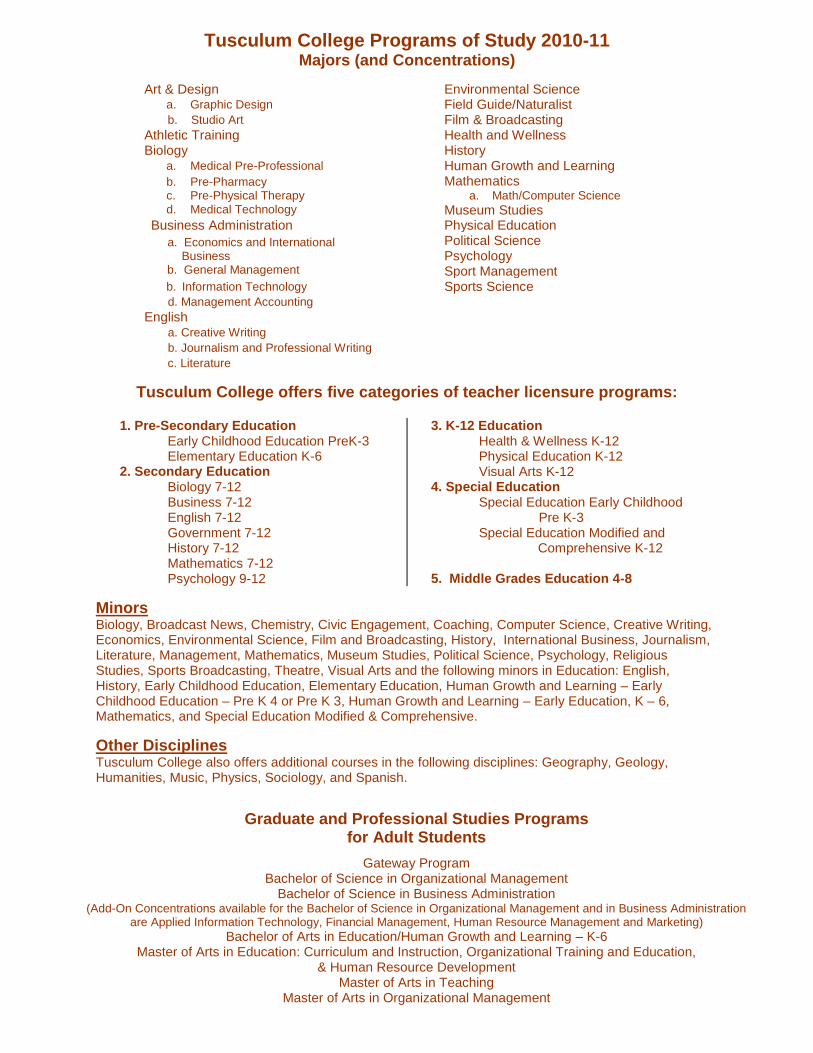
Tusculum College Programs of Study 2010-11 Majors (and Concentrations)
Art & Design Environmental Science a. Graphic Design Field Guide/Naturalist b. Studio Art Film & Broadcasting Athletic Training Health and Wellness Biology History a. Medical Pre-Professional Human Growth and Learning
b. Pre-Pharmacy c. Pre-Physical Therapy d. Medical Technology
Mathematics
a. Math/Computer Science Museum Studies
Business Administration Physical Education
a. Economics and International
Business b. General Management
Political Science Psychology Sport Management
b. Information Technology Sports Science d. Management Accounting English a. Creative Writing b. Journalism and Professional Writing c. Literature
Tusculum College offers five categories of teacher licensure programs:
1. Pre-Secondary Education Early Childhood Education PreK-3 Elementary Education K-6
2. Secondary Education Biology 7-12 Business 7-12 English 7-12 Government 7-12 History 7-12 Mathematics 7-12 Psychology 9-12
3. K-12 Education Health & Wellness K-12 Physical Education K-12 Visual Arts K-12
4. Special Education Special Education Early Childhood
Pre K-3 Special Education Modified and Comprehensive K-12
5. Middle Grades Education 4-8
Minors Biology, Broadcast News, Chemistry, Civic Engagement, Coaching, Computer Science, Creative Writing, Economics, Environmental Science, Film and Broadcasting, History, International Business, Journalism, Literature, Management, Mathematics, Museum Studies, Political Science, Psychology, Religious Studies, Sports Broadcasting, Theatre, Visual Arts and the following minors in Education: English, History, Early Childhood Education, Elementary Education, Human Growth and Learning – Early Childhood Education – Pre K 4 or Pre K 3, Human Growth and Learning – Early Education, K – 6, Mathematics, and Special Education Modified & Comprehensive.
Other Disciplines Tusculum College also offers additional courses in the following disciplines: Geography, Geology, Humanities, Music, Physics, Sociology, and Spanish.
Graduate and Professional Studies Programs for Adult Students
Gateway Program Bachelor of Science in Organizational Management
Bachelor of Science in Business Administration (Add-On Concentrations available for the Bachelor of Science in Organizational Management and in Business Administration
are Applied Information Technology, Financial Management, Human Resource Management and Marketing)
Bachelor of Arts in Education/Human Growth and Learning – K-6 Master of Arts in Education: Curriculum and Instruction, Organizational Training and Education,
& Human Resource Development Master of Arts in Teaching
Master of Arts in Organizational Management