Fabrication and Test of Superconducting Splittable ... Documents/2011... · TD-11-014 Fabrication...
28
TD-11-014 Fabrication and Test of Superconducting Splittable Quadrupole ILC_RTQ_02 21 Nov. 2011 Fabrication and Test of Superconducting Splittable Quadrupole ILC_RTQ_02 C. Hess, V. Kashikhin, M. J. Kim, F. Lewis, D. Orris, M. Tartaglia, T. Wokas I. Fabrication a. Photos of the magnet fabrication and assembly are shown in Figures I-1 to I-6. b. In order to mount the magnet for testing in stand 3, the superconducting leads had to be rearranged from the ILC design configuration (there is not room in the vessel for them, so the stiff copper- stabilized leads had to be insulated and bent to reposition them along the magnet length. In the first attempt to mount to the stand 3 top plate assembly, one coil (3) was damaged irreparably when the superconductor broke at the point where the lead emerges from the package. This coil was extracted from the quadrupole (it was StyCast epoxied into place) and a new coil 3 was fabricated and installed. c. The broken coil 3 was later cut into sections to study winding pattern and epoxy impregnation quality. Photos (Fig. I-7 to I-9) of the sections show that the winding is very uniform around the ends (where it is well controlled), and starts out very uniform in the long straight sections but eventually wanders into a less regular arrangement. Some small voids in the epoxy are visible in several of the sections (though not clear in the photos), especially near the corners and outer perimeters of the coil, which may allow motion of individual conductors. d. A Magnet Description Document was prepared which contains all of the salient parameters for testing this magnet in test stand 3 at MTF: http://tiweb.fnal.gov/website/controller/1971 Fig. I-1. Photos of a racetrack coil during winding, preparation for epoxy impregnation, after completion. Fig. I-2. Photos of half-yoke laminations in stacking press, before and after welding.
Transcript of Fabrication and Test of Superconducting Splittable ... Documents/2011... · TD-11-014 Fabrication...
TD-11-014 Fabrication and Test of Superconducting Splittable Quadrupole ILC_RTQ_02 21 Nov. 2011
Fabrication and Test of Superconducting Splittable Quadrupole ILC_RTQ_02
C. Hess, V. Kashikhin, M. J. Kim, F. Lewis, D. Orris, M. Tartaglia, T. Wokas
I. Fabrication
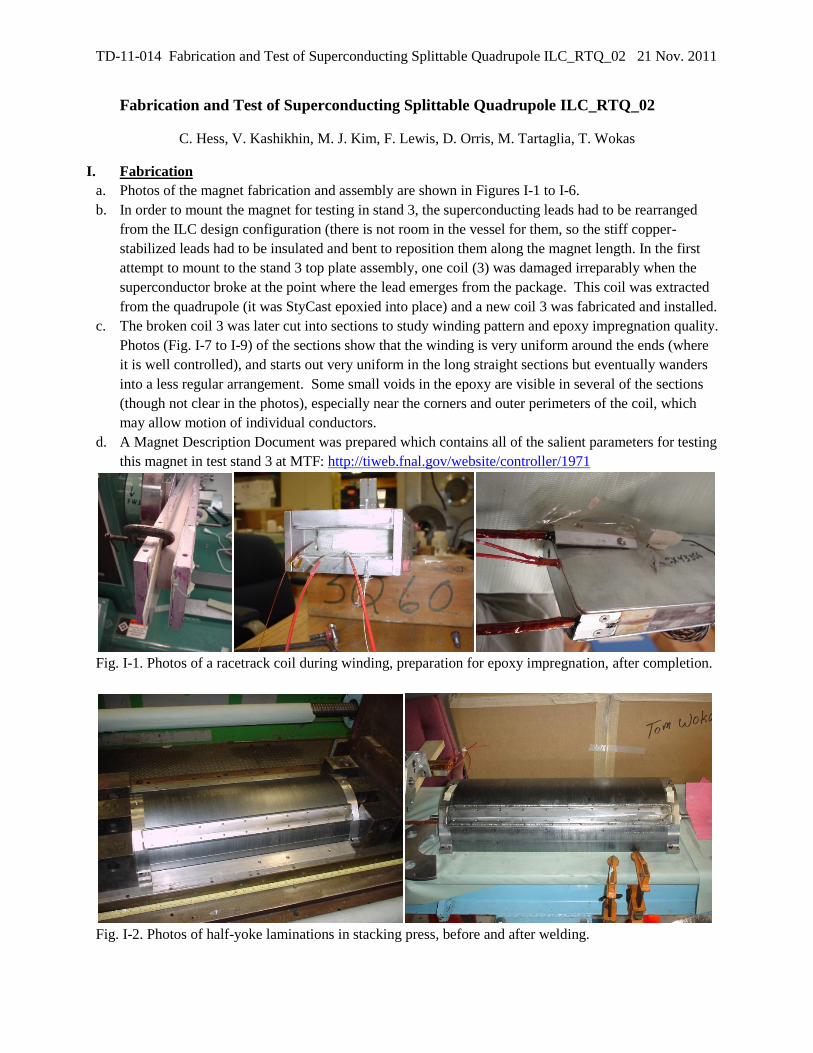
a. Photos of the magnet fabrication and assembly are shown in Figures I-1 to I-6.
b. In order to mount the magnet for testing in stand 3, the superconducting leads had to be rearranged
from the ILC design configuration (there is not room in the vessel for them, so the stiff copper-
stabilized leads had to be insulated and bent to reposition them along the magnet length. In the first
attempt to mount to the stand 3 top plate assembly, one coil (3) was damaged irreparably when the
superconductor broke at the point where the lead emerges from the package. This coil was extracted
from the quadrupole (it was StyCast epoxied into place) and a new coil 3 was fabricated and installed.
c. The broken coil 3 was later cut into sections to study winding pattern and epoxy impregnation quality.
Photos (Fig. I-7 to I-9) of the sections show that the winding is very uniform around the ends (where
it is well controlled), and starts out very uniform in the long straight sections but eventually wanders
into a less regular arrangement. Some small voids in the epoxy are visible in several of the sections
(though not clear in the photos), especially near the corners and outer perimeters of the coil, which
may allow motion of individual conductors.
d. A Magnet Description Document was prepared which contains all of the salient parameters for testing
this magnet in test stand 3 at MTF: http://tiweb.fnal.gov/website/controller/1971
Fig. I-1. Photos of a racetrack coil during winding, preparation for epoxy impregnation, after completion.
Fig. I-2. Photos of half-yoke laminations in stacking press, before and after welding.

TD-11-014 Fabrication and Test of Superconducting Splittable Quadrupole ILC_RTQ_02 21 Nov. 2011
Fig. I-3. Photos of coil insertion and StyCast epoxy bonding into yoke half.
Fig. I-4. Photos of coil lead preparation, and RTD locations along coil inner surface.

TD-11-014 Fabrication and Test of Superconducting Splittable Quadrupole ILC_RTQ_02 21 Nov. 2011
Fig. I-5. Magnet leads (in ILC configuration) and voltage taps, ready for test preparation.
Fig. I-6. With end plates for mounting with leads rearranged, and mounted to test stand 3 assembly.
Fig. I-7. Sections of the damaged coil: center of end radius, right end of radius.

TD-11-014 Fabrication and Test of Superconducting Splittable Quadrupole ILC_RTQ_02 21 Nov. 2011
Fig. I-8. Sections of the damaged coil: center of straight section left, and right.
Fig. I-9. Sections of the broken coil: return end seen through a loop.

TD-11-014 Fabrication and Test of Superconducting Splittable Quadrupole ILC_RTQ_02 21 Nov. 2011
II. Overview of Cold Testing
a. Thermometry was added to the inner surfaces of two coils to facilitate future studies of conduction
cooling. Figure X shows a photo of the attached Cernox RTDs on coil 1 (lead end and middle) and
coil 3 (middle and return end). During the first thermal cycle, the temperatures were compared with
another cernox sensor measuring the dewar bath (TeCxDeBot). All were found to be in excellent
agreement, except Coil1LE which reads significantly low at 4.4 K. Both room temperature and cold
resistance values for this sensor are not consistent with the calibration table for that sensor
(CX43357), so it is suspected that the wrong sensor name is assigned to this RTD.
b. The first cool down was performed early on Thursday 6/ 9, and was kept cold and full of liquid
helium through Monday noon for testing. After completing the quench training, protection heater
tests, and Hall probe magnetic measurements on 6/13, the test stand was allowed to slowly warm up
(from the background heat load on the dewar) when scheduled maintenance required the test to end.
A forced warm-up to 300 K was performed over the 6/17-19 weekend, and a second cool down was
performed on Monday 6/20.
c. A second thermal cycle (TC2) was started on 6/20 and quench retraining was completed on 6/21
when the magnet reached the specified stand operating current limit of 110 A and briefly ran without
quenching at this current. Magnetic measurements using the harmonic coil probe and DSP1
measurement cart were then made from 6/22 through 6/24 to complete the second thermal cycle of
testing. On 6/28 the magnet was warmed up to room temperature.
d. The magnet remained undisturbed at 300 K until the next test opportunity in October, as stand 3 was
used to commission a new RTD calibration system. A third thermal cycle of testing (TC3) was begun
on 10/19 and continued until 10/21, which began with a quench re-training study and finished with
another series of harmonic coil magnetic measurements (the harmonic coil system had also remained
undisturbed during this time). While reviewing the magnetic measurements data, the magnet warmed
up to between 205 and 220 K. Measurements had to be repeated due to problems with DSP1 gain
settings, so another day of cold testing (TC4) was performed on 10/26.
e. The magnet was warmed up to room temperature and it was removed from stand 3 on 11/4.
f. The magnet was then prepared for shipping to KEK for a conduction cooling test. The split yoke
faces were first “polished” to flatten them and ensure a smaller and more uniform gap when
reassembled. Superconducting lead copper stabilizer rods were also soldered on, or straightened from
the stand 3 configuration, to prepare them for use in the indirectly-cooled cryomodule configuration.
III. Quench Training
a. Following the first cool down to 4.4K, the magnet passed a hipot insulation integrity test of 500 V to
ground, with leakage current of 0.2 µA at 510V.
b. The quadrupole was trained in a 4.4K liquid helium bath at test stand 3 in MTF. The quench history
for the first thermal cycle is shown in Figure III-1. Training was generally at a steady rate of
increasing quench current versus ramp number. Many of the events (shown in open symbols) were
clearly fast voltage spikes that recovered, but were large enough to trigger the quench detection
system (some up to 16 V across the coil, which resulted in a 5 V filtered Half coil difference signal).
In fact, the quench detection thresholds were initially very low (100 mV on Half Coil difference) and
had to be raised to reduce trips due to transient spikes, to 5 V. Real quenches (filled symbols) were
obvious with much slower voltage development; many true quenches clearly began with a voltage
spike – likely due to conductor motion in the strong magnetic field. The magnet was trained to 95 A

TD-11-014 Fabrication and Test of Superconducting Splittable Quadrupole ILC_RTQ_02 21 Nov. 2011
in the available time (refrigeration plant had to be shut down for scheduled contractor work), just
short of the 100 A operating current target. A typical voltage spike event and a typical quench event
are shown in Figure III-2.
Fig. III-1. History of quench training and protection heater study in the first thermal cycle.
Fig. III-2. Examples of voltage spike signals (left), which triggered the QD system but recovered and did
not quench; and a spike at start of a quench (right).
c. The second thermal cycle began with a study of re-training with the goal to reach or exceed the 100 A
design operating level. It took six quenches to exceed the 95 A current reached in TC1. The magnet
was trained up to 110 A, which is the upper limit due to helium venting capacity on the test stand
(based upon the stored energy for this magnet). Eventually the magnet reached 110 A and operated
for 30 minutes before coil 4 quenched. On the subsequent ramp the magnet ran at 110 A without
quenching for 40 minutes before the test was ended with an intentional heater-induced quench.
Figure III-3 shows the re-training history for TC2 and the two subsequent thermal cycles, of quench

TD-11-014 Fabrication and Test of Superconducting Splittable Quadrupole ILC_RTQ_02 21 Nov. 2011
current as a function of the training ramp number. Note that ramp 58 quench was the heater-induced
quench.
d. TC3 retraining started at a surprisingly low current, and it took four quenches before the magnet
operated on the 110 A flat top without a quench for one hour; the system tripped at 110 A when
beginning the down ramp, so ramp 63 was not a quench.
e. Testing in TC4 (following a warmup to ~210 K) was for magnetic measurements and no retraining
study was performed. However, while attempting to run a magnetic measurement profile, several low
current quenches occurred; these were caused by an unintentional slow temperature rise when the
operator closed the bypass valve, which increased the pressure and therefore temperature. For the last
of these, at 6.5 A, the lead end temperature sensor on coil 1 indicated about 8.3 K. After recovering
to 4.4 K liquid, magnetic measurements were taken without incident until after the third plateau of the
100 A Beam-Based Alignment profile: on the down-ramp, coil 4 quenched at 82.2 A.
Fig. III-3. Re-training events as a function of quench ramp number in 2
nd through 4
th thermal cycles.
f. The quench data shown in Figures III-1 and III-3 are re-plotted in Fig. III-4 to show the quench
histories of the individual coils. Open symbols indicate the fast voltage spike events that triggered the
quench detection system (RC-filtered Half coil voltage above threshold) but recovered. However,
since many quench events were observed to start with spikes and then develop slowly, it is possible
(indeed, likely) that some of these spike events may also have resulted in quench development. Coil 3
has the longest training, while coil 4 has the most re-training after thermal cycling.

TD-11-014 Fabrication and Test of Superconducting Splittable Quadrupole ILC_RTQ_02 21 Nov. 2011
Fig. III-4. Training and re-training history of individual coils.
IV. Quench Protection Heaters
a. During quench training, the magnet was protected with a 9 Ω dump resistor that switched in to
dissipate stored energy 10 ms after a quench detection threshold was exceeded. For added protection,
the strip heaters were energized by a heater firing unit (HFU) charged to 300 V at 2400 µF
capacitance, also with a 10 ms delay (to allow some quench signal development). Strip heaters were
all connected in series, and the measured cold heater resistance was 37.6 Ω.
b. After quench training, the heater-induced quench delay was measured. HFU was operated at 2400
mF capacitance and fired to induce a quench; the study mapped the delay from heater firing until
quench detection at 5 V threshold, as a function of HFU voltage and quad current. Results are shown
in Figures IV-1. In all cases, coil 1 was the first quenching coil; in many cases coil 2 later developed
a resistive voltage, while coils 3 and 4 appeared to remain inductive. Coil voltage signals for a
typical heater-induced quench event are shown in Figure IV-2.
Fig. IV-1. Delay from heater firing to quench detection as a function of magnet current and heater
voltage, at fixed capacitance (2.4 mF).

TD-11-014 Fabrication and Test of Superconducting Splittable Quadrupole ILC_RTQ_02 21 Nov. 2011
Fig. IV-2. Voltage signals from a heater-induced quench. Coil 1 quenches after a large voltage spike
which coincides with the heater firing. Coils 3 and 4 are purely inductive, while on close examination
Coil 2 must also be developing resistive voltage that balances the inductive component (from power
supply current sagging). All coils show some fast oscillating disturbances between -66 and -56 ms.
V. Magnetic Measurements
a. For the first thermal cycle test program, magnetic measurements were made using a Senis 10 T 3D
Hall probe, S/N=5406. (This is a new version of this probe, with a 2 m long cable, calibrated with
0.1% linearity to 2 T). The Hall probe mount, shown in Fig. V-1 is the same one used for HINS CH
solenoid magnetic axis studies (TD-10-007), but with new close-fit bearings to center the shaft and
probe without gaps in the warm bore tube; the probe active element was approximately 8.0 mm
radially out from the axis of rotation, with an error of about 0.1 mm (although not necessarily
centered on the quadrupole axis). Probe angular orientation and axial positions were measured with
precision encoders (.0025 degrees, .01 mm). The probe was mounted so that the By readout
corresponds to the radial field component (about the axis of rotation), Bx corresponds to the tangential
field component, and Bz corresponds to the axial field component. The Hall probe voltages (Vx, Vy,
Vz) and temperature (Vt) were digitized 10 times at each {Z, angle, Current} setting, using a Keithley
2700 multiplexing DMM. Following the test, the Bx and By Hall elements were calibrated against an
NMR reference in the MTF calibration magnet, up to about 2 T. It was found that both elements
agreed within .05% of the NMR field strength.
b. Hall probe magnetic measurements consisted of i] an axial (Z) scan at 50 A with the probe angle
fixed at 90 degrees (the initial angle setting was arbitrary with respect to the magnet orientation); ii] a
second Z scan at 50 A was taken at an angle position of 0 degrees; iii] the probe was positioned to a
central Z position of 200 mm (the position Z=0 corresponds to approximately 150 mm above the
bottom of the non-lead end plate of the magnet), and a scan was made by rotating the probe 360
degrees in 10 degree increments; finally, at this same center z position and the 360 degree angle
position, measurements were made at flat-top currents from 0 to 90 A using a stair step current profile
ramping up in 10 A steps.
TD-11-014 Fabrication and Test of Superconducting Splittable Quadrupole ILC_RTQ_02 21 Nov. 2011
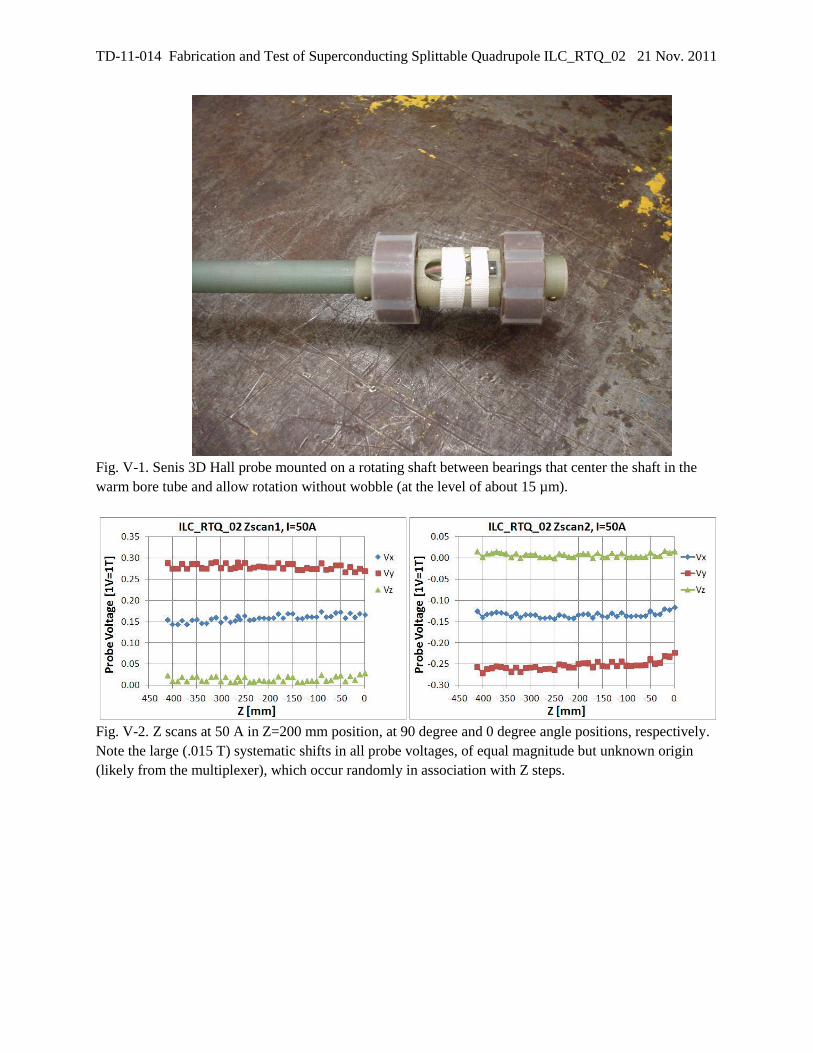
Fig. V-1. Senis 3D Hall probe mounted on a rotating shaft between bearings that center the shaft in the
warm bore tube and allow rotation without wobble (at the level of about 15 µm).
Fig. V-2. Z scans at 50 A in Z=200 mm position, at 90 degree and 0 degree angle positions, respectively.
Note the large (.015 T) systematic shifts in all probe voltages, of equal magnitude but unknown origin
(likely from the multiplexer), which occur randomly in association with Z steps.

TD-11-014 Fabrication and Test of Superconducting Splittable Quadrupole ILC_RTQ_02 21 Nov. 2011
Fig. V-3. Angle scan at 50 A in Z=200 mm position. Values agree with the Z scans at 0 and 90 degrees,
with the large offset due to systematic shift of all voltages (CZ=.015 V). Vz is consistent with a tilt in XZ
plane of AX=.002 radians, and AY=.015 radians in the YZ plane.
Fig. V-4. Difference of Vx-Vy versus Z for two Zscans (systematic shifts cancel). Linear behavior
suggests the change in center position as a function of Z.
c. In principle, it should be possible to fit the Hall probe angle scan data to determine the X and Y center
offsets. Ideally, angle scans at several Z positions would be helpful to find the variation of center
positions along the length and compare with the determination from harmonic coil measurements
(which average over a large Z range). However, this was not done due to lack of time.
d. Harmonic coil magnetic measurements were made using the DSP1 cart reading out a 25 cm long, 2.5
cm diameter ceramic tangential coil probe. The probe, which has barcode ID=10016, is shown in Fig.
V-5. The probe had previously been through a calibration test by Joe DiMarco, to establish the probe
parameters by comparison with other probes within a couple of short reference magnets. Results of
that calibration are included as Appendix A. The probe bearing centering buttons were shimmed to
make a proper fit into the warm bore tube so that the spring-loaded button on each end would ensure
three-point contact with the bore. A specially fitted G10 shaft was made to mechanically and
electrically connect the probe to the “tevatron” motor/gear/slip-ring drive mechanism that was
adapted to stand 3, as shown in Fig. V-6.
e. Strength and harmonics data were taken at three Z positions (Z=0, Z=200, Z=471 mm). Note that
there is some 5 cm of probe overlap between the Z=0, 200 mm positions, both of which are fully in
the quad body and give consistent strength measurements. The Z=471 mm position is only partially in

TD-11-014 Fabrication and Test of Superconducting Splittable Quadrupole ILC_RTQ_02 21 Nov. 2011
the body, and the measured strength is only about half the body value. Fig. V-7 shows the body
gradient strength as a function of current for both Hall probe and harmonic coil measurements. The
Hall probe gradient is slightly uncertain because of the actual distance of the By Hall element from the
quadrupole axis (the offset measured at zero field has been subtracted).
Fig. V-5. Photo of the 25 cm tangential coil probe and drawing with dimensions.
Fig. V-6. Photos of the harmonic coil drive system mounted above stand 3 top plate, with shaft and probe
installed in the warm bore tube.

TD-11-014 Fabrication and Test of Superconducting Splittable Quadrupole ILC_RTQ_02 21 Nov. 2011
Fig. V-7. Overlay of strength measurements from Hall probe (at 90 degree angle, Z=200 mm position)
and harmonic coil (at Z=0 mm and 200 mm positions).
f. Splittable quadrupole field quality was evaluated by analysis of the harmonic coefficients from
magnetic measurements taken on 6/22. DSP system recorded data for at least 100 rotations of the
tangential coil probe at plateau currents of 10, 20, 40, 60, and 80 A, at the Z=0 and Z=200 mm
positions. The harmonic coefficients (bn,an) are reported in “units” (10-4
of quadrupole strength) at a
reference radius of 25.4 mm, where bn are the “normal” and an are the “skew” field terms where the
normal quadrupole coeffiecient is b2=1. By assumption the dipole terms arise from quadrupole feed-
down, and are used to determine the center position offsets, so coefficients b1, a1 and a2 are zero. The
ILC field quality specification requires 5% uniformity at a radius of 5 mm. The 2D magnetic field at
a transverse position z=x+iy=(r,θ) is given by
( ) ( ) ( ) ∑⌊( )
⌋ (
)
where is a phase angle between the 2n-pole field component and the chosen x-y coordinate system;
the harmonic coefficients (in units) are given by
[
( )
]
[( )
].
The contribution to the field at a given radius r from harmonic term n scales as (r/Rref)n-1
, and the
field quality is equal or better at any smaller radius. The measured harmonic coefficients at the
reference radius, and scaled to 5 mm, are summarized in Table V-1 as a function of the current at
Z=200 mm (the allowed harmonics are shown in bold font). Figure V-8 (V-9) shows the normal
(skew) scaled harmonics for both measured z positions; full scale represents 1% of the quadrupole
strength. Both positions show quite similar coefficients, and most terms are quite small (except n=14
and n=15, which could have large errors due to the small probe radius – see Appendix A).

TD-11-014 Fabrication and Test of Superconducting Splittable Quadrupole ILC_RTQ_02 21 Nov. 2011
It is clear that the individual terms are all well below 1%, and the sum of terms is well below the 5%
specification.
Table V-1. Harmonic Coefficients, at Rref and scaled to 5mm radius, versus current at Z=200 mm
R, I
Coefficient
25.4
mm 10
A
25.4 mm
20 A
25.4 mm
40 A
25.4 mm
60 A
25.4 mm
80 A
5 mm
10 A
5 mm
20 A
5 mm
40 A
5 mm
60 A
5 mm
80 A
b3 -1.5 -0.6 -0.2 -0.4 -0.9 -0.06 -0.02 -0.01 -0.01 -0.04
b4 0.5 1.8 0.0 -0.9 -0.9 0.02 0.07 0.00 -0.04 -0.04
b5 8.4 9.9 12.9 11.7 9.3 0.33 0.38 0.50 0.45 0.36
b6 -104.9 -109.2 -197.4 -178.7 -149.2 -4.06 -4.23 -7.65 -6.93 -5.78
b7 -1.1 -5.7 -2.7 -4.5 -2.1 -0.04 -0.22 -0.10 -0.17 -0.08
b8 -13.3 2.4 -2.1 2.4 7.2 -0.51 0.09 -0.08 0.09 0.28
b9 -8.5 -26.7 0.2 -3.7 14.3 -0.33 -1.04 0.01 -0.14 0.56
b10 14.3 145.2 -35.3 56.2 96.3 0.55 5.63 -1.37 2.18 3.73
b11 38.4 5.2 -4.6 25.3 9.1 1.49 0.20 -0.18 0.98 0.35
b12 -91.8 -151.6 -24.9 -76.6 4.5 -3.56 -5.88 -0.96 -2.97 0.17
b13 32.0 167.5 -116.8 8.7 -111.7 1.24 6.49 -4.53 0.34 -4.33
b14 -238.2 -864.0 1855.3 -1528.3 251.7 -9.23 -33.48 71.89 -59.22 9.75
b15 749.4 1036.3 -386.1 -157.9 914.9 29.04 40.16 -14.96 -6.12 35.45
a3 0.8 0.9 1.1 1.6 1.3 0.03 0.03 0.04 0.06 0.05
a4 4.3 3.8 4.8 5.3 4.9 0.17 0.15 0.18 0.20 0.19
a5 -1.1 -0.2 0.2 1.0 -0.4 -0.04 -0.01 0.01 0.04 -0.01
a6 14.7 -16.0 -6.0 -5.3 -7.6 0.57 -0.62 -0.23 -0.21 -0.30
a7 0.7 0.5 -1.8 -0.9 0.9 0.03 0.02 -0.07 -0.03 0.04
a8 4.1 -1.1 3.4 -0.8 2.3 0.16 -0.04 0.13 -0.03 0.09
a9 2.1 -3.9 7.1 2.3 -7.4 0.08 -0.15 0.27 0.09 -0.29
a10 1.4 14.1 9.4 -55.7 -29.8 0.05 0.55 0.36 -2.16 -1.15
a11 5.1 -53.0 25.7 4.7 -36.7 0.20 -2.05 1.00 0.18 -1.42
a12 142.1 25.5 42.8 44.7 48.4 5.51 0.99 1.66 1.73 1.88
a13 -31.4 -58.6 -320.2 59.3 108.3 -1.22 -2.27 -12.41 2.30 4.19
a14 450.2 -410.7 456.4 -3.5 -31.4 17.44 -15.92 17.69 -0.14 -1.22
a15 -483.4 -60.4 -574.5 -79.0 216.2 -18.73 -2.34 -22.26 -3.06 8.38

TD-11-014 Fabrication and Test of Superconducting Splittable Quadrupole ILC_RTQ_02 21 Nov. 2011
Fig. V-8. Normal harmonic coefficients scaled by (5/25.4)
n-1 as a function of current.
Fig. V-9. Skew harmonic coefficients scaled by (5/25.4)
n-1 as a function of current.
g. Center position measurements were made using Beam-Based Alignment (BBA) current profiles to
study center position stability. A summary of the measurements is given in Table V-2. The BBA
profile ramps to a nominal current, decreases by 20%, then steps up by 5% in plateaus back to
nominal current; the measurement sets are shown in Fig. V-10. DSP1 cart gains were set to have
good sensitivity to a small dipole component, but not saturate any of the signals. The same gain
settings were used for all profiles: { DP1,DP2, QB1, QB2, TAN} = {100,100,10,10,10}. Data were
taken at two independent (no probe overlap) body field positions,
Z= 000 mm corresponds to bottom of probe being 15 cm above bottom of non-lead end
Z = 250mm (one probe length up) corresponds to top of probe being 10 cm below lead end
Table V-2. Measurement summary
Meas. Set Thermal Cycle
Date Z position Rotation Rate
Currents(BBA cycles) Plateau time
1 2 6/23 200 mm 0.5 Hz 10(2), 20(2), 40(2) 2 min
2 2 6/24 200 mm 1.0 Hz 100(1), 80(1), 60(1), 40(1), 20(1), 10(1), 100(1)
3 min
-- 3 10/21 0, 250 mm 0.5 Hz BAD DSP Gains 3 min
3 4 10/26 0 mm 0.5 Hz 10(2), 60(3), 100(3), 10(2) 3 min
4 4 10/28 250 mm 0.5, 0.25 Hz 10(2), 100(3), 60(3), 60(2), 10(2) 3 min

TD-11-014 Fabrication and Test of Superconducting Splittable Quadrupole ILC_RTQ_02 21 Nov. 2011
Fig. V-10. Current profiles for measurement sets 1-4.
Data taken in TC2 were analyzed shortly after measurements, and preliminary results reported at MT-
22. Although results looked fairly reasonable, it was not clear why the measured dX center positions
varied considerably at the start and end of a BBA cycle, and in a second cycle (while dY was very
stable). One hypothesis was that the gap between halves of the split yoke was not uniform along the
length and might change with excitation to different levels. A number of options were discussed to
investigate this with additional measurements; since a lot of time was invested in preparing the
magnet and measurement system, we opted to take additional measurements before removing the
magnet to make any changes (e.g., to machine or polish the yoke faces to ensure a small, uniform gap
along the length).
Following a 2 month hiatus (while Low Temperature Calibration Facility was commissioned and
performing RTD calibrations at stand 3), we began a third thermal cycle of testing which began with
quench re-training and was followed by magnetic measurements. Unfortunately, two days of
measurements did not collect any useful data because the EMS/DSP system failed to automatically
set the gains – they ended up too large or too small. After a weekend thermal cycle, another attempt
to capture harmonic data in TC4 was successful.
TD-11-014 Fabrication and Test of Superconducting Splittable Quadrupole ILC_RTQ_02 21 Nov. 2011
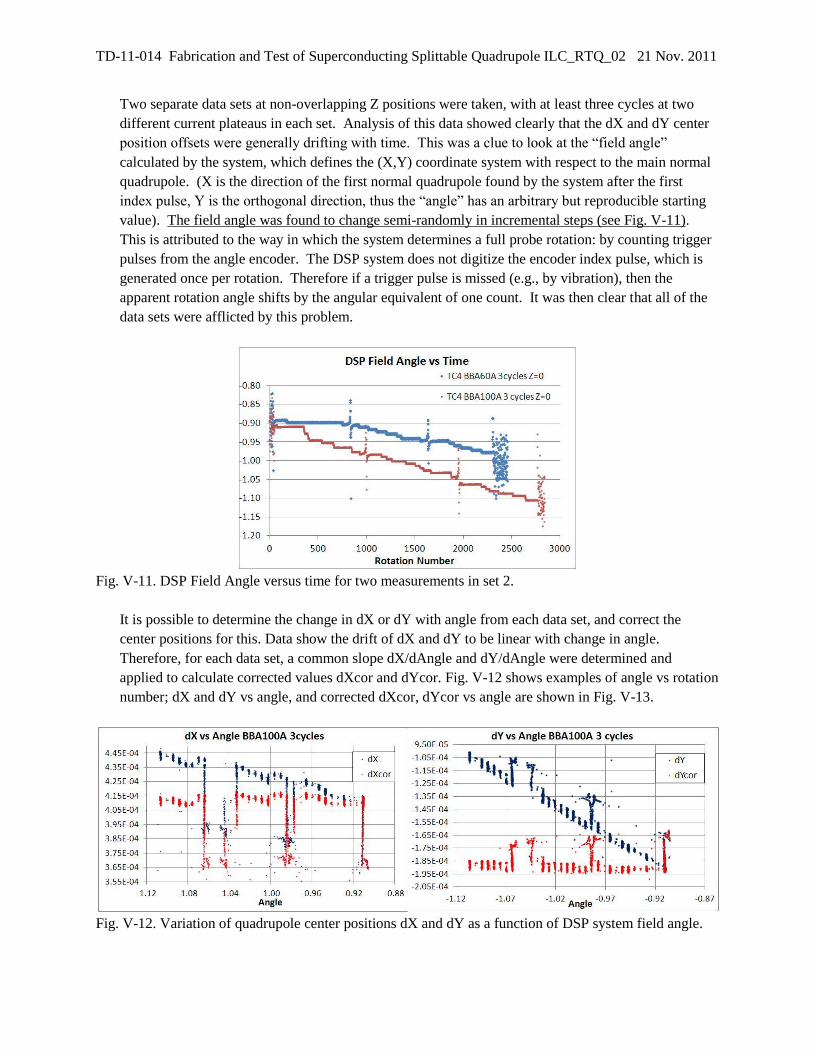
Two separate data sets at non-overlapping Z positions were taken, with at least three cycles at two
different current plateaus in each set. Analysis of this data showed clearly that the dX and dY center
position offsets were generally drifting with time. This was a clue to look at the “field angle”
calculated by the system, which defines the (X,Y) coordinate system with respect to the main normal
quadrupole. (X is the direction of the first normal quadrupole found by the system after the first
index pulse, Y is the orthogonal direction, thus the “angle” has an arbitrary but reproducible starting
value). The field angle was found to change semi-randomly in incremental steps (see Fig. V-11).
This is attributed to the way in which the system determines a full probe rotation: by counting trigger
pulses from the angle encoder. The DSP system does not digitize the encoder index pulse, which is
generated once per rotation. Therefore if a trigger pulse is missed (e.g., by vibration), then the
apparent rotation angle shifts by the angular equivalent of one count. It was then clear that all of the
data sets were afflicted by this problem.
Fig. V-11. DSP Field Angle versus time for two measurements in set 2.
It is possible to determine the change in dX or dY with angle from each data set, and correct the
center positions for this. Data show the drift of dX and dY to be linear with change in angle.
Therefore, for each data set, a common slope dX/dAngle and dY/dAngle were determined and
applied to calculate corrected values dXcor and dYcor. Fig. V-12 shows examples of angle vs rotation
number; dX and dY vs angle, and corrected dXcor, dYcor vs angle are shown in Fig. V-13.
Fig. V-12. Variation of quadrupole center positions dX and dY as a function of DSP system field angle.

TD-11-014 Fabrication and Test of Superconducting Splittable Quadrupole ILC_RTQ_02 21 Nov. 2011
Fig. V-13. Variation of center positions as a function of time, before and after linear angle correction.
Table V-3 shows the parameters used for correction of each data set. A single slope seems to work
pretty well for data on a given day, at a given Z position; why it varies from day to day at the same Z
position is unknown. The value of dY appears to have bi-stable values (perhaps due to vibration?)
that differ by a few microns (however the mean value is still well determined).
Table V-3. Field Angle Correction Slope Parameters
Measurement Set Z position dX/dAngle dY/dAngle
1 200 mm 0.00026 -0.00004
2 200 mm 0.00022 0.00004
3 0 mm 0.00016 0.00042
4 250 mm 0.00014 0.00004
Subsequently it became clear that the data can be overlaid to see some interesting trends and draw
some conclusions (in the following figures all scales have the same 10 micron intervals and 70
micron range):
Fig. V-14. Overlay of all set 2 corrected center position measurements as a function of current.
TD-11-014 Fabrication and Test of Superconducting Splittable Quadrupole ILC_RTQ_02 21 Nov. 2011
In Fig. V-14, all data within a given measurement set follow the same well-defined profile, which is
reproduced for the BBA plateaus and all ramp cycles. Therefore, the worst case for dX is between
about 20 and 30 Amperes, where dX changes most rapidly with current. The BBA variation in the
20-30 A region would be something to study more carefully in future measurements. A quantitative
summary of the measured BBA plateau center shifts is given later.
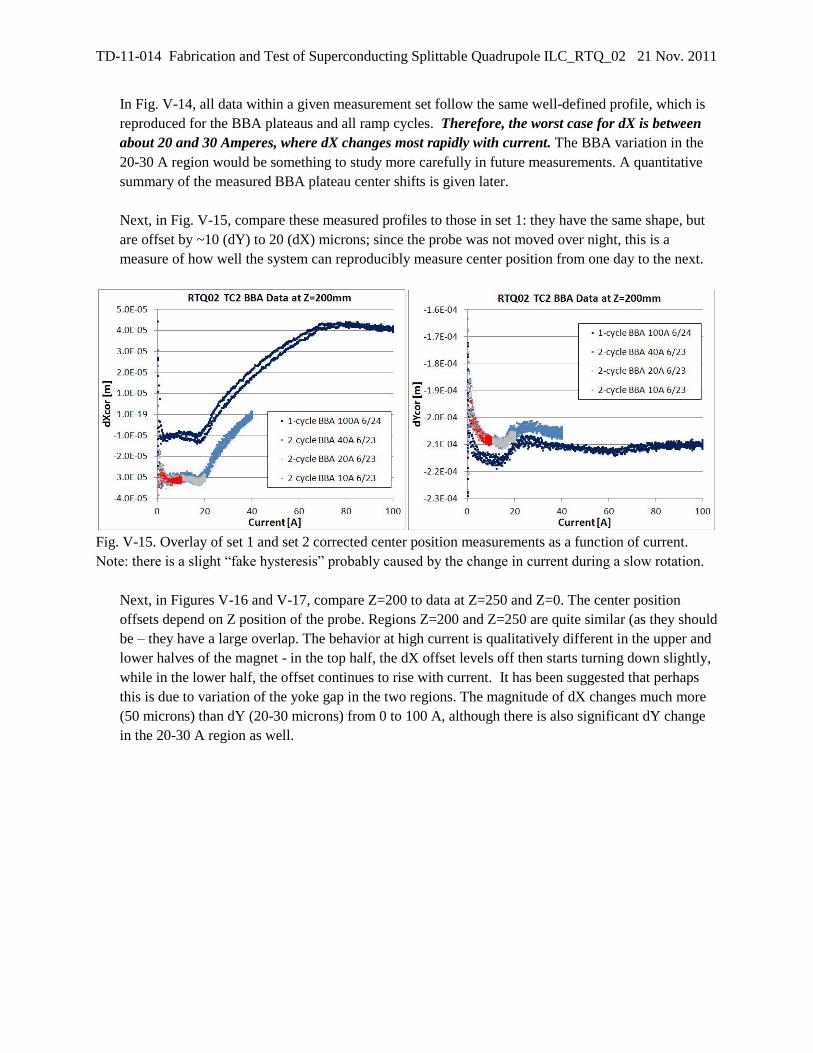
Next, in Fig. V-15, compare these measured profiles to those in set 1: they have the same shape, but
are offset by ~10 (dY) to 20 (dX) microns; since the probe was not moved over night, this is a
measure of how well the system can reproducibly measure center position from one day to the next.
Fig. V-15. Overlay of set 1 and set 2 corrected center position measurements as a function of current.
Note: there is a slight “fake hysteresis” probably caused by the change in current during a slow rotation.
Next, in Figures V-16 and V-17, compare Z=200 to data at Z=250 and Z=0. The center position
offsets depend on Z position of the probe. Regions Z=200 and Z=250 are quite similar (as they should
be – they have a large overlap. The behavior at high current is qualitatively different in the upper and
lower halves of the magnet - in the top half, the dX offset levels off then starts turning down slightly,
while in the lower half, the offset continues to rise with current. It has been suggested that perhaps
this is due to variation of the yoke gap in the two regions. The magnitude of dX changes much more
(50 microns) than dY (20-30 microns) from 0 to 100 A, although there is also significant dY change
in the 20-30 A region as well.

TD-11-014 Fabrication and Test of Superconducting Splittable Quadrupole ILC_RTQ_02 21 Nov. 2011
Fig. V-16. Overlay of center position measurements in set 4 as a function of current.
Fig. V-17. Overlay of center position measurements in set 3 as a function of current.
For set 2 which spans the widest range of currents, the center position average and standard deviation
on each plateau were calculated for the individual BBA profiles. These values are plotted versus
current in Fig. V-18. In Fig. V-19 the change in center position, between the nominal plateau value
and the -20% plateau value, is shown as a function of the nominal current. Thus the 40 A and 60 A
BBA center shifts are close to, but slightly above, the desired 5 µm level.

TD-11-014 Fabrication and Test of Superconducting Splittable Quadrupole ILC_RTQ_02 21 Nov. 2011
Fig. V-18. Summary of BBA plateau average shifts in dX and dY versus current, from measurement set 2.
Fig. V-19. Summary of center position shifts as a function of operating current for a 20% gradient change.
VI. Conclusion
The fabrication and test of a splittable quadrupole confirmed the design concept. After somewhat
slow training, the magnet reached 20 % above the maximum required operational gradient. Some re-
training was seen after thermal cycling to room temperature, and after several thermal cycles one coil
continued to show some re-training to reach the maximum allowed test current of 110 A. Quench
protection heater performance was measured over a range of magnet currents and heater voltage
settings.
The gradient strength was measured with both a Hall probe and a harmonic coil, from 10 A to
100 A operating current. Field quality in the magnet body meets the specification; data to characterize
the end field quality was taken but that analysis has not yet been completed. The quadrupole center
position was extensively studied: the specification of less than 5 µm shift over a 20% gradient change
was met over a large range of the operating currents. The center position shift is close to, but slightly
above, the desired level in the 30-70 A range. Future plans are to improve the magnet split plane
flatness to eliminate small gaps, and test again in a conduction-cooling mode.

TD-11-014 Fabrication and Test of Superconducting Splittable Quadrupole ILC_RTQ_02 21 Nov. 2011
Appendix A. Harmonic Coil Calibration (Adobe Acrobat PDF format)

TD-11-014 Fabrication and Test of Superconducting Splittable Quadrupole ILC_RTQ_02 21 Nov. 2011

TD-11-014 Fabrication and Test of Superconducting Splittable Quadrupole ILC_RTQ_02 21 Nov. 2011

TD-11-014 Fabrication and Test of Superconducting Splittable Quadrupole ILC_RTQ_02 21 Nov. 2011

TD-11-014 Fabrication and Test of Superconducting Splittable Quadrupole ILC_RTQ_02 21 Nov. 2011

TD-11-014 Fabrication and Test of Superconducting Splittable Quadrupole ILC_RTQ_02 21 Nov. 2011

TD-11-014 Fabrication and Test of Superconducting Splittable Quadrupole ILC_RTQ_02 21 Nov. 2011