
Extended Engelundndash;Hansen type sediment transport ...
17
Full Terms & Conditions of access and use can be found at https://iahr.tandfonline.com/action/journalInformation?journalCode=tjhr20 Journal of Hydraulic Research ISSN: 0022-1686 (Print) 1814-2079 (Online) Journal homepage: https://iahr.tandfonline.com/loi/tjhr20 Extended Engelund–Hansen type sediment transport relation for mixtures based on the sand- silt-bed Lower Yellow River, China Kensuke Naito, Hongbo Ma, Jeffrey A. Nittrouer, Yuanfeng Zhang, Baosheng Wu, Yuanjian Wang, Xudong Fu & Gary Parker To cite this article: Kensuke Naito, Hongbo Ma, Jeffrey A. Nittrouer, Yuanfeng Zhang, Baosheng Wu, Yuanjian Wang, Xudong Fu & Gary Parker (2019): Extended Engelund–Hansen type sediment transport relation for mixtures based on the sand-silt-bed Lower Yellow River, China, Journal of Hydraulic Research, DOI: 10.1080/00221686.2018.1555554 To link to this article: https://doi.org/10.1080/00221686.2018.1555554 View supplementary material Published online: 21 Jan 2019. Submit your article to this journal Article views: 80 View Crossmark data
Transcript of Extended Engelundndash;Hansen type sediment transport ...

Full Terms & Conditions of access and use can be found athttps://iahr.tandfonline.com/action/journalInformation?journalCode=tjhr20
Journal of Hydraulic Research
ISSN: 0022-1686 (Print) 1814-2079 (Online) Journal homepage: https://iahr.tandfonline.com/loi/tjhr20
Extended Engelund–Hansen type sedimenttransport relation for mixtures based on the sand-silt-bed Lower Yellow River, China
Kensuke Naito, Hongbo Ma, Jeffrey A. Nittrouer, Yuanfeng Zhang, BaoshengWu, Yuanjian Wang, Xudong Fu & Gary Parker
To cite this article: Kensuke Naito, Hongbo Ma, Jeffrey A. Nittrouer, Yuanfeng Zhang, BaoshengWu, Yuanjian Wang, Xudong Fu & Gary Parker (2019): Extended Engelund–Hansen type sedimenttransport relation for mixtures based on the sand-silt-bed Lower Yellow River, China, Journal ofHydraulic Research, DOI: 10.1080/00221686.2018.1555554
To link to this article: https://doi.org/10.1080/00221686.2018.1555554
View supplementary material
Published online: 21 Jan 2019.
Submit your article to this journal
Article views: 80
View Crossmark data

Journal of Hydraulic Research, 2019https://doi.org/10.1080/00221686.2018.1555554© 2019 International Association for Hydro-Environment Engineering and Research
Research Paper
Extended Engelund–Hansen type sediment transport relation for mixtures based onthe sand-silt-bed Lower Yellow River, ChinaKENSUKE NAITO (IAHR Member), PhD Student, Ven Te Chow Hydrosystems Laboratory, Department of Civil andEnvironmental Engineering, University of Illinois at Urbana-Champaign, Urbana, IL, USAEmail: [email protected] (author for correspondence)
HONGBO MA, Postdoctoral Research Associate, Department of Earth Science, William Marsh Rice University, Houston, TX, USAEmail: [email protected]
JEFFREY A. NITTROUER, Assistant Professor, Department of Earth Science, William Marsh Rice University, Houston, TX, USAEmail: [email protected]
YUANFENG ZHANG, Professor, Yellow River Institute of Hydraulic Research, Zhengzhou, Henan, PR ChinaEmail: [email protected]
BAOSHENG WU (IAHR Member), Professor, Department of Hydraulic Engineering, Tsinghua University, Beijing, PR ChinaEmail: [email protected]
YUANJIAN WANG, Deputy Chief Engineer, Yellow River Institute of Hydraulic Research, Zhengzhou, Henan, PR ChinaEmail: [email protected]
XUDONG FU, Professor, State Key Laboratory of Hydroscience and Engineering, Tsinghua University, Beijing, PR ChinaEmail: [email protected]
GARY PARKER (IAHR Member), Professor, Ven Te Chow Hydrosystems Laboratory, Department of Civil and EnvironmentalEngineering and Department of Geology, University of Illinois at Urbana-Champaign, Urbana, IL, USAEmail: [email protected]
ABSTRACTWhile the grain-sorting morphodynamics of gravel- and sand-bed rivers has been intensively studied, sand-silt bed rivers such as the Lower YellowRiver (LYR), China and the Pilcomayo River, Paraguay/Argentina have received much less attention. As a first step, we use a database from theLYR in the 1980s to develop a grain size specific extended Engelund–Hansen total bed material load relation. We then use this relation in twomorphodynamic calculations. First, we “spin-up” the calculation from an arbitrary bed slope over 600 years to reproduce the downstream finingobserved before the closing of Xiaolangdi Dam in 2000. We then cut off the sediment supply, and reproduce the observed pattern of bed coarseningas the bed armours in response to degradation. We argue that our model is likely not site-specific, but applies to other sand-silt bed rivers, basic datafor which is as yet lacking.
Keywords: Fluvial geomorphology; morphodynamics and channel form; river channels; sediment transport; suspended sediment
1 Introduction
The prediction of sediment transport rates in alluvial riversis important for many purposes, including sediment and
water resource management (MacArthur, Neill, Hall, Galay,& Shvidchenko, 2008), nutrient management (Cohn, 1995),maintenance of ecological diversity (Allan & Castillo, 2007),short-term/long-term prediction of river morphodynamics
Received 25 September 2017; accepted 23 October 2018/Currently open for discussion.
ISSN 0022-1686 print/ISSN 1814-2079 onlinehttp://www.tandfonline.com
1
2 K. Naito et al. Journal of Hydraulic Research (2019)
(Hicks & Gomez, 2016), and design of river disaster coun-termeasures (MacArthur et al., 2008). A sediment transportrelation proposed by Engelund and Hansen (1967) has been rec-ognized as performing well for sand-bed laboratory flumes andsand-bed rivers (Brownlie, 1981; Ma et al., 2017), and is com-monly used to predict the total bed material load (i.e. bed loadand bed material portion of suspended load). A question arisesas to whether the Engelund–Hansen (EH) relation performs wellfor sand-silt-bed rivers (i.e. rivers in which the silt content ofthe bed is substantial), such as the Lower Yellow River (LYR,herein defined as the reach between the Xiaolangdi Dam andthe river mouth; Fig. 1a) and some of its tributaries, where sus-pended load is the dominant phase of sediment transport andhyper-concentrated flows (volumetric concentration > 5%, asdefined in Pierson, 2005) occasionally occur. Another exampleof such a river is the Pilcomayo River at the border of Argentinaand Paraguay (Martín-Vide, Amarilla, & Zárate, 2014). Wu, vanMaren, and Li (2008) addressed this question of applicabilityof the EH relation to sand-silt-bed rivers based on an analysison more than 1000 sediment discharge observations from the
Yellow River. They reported that the standard EH relation is apoor predictor of total bed material load in the Yellow River. Asdiscussed in detail below, we also find that the EH relation sig-nificantly underpredicts the total load in the LYR (see also Maet al., 2017). In other words, the LYR has a much higher capac-ity rate of sediment transport than “typical” sand-bed rivers, forwhich the EH relation is often used to estimate total bed mate-rial load. This difference prevails even after accounting for themuch finer characteristic grain size in the LYR as compared totypical sand-bed rivers.
Furthermore, the EH relation is designed to predict thesediment load based only on a single representative bed mate-rial grain size. As was recognized by Engelund and Hansen(1967) themselves, the accuracy of the EH relation decreasesfor widely graded sediment. Local-scale sorting such as armour-ing and reach-scale sorting such as downstream fining havebeen recognized as important elements of river morphodynam-ics (Frings, 2008), especially in gravel-bed rivers and coarsesand-bed rivers, where bedload transport is the dominant phaseof sediment transport. In accordance with this observation, a
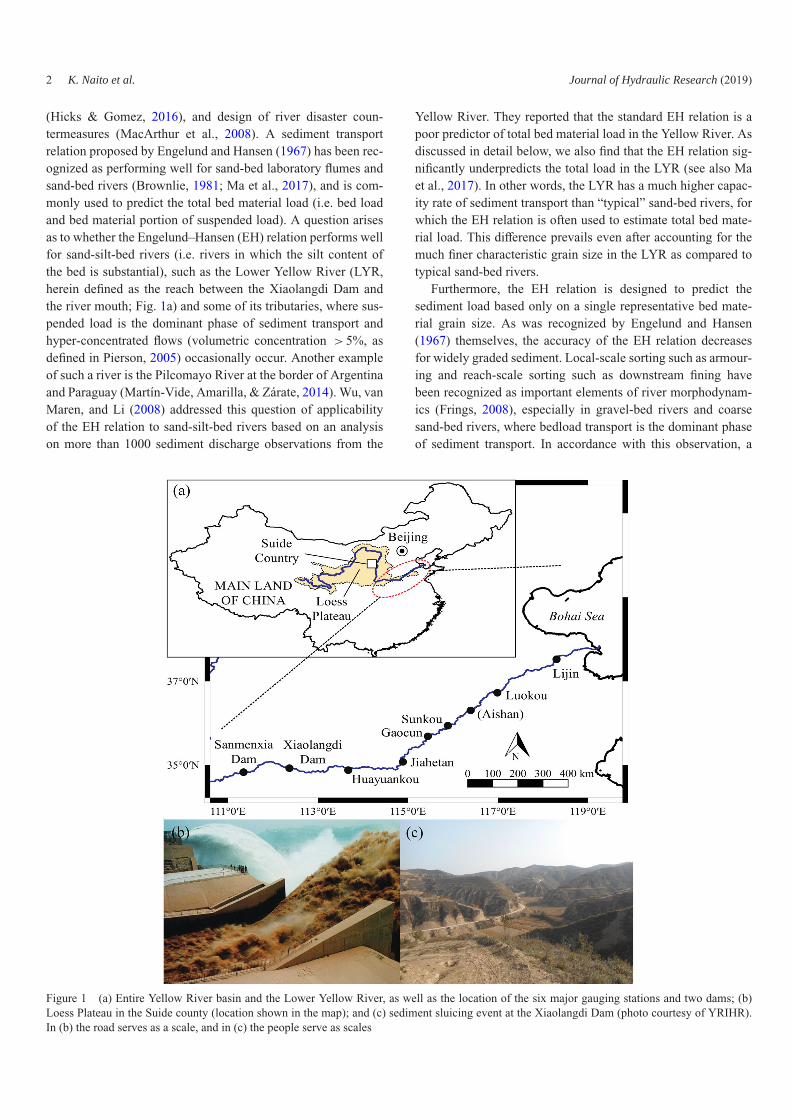
Figure 1 (a) Entire Yellow River basin and the Lower Yellow River, as well as the location of the six major gauging stations and two dams; (b)Loess Plateau in the Suide county (location shown in the map); and (c) sediment sluicing event at the Xiaolangdi Dam (photo courtesy of YRIHR).In (b) the road serves as a scale, and in (c) the people serve as scales

Journal of Hydraulic Research (2019) Extended Engelund–Hansen type sediment transport relation 3
large number of grain size specific sediment transport relationsfor gravel-–sand mixtures and sand mixtures have been devel-oped (e.g. Ashida & Michiue, 1972; Hirano, 1971; Parker, 1990,1991a, 1991b; Parker & Klingeman, 1982; Wilcock, 1997;Wilcock & Crowe, 2003; Wright & Parker, 2005a, 2005b), andsome researchers have developed an extended form of the EH-type relation for mixtures (Blom, Arkesteijn, Chavarrías, &Viparelli, 2017; Blom, Viparelli, & Chavarrias, 2016). How-ever, the application of these relations has been made only tosand-bed and gravel-bed rivers, mostly because grain sorting insand-silt-bed rivers has not been recognized outside of China.
Sand-silt-bed rivers such as the LYR, however, do exhibittrends of grain sorting. A comprehensive dataset on suspendedsediment load and its grain size distribution (GSD), as wellas bed material GSD, was assembled in the period 1980–1990by the Yellow River Institute of Hydraulic Research (YRIHR),China (Long & Zhang, 2002; Zhang, Long, & Shen, 1998).These data show a clear trend toward downstream fining of thebed material (Fig. 2). This pattern of downstream fining, whichpredates the closing of Xiaolangdi Dam in 2000, appears to be anatural response as the river debouches from the relatively high-slope Loess Plateau to the relatively low-slope North ChinaPlain. Moreover, provided that the particles that compose thebed surface of the LYR are primarily silt and sand, it is rea-sonable to consider that the downstream fining is dominatedby size-selective transport rather than abrasion of the particles(Parker, 1991a). Figure 2 further demonstrates that the LYR hasshown significant bed degradation and coarsening since the clo-sure of Xiaolangdi Dam (Chen, Zhou, & Qiang, 2012; Ta, Wang,& Jia, 2011). This is a response to the dramatic reduction of thesediment supply to the LYR due to the installation of XiaolangdiDam. The pattern of coarsening has been gradually propagatingdownstream since 2000.
In order to reproduce the pattern of downstream variation ofgrain size in the LYR, as well as compute the time evolution
0 200 400 600 8000.06
0.08
0.10
0.12
0.14
x (km)
Dg
(mm
)
HYK
JHTGC
SKLK LJ
Figure 2 Downstream variation of Dg . Black dots are from the datasetcollected in the period 1980–1990 which has been used in this study,and crosses are the dataset collected in 2009 and reported by Chen et al.(2012). The single point at Jiahetan notwithstanding, the data show aclear overall trend toward downstream fining. HYK, JHT, GC, SK, LKand LJ stand for Huayuankou, Jiahetan, Gaocun, Sunkou, Loukou andLijin, respectively
of this pattern, it is necessary to have a grain size specific sed-iment transport relation. A knowledge of sorting in the lowerreach of a sand-bed river, where the river flows into a standingbody of water such as the ocean, can provide insight into theunderstanding of the dynamics of delta evolution. For example,a grain size specific sediment transport relation allows predic-tion of the range of sediment sizes that is available for deltaconstruction and delivery to the sea. Most sediment transportrelations designed for the Yellow River are based on a singlecharacteristic grain size of the bed, or of the suspended load (e.g.Wu & Long, 1993; Yang, Molinas, & Wu, 1996; Zhang, 1959).Zhang, Huang, and Zhao (2001; as reported in He, Duan, Wang,& Fu, 2012) present a sediment transport relation designed forthe Yellow River that does indeed calculate grain size specifictransport rates. This formulation, however, calculates the vol-ume fraction content in the load as an algebraic function of thevolume fraction content in the bed, and is thus in conflict withthe grain size specific Exner equation of sediment continuity.
In this study, we present a surface-based grain size specificsediment transport relation as an extension of the generalizedEH-type relation using a single grain size that was recently pro-posed by Ma et al. (2017). Our relation is developed so as toallow calibration using site-specific field data. Therefore, themodel is applicable to both sand-bed rivers and sand-silt-bedrivers. Here we evaluate the formulation using data for the LYR.We use the relation to predict “broad-brush” aspects of long-term morphodynamics such as the evolution of the river bedprofile and GSD of the bed surface in the LYR.
2 The LYR and dataset
The Yellow River is a silt-rich river that carries a large amountof fine sediment in suspension at relatively high concentrations,i.e. up to hundreds of kilograms per cubic metre (Jiongxin,1999). It has been recognized as the second largest in the worldin terms of the sediment load delivered to the ocean (Milliman &Meade, 1983). The river originates in the Bayankala Mountainsand flows through the Loess Plateau, which is located along themiddle reach of the Yellow River and where about 90% of thesediment load is produced (Wang et al., 2016; Yu, Shi et al.,2013; Yu, Wang et al., 2013). Until the closure of XiaolangdiDam in 2000, the annual sediment load of the LYR was ashigh as 1.08 Gt, accounting for 6% of the total sediment fluxfrom global rivers to the ocean (Milliman & Meade, 1983). Dueto this high sediment load, the river system had until recentlybeen aggrading at a high rate. In the lower reach, the bed ele-vation is higher by up to 10 m than the surrounding floodplain(“hanging riverbed”, Fig. S2b in the online supplemental data).This high sediment load has also led to the rapid formationof a new delta lobe, which began prograding in 1855 and wasmore than 5000 km2 in area in 2010 (Wang et al., 2010). Asdescribed below, since the closure of Xiaolangdi Dam, however,the sediment load in the LYR has dropped substantially.

4 K. Naito et al. Journal of Hydraulic Research (2019)
Xiaolangdi Dam was installed about 860 km upstream of theriver mouth and closed in 2000. It is located near where theriver debouches from the Loess Plateau to the North ChinaPlain. Once per year, during the flood season (July–October),water and sediment are released from Xiaolangdi Dam in orderto preserve reservoir capacity and scour the bed of the riverdownstream (Ma et al., 2017; Yu, Wang et al., 2013). It isintended that this scouring will mitigate flood risk. Wang et al.(2007) pointed out that the installation of large dams such asXiaolangdi Dam and Sanmenxia Dam, which is located about130 km upstream of Xiaolangdi Dam, as well as climate change,have brought about a step-wise decrease in the water and sedi-ment discharge to the lower reach and the Bohai Sea. Figure 1ashows the Yellow River, two major dams, i.e. Xiaolangdi Damand Sanmenxia Dam, and six major hydraulic gauging stations.A modern view of the Loess Plateau in Suide County, ShaanxiProvince is shown in Fig. 1b. It should be mentioned that theland surface in parts of the Loess Plateau is presently relativelymore vegetated than in the recent past, owing to vigorous effortstoward revegetation associated with the “Grain to Green Pro-gram” launched in 1999 (Chen et al., 2015). Figure 1c showsa sediment sluicing event at Xiaolangdi Dam. In this study, wefocus on the lower part of the Yellow River, i.e. the LYR.
Datasets used in this paper were developed in 1980–1990 bythe Yellow River Institute of Hydraulic Research, Zhengzhou,China, at the following six major gauging stations along theLYR in order downstream; Huayuankou, Jiahetan, Gaocun,Sunkou, Luokou and Lijin (Long & Zhang, 2002; Zhang et al.,1998, Fig. 1a). Each dataset contains records of flow rate, bedslope, flow width, flow depth, mass concentration of suspendedsediment, and GSD of both bed material and suspended load, allat what was interpreted to be quasi-equilibrium state, in whichdeposition and entrainment of the bed material are locally notfar out of balance. It is worth repeating that the datasets weredeveloped before the construction of Xiaolangdi Dam, whichwas closed in 2000. It should also be noted that the dataseton sediment transport of the LYR does not report direct mea-surements of bed load; only the suspended load was directlymeasured. The bedload transport rate was estimated accordingto the procedure discussed in Ma et al. (2017); it was found tobe negligible compared to the suspended load.
3 Generalized Engelund–Hansen formula (the EHrelation) for single grain size
Figure 3 shows the GSDs of bed material and suspended loadat the Lijin gauging station. The GSDs of bed material and sus-pended load of the Mississippi River at St. Louis, USA, whichis considered as a typical sand-bed river, are also plotted forcomparison. It is seen that the bed of the LYR contains a largefraction of silty sediment that is finer than 62 μm, a range thatis typically considered to be wash load in most sand-bed rivers(e.g. Woo, Julien, & Richardson, 1986), such as the Mississippi
62 m15 m
10–210–3 10–1 100 101 102
D (mm)
0
20
40
60
80
100
Perc
ent f
iner
(%
)
LYR_BM
LYR_SL
MR_BM
MR_SL
Figure 3 GSD of the bed material and suspended load of the LYRat Lijin (LYR_BM and LYR_SL, where BM indicates bed material andSL indicates suspended load) averaged over the period 1980–1990; andGSD of the Mississippi River at St Louis, USA (MR_BM and MR_SL)averaged over the period 1960–2011. Included in the plot are verticallines denoting 62 μm, corresponding to a “standard” divider for bedmaterial load versus wash load, and 15 μm, the divider used herein forthe LYR
River, as can be seen in Fig. 3. Wash load is defined as the sed-iment that is being transported, but is too fine to be found ineasily measurable quantities in the bed (Bettess, 1994). For theLYR, we select 15 μm (0.015 mm) to be the cut-off size for washload (Ma et al., 2017). Sediment finer than 15 μm is consideredto be wash load, and hence is excluded in the development ofthe sediment transport relation herein.
A generalized form of the total load relation in accordancewith the EH relation takes the form:
Cf q∗T = A(τ ∗
g )B (1)
where Cf is the bed friction coefficient, q∗T is the Einstein num-
ber or dimensionless total load per unit width, and τ ∗g is Shields
number or dimensionless bed shear stress based on bed geomet-ric mean grain size Dg . The parameters A and B are constants,with A = 0.05 and B = 2.5 for the original EH relation. In theabove relation, the friction coefficient Cf is defined as:
Cf = τb
ρU2 (2)
where τ b denotes bed shear stress, U denotes depth-averagedflow velocity, and ρ denotes the density of the water–sedimentmixture. The Einstein number q∗
T is defined as:
q∗T = qT√
RgDg3
(3)
in which qT is total bed material load per unit width, R is sub-merged specific gravity of sediment (R = 1.65 for quartz), andg is gravitational acceleration. While the original EH relationmakes use of the median grain size of the bed surface D50,we instead make use of geometric mean grain size Dg in apreliminary treatment of sediment mixtures. Assuming that the

Journal of Hydraulic Research (2019) Extended Engelund–Hansen type sediment transport relation 5
( )Y = 0.05X2.50
( )Y = 0.751X2.195
10–110–4
10–2
100
102
104
100 101 102
LYR_LJ data
LYR_LJ relation
EH relation
Cfq
T*
(-)
τg* (-)
Figure 4 Plot of observed data of Cf qT* versus τ∗g for the LYR at
Lijin (LYR_LJ data), along with a fit line for our EH type relationadapted for the LYR (LYR_LJ relation) and for the original EH relation(EH relation)
flow is steady and uniform (i.e. normal flow approximation), theShields number τ ∗
g is computed as:
τ ∗g = τb
ρRgDg= HS
RDg(4)
where H and S denote flow depth and downstream channelslope, respectively. Implicit in Eq. (4) is the evaluation of thebed shear stress τ b from the form appropriate for equilibrium(normal) flow:
τb = ρgHS (5)
This assumption is justified for the quasi-equilibrium case usedfor the LYR data, as outlined in Ma et al. (2017).
Figure 4 shows a plot of the product of the dimensionlessfriction coefficient and the Einstein number, i.e. Cf qT*, versusShields number τ ∗
g , along with the data from the Lijin gaug-ing station and the best fit of the generalized EH relation (Eq.(1)). A linear regression analysis indicates that the coefficient Aand exponent B in Eq. (1) for the Lijin dataset are A = 0.751and B = 2.195, with a value of the coefficient of determinationR2 = 0.85. It is seen that the original EH relation greatly under-estimates the total load, indeed by a factor of nearly 20. Thisindicates that the original EH relation is not appropriate for thecase of sand-silt-bed rivers with high sediment loads such as theLYR.
4 Surface-based grain size specific sediment transportrelation
Parker (1990) proposed a grain size specific bed load transportrelation, assuming that the bed is classified into two layers: sur-face layer (or active layer) and subsurface layer (or substrate).The relation is a “surface-based” relation, since it requiresknowledge of the GSD of the bed surface, as opposed to a“subsurface-based” relation that requires the knowledge of thesubsurface of the bed (Parker, 1990). Although the GSD of
sediment yield of the reach may in some cases be similar to thatof the subsurface, it is the exposed sediment at the bed surfacethat is directly available for entrainment into transport from thebed (Parker, 1990).
Adapting the form of Parker (1990) to correspond with EH,we define the general dimensionless form of the grain sizespecific bed material load as follows:
N ∗i = Cf RgqTfi
u∗3Fi(i = 1, 2, 3, . . . , N ) (6)
where Ni∗ is dimensionless bed material transport rate for the
grain in ith size range, fi is the volume fraction content of the ithsize range grain in the total bed material load, Fi is the volumefraction content of the ith grain size range in the bed surface(active layer), and u* is the shear velocity. Here we relate theabove parameters to hydraulic conditions using power functionsas follows, so as to parallel the original form of the EH relation:
N ∗i = Ai(τ
∗i )Bi (7)
where Ai and Bi are coefficients and exponents for the ith grainsize range. In the case of the original EH relation, designed fora single grain size, A and B are 0.05 and 1, respectively. Also τ ∗
iis the Shields number for the ith size range, defined by means ofEq. (4) as:
τ ∗i = HS
RDi= τ ∗
gDg
Di(8)
Here Di denotes the characteristic bed material size of the ithgrain size range. Therefore, one can rewrite Eq. (7) as:
N ∗i = Ai
(τ ∗
gDg
Di
)Bi
(9)
It should be noted that unlike other surface-based relations suchas the ones by Parker (1990), Tsujimoto (1991), and Hunzikerand Jaeggi (2002), there is no critical Shields number or refer-ence Shields number in the present formulation. This is becausethe flow is considered to be always well above the thresholdcondition for sediment entrainment for any grain size on thebed surface, allowing neglect of the effect of critical Shieldsnumber. Parker (1990) and Kuhnle (1992) have indicated thatcoefficients similar to Ai and Bi can be cast as functions of grainsize Di. We thus empirically relate Ai and Bi to the correspond-ing grain size of the ith range and geometric mean grain size asfollows:
Ai = fA
(Di
Dg
), Bi = fB
(Di
Dg
)(10)
The dimensionless form of the total bed material load NT∗ is
expressed in the form of the summation below:
N ∗T = Cf RgqT
u∗3 =∑i=1
[FiAi
(τ ∗
gDg
Di
)Bi]
(11)

6 K. Naito et al. Journal of Hydraulic Research (2019)
The advantage of the form of the above equation is that theeffect of grain size is placed only on the right-hand side, solimiting spurious correlation in grain size when determining theregressions. Moreover, in terms of sediment sizes, this relationrequires only the GSD of the bed material. It does not requireknowledge concerning the size of sediments that are in trans-port in order to estimate the bed material load transport rate.This is in contrast to e.g. the relations of Zhang (1959), Wu andLong (1993) and Yang et al. (1996), which are inherently circu-lar in requiring advance knowledge of parameters pertaining tothe load in order to compute it. The bed material transport rateof sediment in the ith grain size range qi and total bed materialtransport rate qT are respectively given as:
qi = qTfi = Fiu3
∗Cf Rg
[Ai(τ∗i )
Bi ] (12)
qT =∑i=1
qi = u3∗
Cf Rg
∑i=1
[FiAi
(τ ∗
gDg
Di
)Bi]
(13)
It should be pointed out that in the present formulation, if aGSD is not represented in the bed surface, it will not be rep-resented in the bed material transport as well. Size ranges thatare present in suspension, but not present above some thresholdin the bed (here we use 5%, as documented in Ma et al., 2017),are categorized as wash load. The volume fraction content ofthe ith grain size in the total bed material load fi is computed asfollows:
fi =FiAi
(τ ∗
gDg
Di
)Bi
∑[FiAi
(τ ∗
gDg
Di
)Bi] (14)
5 Implementation
5.1 Model implementation for the case of the LYR
We implement the relation for the case of the LYR with theuse of the Lijin dataset. Here the GSD is divided into five bins(N = 5): Di = 0.019, 0.035, 0.071, 0.158 and 0.354 mm. Intreating such fine material, it should be recognized that cohe-siveness can play a significant role in sediment transport. In thecase of the Yellow River, however, cohesiveness is rather weak(Tian, Wang, Li, & Li, 2016; Wang, Wang, & Tian, 2007). Inthis analysis, therefore, we do not consider the effect of sedimentcohesion.
Plots of N ∗i versus τ ∗
i are made so as to obtain the values ofAi and Bi empirically using least-square linear regression anal-ysis for each grain size range (Fig. 5). The values of τ ∗
i arecalculated from the measured data by means of Eq. (8), andthe single representative value of 67 μm for Dg . Table 1 sum-marizes the values of Ai and Bi, as well as the coefficient ofdetermination R2 and standard error µ for each grain size range
10–3
10–5
10–1
101
Ni*
(-)
10–1 100 101
τi* (-)
( )Y = 0.533X 0.49
( )Y = 1.09X 1.0
( )Y = 0.73X 0.89
( )Y = 0.33X 0.14
( )Y = 0.08X 0.04
Di = 0.019 mm
Di = 0.035 mm
Di = 0.071 mm
Di = 0.158 mm
Di = 0.354 mm
Figure 5 Plot of N∗i versus τ∗
i . It is seen that dependency of N∗i on
τ∗i decreases with increasing grain size. The results of the regression
analysis are also summarized in Table 1
Table 1 Results of linear regression analysis used to findthe values of Ai and Bi
Di (mm)
Parameters 0.019 0.035 0.071 0.158 0.354Ai 1.09 0.72 0.53 0.33 0.08Bi 1.00 0.89 0.49 0.14 0.04R2 0.48 0.40 0.21 0.03 0.01µ 0.38 0.39 0.34 0.31 0.46
The coefficient of determination R2 and the standard error µare also shown. The regression analysis is shown in Fig. 5.
obtained from the analysis. Regression results indicate that thecorrelation is not significant in a statistical sense, especially forcoarser grain sizes. This is likely due to the inherent scatter inthe data associated with a river with high variability such as theYellow River. This limitation notwithstanding, the correlationsare readily apparent by eye, and in the absence of alternativedata, we use them as a practical basis for a method to computethe transport of mixed sizes in the Yellow River. It is seen inTable 1 that the values of both Ai and Bi decrease with increasinggrain size Di. This suggests that the transport rate of relativelycoarser grains is less dependent on the flow rate than that of therelatively finer grains. This contrasts with the finding by Kuhnle(1992), in which it was found that Bi slightly increases withincreasing Di/Dg (Blom et al., 2017).
We now relate the values of Ai and Bi so obtained to thecorresponding grain size Di normalized by the bed surface geo-metric mean grain size Dg (Fig. 6), in order to obtain a predictiverelation for Ai and Bi. Regression analysis yields the followingrelations for Ai and Bi for given grain size:
Ai = 0.455(
Di
Dg
)−0.839
(15)
Bi = 0.353(
Di
Dg
)−1.157
(16)

Journal of Hydraulic Research (2019) Extended Engelund–Hansen type sediment transport relation 7
10–1
10–1 101
100
( ) Y = 0.46X-0.84
( )Y = 0.35X-1.16
100
AiBi
Ai
(-),
Bi
(-)
Di /Dg (-)
Figure 6 Plot of Ai and Bi in Eq. (9) versus Di/Dg . Values of Ai andBi both decrease with increasing grain size
Lastly, we illustrate the applicability of the proposed relation,which was obtained using data at the Lijin gauging station,with the use of the datasets at the Gaocun and Sunkou sta-tions, i.e. the two nearest stations upstream. Figure S1 in theonline supplemental data shows a comparison of the proposedrelation against the observed data at Gaocun and Sunkou sta-tions. The plot is made in the form of a generalized EH relation(Cf qT*), rather than the proposed form for the total bed mate-rial load using the parameter NT
∗. It is seen in Fig. S1 that while
the proposed relation developed based upon Lijin dataset doesnot necessarily represent the entire LYR accurately, it shows ageneral pattern of agreement between predicted and measuredvalues. The development of a site-specific relation applicable toeach gauging station may be needed for more precise predictionof the sediment bed material transport rate. The methodologyfor this is straightforward but is not implemented in this firstanalysis. Ma et al. (2017), for example, have shown that thecoefficient A and exponent B in Eq. (1) for total load vary mildlybut systematically in the streamwise direction. These commentsnotwithstanding, our relation is adequate for a “broad-brush”treatment of the morphodynamics of the LYR as a whole.
5.2 General behaviour of the implemented model
Figure 7 shows the general behaviour of the proposed sedi-ment mixture transport relation, as implemented for a case basedon parameters for the LYR. The bed shear stress τ ∗
g is com-puted for fixed values of channel slope, channel resistance andchannel width, and over a range of values for water discharge.More specifically, down-channel slope is 0.00015, dimension-less Chezy resistance coefficient is 30, channel width is 500 m,and water discharge varies from 100 to 10000 m3 s−1. With the
(a)
)d()c(
(b)
10–3
10–5
10–7
q i, q T
(m
2 s–1
)
τg*(-)
10–1
80
60
perc
ent f
iner
(%
)
perc
ent f
iner
(%
)
40
20
100
0
80
60
40
20
100
0.10
0.08
0.06
0.04
0.12
0.02
0
10–9
10010–1
total
BS_model
BML_model
BS_model
BML_model
BS_modelBML_model
BS_fieldBML_field
coarse
mid
fine
101
τg*(-)
10010–1 101
D (mm)
Dg
(mm
)
10–110–2 100 101
D (mm)10–110–2 100 101
τg*= 0.1 τg
*= 9
Figure 7 Illustration of general behaviour of the proposed bed material transport model. (a) Relation between qT, as well as qi (coarse, mid, and fine)and τ∗
g . (b) Geometric mean grain size of total bed material load (dashed line (BML_model): model results, crosses: observed data) and bed surface(solid line (BS_model): model results, dots: observed data) versus τ∗
g . (c) GSD of bed surface (BML_model) and bed material load (BML_model)for the case τ∗
g = 0.1. (d) Corresponding distribution for the case τ∗g = 9

8 K. Naito et al. Journal of Hydraulic Research (2019)
use of the bed material GSD at the Lijin gauging station, totalbed material load, as well as bed material load for each grain sizerange is computed over a range of values of bed shear stress τ ∗
gcorresponding to varying water discharge. Figure 7a shows thetotal bed material load qT, as well as the bed material load forthe three grain size ranges with characteristic sizes 0.354 mm(coarse), 0.158 mm (middle), and 0.035 mm (fine). It is seenthat both total bed material load qT and the bed material loadfor each grain size range qi increase with increasing bed shearstress τ ∗
g . Unlike gravel bed rivers where the GSD of the bedmaterial load approaches that of the bed surface as the bed shearstress increases (Parker, 2008), in the case of the LYR the GSDof the load diverges from that of bed material and becomes fineras the bed shear stress increases (Fig. 7b). This fining of theload is associated with the negative correlation of the exponentBi with Di/Dg seen in Fig. 6 (Eq. (16)). Figure 7c and 7d showthe GSDs of the bed material and the load for low bed shearstress (τ ∗
g = 0.1) and high bed shear stress (τ ∗g = 9), respec-
tively, for a set bed slope of 0.00015. Figure 7 also demonstratesthat the fraction of fine material increases with increasing bedshear stress, causing overall fining of the bed material load.
The relation for suspended load of Wright and Parker (2004)in sand-bed rivers also does not satisfy equal mobility at highshear stress. Instead, it satisfies “equal entrainability”, wherebythe entrainment rate into suspension is linearly proportional tofraction content in the bed surface layer. The suspended trans-port rate of each grain size range is then calculated using astratification-corrected Rousean formulation. The exponent inthis formulation includes the ratio u∗/vsi: this guarantees a biastoward a suspended load that is finer than the bed surface. Itshould be noted that whereas in our illustrative calculation forthe Yellow River the GSD of the bed surface is fixed, the mor-phodynamics calculations presented in the following sectionallow the bed surface sediment composition to change as thechannel bed evolves.
6 Calculational example: downstream fining, bedcoarsening and 1-D morphodynamics calculation of theLYR
After the latest major avulsion of the river in 1855 (e.g. Wrightet al., 1990; Xue, 1993), the channel bed of the LYR contin-uously aggraded due to the high sediment load until the riverbed near Huayuankou was about 10 m higher than the surround-ing floodplain beyond the levees (Wu, Wang, Xia, Fu, & Zhang,2008). This aggradation was brought to a halt by the closureof Xiaolangdi Dam, 120 km upstream of Huayuankou, in 2000.We refer to the bed in the two decades before the closure of thisdam as in the “pre-Xiaolangdi” condition. Since most of the bedmaterial that now flows into Xiaolangdi Dam is captured by thedam (“post-Xiaolangdi” condition), the bed material supply tothe LYR has been substantially reduced, leading to degradationof the bed and coarsening of the bed surface (e.g. Chen et al.,
2012; Yu, Shi et al., 2013; Yu, Wang et al., 2013). More-over, as mentioned above, datasets for the LYR indicate a trendtoward downstream fining both before and after the installationof Xiaolangdi Dam (Chen et al., 2012; see also Fig. 2). Here,with the use of our proposed grain size specific total load rela-tion, we study the long-term evolution of the GSD of the bedsurface, as well as the bed elevation profile. Our purpose is todemonstrate the use of our proposed sediment transport relationand its capability for predicting the general patterns of down-stream fining, as well as the bed coarsening induced by bedmaterial supply reduction, that have been observed in the LYR.This simulation is not intended to precisely reproduce currentconditions of the LYR. In order to do this, it would be neces-sary to include a plethora of elements of geometric complexity(e.g. multiple levees of spatially varying height and width anddetailed hydrographs; He et al., 2012) that would distract fromthe purpose of this paper.
6.1 Modelling formulation
Wright and Parker (2004) and He et al. (2012) use anentrainment-based formulation for the Exner equation of sed-iment continuity. That is, they calculate the variation in bedelevation and surface GSD in terms of the difference betweenan entrainment rate into suspension and a deposition rate fromsuspension. Here, however, we use a flux-based formulation,in which the local sediment transport rate equals the capacityvalue for the flow, and the bed elevation variation is related tothe downstream gradient in streamwise sediment transport rate.The use of the flux form is likely generally appropriate becausethe LYR dataset was developed under quasi-equilibrium con-ditions, in which the flow carries bed material at its transportcapacity and sediment deposition to the bed and sedimententrainment of the sediment from the bed are locally in balance(Long & Zhang, 2002; Zhang et al., 1998).
As shown in Fig. S2a in the online supplemental data, weconsider a reach of the LYR in which the channel is sinuouswithin a floodplain. The channel has sinuosity Ω . The modellingequations are composed mainly of three equations: a momen-tum equation for the flow, a sediment transport relation, andsediment mass conservation equation. The flow is assumed tobe steady and uniform, i.e. we use the normal flow approxima-tion. This yields the following form of the momentum balanceequation:
Qbf = Cz√
gHbf SHbf Bbf (17)
where Qbf is bankfull discharge, Cz is dimensionless Chezyresistance coefficient, Hbf is bankfull depth, and Bbf is bankfullwidth. In order to simplify the simulation of long-term morpho-dynamics, we assume that the river is at bankfull conditions,which are sustained for the morphodynamically active time frac-tion If (flood intermittency factor, Paola, Heller, & Angevine,1992). That is, the river is assumed to be at low flow and inac-tive for time fraction 1 – If . For the sediment transport relation,

Journal of Hydraulic Research (2019) Extended Engelund–Hansen type sediment transport relation 9
we employ our proposed grain size specific total load relation,i.e. Eqs (12) and (13). For bed material mass conservation, weemploy the active layer concept first proposed by Hirano (1971).The active layer is the surface layer of the bed which directlyinteracts with bed material load via exchange of mass, whereasthe substrate is the layer that interacts only with the active layervia aggradation or degradation (Fig. S3 in the online supple-mental data). The active layer is, by definition, assumed here tohave no vertical structure in terms of GSD. We implement thestandard 1-D Exner equation in such a way that the equation iscapable of accounting for multiple grain sizes using the activelayer concept as follows:
(1 − lp)
[FIi
∂(η − La)
∂t+ ∂(FiLa)
∂t
]
= − (1 + Λ)ΩIf Bbf
Bf
∂(qTfi)∂x
(18)
where t is time, x is the streamwise coordinate, FIi is the fractionin ith grain size at the interface between the substrate and theactive layer, La is active layer thickness, Fi is the volume frac-tion content of ith grain size range in the active layer, lp is bedporosity, and Bf is floodplain width (Figs S2 and S3 in the onlinesupplemental data). In addition, Λ is volume fraction of washload deposited on the floodplain per unit deposition of bed mate-rial load. That is, we assume that for each unit of bed materialdeposition, Λ units of wash load are deposited so as to con-struct the channel–floodplain complex. Thus, η denotes channelbed–floodplain averaged (mean) elevation. Summing over allgrain sizes, the following standard Exner equation describingbed elevation evolution is obtained:
(1 − lp)∂η
∂t= − (1 + Λ)ΩIf Bbf
Bf
∂qT
∂x(19)
Between Eqs (18) and (19), the following equation describingthe evolution of the GSD of the active layer is obtained:
(1 − lp)
[La
∂Fi
∂t+ (Fi − FIi)
∂La
∂t
]
= − (1 + Λ)ΩIf Bbf
Bf
(∂(qTfi)
∂x− FIi
∂qT
∂x
)(20)
Active layer thickness and stratigraphy
Active layer thickness La is assumed to scale with dune heightΔdune in the case of sand-bed rivers (Deigaard, 1980). Althoughthe presence or absence of dunes in the Yellow River remainssomewhat poorly understood (Ma et al., 2017; Parker, Fu,Zhang, Zinger, & Konsoer, 2013) we employ a relation by Julienand Klaasen (1995) to estimate the dune height Δdune in thisstudy. Julien and Klaasen (1995) described dune height as afunction of flow depth H and median grain size D50 of the bed
surface in the following form:
dune = ξH(
D50
H
)0.3
(21)
where ξ denotes a constant that varies between 0.8 and 8. Inimplementing the above formula, we have replaced D50 withsurface geometric mean size Dg for simplicity. The active layerthickness then takes the following form:
La = αaldune (22)
in which αal is a user-specified constant, which is the ratio ofactive layer thickness to dune height. Taking approximately themedian value of 0.8–8, the value of ξ is set to be ξ = 4, and thevalue of αal is set to be αal = 2, respectively. When the bed issubject to degradation and the GSD of the active layer is coarserthan that of the substrate, the simulation is subject to ellipticity(Ribberink, 1987; Stecca, Siviglia, & Blom, 2014). The valuesof ξ and αal have been carefully selected so as to avoid suchnumerical instability. The GSD of the active layer evolves asthe bed aggrades or degrades. As the bed aggrades, some com-bination of the bed material load and the active layer material istransferred to the substrate, while as the bed degrades the mate-rial in the substrate is transferred to the active layer. Thus, thefollowing condition holds:
FIi =
⎧⎪⎨⎪⎩
Fsubi for∂η
∂t< 0
αtransFi + (1 − αtrans)fi for∂η
∂t> 0
(23)
where Fsubi and αtrans denote the volume fraction content inthe substrate and the weighting factor for the substrate-activelayer sediment transformation, respectively (Hoey & Ferguson,1994; Toro-Escobar, Parker, & Paola, 1996). Wright and Parker(2005a, 2005b) argue that the value of αtrans should be close to1 in the case of sand-bed rivers, because sediment in the loadcannot easily be sieved through the surface layer (active layer),which becomes finer when the bed aggrades. However, they alsocall for the further investigation concerning this point. Thus, dueto a lack of knowledge of the dynamics at the surface layer-substrate interface, the value of αtrans is set to be αtrans = 0.5 inthis study. The uncertainty associated with the selection of thevalue should be kept in mind.
We first allow the bed to aggrade at the scale of centuriesso as to reproduce the present-day upward concave profile ofthe LYR, and concomitant downstream fining. We then substan-tially reduce the sediment supply so as to mimic the effect ofXiaolangdi dam in 2000, and model incisional degradation andbed coarsening at the decadal scale. It is thus necessary to storethe vertical stratigraphy, i.e. the vertical variation of the GSD ofthe substrate created by aggradation in the model, so that sub-sequent degradation consumes this material. More specifically,the volume fraction content of the ith size range grain in the

10 K. Naito et al. Journal of Hydraulic Research (2019)
substrate Fsubi, which can vary in the streamwise and verticaldirection as the flow emplaces new substrate during aggrada-tion, needs to be stored. In order to achieve this, a numericalmethod proposed by Viparelli, Sequeiros, Cantelli, Wilcock, andParker (2010) is implemented. At each computational node, thesubstrate is divided into storage sublayers, except at the top,which corresponds to the interface between the active layer andsubstrate (Fig. S3). Each storage sublayer has the thickness Ls,which is set to be 1 m in this study. As the bed aggrades, newstorage layers are added to the top as needed, whereas as thebed degrades, the storage layers are consumed in order from thetop down. More details on the implementation of stratigraphystorage are found in Viparelli et al. (2010).
Boundary conditions
The bed elevation is fixed at the downstream end; we do notconsider backwater effects and delta progradation, or any exter-nal forcing such as tectonic subsidence or sea level rise. Bedmaterial is supplied only at the upstream end, and we con-sider no tributaries or other sources of sediment supply withinthe study reach. Although the channel we consider is for themost part in a low-amplitude meandering configuration, neitherchannel migration nor secondary flow is considered in the 1-Dcalculation presented here.
6.2 Computational set-up
Computational scenario
First, we run the model for several hundred years with “pre-Xiaolangdi” conditions, for which water discharge and bedmaterial supply are relatively high. This allows us to “spin-up”the model so as to loosely reproduce recent “pre-Xiaolangdi”conditions, including the aggressive bed aggradation and thetendency for downstream fining that was observed in 1980s(Fig. 2). It should be kept in mind that our interest herein isto reproduce the trends of downstream fining as well as bedcoarsening in response to dam closure. The time required for thespin-up simulation does not have a precise physical meaning,but must be large enough to allow the river to reach an approx-imation of the pre-Xiaolangdi profile from the specified initialbed profile. We then change to “post-Xiaolangdi” conditions,for which the bed material supply is reduced significantly butwater discharge is kept unchanged, and run for 10 more years.
Bankfull discharge and bed material feed rate
Wu et al. (2008) reported a time series of annual sediment loadand bankfull discharge between 1960 and 2003 at various loca-tions, including the Huayuankou and Lijin gauging stations.From the time series at the Huayuankou station, we selecteda representative value of the annual sediment load by takingan average between 1980 and 1999. We assumed, based on ananalysis of the GSD of the suspended load at Huayuankou, that55% of annual sediment load is bed material and the remaining
45% is wash load. Here wash load corresponds to material finerthan 15 μm (Ma et al., 2017). Thus, for the “pre-Xiaolangdi”condition, the bed material feed rate GTfeed, pre is set to beGTfeed, pre = 385 Mt yr−1 (700 Mt yr−1 including wash load. Asimilar number is reported by Gao et al., 2010; Wang et al.,2007).
In a similar manner, bankfull discharge for the “pre-Xiaolangdi” condition was determined by taking the average ofthe time series between 1980 and 1999 at Lijin station reportedby Wu et al. (2008). We selected 4500 m3 s−1 as the represen-tative bankfull discharge of the reach (Qbf = 4500 m3 s−1; asimilar value is reported by Wang & Li, 2011).
The annual sediment load averaged between 2000 and2003 in the report by Wu et al. (2008) shows that it hasdecreased by nearly 90% compared to the “pre-Xiaolangdi”condition. For the “post-Xiaolangdi” condition, therefore, wereduce the annual sediment supply rate by a factor of 1/10 (i.e.GTfeed,post = 38.5 Mt yr−1, excluding wash load). Meanwhile,bankfull discharge is left unchanged for simplicity.
Model geometry and planform
The computational setup is summarized in Table S1 in the onlinesupplemental data. The modelling reach is between XiaolangdiDam and the river mouth, which is about 860 km (L = 860 km,where L is the reach length). Although there are some upstreamsections where the channel is braided, here we assume that thechannel is single-thread, rectangular and sinuous everywhere(Fig. S2a), in light of the fact that 87% of the study reachis indeed single-channel. Reach-representative bankfull chan-nel width Bbf is set to 500 m (Bbf = 500 m) and is fixed inspace and time for both “pre-Xiaolangdi” and “post-Xiaolangdi”conditions.
The active floodplain width, within which overbank deposi-tion of wash load occurs, is for both the “pre-Xiaolangdi” and“post-Xiaolangdi” conditions selected based on the river cross-section reported in He et al. (2012). For the “pre-Xiaolangdi”period, the active floodplain width Bf , pre is set to be the constantvalue 13,000 m, which corresponds to the distance between the“primary levees” (Fig. S2b). Meanwhile the active floodplainwidth for the “post-Xiaolangdi” condition Bf , post is set to beequal to 2500 m, which corresponds to the distance between the“farming levees” (Fig. S2b) (assuming that only the floodplainwithin the farming levees is active). The latter assumption isjustified by the fact that ever since the installation of XiaolangdiDam the flood discharge has been carefully controlled, and thusthe flow does not escape the farming levees.
Initial condition
Initial down-channel slope SI is purposely set to be relativelylow so that the “spin-up” simulation under “pre-Xiaolangdi”conditions results in long-term bed aggradation and downstreamfining toward a state similar to that just before the closure ofXiaolangdi Dam. Thus, the initial channel slope is set to be

Journal of Hydraulic Research (2019) Extended Engelund–Hansen type sediment transport relation 11
SI = 0.00005 everywhere. As one of the initial conditions, theGSD of the bed surface is set everywhere to be identical to thesubstrate GSD. For this purpose, we use the modern GSD ofthe bed material at Lijin station. The GSD of the sediment feedis taken to be identical to that of the total bed material load atHuayuankou gauging station, as determined from the YRIHRdataset mentioned above. The GSDs of initial bed surface, sub-strate, and bed material supplied at the upstream end are shownin Fig. 8f. Note that while the GSDs of the bed surface and sub-strate vary over time and space, the GSD of the bed materialsupply does not.
Auxiliary parameters
The Chezy friction coefficient (Cz) is determined based on ananalysis of the YRIHR dataset for the Lijin, Sunkou, and Gao-cun gauging stations; a characteristic value is found to varybetween approximately 10 and 80. We select the characteristicvalue Cz = 30 (Fig. S4 in the online supplemental data) for use.Bed porosity (lp ) and channel sinuosity Ω are set to 0.3 and 1.3,respectively. The flood intermittency factor (If ) is determinedin such a way that our proposed sediment transport relation
would produce the same mean annual bed material load as thatobserved based on the YRIHR database for “pre-Xiaolangdi”conditions, using the given hydraulic conditions and initialconditions. By means of the values Qbf = 4500 m3 s−1 andGTfeed, pre (bed material feed rate for the “pre-Xiaolangdi” condi-tion) = 385 Mt yr−1, we determine that If = 0.13. This is usedfor both “pre-Xiaolangdi” and “post-Xiaolangdi” conditions.
6.3 Results
In the first 600 years of the “spin-up” run under the “pre-Xiaolangdi” condition, the bed aggrades everywhere due to thehigh bed material feed rate, except at the downstream end wherethe bed elevation is fixed (Fig. 8a). The degree of aggradationis greater along the upstream reach than the downstream reach,resulting in an upward-concave bed profile, in which channelslope decreases downstream (Fig. 8a and 8b). At 600 years,the model predicts a pattern of downstream fining of geometricmean grain size of the bed surface Dg that adequately reflects theobserved pattern (YRIHR dataset in Fig. 8c). Figure 8f showsthe GSDs of bed material feed (from field data at Huayuankou),
(a)
(c)
(e) (f)
(d)
(b)
η (m
)
S (-
)75
50
25
100
0.20
0.06
100
80
60
40
20
0
0.04
0.02
0.15
0.10
0.05
0.20
0.15
0.10
0.05
0.000150 yr
LYR dataset
sed_feed
0 yr Sub & BS
600 yr BS
610 yr BS
Chen etal. 2012
600 yr
605 yr
610 yr 0.00010
0.00005
0 250 500 750 0 250 500 750
0 250 500 750 0 250 500 750
0 250 500 750
Dg
(mm
)
Dg,
load
(m
m)
q T (
m2
s–1)
perc
ent f
iner
(%
)
10–110–2 100 101
D (mm)x (mm)
Figure 8 Computational results for “pre-Xiaolangdi” condition followed by “post-Xiaolangdi” condition. (a) Bed elevation (channel-floodplainaverage); (b) downstream channel slope; (c) geometric mean size of bed surface material; (d) geometric mean size of total load; (e) volume bedmaterial transport rate per unit width. Also (f) shows GSD of feed material (dashed line), substrate and initial bed surface (broken line), and bedsurface at time 600 years and 610 years, at the middle of the reach (430 km from upstream end). The legend in Fig. 8a also applies to Fig. 8b–e

12 K. Naito et al. Journal of Hydraulic Research (2019)
initial substrate (which is identical to the initial bed surface,based on field data at Lijin), and the bed surface at the midpointof our study reach (430 km from the upstream) at 600 years (ascomputed from the model).
When the bed material supply is reduced at 600 years (“post-Xiaolangdi” condition), the upstream part of the reach startsdegrading substantially, whereas the downstream part of thereach remains unchanged after 10 years (610 years total, Fig.8a). The decrease in bed material supply also leads to bedsurface coarsening (armouring) (Fig. 8c). While the total bedmaterial load per unit width decreases as a result of bed materialsupply reduction (Fig. 8e), the geometric mean grainsize of totalload Dg, load becomes coarser (Fig. 8d and 8e). It should be notedthat the transported material (total bed material load) is alwaysfiner than bed surface (Fig. 8c and 8d). By 10 years after thesediment supply reduction (610 years in total), the model gener-ally predicts the observed trend of temporal bed coarsening, aswell as the observed overall trend the downstream fining (Fig.8c) in response to the bed supply reduction, in agreement withthe findings of Chen et al. (2012) and Ta et al. (2011). Figure 8fshows the feed size distribution (as measured at Huayuankou),the bed surface size distribution at 600 years at 430 km belowthe upstream end (as predicted by the spin-up run), and thepredicted bed surface size distribution at 610 years (10 yearsafter cutting off the sediment supply). The coarsening of the bedsurface in a decade is readily apparent.
7 Discussion
7.1 Cause of downstream fining and bed coarsening in theLYR
At 600 years in the model results, the bed profile exhibitsan upward-concave shape due to aggressive bed aggradationtoward the upstream end of the reach (Fig. 8a and 8b). Thisresults in a downstream decrease in bed shear stress, and ulti-mately results in size-selective transport, which is a commonfeature in sand-bed rivers and gravel-bed rivers (Hoey & Fer-guson, 1994; Wright & Parker, 2005a, 2005b). This can beseen in Fig. 8d, where a pattern of downstream decrease in thegeometric mean grain size of the total load Dg, load is illustrated.
When the sediment supply is reduced, the upstream section ofthe reach starts degrading, leading to a downward-convex pro-file in the upper half of the section (Fig. 8a and 8b). The bedsurface becomes coarser everywhere as a consequence of sedi-ment supply reduction. This coarsening represents a classic caseof the bed armouring more commonly seen in gravel-bed rivers(e.g. Parker, Hassan, & Wilcock, 2007); since coarser materialsare more difficult to be transported by flow, relatively coarsermaterial remains on the bed surface, creating a bed surface thatis coarser than the substrate. The degree of bed coarsening isstrongest toward the upstream end of the domain, where beddegradation is substantial (Fig. 8a). This acts to strengthen thepattern of downstream fining after sediment supply reduction.
It should be kept in mind, however, that the substrate alsobecomes coarser toward the upstream end of the reach duringthe first 600 years of the “spin-up” run. This can be inferredby the fact that the bed surface, which was gradually buriedinto the substrate, becomes coarser in the upstream half of thereach. When the bed material supply rate is reduced, this coars-ened substrate comes to the surface due to bed degradation,and this enhances the bed surface coarsening at the upstreamreach. In other words, downstream fining after sediment supplyreduction is likely caused by (i) size-selective transport and (ii)coarsening of substrate during the “spin-up” simulation towardthe upstream end of the domain, which is mined during laterdegradation.
The predicted pattern of downstream fining reasonablyclosely tracks observed values, but does not precisely matchthem in either the “pre-Xiaolangdi” condition or the “post-Xiaolangdi” condition (Fig. 8c). We emphasize that our imple-mentation is “broad-brush”, excluding many details of thehighly leveed and managed LYR. The consideration of suchfactors as spatial variation in channel and levee widths, waterdischarge hydrographs including the effect of water extraction,delta propagation, variation in flood intermittency, and any tec-tonic activity would give more precision to the model. Theimplementation of such factors is tedious but straightforward.
The trend of downstream fining and coarsening can also beseen in the total bed material load; at 600 years, Dg, load exhibitsa decline in the downstream direction. Although Fig. 7 suggeststhat Dg, load should increase with decreasing bed shear stress,downstream fining of the bed surface suppresses the effect ofstreamwise decline in the shear stress. When the bed materialsupply is decreased, overall bed slope declines (hence bed shearstress declines), thus total load becomes coarser accordingly.Meanwhile the trend of downstream fining of the load is main-tained due to the strong trend of downstream fining of the bedsurface.
7.2 Model applicability to the sorting problem insand-silt-bed rivers
The proposed relation for the prediction of bed material load formixtures is a surface-based relation rather than substrate-basedrelation. In addition to various merits in utilizing a surface-based relation, which are well summarized in Wilcock andCrowe (2003), there is an advantage in terms of data availabil-ity. Specifically, GSD data for the bed surface tends to be muchmore readily available than data for the substrate. The fact thatthe relation contains no critical Shields number for incipientmotion of sediment not only corresponds to the reality of typ-ical sediment transport events in the LYR, which are far abovethe threshold of motion, but also makes the form of the proposedrelation simpler, hence more user-friendly. Note that (a) the pro-posed model is an extended form of the EH total load relation,which also does not incorporate a critical bed shear stress, and(b) in the case of sand-silt-bed rivers, the bed material is so fine

Journal of Hydraulic Research (2019) Extended Engelund–Hansen type sediment transport relation 13
that most of the sediment is in motion even during low flow. Inspite of the simplicity of the proposed model, it is capable ofdealing with the sorting phenomena of downstream fining andarmouring as they occur in the sand-silt bed LYR.
8 Conclusions
Grain sorting such as downstream fining and bed surface coars-ening is not unique to sand-bed rivers or gravel-bed rivers; wehave found that silt-rich rivers such as the LYR exhibit grainsorting. In order to treat grain sorting of fine material, we devel-oped a total bed material relation for fine sediment mixtures.We utilized the general form of Engelund and Hansen total loadrelation (1967), which is commonly used as a predictor of totalload for sand-bed rivers but is invalid for sand-silt-bed rivers, todevelop our relation. In order to quantify our proposed relation,a database including bed surface GSD is required.
We have evaluated our relation for the case of the LYR usingfield data collected at the Lijin gauging station. We find thatthe transport of coarser grains tends to have less dependencyon hydraulic conditions than that of finer grains, and that asthe flow intensity increases, the bed material load becomes everfiner compared to that of the bed surface. This is in contrast tothe case of gravel-bed rivers, whereby the GSD of the total loadapproaches that of the bed surface with increasing bed shearstress. A relation for suspended load of mixtures in sand-bedrivers, however, predicts a load that is finer than the bed surfaceover a wide range (Wright & Parker, 2004).
Our proposed relation is capable of reproducing ongoingdownstream fining and bed coarsening due to bed material sup-ply reduction in the LYR. Downstream fining due to selectivetransport is reproduced as a consequence of historic aggressivebed aggradation associated with an upward-concave river bedprofile, both of which are responses to massive sediment supplyfrom the Loess Plateau. Bed coarsening (armouring) is repro-duced in accordance with bed degradation due to substantiallyreduced bed material supply rate at the upstream end of the mod-elled reach, which is in turn due to sediment retention in therecently closed Xiaolangdi Dam.
Although our proposed model of grain size specific sedimenttransport likely requires some site-specific calibration, the formof the equation is relatively simple, in part due to the absenceof a critical Shields number for incipient motion of sediment.Moreover, with appropriate calibration, it can easily be appliedto grain sorting problems in other fine-grained rivers with sand-silt-beds such as the Pilcomayo River at the border of Argentinaand Paraguay (Martín-Vide et al., 2014).
Acknowledgements
We very gratefully acknowledge the students in Parker’s course,“River Morphodynamics” in the spring of 2015 for their helpwith data extraction, organization and analysis: C-G An, D.S.
Ancalle Reyes, Z.D. Barnaal, Q-T Gao, J. Geldmeyer, A.M.Hamed, T-Y He, E. Lacunza, F.P. Maciel Yo, M.J. Reed, F.A.Neira Ruiz, J.E. San Juan Blanco, R.H. Takahashi, D-C Wang,H. Wu, R-J Zeng and R-S. Zhou.
Funding
Kensuke Naito, Hongbo Ma, Jeffrey Nittrouer and Gary Parkergratefully acknowledge the National Science Foundation [EARgrants 1427262; 1209402]. Yuanfeng Zhang acknowledgesthe National Natural Science Foundation of China [grant51379087]. Yuanjian Wang also acknowledges support from theNational Nature Science Foundation of China [grants 51509102;51679104; 5153000441]; Division of Earth Sciences.
Supplemental data
Supplemental data for this article can be accessed doi:10.1080/00221686.2018.1555554.
Notation
A, B = coefficient and exponent in the general form of theEngelund–Hansen sediment transport relation (–)
Ai, Bi = coefficient and exponent in the proposed sedimenttransport relation for the ith size range grain (–)
Bbf = reach-representative bankfull channel width (m)Bf = floodplain width (m)Cf = bed friction coefficient (–)Cz = dimensionless Chezy resistance coefficient (–)D50 = median grain size of bed surface (mm)Dg = geometric mean grain size of bed surface (mm)Dg, load = geometric mean grain size of total bed material load
(mm)Di = grain size of ith size range (mm)fi = volume fraction content of bed material within grain
size interval i (–)Fi = volume fraction content of bed material in bed sur-
face (active layer) within grain size interval i (–)FIi = volume fraction content of bed material at the inter-
face between bed surface and substrate within grainsize interval i (–)
Fsubi = volume fraction content of bed material in substratewithin grain size interval i (–)
g = gravitational acceleration (m s−2)GT, feed = mass rate of bed material supply at the upstream end
of the reach (t yr–1)H = flow depth (m)Hbf = bankfull depth (m)If = flood intermittency (–)L = reach length (km)La = active layer thickness (m)

14 K. Naito et al. Journal of Hydraulic Research (2019)
Ls = substrate storage layer thickness (m)N = number of bins in the grain size distribution of the
proposed sediment transport relation (–)NT
∗ = proposed dimensionless form of total bed materialload (–)
Ni∗ = proposed dimensionless form of bed material load of
sediment within grain size interval i (–)qi = volume total bed material load per unit width within
grain size interval i (m2 s−1)qT = volume total bed material load per unit width
(m2 s−1)q∗
T = dimensionless form of volume total bed material loadper unit width (–)
Qbf = representative bankfull discharge (m3 s−1)R = submerged specific gravity of sediment (–)S = down-channel slope (–)t = time (s)U = depth-averaged velocity (m s−1)u∗ = shear velocity (m s−1)x = streamwise coordinate (m)αal = ratio of active layer thickness to dune height (Eq.
(20)) (–)αtrans = weight factor for the substrate-active layer sediment
exchange fractions (Eq. (21)) (–)Δdune = dune height (m)η = channel bed-floodplain averaged elevation (m)Λ = ratio of volume wash load deposition on the flood-
plain to volume deposition of bed material in thechannel (–)
lp = bed porosity (–)ξ = constant in the dune height relation (Eq. (19)) (–)ρ = density of the water-sediment mixture (kg m−3)τ b = bed shear stress (Pa)τ ∗
g = dimensionless bed shear stress for the geometricmean bed surface material size (–)
τ ∗i = dimensionless bed shear stress for the sediment
within grain size interval i (–)Ω = channel sinuosity (–)
ORCID
Kensuke Naito http://orcid.org/0000-0001-8683-0846
References
Allan, J. D., & Castillo, M. M. (2007). Stream ecology: Struc-ture and function of running waters. New York, NY: Springer.
Ashida, K., & Michiue, M. (1972). Study on hydraulic resis-tance and bed-load transport rate in alluvial streams. In Pro-ceedings of the Japan society of civil engineers (Vol. 1972,No. 206, pp. 59–69). Japan Society of Civil Engineers (inJapanese).
Bettess, R. (1994). Sediment transport and channel stability.In P. P. Calow & G. E. Petts (Eds.), The rivers handbook:
Hydrological and ecological principles (Vol. 2, pp. 227–253).Oxford: Blackwell Science.
Blom, A., Arkesteijn, L., Chavarrías, V., & Viparelli, E.(2017). The equilibrium alluvial river under variable flowand its channel-forming discharge. Journal of GeophysicalResearch: Earth Surface, 122(10), 1924–1948.
Blom, A., Viparelli, E., & Chavarrias, V. (2016). The gradedalluvial river: Profile concavity and downstream fining. Geo-physical Research Letters, 43(12), 6285–6293.
Brownlie, W. R. (1981). Prediction of flow depth and sedi-ment discharge in open channels (Report No. KH-R-43A).Pasadena, California, USA: W. M. Keck Laboratory ofHydraulics and Water Resources, California Institute of Tech-nology, 232.
Chen, J., Zhou, W., & Qiang, C. (2012). Reservoir sedimenta-tion and transformation of morphology in the lower yellowriver during 10 year’s initial operation of the Xiaolangdireservoir. Journal of Hydrodynamics, Ser. B, 24(6),914–924.
Chen, Y., Wang, K., Lin, Y., Shi, W., Song, Y., & He, X. (2015).Balancing green and grain trade. Nature Geoscience, 8(10),739–741.
Cohn, T. A. (1995). Recent advances in statistical methods forthe estimation of sediment and nutrient transport in rivers.Reviews of Geophysics, 33(S2), 1117–1123.
Deigaard, R. (1980). Longitudinal and transverse sorting ofgrain sizes in alluvial rivers (Paper No. 26). Institute ofHydrodynamics and Hydraulic Engineering, Technical Uni-versity of Denmark.
Engelund, F., & Hansen, E. (1967). A monograph on sedi-ment transport in alluvial streams. Copenhagen K: TechnicalUniversity of Denmark 0stervoldgade 10.
Frings, R. M. (2008). Downstream fining in large sand-bedrivers. Earth-Science Reviews, 87(1–2), 39–60.
Gao, P., Zhang, X., Mu, X., Wang, F., Li, R., & Zhang,X. (2010). Trend and change-point analyses of streamflowand sediment discharge in the Yellow River during 1950–2005. Hydrological Sciences Journal–Journal des SciencesHydrologiques, 55(2), 275–285.
He, L., Duan, J., Wang, G., & Fu, X. (2012). NumericalSimulation of Unsteady Hyperconcentrated Sediment-LadenFlow in the Yellow River. Journal of Hydraulic Engineering,138(11), 958–969.
Hicks, D. M., & Gomez, B. (2016). Sediment transport. In G. M.Kondolf & H. Piégay (Eds.), Tools in fluvial geomorphology(pp. 324–356). Chichester, UK: John Wiley & Sons Ltd.
Hirano, M. (1971). River-bed degradation with armoring. InProceedings of the Japan society of civil engineers (Vol.1971, No. 195, pp. 55–65). Japan Society of Civil Engineers(in Japanese).
Hoey, T. B., & Ferguson, R. I. (1994). Numerical simulationof downstream fining by selective transport in gravel bedrivers: Model development and illustration. Water ResourcesResearch, 30(7), 2251–2260.

Journal of Hydraulic Research (2019) Extended Engelund–Hansen type sediment transport relation 15
Hunziker, R., & Jaeggi, M. N. R. (2002). Grain sorting pro-cesses. Journal of Hydraulic Engineering, 128(12), 1060–1068.
Jiongxin, X. (1999). Erosion caused by hyperconcentrated flowon the Loess Plateau of China. Catena 36(1–2), 1–19.
Julien, P. Y., & Klaasen, G. J. (1995). Sand-dune geometry oflarge rivers during floods. Journal of Hydraulic Engineering,121(9), 657–663.
Kuhnle, R. A. (1992). Fractional transport rates of bedload onGoodwin Creek. In Billi, P., Hey, R. D., Thorne, C. R., &Tacconi, P. (Eds.), Dynamics of gravel-bed rivers (pp. 141–155). Chichester: John Wiley & Sons.
Long, Y., & Zhang, Y. (2002). Study on the Yellow River sed-iment from the viewpoint of total sediment. Yellow River,24(8), 28–29. (in Chinese).
Ma, H, Nittrouer, J. A., Naito, K., Fu, X, Zhang, Y, Moodie, A.J., . . . Parker, G. (2017). The exceptional sediment load offine-grained dispersal systems: Example of the Yellow River,China. Science Advances 3(5), e1603114.
MacArthur, R. C., Neill, C. R., Hall, B. R., Galay, V. J., &Shvidchenko, A. B. (2008). Overview of sedimentation engi-neering. In M. H. Garcia (Ed.), Sedimentation engineering:Processes, measurements, modeling, and practice (pp. 1–20).Reston, VA: American Society of Civil Engineers.
Martín-Vide, J. P., Amarilla, M., & Zárate, F. J. (2014). Collapseof the Pilcomayo River. Geomorphology, 205, 155–163.
Milliman, J. D., & Meade, R. H. (1983). World-wide delivery ofriver sediment to the oceans. The Journal of Geology, 91(1),1–21.
Paola, C., Heller, P. L., & Angevine, C. L. (1992). The large-scale dynamics of grain-size variation in alluvial basins, 1:Theory. Basin Research, 4(2), 73–90.
Parker, G. (1990). Surface-based bedload transport relation forgravel rivers. Journal of Hydraulic Research, 28(4), 417–436.
Parker, G. (1991a). Selective sorting and abrasion of rivergravel. I: Theory. Journal of Hydraulic Engineering, 117(2),131–147.
Parker, G. (1991b). Selective sorting and abrasion of rivergravel. II: Applications. Journal of Hydraulic Engineering,117(2), 150–171.
Parker, G. (2008). Transport of gravel and sediment mixtures.In M. H. Garcia (Ed.), Sedimentation engineering: Pro-cesses, measurements, modeling, and practice (pp. 165–251).Reston, Virginia: American Society of Civil Engineers.
Parker, G., Fu, X., Zhang, Y., Zinger, J., & Konsoer, K. (2013,September). Bedform regime diagram for rivers and turbid-ity currents: Conditions for the formation and obliterationof dunes. In Z. Wang (Ed.), Proceedings of the 2013 inter-national association for hydro-environment engineering andresearch congress (pp. 8–13). Chengdu, China: IAHR.
Parker, G., Hassan, M., & Wilcock, P. R. (2007). Adjustmentof the bed surface size distribution of gravel-bed rivers inresponse to cycled hydrographs. In H. Habersack, H. Pié-gay, & M. Rinaldi (Eds.), Gravel-bed rivers VI: From process
understanding to river restoration (pp. 241–285). New York,NY: Elsevier Science & Technology.
Parker, G., & Klingeman, P. C. (1982). On why gravel bedstreams are paved. Water Resources Research, 18(5), 1409–1423.
Pierson, T. C. (2005). Hyperconcentrated flow—Transitionalprocess between water flow and debris flow. In M. Jakob,O. Hungr, & D. M. Jakob (Eds.), Debris-flow hazardsand related phenomena (pp. 159–202). Berlin, Germany:Springer.
Ribberink, J. S. (1987). Mathematical modelling of one-dimensional morphological changes in rivers with non-uniform sediment (Doctoral dissertation). Delft University ofTechnology, Delft, The Netherlands.
Stecca, G., Siviglia, A., & Blom, A. (2014). Mathematical anal-ysis of the Saint-Venant-Hirano model for mixed-sedimentmorphodynamics. Water Resources Research, 50, 7563–7589. doi:10.1002/2014WR015251
Ta, W., Wang, H., & Jia, X. (2011). Downstream fining incontrasting reaches of the sand-bedded Yellow River. Hydro-logical Processes, 25(24), 3693–3700.
Tian, S., Wang, Z., Li, Z., & Li, Y. (2016). Effects of soilproperty of loess plateau on sediment characteristics in theyellow river. International Journal of Sediment Research, 5,74–80.
Toro-Escobar, C. M., Parker, G., & Paola, C. (1996). Transferfunction for the deposition of poorly sorted gravel in responseto streambed aggradation. Journal of Hydraulic Research,34(1), 35–53.
Tsujimoto, T. (1991). Mechanics of sediment transport ofgraded materials and fluvial sorting (Report No. 0155041).Kanazawa, Japan: Kanazawa University.
Viparelli, E., Sequeiros, O. E., Cantelli, A., Wilcock, P. R.,& Parker, G. (2010). River morphodynamics with cre-ation/consumption of grain size stratigraphy 2: Numericalmodel. Journal of Hydraulic Research, 48(6), 727–741.
Wang, H., Bi, N., Saito, Y., Wang, Y., Sun, X., Zhang, J., &Yang, Z. (2010). Recent changes in sediment delivery bythe Huanghe (Yellow River) to the sea: Causes and envi-ronmental implications in its estuary. Journal of Hydrology,391(3–4), 302–313.
Wang, H., Yang, Z., Saito, Y., Liu, J. P., Sun, X., & Wang, Y.(2007). Stepwise decreases of the Huanghe (Yellow River)sediment load (1950-2005): Impacts of climate change andhuman activities. Global and Planetary Change, 57(3–4),331–354.
Wang, S., Fu, B., Piao, S., Lü, Y., Ciais, P., Feng, X., & Wang, Y.(2016). Reduced sediment transport in the Yellow River dueto anthropogenic changes. Nature Geoscience, 9(1), 38–41.
Wang, S., & Li, Y. (2011). Channel variations of the differentchannel pattern reaches in the lower Yellow River from 1950to 1999. Quaternary International, 244(2), 238–247.
Wang, Z., Wang, W., & Tian, S. (2007). Mineral com-position and distribution of the sediment in the Yellow

16 K. Naito et al. Journal of Hydraulic Research (2019)
River basin. International Journal of Sediment Research, 5,1–8.
Wilcock, P. R. (1997). The components of fractional transportrate. Water Resources Research, 33(1), 247–258.
Wilcock, P. R., & Crowe, J. C. (2003). Surface-based trans-port model for mixed-size sediment. Journal of HydraulicEngineering, 129(2), 120–128.
Woo, H. S., Julien, P. Y., & Richardson, E. V. (1986). Washloadand fine sediment load. Journal of Hydraulic Engineering,112(6), 541–545.
Wright, L. D., Wiseman, W. J. Jr., Tang, Z.-S., Bornhold, B.D., Keller, G. H., Prior, D. B., & Suhayda, J. N. (1990).Continental Shelf Research, 10(1), 1–40.
Wright, S., & Parker, G. (2004). Flow resistance and suspendedload in sand-bed rivers: Simplified stratification model. Jour-nal of Hydraulic Engineering, 130(8), 796–805.
Wright, S., & Parker, G. (2005a). Modeling downstream fin-ing in sand-bed rivers. I: Formulation. Journal of HydraulicResearch, 43(6), 612–619.
Wright, S., & Parker, G. (2005b). Modeling downstream fin-ing in sand-bed rivers II: Application. Journal of HydraulicResearch, 43(6), 620–630.
Wu, B., & Long, Y. (1993). Several modifications for sedimenttransport capacity formulas of the Yellow River. Yellow River,95(7), 1–4. (in Chinese).
Wu, B., van Maren, D. S., & Li, L. (2008). Predictability of sed-iment transport in the Yellow River using selected transportformulas. International Journal of Sediment Research, 23(4),283–298.
Wu, B., Wang, G., Xia, J., Fu, X., & Zhang, Y. (2008).Response of bankfull discharge to discharge and sedimentload in the Lower Yellow River. Geomorphology, 100(3–4),366–376.
Xue, C. (1993). Historical changes in the Yellow River delta,China. Marine Geology, 113(3–4), 321–330.
Yang, C. T., Molinas, A., & Wu, B. (1996). Sediment trans-port in the Yellow River. Journal of Hydraulic Engineering,122(5), 237–244.
Yu, Y., Shi, X., Wang, H., Yue, C., Chen, S., Liu, Y., . . . Qiao,S. (2013). Effects of dams on water and sediment deliv-ery to the sea by the Huanghe (Yellow River): The spe-cial role of Water-Sediment Modulation. Anthropocene, 3,72–82.
Yu, Y., Wang, H., Shi, X., Ran, X., Cui, T., Qiao, S., & Liu,Y. (2013). New discharge regime of the Huanghe (YellowRiver): Causes and implications. Continental Shelf Research,69, 62–72.
Zhang, H. W., Huang, Y. D., & Zhao, L. J. (2001). A mathe-matical model for unsteady sediment transport in the LowerYellow River. Journal of Sedimentation Research, 16(2),150–158. (in Chinese).
Zhang, R. (1959). A study of the sediment transport capacityof the middle and lower Yangtze River. Journal of SedimentResearch, 4(2), 54–73. (in Chinese).
Zhang, Y., Long, Y., & Shen, G. (1998). Adaptability of sed-iment transport formula to the Yellow River. Proceedingsof the 7th International Symposium on River Sedimentation,Hong Kong, WASER.