![Efficient induction of productive Cre-mediated ... · tion and inactivation system in the RPE using Cre/lox and tetracycline-inducible gene expression technologies [9-11]. In this](https://static.fdocuments.us/doc/165x107/601a40fce223a157c556004e/efficient-induction-of-productive-cre-mediated-tion-and-inactivation-system.jpg)
Expression of PEDF in RPE cells
29
ORIGINAL RESEARCH Expression of pigment epithelium-derived factor and thrombospondin-1 regulate proliferation and migration of retinal pigment epithelial cells Mitra Farnoodian 1 , James B. Kinter 1 , Saeed Yadranji Aghdam 1 , Ismail Zaitoun 1 , Christine M. Sorenson 2,3 & Nader Sheibani 1,3,4 1 Department of Ophthalmology and Visual Sciences and Clinical Investigation Graduate Program, University of Wisconsin, School of Medicine and Public Health, Madison, Wisconsin 2 Department of Pediatrics, University of Wisconsin, School of Medicine and Public Health, Madison, Wisconsin 3 McPherson Eye Research Institute, University of Wisconsin, School of Medicine and Public Health, Madison, Wisconsin 4 Department of Biomedical Engineering, University of Wisconsin, School of Medicine and Public Health, Madison, Wisconsin Keywords Adhesion, cell proliferation, migration, oxidative stress, RPE cells. Correspondence Nader Sheibani, Department of Ophthalmology and Visual Sciences, University of Wisconsin, 1111 Highland Avenue, 9453 WIMR, Madison, WI, 53705- 2275. Tel: 608-263-3345 Fax 608-265-6021 E-mail: [email protected] Funding Information This work was supported by grants R24 EY022883, RC4 EY021357, R21 EY023024, P30 EY016665, and P30 CA014520 UW Paul P. Carbone Cancer Center Support Grant from the National Institutes of Health, and an unrestricted departmental award from Research to Prevent Blindness. NS is a recipient of a Research Award from American Diabetes Association, 1-10-BS-160 and Retina Research Foundation. CMS is a recipient of RRF/Daniel M. Albert chair. Received: 28 November 2014; Revised: 5 December 2014; Accepted: 9 December 2014 doi: 10.14814/phy2.12266 Physiol Rep, 3 (1), 2015, e12266, doi: 10.14814/phy2.12266 Abstract Age-related macular degeneration (AMD) is the leading cause of vision loss among elderly. Although the pathogenesis of AMD is associated with retinal pigmented epithelium (RPE) dysfunction and abnormal neovascularization the detailed mechanisms remain unresolved. RPE is a specialized monolayer of epithelial cells with important functions in ocular homeostasis. Pathological RPE damage contributes to major ocular conditions including retinal degener- ation and irreversible loss of vision in AMD. RPE cells also assist in the main- tenance of the ocular angiogenic balance by production of positive and negative regulatory factors including vascular endothelial growth factor (VEGF), thrombospondin-1 (TSP1), and pigment epithelium-derived factor (PEDF). The altered production of PEDF and TSP1, as endogenous inhibitors of angiogenesis and inflammation, by RPE cells have been linked to pathogen- esis of AMD and choroidal and retinal neovascularization. However, lack of simple methods for isolation and culture of mouse RPE cells has resulted in limited knowledge regarding the cell autonomous role of TSP1 and PEDF in RPE cell function. Here, we describe a method for routine isolation and prop- agation of RPE cells from wild-type, TSP1, and PEDF-deficient mice, and have investigated their impact on RPE cell function. We showed that expression of TSP1 and PEDF significantly impacted RPE cell proliferation, migration, adhe- sion, oxidative state, and phagocytic activity with minimal effect on their basal rate of apoptosis. Together, our results indicated that the expression of PEDF and TSP1 by RPE cells play crucial roles not only in regulation of ocular vas- cular homeostasis but also have significant impact on their cellular function. ª 2015 The Authors. Physiological Reports published by Wiley Periodicals, Inc. on behalf of the American Physiological Society and The Physiological Society. This is an open access article under the terms of the Creative Commons Attribution License, which permits use, distribution and reproduction in any medium, provided the original work is properly cited. 2015 | Vol. 3 | Iss. 1 | e12266 Page 1 Physiological Reports ISSN 2051-817X
-
Upload
saeed-aghdam -
Category
Documents
-
view
82 -
download
0
Transcript of Expression of PEDF in RPE cells

ORIGINAL RESEARCH
Expression of pigment epithelium-derived factor andthrombospondin-1 regulate proliferation and migration ofretinal pigment epithelial cellsMitra Farnoodian1, James B. Kinter1, Saeed Yadranji Aghdam1, Ismail Zaitoun1, Christine M.Sorenson2,3 & Nader Sheibani1,3,4
1 Department of Ophthalmology and Visual Sciences and Clinical Investigation Graduate Program, University of Wisconsin, School of Medicine
and Public Health, Madison, Wisconsin
2 Department of Pediatrics, University of Wisconsin, School of Medicine and Public Health, Madison, Wisconsin
3 McPherson Eye Research Institute, University of Wisconsin, School of Medicine and Public Health, Madison, Wisconsin
4 Department of Biomedical Engineering, University of Wisconsin, School of Medicine and Public Health, Madison, Wisconsin
Keywords
Adhesion, cell proliferation, migration,
oxidative stress, RPE cells.
Correspondence
Nader Sheibani, Department of
Ophthalmology and Visual Sciences,
University of Wisconsin, 1111 Highland
Avenue, 9453 WIMR, Madison, WI, 53705-
2275.
Tel: 608-263-3345
Fax 608-265-6021
E-mail: [email protected]
Funding Information
This work was supported by grants R24
EY022883, RC4 EY021357, R21 EY023024,
P30 EY016665, and P30 CA014520 UW Paul
P. Carbone Cancer Center Support Grant
from the National Institutes of Health, and
an unrestricted departmental award from
Research to Prevent Blindness. NS is a
recipient of a Research Award from
American Diabetes Association, 1-10-BS-160
and Retina Research Foundation. CMS is a
recipient of RRF/Daniel M. Albert chair.
Received: 28 November 2014; Revised: 5
December 2014; Accepted: 9 December
2014
doi: 10.14814/phy2.12266
Physiol Rep, 3 (1), 2015, e12266,
doi: 10.14814/phy2.12266
Abstract
Age-related macular degeneration (AMD) is the leading cause of vision loss
among elderly. Although the pathogenesis of AMD is associated with retinal
pigmented epithelium (RPE) dysfunction and abnormal neovascularization the
detailed mechanisms remain unresolved. RPE is a specialized monolayer of
epithelial cells with important functions in ocular homeostasis. Pathological
RPE damage contributes to major ocular conditions including retinal degener-
ation and irreversible loss of vision in AMD. RPE cells also assist in the main-
tenance of the ocular angiogenic balance by production of positive and
negative regulatory factors including vascular endothelial growth factor
(VEGF), thrombospondin-1 (TSP1), and pigment epithelium-derived factor
(PEDF). The altered production of PEDF and TSP1, as endogenous inhibitors
of angiogenesis and inflammation, by RPE cells have been linked to pathogen-
esis of AMD and choroidal and retinal neovascularization. However, lack of
simple methods for isolation and culture of mouse RPE cells has resulted in
limited knowledge regarding the cell autonomous role of TSP1 and PEDF in
RPE cell function. Here, we describe a method for routine isolation and prop-
agation of RPE cells from wild-type, TSP1, and PEDF-deficient mice, and have
investigated their impact on RPE cell function. We showed that expression of
TSP1 and PEDF significantly impacted RPE cell proliferation, migration, adhe-
sion, oxidative state, and phagocytic activity with minimal effect on their basal
rate of apoptosis. Together, our results indicated that the expression of PEDF
and TSP1 by RPE cells play crucial roles not only in regulation of ocular vas-
cular homeostasis but also have significant impact on their cellular function.
ª 2015 The Authors. Physiological Reports published by Wiley Periodicals, Inc. on behalf of
the American Physiological Society and The Physiological Society.
This is an open access article under the terms of the Creative Commons Attribution License,
which permits use, distribution and reproduction in any medium, provided the original work is properly cited.
2015 | Vol. 3 | Iss. 1 | e12266Page 1
Physiological Reports ISSN 2051-817X

Introduction
Age-related macular degeneration (AMD) is one of the
major causes of visual impairment in the elderly popula-
tion worldwide. Despite the high prevalence of AMD, the
etiology of this disease remains largely unknown. AMD is
presented in two major forms, the dry form which is
associated with degeneration of retinal pigment epithe-
lium (RPE), and the exudative or wet form which pre-
sents the formation of choroidal neovascularization
(CNV) (Hua et al. 2012).The impairment of RPE cell
function is an early and crucial event in the molecular
pathways leading to clinically relevant AMD changes asso-
ciated with increased production of vascular endothelial
growth factor (VEGF) and CNV. However, the detailed
mechanisms impacting RPE cell function and pathogene-
sis of AMD remain poorly defined.
The retinal pigment epithelium is a single layer of epi-
thelial cells with essential roles in photoreceptor function
and defensive immune mechanism of macula (Korte et al.
1984). The RPE cells are involved in phagocytosis of pho-
toreceptor outer segments, oxidative stress response, pho-
toreceptor renewal, and preservation of their photo
transduction (Korte et al. 1984; Sparrow et al. 2010;
Klettner 2012). The RPE cells have evolved a preventative
mechanism against high levels of antioxidants and photo-
oxidation through light filtration and absorption (Strauss
2005; Kevany and Palczewski 2010). In addition, RPE cells
selectively regulate the transport of metabolites, ions,
nutrients, and water between the retina and choriocapilla-
ris, and maintain outer retinal-blood barrier (Strauss
2005). The failure of RPE cell function results in major
ocular clinical changes such as retinal degeneration and
irreversible vision loss (Korte et al. 1984; Yang et al.
2006a,b).
The RPE cells, as a major source of ocular angioregula-
tory proteins, play an important role in maintaining the
ocular angiogenic homeostasis through a balanced pro-
duction of positive and negative regulatory factors includ-
ing VEGF, thrombospondin-1 (TSP1), and pigment
epithelium-derived factor (PEDF). Altered production of
these factors in RPE cells may contribute to various eye
diseases with a neovascular component including diabetic
retinopathy (DR) and exudative AMD (Campochiaro
2000; Duh et al. 2004; Strauss 2005; Sparrow et al. 2010).
The increased production of VEGF has been identified as
an essential factor in the development and progression of
CNV. In addition, many studies have reported impaired
production of TSP1 and PEDF in vascular retinopathies
including diabetic retinopathy and exudative AMD. How-
ever, how these factors impact RPE cell function needs
further investigation.
In human eyes, TSP1 is present at high levels in the
vitreous and is a major component of the Bruch’s mem-
brane (Sheibani et al. 2000; Uno et al. 2006). Decreased
TSP1 expression in Bruch’s membrane and choroidal ves-
sels during AMD is suggested as a potential regulatory
factor, which favors the formation of CNV (Uno et al.
2006). Expression of TSP1 is crucial for normal postnatal
development of retinal vasculature and CNV (Wang et al.
2003, 2009, 2012). TSP1 is a homo-trimeric matricellular
protein produced by various cell types including RPE cells
(Adams and Lawler 2004; He et al. 2006). It modulates
proliferation, migration, differentiation, and apoptosis in
a cell type-specific manner. Thus, TSP1 plays a critical
role in the regulation of various biological functions
including vascular homeostasis, immunity, and wound
healing (Sheibani and Frazier 1999; Mochizuki et al.
2013; Masli et al. 2014). Appropriate production of TSP1
contributes to maintenance of the optical clarity and nor-
mal ocular angiogenesis function of the eye (Hiscott et al.
1996a,b; Sheibani et al. 2000; Saika et al. 2004).We previ-
ously reported that pathogenesis and progression of DR
due to TSP1 deficiency may be influenced by expression
of PEDF (Sorenson et al. 2013). Thus, a relationship
between TSP1 and PEDF expression may exist.
A number of studies have demonstrated important
roles for PEDF in modulation of vascular leakage and
angiogenesis in AMD and DR (Papapetropoulos et al.
1997; Yang et al. 2006a,b; Rizzolo et al. 2011). A signifi-
cant decrease in the PEDF plasma level has been demon-
strated in patients with the dry form of AMD. In contrast
in the wet AMD patients, a strong positive correlation
between VEGF and PEDF concentrations was observed
(Machali�nska et al. 2012). PEDF, a glycoprotein (50 kDa),
is also an endogenous inhibitor of angiogenesis and is
present in the vitreous at high levels (Karakousis et al.
2001). PEDF was originally described by its ability to
stimulate differentiation of retinoblastoma cells (Barnsta-
ble and Tombran-Tink 2004). However, recent studies
have established important roles for PEDF in inflam-
mation, maintenance of normal extracellular matrix,
promotion of cell attachment, stability of the endothelium
of choriocapillaris, and neurite outgrowths (Yamagishi
et al. 2003; Bernard et al. 2009). It also protects retinal
neurons from light damage and oxidative stress, as well as
inhibiting EC migration and growth of new blood vessels
(Bhutto and Lutty 2012). PEDF is also considered as a
crucial factor associated with absence of vascularity in the
cornea, vitreous, and outer retina (Barnstable and Tom-
bran-Tink 2004). We have previously shown that mouse
RPE cells are a major source of PEDF production (Al-
Shabrawey et al. 2011). How PEDF impacts RPE cell
function and contributes to pathogenesis of AMD and
CNV requires further elucidation.
2015 | Vol. 3 | Iss. 1 | e12266Page 2
ª 2015 The Authors. Physiological Reports published by Wiley Periodicals, Inc. on behalf of
the American Physiological Society and The Physiological Society.
PEDF, TSP1, and RPE Cell Function M. Farnoodian et al.

It is now clearly established that RPE cells play a key
role in the development and stabilization of retinal struc-
ture, and maintenance of the ocular angiogenic balance
(Strauss 2005). These activities are accomplished through
production of numerous factors but little is known about
how these factors impact RPE cell function. These studies
are hampered by the lack of availability of methods to
readily culture RPE cells from wild-type and transgenic
mice retina. Although, RPE cells have been cultured from
mouse retina these cells have limited proliferation capac-
ity and/or require special conditions (Kato et al. 1996;
Martin et al. 2009), which limit many biochemical studies
that require large number of cells. In the present study,
we describe a method for routine culturing of RPE cells
from wild-type, and TSP1 and PEDF-deficient mice,
which can be readily manipulated in culture and main-
tained for many passages without a significant impact on
the expression of their specific markers. Using these cells
we show, for the first time, the cell autonomous impact
of PEDF and TSP1 on RPE cell function. We found that
lack of TSP1 or PEDF in RPE cells impacted their prolif-
eration, adhesion, migration, oxidative state, and phago-
cytic activity with minimal impact on their basal rate of
apoptosis. Collectively, our results indicate important
roles for PEDF and TSP1 in modulation of RPE cell func-
tions critical to the role of RPE cells as an important care
provider and regulator of various ocular functions. Our
results also indicate that these proteins not only play an
important role in ocular vascular homeostasis, but also
have important role in RPE cell function further empha-
sizing a key role for these proteins in the pathogenesis of
AMD and CNV.
Material and Methods
Experimental animals
All the experiments were conducted in accordance with
the Association for Research in Vision and Ophthalmol-
ogy statement for the use of Animals in Ophthalmic and
Vision Research and were approved by the Institutional
Animal Care and use Committee of the University of
Wisconsin School of Medicine and Public health. Im-
morto mice expressing a temperature-sensitive simian
virus (SV) 40 large T antigen were obtained from Charles
Rivers Laboratories (Wilmington, MA). TSP1�/� and
PEDF�/� mice on a C57BL/6J background were gener-
ated and maintained as previously described, and crossed
with immorto mice backcrossed to C57BL/6J mice (Law-
ler et al. 1998; Su et al. 2003). The isolated DNA from
tail biopsies was used for screening of various transgenes
as previously described (Su et al. 2003; Scheef et al.
2009).
Isolation and culture of RPE cells
RPE cells were isolated form one litter (6 or 7 pups) of
4-week-old wild-type, PEDF�/� and TSP1�/� Immorto
mice (all on C57BL/6J background) by removing retinas,
and optic nerve form the posterior portion of the eyes,
cutting the remaining cup and collection of RPE layer
under a dissecting microscope. RPE sheets were digested
in 5 mL of Collagenase type I (Worthington, Lakewood,
NJ; 1 mg/mL in serum-free Dulbecco ҆ s modified Eagle ҆ smedium (DMEM)) and incubated at 37°C for 20 min.
The digested tissues were washed with DMEM containing
10% fetal bovine serum (FBS), and resuspended in
0.5 mL of RPE cell growth medium [DMEM containing
10% FBS, 2 mmol/L L-glutamine, 100 lg/mL streptomy-
cin, 100 U/mL penicillin and murine recombinant INF-c(R& D Systems, Minneapolis, MN) at 44 U/mL]. Cells
were plated in a well of 24-well plate coated with fibro-
nectin (2 lg/mL in serum-free DMEM; BD Bioscience,
Bedford, MA) and incubated in a tissue culture incubator
at 33°C with 5% CO2. Cell were progressively passaged to
larger plates and maintained in 60-mm tissue culture
plates coated with 1% gelatin. For all experiments, cells
were incubated with RPE cell growth medium containing
INF-c in a tissue culture incubator at 33°C with 5% CO2.
However, to confirm the observed results is specifically
due to PEDF and/ or TSP1 deficiency, cells were also
incubated with RPE cell growth medium without INF-cin a tissue culture incubator at 37°C with 5% CO2 for
48 h to eliminate large T antigen. Cells allowed to reach
80–90% confluence and then used for experiments. For
some experiments cells were allowed to reach confluence
(junctional organization) and used for experiments a
week later. Three different isolations of RPE cells were
used in these studies and all cells were used prior to pas-
sage 20.
FACS analysis
RPE cells form 60-mm culture plates were rinsed with
PBS containing 0.04% EDTA and incubated with 1.5 mL
of Cell Dissociation Solution (Sigma, St. Louis, MO).
Cells were then washed, collected from plates with
DMEM containing 10% FBS, centrifuged, and blocked in
0.5 mL of Tris-buffered saline (TBS; 25 mmol/L Tris-
HCl, 150 mmol/L NaCl, pH 7.6) with 1% goat serum for
20 min on ice. Cells were then pelleted and incubated in
0.5 mL TBS with 1% BSA containing a specific primary
antibody on ice for 30 min. The following antibodies
were used anti-RPE65 (MAB 5428), anti-bestrophin
(MAB 5466), anti-VCAM-1 (CBL1300), anti-endoglin
(CBL1358), anti-b3 (MAB 1957), anti-a5b1 (MAB 1999),
anti-avb3 (MAB 1976Z), anti-a2 (AB1936), anti-a3
ª 2015 The Authors. Physiological Reports published by Wiley Periodicals, Inc. on behalf ofthe American Physiological Society and The Physiological Society.
2015 | Vol. 3 | Iss. 1 | e12266Page 3
M. Farnoodian et al. PEDF, TSP1, and RPE Cell Function

(AB1920), anti-a5 (AB1921), anti-aV integrins (MAB
1930) (Millopore, Billerica, MA), anti- ICAM-1(SC-1511),
anti-b5 (SC-5401), anti-b8- integrins (SC-10817) (Santa
Cruz Biotechnology, Santa Cruz, CA), anti-ICAM-2, anti-
a1-integrin (BD Biosciences), anti-VEGF receptor-1
(VEGFR-1), anti-VEGFR-2 (R&D Systems), and anti-
CD47, anti- PDGF-Ra, and anti- PDGF-Rb (eBioscience,
San Diego, CA) antibodies at dilutions recommended by
the supplier. Cells were then rinsed twice with TBS
containing 1% BSA and incubated with appropriate
FITC-conjugated secondary antibody (Pierce, Rockford,
IL) prepared in TBS containing 1% BSA for 30 min on
ice. Following incubation, cells were washed twice with
TBS containing 1% BSA, resuspended in 0.5 mL of TBS
with 1% BSA and analyzed by a FACScan caliber flow
cytometer (Becton Dickinson, Franklin Lakes, NJ). These
experiments were repeated twice using two different
isolations of RPE cells with similar results. The mean
fluorescent intensities are indicated for each antibody.
Cell proliferation studies
Cell proliferation was assessed by counting the number of
cells for two weeks. Cells (1 9 104) were plated in multi-
ple sets of gelatin-coated 60-mm tissue culture plates, fed
every other day for the duration of experiment. The num-
ber of cells was determined by counting every other day,
on days not fed, in triplicates. The rate of DNA synthesis
was also assessed using Click-It EDU Alexa Flour 488 as
recommended by the supplier (Life technologies, Grand
Island, NY). The assay measures DNA synthesis using
5-ethynyl-20-deoxyuridine (EdU) a nucleoside analog of
thymidine. The percentage of cells undergoing active
DNA synthesis was determined by FACScan caliber flow
cytometry (Becton Dickinson).
TdT-dUPT Terminal Nick-End Labeling (TUNEL) was
used to assess apoptotic cell death. TUNEL staining was
performed using Click-iT-TUNEL Alexa Flour imaging
assay as recommended by supplier (Life Technologies). A
similar experiment was performed in the presence of
50 lmol/L H2O2 (Fisher Scientific). This concentration
was determined based on moderate effect on cell viability
after 24–48 h. Positive apoptotic cells counted in 10 high-
power fields (9200) and calculated as percentage of total
cell number. All samples were prepared in triplicates and
repeated twice.
Indirect immunofluorescence studies
Cells (1 9 105) were plated on fibronectin-coated 4-well
chamber slides (5 lg/mL in PBS) and allowed to reach
confluence (1–2 days). Cells were rinsed with PBS, fixed
with cold acetone for 10 min on ice, permeabilized with
PBS containing 0.1% Triton X-100 for 12 min at room
temperature, and then blocked with PBS containing 1%
BSA at 37°C for 30 min. Following incubation, slides
were washed once with PBS and incubated with specific
primary antibodies for 2 h at room temperature. The pri-
mary antibodies were anti -ZO-1 (Life Technologies),
anti- b-catenin, anti-P120- catenin, anti-N-cadherin (BD
Bioscience), anti-vinculin and FITC-conjugated phalloidin
(Sigma) prepared in PBS (1:200) containing 1% BSA. Fol-
lowing incubation, slides were washed with PBS and incu-
bated with specific Cy3-conjugated secondary antibodies
(Jackson ImmunoResearch, West Grove, PA; (1:800) in
PBS containing 1% BSA for 1 h at room temperature.
Following incubation, slides were washed four times with
PBS and examined using a fluorescence microscope (Carl
Zeiss Optical, Germany) and images were taken in digital
format.
Scratch wound assays
Cells (1 9 106) were plated in 60-mm tissue culture
dishes and allowed to reach confluent (1–2 days). Plates
were wounded using a 1-mL micropipette tip, washed
with growth medium twice to remove detached cells, and
fed with growth medium containing 1 lmol/L 5-fluoro-
uracil (Sigma) to block cell proliferation. Wound closure
was monitored by phase microscopy at different time
points (0, 24, 48 h) and images were captured in digital
format. The migrated distance as percentage of total dis-
tance was determined for quantitative assessment of data
as described previouslyDiMaio and Sheibani (2008).
Transwell migration assays
Cell migration was also determined using a transwell
migration assay. Costar transwell inserts (8-lm pore size,
6.5-mm membrane, Lowell, MA) were coated with PBS
containing fibronectin (2 lg/mL) on the bottom side at
4°C overnight. After washing with PBS, inserts were
blocked in PBS containing 1% BSA for 1 h at room tem-
perature and rinsed with PBS. Cells were trypsinized and
resuspended in serum-free medium, and 1 9 105 cells/
0.1 mL was added to the top of inserts. The inserts were
placed in a 24-well plate containing 0.5 mL of serum-free
medium and incubated for 4 h at 33°C. Following incu-
bation, cells were fixed with 2% paraformaldehyde for
10 min at room temperature stained with hematoxylin
and eosin (H& E), and the inserts were mounted on a
slide with the cell facing down. The number of cells
migrated through the membrane was determined by
counting 10 high-power fields (9200). Each experiment
was done in triplicates and repeated with two different
isolation of RPE cells.
2015 | Vol. 3 | Iss. 1 | e12266Page 4
ª 2015 The Authors. Physiological Reports published by Wiley Periodicals, Inc. on behalf of
the American Physiological Society and The Physiological Society.
PEDF, TSP1, and RPE Cell Function M. Farnoodian et al.
PEDF and TSP1 reexpression studies
To express PEDF in PEDF�/� RPE cells, 2.5 9 105 cells
were plated in 35-mm tissue culture dishes. The next day,
lenti viruses encoding PEDF or GFP (100 pfu/cell, 20 lL)and 20 lL of lenti booster (Sirion Biotech, Martinsried,
Germany) including 10 lL each of 1:100 dilution of solu-
tion A and B in PBS, were mixed and diluted in 500 lLof opti-MEM (Life Technologies) and incubated for
15 min at room temperature. Following incubation, the
tissue culture plates were washed twice with serum-free
medium and incubated with 0.5 mL of lenti virus and
lenti booster mixture overnight. The next day medium
containing lenti virus and lenti booster mixture were
removed, fresh growth medium was added to the plates
and incubated for 4 days before they were used for fur-
ther analysis.
To express TSP1 in TSP1�/� RPE cells, 2.5 9 105 cells
were plated in 35-mm tissue culture dishes. The next day,
adenoviruses encoding TSP1 or GFP (625 pfu/cell; 50 lL)and adeno booster (10 lL, Sirion Biotech) were mixed
and diluted in 500 lL of opti-MEM (Life Technologies)
and incubated for 15 min at room temperature. Follow-
ing incubation, the tissue culture plates were washed
twice with serum-free medium and incubated with
0.5 mL of adenovirus and adeno booster mixture over-
night. The next day, medium containing virus and boos-
ter mixture were removed, fresh growth medium was
added to the plates and incubated for 3 days before they
were used for further analysis.
Cell adhesion assays
Cell adhesion assays were conducted using 96-well plates
(Maxisorb Nunc Immunoplate, Fisher Scientific) coated
with different concentration of collagen I, collagen IV,
vitronectin and fibronectin (BD Biosciences), diluted in
TBS (50 lL/well) containing 2 mmol/L CaCl2, 2 mmol/L
MgCl2 (Ca/Mg) overnight at 4°C. Plates were rinsed four
times with TBS containing Ca/Mg (200 lL/well), blockedusing TBS with Ca/Mg containing 1% BSA (200 lL/well)at room temperature for 1 h. Cells were collected from
tissue culture plates using 2 mL of dissociation buffer
(2 mmol/L EDTA, 0.05% BSA in TBS), rinsed with TBS
and resuspended in cell-binding buffer (150 mmol/L
NaCl, 20 mmol/L HEPES, 4 mg/mL BSA, pH 7.4) at
~5 9 105 cells/mL. The coated plates were washed with
TBS containing Ca/Mg, and incubated with equal
amount (50 lL/well) of cell suspension and TBS with
Ca/Mg for 2 h at 37°C. Following incubation, plates were
washed with TBS with Ca/Mg to remove nonadherent
cells. The number of adherent cells was quantified by
measuring intracellular acid phosphatase activity as
described previouslyPark et al. (2010). These assays were
performed in triplicates and repeated with two different
isolations of RPE cells.
Western blot analysis
Cells (1 9 106) were plated in 60-mm tissue culture
dishes until reached confluence (~90%). Cells were
washed with serum-free DMEM medium and incubated
in growth medium without serum (conditioned medium,
CM) for 2 days. The CM was centrifuged at 400 9 g for
5 min to remove cell debris and stored at �80°C for fur-
ther analysis. Cell lysates were also prepared using 100 lLof lysis buffer (50 mmol/L HEPES pH 7.5, 1 mmol/L
MgCl2, 1 mmol/L CaCl2, 100 mmol/L NaCl, and
0.1 mmol/L EDTA with 1% NP-40, 1% Triton X-100,
and protease inhibitor cocktail; Roche Biochemicals,
Mannheim, Germany). BCA protein assay (Bio- Rad,
Hercules, and CA) was used to determine protein concen-
tration. Samples were mixed with appropriate amount of
69 SDS buffer and analyzed by 4–20% SDS-PAGE (Invi-
trogen). Proteins were transferred to nitrocellulose mem-
brane and blocked in TBS containing 0.05% Tween 20
(TBST) with 5% skim milk for 1 h at room temperature.
Membranes were incubated with primary antibody for
2 h at room temperature, washed with TBST, and incu-
bated with appropriate horseradish peroxidase-conjugated
secondary antibody (1:10,000; Jackson ImmunoResearch)
for 1 h at room temperature. The following antibodies
were used: anti- fibronectin (SC-9068), anti-eNos
(SC-654), anti- FAK (SC-558), anti-c-Src (SC-8056)
(Santa Cruz, Biotechnology), anti-TSP1 (A 6. 1, Neo
Markers, Fermont, CA), anti-TSP2, anti- PEDF, anti-
cathepsin B (R& D System), anti-tenascin C (AB19013),
anti- Collagen IV (AB756P) (Millipore), anti-SPARC,
anti-opticin, anti- periostin, and anti- MFGE-8 (R& D
System), anti-iNOS, anti-PDI, anti-p-Src, anti-p-P38,
anti-P38, anti-p-AKT1, anti-AKT1, anti-p-ERK and anti-
ERK (Cell Signaling), anti-nNOS (BD Bioscience), and
anti-b- actin (Thermo Fisher) were used at dilutions rec-
ommended by the supplier. The protein bands were visu-
alized using enhanced chemiluminescence reagent (GE
Bioscience, Piscataway, NJ). The mean band intensities
were determined using Image J 1.46a (National Institute
of Health, Bethesda, MD) and normalized against b-actinband as loading control.
Phagocytosis assays
Phagocytosis activity was assayed using the unique
pHrodoTM – based system (Life technologies) based on the
acidification of the particles as they are ingested.
pHrodoTM dye is a fluorogenic dye that greatly increases
ª 2015 The Authors. Physiological Reports published by Wiley Periodicals, Inc. on behalf ofthe American Physiological Society and The Physiological Society.
2015 | Vol. 3 | Iss. 1 | e12266Page 5
M. Farnoodian et al. PEDF, TSP1, and RPE Cell Function

in fluorescence intensity when the pH becomes more
acidic. RPE cells in 35-mm culture plates were loaded
with medium containing pHrodoTM Green E. coli BioPar-
ticles conjugates and incubated for different time points
(5 and 24 h). Following incubation, cells were rinsed with
PBS containing 0.04% EDTA, and incubated with 1.5 mL
of cell dissociation solution (Sigma). Cells were then
washed, collected from plates, washed twice with PBS,
resuspended in 0.5 mL of PBS, and analyzed by a FAC-
Scan caliber flow cytometry (Becton Dickinson).
Proteasome peptidase assays
Proteasome peptidase assays were performed as previously
described by us Aghdam et al. (2013). The cells were col-
lected and lysed using the lysis buffer containing
50 mmol/L Tris-HCl pH 7.4, 1 mmol/L ATP, 10% glyc-
erol, 0.1% NP40, 2 mmol/L MgCl2, 1.5 mmol/L DTT,
and 0.03% SDS. BCA protein assay (Bio-Rad) was used
to determine protein concentrations. The protein lysates
(50 lg/well) were added into a dark 96-well microplate
and probed with the fluorogenic peptide substrates:
Z-Leu-Leu-Glu-AMC for caspase-like, Ac-Arg-Leu-
Arg- AMC for trypsin-like, and Suc-Leu-Leu-Val-Tyr-
AMC for chymotrypsin-like (Enzo Life Sciences, Farming-
dale, NY) at the final concentration of 100 lmol/L in a
total volume of 0.1 mL. The plates were incubated in the
dark for 30 min at 37°C. Following incubation, the reac-
tion was stopped using 100% ethanol (100 lL/well). Thefluorescent intensity was measured using a plate reader
(PerkinElmer, Wellesley, MA). The excitation and emis-
sion wavelengths were 355 and 460 nm, respectively.
Secreted VEGF levels
The level of VEGF produced by WT, TSP1�/�, and
PEDF�/� RPE cells were determined using the Mouse
VEGF Immunoassay Kit (R& D Systems). Cells (1 9 106)
were plated in 60-mm tissue culture dishes and allowed
to reach 90% confluence. The cells were washed with
serum-free DMEM and incubated with 2 mL of growth
medium without serum for 2 days. The CM were col-
lected, centrifuged at 400 9 g for 5 min to remove cell
debris, and used for VEGF measurements as recom-
mended by the supplier.
Capillary morphogenesis assays
Tissue culture plates (35 mm) were coated with 0.5 mL
Matrigel (10 mg/mL, BD Biosciences) and incubated at
37°C for at least 30 min to allow the gel harden. Mouse
choroidal EC (ChEC) were prepared and maintained as
previously described by us Lavine et al. (2013). The ChEC
were removed by trypsin-EDTA, washed with DMEM con-
taining 10% FBS. Cells (1 9 105 cells/mL) were resus-
pended in collected conditioned medium (CM) form wild
type, PEDF�/� and TSP1�/� RPE cells. Cells (2 mL) were
applied to the Matrigel-coated plates, incubated at 37°C,photographed after 14 h using a Nikon microscope in a
digital format. For quantitative assessment of the data, the
mean number of branch points was determined by count-
ing the branch points in five high-power fields (9100).
RNA purification and real-time qPCRanalysis
The total RNA from RPE cells was extracted using mir-
Vana PARIS Kit (Invitrogen). cDNA synthesis was per-
formed from 1 lg of total RNA using Sprint RT
Complete-Double PrePrimed Kit (Clontech, Mountain
View, CA). One microliter of each cDNA (dilution 1:10)
was used as template in qPCR assays, performed in
triplicate of three biological replicates on Mastercycler
Realplex (Eppendorf, Hauppauge, NY) using the SYBR-
Green qPCR Premix (Clontech). Amplification parame-
ters were as follows: 95°C for 2 min; 40 cycles of
amplification (95°C for 15 sec, 60°C for 40 sec); dissoci-
ation curve step (95°C for 15 sec, 60°C for 15 sec, 95°Cfor 15 sec). Primer sequences for different inflammatory
cytokines were: TNF-a 50-ACCGTCAGCCGATTTGCTAT-30 (forward) and TNF-a 50-TTGACGGCAGAGAGGAGGTT- 30 (reverse), IL-18 5‘-AAGAAAATGGA GACCTGGAA
TCAG-3‘ (forward) and IL-18 50-ATTCCGTATTACTGCGGTTGTACA-30 (reverse), MCP-1 50-GTCT GTGCT
GACCCCAAGAAG-30 (forward) and MCP-1 50-TGGTTCCGATCCAGGTTTTTA-30 (reverse), and RANTES 50-GCCCACGTCAAGGA GTATTTCT-30 (forward) and
RANTES 50-CAAACACGA CTGCAAGATTGGA-30
(reverse).
Standard curves were generated from known quantities
for each of the target gene of linearized plasmid DNA. Ten
times dilution series were used for each known target,
which were amplified using SYBR-Green qPCR. The linear
regression line for ng of DNA was determined from rela-
tive fluorescent units (RFU) at a threshold fluorescence
value (Ct) to quantify gene targets from cell extracts by
comparing the RFU at the Ct to the standard curve, nor-
malized by the simultaneous amplification of RpL13a, a
housekeeping gene. The following primers for RpL13A 5‘-
TCTCAAGGTTGTTCGGCTGAA-30 (forward) and RpL13A
50-CCAGACG CCCCAGGTA-30 (reverse) were used.
Ex vivo sprouting of RPE-choroid complex
Choroidal explants were prepared and cultured as
described previously Kobayashi et al. (1998), with some
2015 | Vol. 3 | Iss. 1 | e12266Page 6
ª 2015 The Authors. Physiological Reports published by Wiley Periodicals, Inc. on behalf of
the American Physiological Society and The Physiological Society.
PEDF, TSP1, and RPE Cell Function M. Farnoodian et al.

modifications. Briefly, postnatal day 21 (P21) mice were
anesthetized using isoflurane and killed by cervical dislo-
cation. Eyes were enucleated, washed three times, and
kept in ice-cold serum-free DMEM. Attached tissues to
the outer surface of the eyeball (blood vessels, fatty and
connective tissues) were shaved in ice-cold DMEM under
a dissection microscope. The cornea, lens, and corpus
vitreum were removed before the intermediate segment
containing the sclera, choroid, RPE, and the retina was
dissected along the whole circumference. The neuroretinal
was removed before the sclera, and the RPE-choroid com-
plex were sectioned into 0.5–1.0 mm pieces. These pieces
were finally transferred into 35-mm culture dishes coated
with 0.5 mL of Matrigel (10 mg/mL) (BD Biosciences)
and allowed to harden. Tissue preparations were trans-
ferred into a 37°C cell culture incubator without medium
for 20 min. Endothelial cell growth medium (DMEM
containing 10% FBS, 2 mmol/L L-glutamine, 2 mmol/L
sodium pyruvate, 20 mmol/L HEPES, 1% nonessential
amino acids, 100 lg streptomycin, 100 U/mL penicillin,
55 U/mL heparin, and endothelial growth supplement
100 lg/mL; Sigma) was then added (2 mL/dish) and
incubated at 37°C with 5% CO2 for eight days. Explants
were fed every other day. After 8 days, preparations were
fixed in 4% PFA for 30 min at room temperature, washed
three times in PBS before they were imaged using a Ni-
kon microscope. Ten explants per eye were prepared and
cultured in a single dish, and at least three mice per geno-
type were used.
NO measurements
The intracellular NO levels produced by WT, TSP1�/�,
and PEDF �/� RPE cells was determined using 4-amino-
5-methylamino-2, 7-difluoroflourescein diacetate (DAF-
FM diacetate; Invitrogen). DAF-FM is produced after
deacetylation of DAF-FM diacetate by intracellular ester-
ases. The increased fluorescence intensity of DAF-FM due
to the reaction with NO is measured with a fluorescein
filter. Cells (5 9 103 cells/0.1 mL) were plated on gelatin-
coated 96-well black/clear bottom plates (BD Biosciences)
and incubated overnight. The next day, medium was
removed and 0.1 mL of RPE medium containing
30 lmol/L DAF-FM was added to each well and incu-
bated for 40 min. The medium was replaced with fresh
RPE medium and incubated for an additional 30 min.
Following incubation, the cells were washed with TBS
(0.1 mL, twice) and fluorescence intensity was measured
at an excitation of 458 nm and an emission of 535 nm
using a fluorescent microplate reader (Victa21420 Multi-
label Counter, PerkinElmer). This assay was conducted in
triplicates and repeated with two different isolation of
RPE cells.
Wholemount staining studies
RPE layers were prepared form 4-week-old wild-type,
PEDF�/�, and TSP1 �/� mice. Eyes were fixed in 4%
PFA in PBS for 2 h. Following fixation, RPE, choroid,
and sclera complex was prepared by removing the retina
and cutting the optic nerve from the posterior portion of
the eyes. The remaining cup was washed with PBS three
times for 10 min, and blocked in blocking solution (50%
FCS, 20% normal goat serum; NGS, in PBS containing
0.01% Triton 100X) at RT for 1 h. After blocking samples
were washed with PBS three times for 10 min and incu-
bated with primary antibodies including anti-iNOS, anti-
HNE (Cell Signaling), anti-eNOS (SC-654) (Santa Cruz),
and anti-ZO-1 (Life Technology) in PBS containing 20%
FCS, 20% NGS, and 0.01% TX-100 overnight at 4°C.Samples were then washed with PBS and incubated with
specific Cy3-conjugated secondary antibody (1:800; Jack-
son ImmunoResearch) in PBS containing 20% FCS, 20%
NGS, and 0.01% TX-100 at room temperature for 2–4 h.
Following incubation, samples were washed five times
with PBS, flattened by four radial cuts, mounted on the
slide, and examined using a fluorescence microscope
(Carl Zeiss Optical) and the images were taken in digital
format.
Assessments of reactive oxygen species
The level of cellular reactive oxygen species was measured
with dihydroethidium staining (DHE). DHE is a weak
blue fluorescent dye which binds to DNA upon oxidation
to red fluorescent ethidium by O�2 . Cells (3 9 104) were
plated on fibronectin-coated chamber slide (5 lg/mL; BD
Bioscience) and incubated for 24 h in growth medium.
Following incubation, the cells were exposed to 10 lmol/L
DHE for 15–20 min, washed with growth medium and
incubated twice with growth medium each for 30 min. A
similar experiment was performed in the presence of
50 lmol/L H2O2 (positive control; Fisher Scientific). Dig-
ital images were captured at the same exposure time for
all samples. For quantitative analysis, images were ana-
lyzed with Image J software (National Institute of Health,
Bethesda, MD). The mean fluorescent intensity was deter-
mined from intensities of multiple cells (100 cells). A
similar experiment was performed using cells treated with
50 lmol/L H2O2 for 24 h, and three independent experi-
ments with two different isolation of RPE cells were per-
formed.
Statistical analysis
Statistical differences between control and treated samples
were evaluated using Graphpad Prism software (La Jolla,
ª 2015 The Authors. Physiological Reports published by Wiley Periodicals, Inc. on behalf ofthe American Physiological Society and The Physiological Society.
2015 | Vol. 3 | Iss. 1 | e12266Page 7
M. Farnoodian et al. PEDF, TSP1, and RPE Cell Function

CA) according to the Tukey Multiple Comparison test
with a P value <0.05 considered significant.
Results
Isolation and characterization of PEDF�/�and TSP1�/� RPE cells
RPE cells were prepared from 4-week-old wild-type,
TSP1�/� and PEDF�/� Immorto mice as described in
Material and Methods. The expression of RPE-specific
markers was confirmed by FACS analysis (Fig. 1A). All
cells expressed significant amount of bestrophin and RPE
65, as expected. The results are representative of sample
mean from three different isolations, and there were no
statistically significant differences between the cells. The
PEDF�/� RPE cells exhibited a more spindle-shaped
and elongated morphology compared to wild-type cells
on gelatin-coated plates, while TSP1�/� RPE cells exhib-
ited a similar morphology as wild-type RPE cells
(Fig. 1B).
To determine the properties of PEDF�/�, TSP1�/�,
and wild-type RPE cells, we next analyzed the expression
of other RPE cell markers by FACS (Fig. 2A) and Wes-
tern blot (Fig. 2B) analysis. Alteration in some of these
markers including (ICAM-1, VCAM-1, and VEGF recep-
tors) has been reported as underlying factors in the devel-
opment of AMD. The decreased expression level of
ICAM-1 was observed in PEDF �/� RPE and TSP1�/�compared with wild-type cells. However, the PEDF�/�RPE cells represented the most dramatic change com-
pared to wild-type cells. The expression of other markers
including CD36, CD47, VEGFR-1, and VCAM-1 was
observed in all RPE cells with modest variations among
the cell types. We also determined VEGFR-2, endoglin,
and ICAM-2 expression, which were undetectable in all
cells (Fig. 2A). PDGF-Rb signaling plays a key role in the
RPE cell migration and proliferation through activation
of the downstream signaling pathways (Schlingemann
2004). The TSP1�/� RPE cells exhibited a dramatic
increase in PDGF-Rb expression compared with PEDF�/�and wild-type cells (Fig. 2A). Similarly increased levels of
A
B
Figure 1. Isolation and characterization of mouse retinal pigment epithelium (RPE) cells. Wild-type (WT) RPE, PEDF�/�, and TSP1�/� RPE cells
were prepared as described in Material and Methods and plated in 60-mm tissue culture dishes coated with 1% gelatin. (A) Expression of
specific RPE cells markers. RPE cells were examined for expression of RPE65 and Bestrophin by FACS analysis. The shaded area shows control
IgG staining. (B) Phase micrographs of RPE cells. Images were captured in digital format at 940 and 9100 magnifications. These experiments
were repeated using three different isolations of RPE cells with similar results.
2015 | Vol. 3 | Iss. 1 | e12266Page 8
ª 2015 The Authors. Physiological Reports published by Wiley Periodicals, Inc. on behalf of
the American Physiological Society and The Physiological Society.
PEDF, TSP1, and RPE Cell Function M. Farnoodian et al.

PDGF-Ra expression was observed in TSP1�/� and
PEDF�/� RPE cells compared to wild-type cells.
In the retina, the secreted milk fat globule-EGF factor 8
(MFG-E8) is involved in clearance of shed photoreceptor
outer segment (POS) by ligating avb5 integrin. Absence of
either MFG-E8 ligand or avb5 receptor results in abolished
RPE phagocytosis (Finnemann et al. 1997; Nandrot et al.
2007). MFG-E8 also plays an important role in apoptotic
cell clearance, angiogenesis, and adaptive immunity (Dero-
ide et al. 2013). MFG-E8 protein levels were examined by
Western blot analysis. We observed a modest decrease in
expression level of MFG-E8 in PEDF�/�, but not TSP1�/�,
RPE cells compared with wild-type cells. We also examined
protein disulfide isomerase (PDI) expression in RPE cells.
A
B
Figure 2. Expression of other RPE cell markers. (A) RPE cells were examined for expression of VCAM-1, VEGF-R1, VEGF-R2, Endoglin, ICAM-1,
ICAM-2, CD36, PDGF-Ra, PDGF-Rb, and CD47by FACS analysis. The shaded area shows control IgG staining. (B) Cell lysates were prepared
from wild-type (WT), PEDF�/�, and TSP1�/� RPE cells and analyzed for expression level of MFG-E8, PDI, ICAM-1 and b-actin as loading
control by Western blot analysis using specific antibodies. The quantitative assessment of data is shown on the right (*P < 0.05, ***P < 0.001,
n = 3).
ª 2015 The Authors. Physiological Reports published by Wiley Periodicals, Inc. on behalf ofthe American Physiological Society and The Physiological Society.
2015 | Vol. 3 | Iss. 1 | e12266Page 9
M. Farnoodian et al. PEDF, TSP1, and RPE Cell Function

PDI is a crucial factor for cell viability, which plays a critical
function during protein folding (Hahm et al. 2013). The
downregulation of PDI in human RPE cells may lead to pro-
tein aggregation and endoplasmic reticulum stress (Yokoy-
ama et al. 2006). PEDF�/� RPE cells expressed increased
level of PDI compared with wild-type and TSP1�/� RPE
cells. A significant decrease in the level of ICAM-1 was
observed in TSP1�/� and PEDF�/� cells consistent with
FACS results.
Adherens junctions facilitate intercellular adhesions, a
process with major roles in maintaining tissue integrity
and normal morphology of RPE cells (Bailey et al.
2004).The altered morphology of PEDF�/� RPE cells
suggested altered cell–cell interactions. We next deter-
mined the localization and expression of junctional pro-
tein complexes by indirect immunofluorescence staining
(Fig. 3A) and Western blot analysis (Fig. 3B). N-cadherin
is reported as the dominant cadherin in RPE cells with
A
BC
Figure 3. Cellular localization and expression of junctional proteins. (A) The localization of ZO-1, N-cadherin, b-catenin, and P-120 catenin was
determined by immunofluorescence staining. The WT, PEDF�/�, and TSP1�/� RPE cells were plated on fibronectin-coated chamber slides and
stained with specific antibodies as detailed in Material and Methods. No staining was observed in the absence of primary antibody (not shown).
Please note the absence of N-cadherin from the sites of cell–cell contact in PEDF�/� RPE cells, as well as reduced junctional localization in
TSP1�/� RPE cells. (B) Western blot analysis of junctional proteins. Total cell lysates were prepared from WT, PEDF�/�, and TSP1�/� RPE cells
and analyzed for expression level of ZO-1, N-cadherin, b- catenin, P-120 catenin, and b-actin. Please note decreased expression of ZO-1
proteins in PEDF�/� RPE cells. The TSP1�/� RPE cells expressed increased levels of N-cadherin and P-120 catenin. The b-catenin level was
increased in TSP1�/� RPE cells. The b-actin was used for loading control. The quantification of data is shown in (C) (**P < 0.01, ***P < 0.001,
n = 3). These experiments were repeated using three different isolations of RPE cells with similar results.
2015 | Vol. 3 | Iss. 1 | e12266Page 10
ª 2015 The Authors. Physiological Reports published by Wiley Periodicals, Inc. on behalf of
the American Physiological Society and The Physiological Society.
PEDF, TSP1, and RPE Cell Function M. Farnoodian et al.

important roles in cell migration and photoreceptor sur-
vival, and localization at cell–cell junctions (Kaida et al.
2000; Chen and Ma 2007). Here, we observed lack of
N-cadherin junctional localization in PEDF�/� RPE cells
compared with the wild-type cells (Fig. 3A), while no
significant difference was observed in the N-cadherin
expression level compared with wild-type cells (Fig. 3B
and C). TSP1�/� RPE cells showed increased levels of
N-cadherin compared with wild-type or PEDF�/� cells.
In addition, a band with higher molecular weight was
detected in TSP1�/� RPE cells for N-cadherin. Thus, the
absence of PEDF and TSP1 was associated with defects in
cell–cell interactions and junction formation in RPE cells.
Tight junctions are complex, dynamic structures that
regulate cell proliferation, polarity, and paracellular diffu-
sion and permeability. Formation of tight junctions is
important for appropriate barrier function of the RPE
cells. ZO-1 plays a major role in the formation and sta-
bilization of tight junctions (Rizzolo et al. 2011). The
PEDF �/� and TSP1�/� RPE cells exhibited decreased
levels of ZO-1 (Fig. 3B). However, no significant changes
in junctional localization of ZO-1 were observed in
TSP1�/� and PEDF�/� RPE cells compared with the
wild-type cells (Fig. 3A). In addition, ZO-1 showed
enhanced nuclear localization in TSP1�/� RPE cells
compared to wild-type and PEDF�/� cells, without
impacting the localization of other components of adhe-
rens junction complexes. Similar results were observed in
RPE-choroid complex prepared from TSP1�/� mice in
vivo (not shown). We did not observe any effect on ZO-
1 nuclear localization in PEDF�/� RPE cells. Junctional
localization of p120- catenin, another adherens junctional
protein, was similarly observed in all RPE cells. However,
an increase in p120- catenin level was observed in
PEDF�/� and TSP1�/� RPE cells (Fig. 3B). The b-cate-nin level was significantly increased in PEDF�/� RPE
cells compared to wild-type cells. However, b-cateninlocalization was not affected by PEDF and TSP1 defi-
ciency in RPE cells (Fig. 3B and C). To roll out the pos-
sible impact of large T antigen and INF-c present in
growth medium, similar experiments were conducted in
the absence of INF-c at 37°C to eliminate large T antigen
expression with similar results (not shown). Collectively,
our results indicated that deficiency in PEDF or TSP1
had a significant impact on junctional properties of RPE
cells.
PEDF�/� and TSP1�/� RPE cells displayed agreater rate of proliferation
RPE cell integrity is essential for proper retina function.
The demonstrated impact of PEDF and TSP1 on junc-
tional properties of RPE cells suggested alterations in
proliferation of these cells. RPE cells are normally
postmitotic in adults and their activation is associated
with proliferative vitro retinopathy (PVR) (Hecquet
et al. 2002). Choroidal neovascularization (CNV), a
major pathologic condition in patient with AMD, at
the early stage is associated with hyperplastic RPE cells.
However, in the late stages of CNV the RPE cells pro-
liferate in a monolayer to enclose CNV and promote
CNV regression (Bhutto and Lutty 2012).The rate of
cell proliferation was determined by counting the num-
ber of cells for two weeks. An increase in the rate of
proliferation was observed in PEDF�/� and TSP1�/�RPE cells compared to the wild-type cells (Fig. 4A). We
next examined whether the increase in rate of prolifera-
tion was the result of enhanced DNA synthesis. The
percentage of cells undergoing active DNA synthesis
was determined by EdU labeling, a synthetic nucleoside
analog. The rate of DNA synthesized in PEDF�/� and
TSP1�/� RPE cells was significantly greater than that
observed in wild-type cells (Fig. 4B). Thus, PEDF or
TSP1 deficiency is associated with enhanced RPE cell
proliferation.
The apoptosis of RPE cells plays an important role in
the development of different retinal degenerative diseases
(Mascarelli et al. 2001). Human AMD studies suggest
that RPE cells, photoreceptors, and inner nuclear layer
cells die by apoptosis (geographic atrophy; GA) (Dun-
aief et al. 2002). We next determined whether lack of
PEDF and TSP1 in RPE cells affects their rate of apop-
tosis. TUNEL staining was used to determine the rate
of apoptosis in RPE cells under basal and challenged
conditions. A similar rate of apoptosis was observed in
all RPE cells at the basal level (Fig. 4C). However,
under stress conditions (50 lmol/L H2O2) PEDF�/�and TSP1�/� RPE cells exhibited significantly higher
rate of apoptosis compared with wild-type cells
(Fig. 4D; P < 0.05; n = 5). Thus, lack of TSP1 or PEDF
results in increased sensitivity of RPE cells to oxidative
challenge.
PEDF�/� and TSP1�/� RPE cells were lessmigratory
Migration and proliferation of RPE cells contribute to a
number of pathologies including PVR (Pastor et al.
2002). Scratch wound assays were conducted to investi-
gate the impacts of PEDF or TSP1 deficiency on RPE cell
migration. A significant delay in wound closure was
observed in PEDF�/� and TSP1�/� RPE cells com-
pared to wild-type cells (Fig. 5A). The quantitative
assessment of the data is shown in Fig. 5B. Similar results
were observed using a transwell migration assay
(Fig. 5C).
ª 2015 The Authors. Physiological Reports published by Wiley Periodicals, Inc. on behalf ofthe American Physiological Society and The Physiological Society.
2015 | Vol. 3 | Iss. 1 | e12266Page 11
M. Farnoodian et al. PEDF, TSP1, and RPE Cell Function

Reexpression of PEDF or TSP1 restorednormal migration of PEDF�/� and TSP1�/�RPE cells
PEDF�/� and TSP1�/� cells displayed decreased migra-
tion compared with wild-type cells. To examine if reex-
pression of PEDF or TSP1 is sufficient to restore normal
migration in PEDF�/� or TSP1�/� cells, we reexpressed
PEDF and TSP1 in PEDF�/� and TSP1�/� cells. Reex-
pression of PEDF and TSP1 was confirmed by Western
blot analysis of cell lysates and conditioned medium
(Fig. 5D and E). A significant improvement in migration
of RPE cells was observed in PEDF�/� and TSP1�/�cells upon reexpression of PEDF and TSP1 (Fig. 5F).
To confirm the change in migratory phenotype of
PEDF�/� and TSP1�/� RPE cells, we examined the for-
mation of actin stress fibers and focal adhesions using
indirect immunofluorescence staining. Increased number
of focal adhesions was observed in PEDF�/� and
TSP1�/� RPE cells compared to wild-type cells (Fig. 6A).
The TSP1�/� and PEDF�/� RPE cells were also spread
more with stronger peripheral actin staining. These results
were further confirmed by increased expression of FAK in
PEDF�/� and TSP1�/� RPE cells compared with the
wild-type cells (Fig. 6B). A significant increase in vinculin
level was also observed in TSP1�/� RPE cells. These
results are consistent with increased presence of focal
adhesions, spreading, and reduced migration of TSP1�/�and PEDF�/� RPE cells.
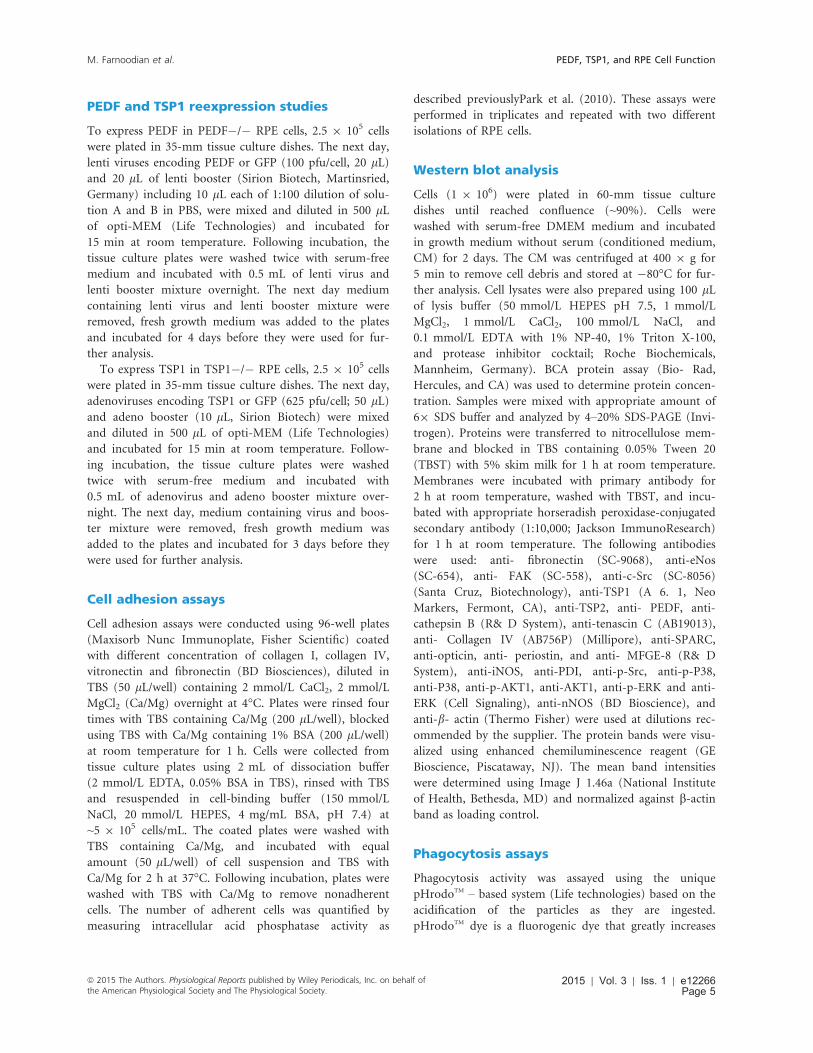
PEDF�/� and TSP1�/� RPE cells were moreadherent
Altered migration in PEDF�/� and TSP1�/� RPE cells
suggested changes in their adhesion properties. We next
examined the adhesion of RPE cells to various ECM pro-
teins. PEDF�/� RPE cells exhibited stronger adhesion on
collagen IV, collagen I, fibronectin, and vitronectin com-
pared with wild-type cells (Fig. 7A). TSP1�/� RPE cells
were also more adherent on fibronectin, vitronectin, col-
lagen IV, and collagen I compared with the wild-type cells
(Fig. 7A).
To determine if changes in adhesion were mediated by
alterations in integrin expression, we next determined the
expression level of different integrins by FACS analysis.
Similar expression levels for a2, a3, a5, av, b1, b3, b5,
A B
C D
Figure 4. Alterations in proliferation and apoptosis of RPE cells. (A) The rate of proliferation was determined by counting the number of cells.
A significant increase in the proliferation of PEDF�/� and TSP1�/� RPE cells was observed compared with WT cells. (B) An increase in the rate
of DNA synthesis was observed in TSP1�/� and PEDF�/� RPE cells compared with the WT cells. (C) The rate of apoptosis was determined
using TdT- dUTP Terminal Nick- End Labeling (TUNNEL). A similar experiment was carried out using H2O2 (50 lΜ), as an inducer of apoptosis
(positive control). Please note no differences were observed in the basal rate of apoptosis in these cells. (D) A significant increase in the rate of
apoptosis was observed in PEDF�/� and TSP1�/� RPE cells when challenged with H2O2 (50 lΜ) compared with WT cells (0.05, **P < 0.01,
***P < 0.001, n = 3).
2015 | Vol. 3 | Iss. 1 | e12266Page 12
ª 2015 The Authors. Physiological Reports published by Wiley Periodicals, Inc. on behalf of
the American Physiological Society and The Physiological Society.
PEDF, TSP1, and RPE Cell Function M. Farnoodian et al.

A
B C
D
F
E
Figure 5. Attenuation of migration in PEDF�/� and TSP1�/� RPE cells. (A) Scratch wound assay of RPE cell monolayers on gelatin-coated
plates was used to determine cell migration. Wound closure was observed by phase microscopy at indicated time points. (B) The quantitative
assessment of wound migration (**P < 0.01, ***P < 0.001, n = 3). (C) Migration of RPE cells in transwell assays. Please note a significant
decrease in the migration of PEDF�/� and TSP1�/� RPE cells compared with WT cells (***P < 0.001, n = 3). (D and E) The re-expression of
PEDF and TSP1 in PEDF�/� and TSP1�/� RPE cells. PEDF�/� and TSP1�/� cells were infected with viruses encoding PEDF or TSP1 cDNAs as
detailed in Material and Methods. The expression of PEDF and TSP1 was confirmed by Western blot analysis. These lanes are all from the
same membrane and extraneous lanes were removed for uniform labeling of the Figure. (F) Reexpression of PEDF and TSP1 in PEDF�/� and
TSP1�/� RPE cells restored their migration to near WT RPE cell as determined by transwell migration assay (*P < 0.05, ****P < 0.0001,
n = 3).
ª 2015 The Authors. Physiological Reports published by Wiley Periodicals, Inc. on behalf ofthe American Physiological Society and The Physiological Society.
2015 | Vol. 3 | Iss. 1 | e12266Page 13
M. Farnoodian et al. PEDF, TSP1, and RPE Cell Function

a5b1, and avb3 were observed in these cells (Fig. 7B).
There were no dramatic changes in the integrin expres-
sion. However, the possibility of alteration in affinity and
avidity of these integrins cannot be excluded. RPE cells
had undetectable levels of a1 integrin. The PEDF�/�RPE cells showed no detectable expression of b8 integrin.
However, TSP1�/� and wild-type RPE cells expressed
low levels of b8 integrin.
Diverse biological events including wound closure,
inflammatory responses, cell migration, and various
developmental processes and angiogenesis are affected by
changes in production of various ECM proteins. We next
examined the level of various ECM proteins including
fibronectin, collagen IV, tenascin C, SPARC, TSP1, TSP2,
periostin, opticin, and PEDF in RPE cells (Fig. 8).
TSP1�/� and PEDF�/� RPE cells expressed increased
levels of fibronectin compared with wild-type cells. The
level of cell associated collagen IV was decreased in
PEDF�/� and TSP1�/� RPE cells compared to wild-
type cells. PEDF�/� RPE cells showed a reduction in
TSP1 production compared with wild-type cells. TSP2
expression was only detected in TSP1�/� RPE cells. The
PEDF�/� RPE cells showed lower TSP1 production com-
pared with wild-type cells. In contrast, increased expres-
sion of PEDF was observed in TSP1�/� RPE cells
compared with wild-type cells. The TSP1�/� and
PEDF�/� RPE cells expressed increased levels of tenascin
C in both lysates and CM compared with wild-type cells.
SPARC expression was not affected in RPE cells (not
shown). PEDF�/� and TSP1�/� RPE cells exhibited
increased periostin expression compared with wild type
cells. Opticin was not detectable in PEDF�/� RPE cells
while TSP1�/� cells exhibited a dramatic increase in op-
ticin expression compared to wild-type cells. Thus, our
results suggest PEDF and TSP1 expression have major
effects on ECM expression impacting adhesive and migra-
tory properties of RPE cells.
RPE cell phagocytosis
The phagocytic function of RPE cells is crucial for
removal of toxic metabolites and RPE cell survival.
Defects in photoreceptor phagocytosis can results in
severe retinal pathologies (Sparrow et al. 2010; Mustafi
et al. 2013).To determine the impact of PEDF and TSP1
deficiency on RPE cell phagocytic activity, phagocytosis
was assayed using the unique pHrodo TM-based system
as detailed in Material and Methods. Enhanced accumula-
tion of phagocytosis activity was observed in PEDF�/�RPE cells compared with wild-type and TSP1�/� cells
(Fig. 9A). A similar trend was observed at later incuba-
tion time. Enhanced accumulation of the phagocytized
particles may be associated with altered proteasome and/
or lysosomal activity (Suraweera et al. 2012).
We next assessed the proteasome activity of RPE cells
using an in vitro peptidase assay as detailed in Material
A
B
Figure 6. Organization of actin stress fibers and focal adhesions in RPE cells. (A) RPE cells plated on fibronectin-coated chamber slides were
stained with phalloidin (green; actin) and vinculin (red; focal adhesions). Please note peripheral actin staining and basal organization and fewer
numbers of focal adhesions in PEDF�/� and TSP1�/� RPE cells compared with WT cells. This is consistent with reduced migratory phenotype
of null cells. (B) Increased protein level of focal adhesion kinase (FAK) and vinculin in TSP1�/� RPE cells. The PEDF�/� RPE cells also expressed
increased level of FAK. The b-actin was used as a loading control (*P < 0.05, n = 3). These experiments were repeated with three different
isolations of RPE cells with similar results.
2015 | Vol. 3 | Iss. 1 | e12266Page 14
ª 2015 The Authors. Physiological Reports published by Wiley Periodicals, Inc. on behalf of
the American Physiological Society and The Physiological Society.
PEDF, TSP1, and RPE Cell Function M. Farnoodian et al.
A
B
Figure 7. (A) Altered adhesion and expression of integrins in RPE cells. (A) Adhesion of RPE cells to collagen IV, collagen I, vitronectin, and
fibronectin was determined as described in Material and Methods. PEDF�/� and TSP1�/� RPE cells adhered stronger to various extracellular
matrix (ECM) proteins compared with WT cells. Please note strong adhesion of PEDF�/� RPE cells to vitronectin and fibronectin, and TSP1�/�RPE cells to collagen IV and collagen I. (B) Expression of integrins in RPE cells. a1, a2, a3, a5, av, b1, b2, b3, b5, b8, a5b1, and aVb3 integrin
expression was determined by FACS analysis as described in Material and Methods. Please note lack of a1 expression in RPE cells; while b8
integrin was absent in PEDF�/� RPE cells. These experiments were repeated using three different isolations of RPE cells with similar results.
ª 2015 The Authors. Physiological Reports published by Wiley Periodicals, Inc. on behalf ofthe American Physiological Society and The Physiological Society.
2015 | Vol. 3 | Iss. 1 | e12266Page 15
M. Farnoodian et al. PEDF, TSP1, and RPE Cell Function

and Methods. A decrease in caspase-like and trypsin-like
activity was observed in PEDF�/� RPE cells compared
with wild-type cells, while TSP1�/� cells exhibited an
increase in caspase-like and trypsin-like activity compared
to the wild-type cells. All cells similarly showed lower
chymotrypsin-like activity (Fig. 9B). Thus, the lack of
PEDF, but not TSP1, in RPE cells was associated with
impaired proteasome activity. To determine potential
changes in lysosomal system, we also examined the level
of cathepsin-B, the major lysosomal cysteine protease, in
lysates prepared from RPE cells by Western blot analysis.
PEDF�/� cells expressed similar level of cathepsin-B as
observed in wild-type cells. In contrast, a dramatic
decrease in the level of cathepsin-B was observed in
TSP1�/� RPE cells suggesting reduced lysosomal activity
in TSP1�/� RPE cells.
Alterations in the expression of VEGF andNOS isoforms in RPE cells
Alterations in the secretory activity of RPE cells are
associated with proliferative and degenerative diseases in
the retina (Strauss 2005). The increased production of
VEGF has been identified as essential factor in the devel-
opment and progression of AMD and CNV (Kliffen
et al. 1997; Yamagishi et al. 2003). Many studies have
A
B
Figure 8. Altered expression of ECM proteins in RPE cells. (A) WT, PEDF�/�, and TSP1�/� RPE cells were plated on gelatin-coated 60-mm
dishes and incubated for 48 h in serum-free growth medium. The conditioned medium and cell lysates were collected for analysis of ECM
proteins by Western as described in Material and Methods. The expression of fibronectin, collagen IV, tenascin C, TSP1, TSP2, PEDF, periostin,
and opticin were determined using specific antibodies. The b-actin was used as a loading control for cell lysates (lower panel). The quantitative
assessment of the data is shown in (B) (*P < 0.05, **P < 0.01, ****P < 0.0001; n = 3). These experiments were repeated with two different
isolations RPE cells with similar results. L: Cell lysate; CM: Conditioned medium.
2015 | Vol. 3 | Iss. 1 | e12266Page 16
ª 2015 The Authors. Physiological Reports published by Wiley Periodicals, Inc. on behalf of
the American Physiological Society and The Physiological Society.
PEDF, TSP1, and RPE Cell Function M. Farnoodian et al.

reported that RPE cells are the major source of VEGF
(Adamis et al. 1993; Kliffen et al. 1997; Nagineni et al.
2003). VEGF is considered a survival factor for many
cell types including RPE cells (Byeon et al. 2010). To
determine the impact of PEDF and TSP1 deficiency on
VEGF production, we measured VEGF levels in condi-
tioned medium prepared form PEDF�/� and TSP1�/�RPE cells. A significant decrease in VEGF level was
observed in PEDF�/� RPE cells compared to wild-type
cells. In contrast, TSP1�/� RPE cells showed increased
VEGF levels compared with wild-type cells (Fig. 10A).
Both PEDF and TSP1 levels are dramatically downregu-
lated in human’s exudative AMD samples. Thus, PEDF
and TSP1 deficiency have a significant impact on VEGF
production in RPE cells and pathogenesis of exudative
AMD.
Altered expression of NOS isoforms including reduc-
tion in nNOS in RPE nuclei has been reported in
AMD (Bhutto et al. 2010). We next examined the
expression of various NOS isoforms in PEDF �/� and
TSP1�/� RPE cells by Western blot analysis. NO
modulates the angiogenic response of various key
factors including VEGF (Papapetropoulos et al. 1997).
Additionally, NO production is essential for VEGF-med-
iated angiogenesis (McLaren et al. 2006). We observed
no significant difference in NO levels produced by RPE
cells (Fig. 10B).
We detected expression of the inducible NOS (iNOS)
in PEDF�/� RPE cells. Wild-type RPE cells exhibited
low level of endothelial NOS (eNOS) expression. While,
eNOS expression was undetectable in PEDF�/� and
TSP1�/� RPE cells (Fig. 10C). Wholemount staining of
RPE/choroid complex from wild-type, PEDF�/� and
TSP1�/� mice showed similar results (Fig. 10D). The
expression of nNOS was not detectable in RPE cells by
Western blot analysis.
A
B
C
Figure 9. Altered Phagocytic activity in PEDF�/� RPE cells. (A) RPE cells from 35-mm culture plates were loaded with DMEM medium
containing pHrodo TM Green E. coli BioParticles conjugates and incubated for different time points (5 and 24 h). Please note the increased
phagocytosis activity in PEDF�/� RPE cells compared to WT and TSP1�/� cells. (B) The in vitro proteasome peptidase activity of cultured RPE
cells. Chymotrypsin-like activity was not affected by PEDF and TSP1 deficiency. However, trypsin-like activity was significantly decreased in
PEDF�/� and TSP1�/� RPE cells (*P < 0.05, **P < 0.01, n = 3). Please also note a significant decrease in caspase-like activity in PEDF�/� RPE
cells, while TSP1�/� RPE cells exhibited increased caspase-like activity (*P < 0.05, **P < 0.01, n = 3). (C) Attenuation of cathepsin-B expression
in TSP1�/� RPE cells. Please note the dramatic decrease in the level of cathepsin-B in TSP1�/� RPE cells compared with WT and PEDF�/� RPE
cells. These experiments were repeated using three different isolations of RPE cells with similar results.
ª 2015 The Authors. Physiological Reports published by Wiley Periodicals, Inc. on behalf ofthe American Physiological Society and The Physiological Society.
2015 | Vol. 3 | Iss. 1 | e12266Page 17
M. Farnoodian et al. PEDF, TSP1, and RPE Cell Function
Capillary morphogenesis of choroidalendothelial cells
The progression of visual loss in the exudative AMD is
associated with abnormal CNV membranes that develop
under the retina. This results in leaking serous fluid and
blood, and ultimately a blinding disciform scar in and
under the retina (Ciulla et al. 1999). We showed that
PEDF and TSP1 deficiency differentially impact VEGF
secretion in RPE cells. We next determined the effects of
conditioned medium collected from PEDF�/� and
TSP1�/� RPE cells on capillary morphogenesis of
choroidal endothelial cells (ChEC) and ex vivo sprouting
of choroid-RPE complex. Endothelial cells undergo capil-
lary morphogenesis forming a capillary-like network when
plated on Matrigel. This mimics the late stages of angio-
genesis (Solowiej et al. 2003). ChEC were isolated and
cultured as previously described Lavine et al. (2013).
Here, we plated the ChEC, resuspended in CM prepared
from wild-type and, PEDF or TSP1 null RPE cells, on
Matrigel. Capillary morphogenesis of ChEC was analyzed
and quantified as described in Material and Methods.
Conditioned medium from PEDF�/� RPE cells decreased
capillary morphogenesis of ChEC compared with wild-
type cells, while CM from TSP1�/� RPE cells increased
capillary morphogenesis of ChEC (Fig. 11A and C). These
results are consistent with increased production of VEGF
by TSP1�/� RPE cells (Fig. 10A). Representative images
of capillary morphogenesis are shown in Fig. 11A. We
also assessed the ex vivo sprouting of the choroid-RPE
complex prepared from wild-type, TSP1�/�, and
PEDF�/� mice eyes. In contrast to enhanced capillary
morphogenesis of ChEC treated with TSP1�/� CM, we
observed no significant differences in degree of sprouting
A B
C
D
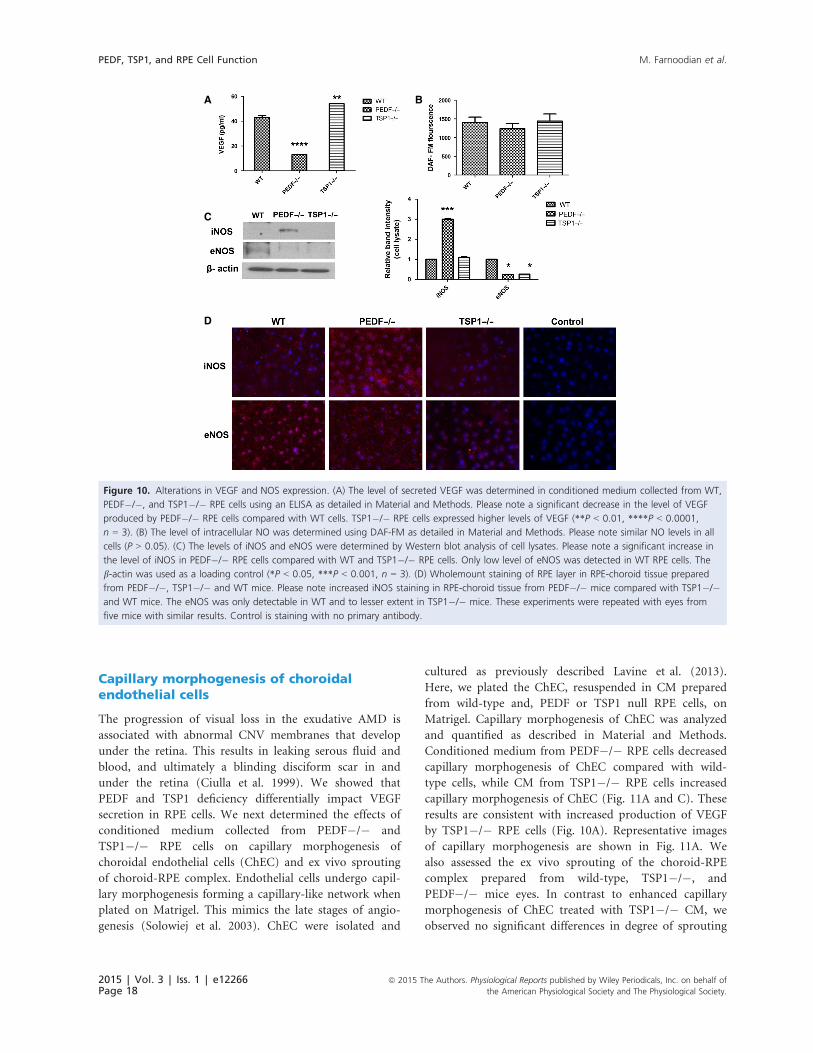
Figure 10. Alterations in VEGF and NOS expression. (A) The level of secreted VEGF was determined in conditioned medium collected from WT,
PEDF�/�, and TSP1�/� RPE cells using an ELISA as detailed in Material and Methods. Please note a significant decrease in the level of VEGF
produced by PEDF�/� RPE cells compared with WT cells. TSP1�/� RPE cells expressed higher levels of VEGF (**P < 0.01, ****P < 0.0001,
n = 3). (B) The level of intracellular NO was determined using DAF-FM as detailed in Material and Methods. Please note similar NO levels in all
cells (P > 0.05). (C) The levels of iNOS and eNOS were determined by Western blot analysis of cell lysates. Please note a significant increase in
the level of iNOS in PEDF�/� RPE cells compared with WT and TSP1�/� RPE cells. Only low level of eNOS was detected in WT RPE cells. The
b-actin was used as a loading control (*P < 0.05, ***P < 0.001, n = 3). (D) Wholemount staining of RPE layer in RPE-choroid tissue prepared
from PEDF�/�, TSP1�/� and WT mice. Please note increased iNOS staining in RPE-choroid tissue from PEDF�/� mice compared with TSP1�/�and WT mice. The eNOS was only detectable in WT and to lesser extent in TSP1�/� mice. These experiments were repeated with eyes from
five mice with similar results. Control is staining with no primary antibody.
2015 | Vol. 3 | Iss. 1 | e12266Page 18
ª 2015 The Authors. Physiological Reports published by Wiley Periodicals, Inc. on behalf of
the American Physiological Society and The Physiological Society.
PEDF, TSP1, and RPE Cell Function M. Farnoodian et al.

angiogenesis in TSP1�/� and PEDF�/� mice compared
to wild-type mice (Fig. 11B and D).
PEDF and TSP1 deficiency increased ROSgeneration in RPE cells
Most vascular diseases and their subsequent pathologies
are associated with alteration in the cellular oxidative
state. Oxidative stress acts as key initiator of inflamma-
tion, and is considered a major contributor to the
pathogenesis of AMD (Zhou T et al. 2010). Decreased
ability of RPE cells to cope with oxidative stress and
absence of oxidative defense can promote ocular neovas-
cularization and retinal degeneration (Dong et al. 2009).
Using dihydroethidium staining, we examined ROS pro-
duction at basal level and following incubation with
50 lmol/L H2O2. PEDF�/� and TSP1�/� RPE cells
demonstrated more fluorescent intensity compared with
wild-type cells indicating increased ROS production
under basal level or stress condition (Fig. 12A and B).
The quantitative assessments of the data are shown in
Fig. 12C and D. To further confirm our results, we
investigated whether PEDF�/� and TSP1�/� RPE cells
exhibit an increase in intracellular accumulation of ROS
in vivo. Using wholemount RPE/choroid complexes pre-
pared from wild-type, TSP1�/�, and PEDF�/� mice
the level of oxidative state was determined by 4-hydroxy-
nonenal (4-HNE) staining as described in Material and
A
B
E
C D
Figure 11. Increased oxidative stress in PEDF�/� and TSP1�/� RPE cells. The level of oxidative stress in RPE cells was assessed by
dihydroethidium (DHE) staining under basal (A) or challenged conditions (50 lmol/L H2O2) (B). A significant increase in the level of ROS was
detected under basal (C) and challenged (D) conditions in PEDF�/� and TSP1�/� RPE cells compared to WT cells (**P < 0.01, n = 3). (E)
Wholemount staining of RPE-choroid tissue prepared from PEDF�/�, TSP1�/� and WT mice with antibody to 4-hydroxy-2-nanonal (HNE).
Please note increased HNE staining in RPE-choroid tissues from PEDF�/� and TSP1�/� mice compared to Wild type mice. These experiments
were repeated using three different isolations of RPE cells, and eyes from five different mice with similar results.
ª 2015 The Authors. Physiological Reports published by Wiley Periodicals, Inc. on behalf ofthe American Physiological Society and The Physiological Society.
2015 | Vol. 3 | Iss. 1 | e12266Page 19
M. Farnoodian et al. PEDF, TSP1, and RPE Cell Function

Methods. The 4-HNE is a key reactive product of lipid
peroxidation, and indicator of oxidative stress (Yang
et al. 2003). The staining of RPE/choroid complex from
PEDF�/� and TSP1�/� mice exhibited increased 4-
HNE staining compared with wild type mice, indicating
increased oxidative stress in the absence of PEDF and
TSP1 (Fig. 12E). Our results demonstrated that PEDF
and TSP1 deficiency is associated with increased oxida-
tive stress in RPE cells. These results are consistent with
decreased levels of these proteins in eye samples from
AMD patients.
PEDF and TSP1 deficiency resulted inproduction of inflammatory mediators inRPE cells
Increased oxidative stress in PEDF�/� and TSP1�/�RPE cells suggested potential alteration in the inflamma-
tory response of these cells. We next examined the
expression of inflammatory mediators in PEDF�/� and
TSP1�/� RPE cells. Figure 13 shows a dramatic increase
in expression of monocyte chemotactic protein-1 (MCP-
1) in both TSP1�/� and PEDF�/� RPE cells compared
to the wild-type cells. PEDF�/� RPE cells exhibited a
dramatic increase in production of IL-18 compared with
TSP1�/� RPE and wild-type cells. Similar trend was
observed for TNF-a in PEDF�/� RPE cells, however it
was not significant. We also observed increased RANTES
production in TSP1�/� RPE cells compared to the
PEDF�/� RPE and wild-type cells. These results indi-
cated that the absence of PEDF and TSP1 is associated
with a distinct inflammatory phenotype of RPE cells. Our
results are consistent with previous studies establishing
that the inflammatory responses in the retina and RPE
play a crucial role in the development and progression of
AMD and is further supported by detection of decreased
levels of TSP1 and PEDF in patients with exudative
AMD.
A
B
C D
Figure 12. Alterations in capillary morphogenesis of choroidal EC-RPE cell co-cultures and RPE-choroidal explant sprouting. (A) Wild-type
mouse choroidal EC were cocultured with WT, PEDF�/� and TSP1�/� RPE cell on Matrigel, and capillary morphogenesis was monitored after
14 h. Photographs were taken in digital format. (B) Choroidal ex-vivo sprouting of P21 of wild type, PEDF�/� and TSP1�/� mice. Choroidal
explants were prepared and cultured as described in Material and Methods. Images shown here represent results obtained from three different
animals with desired genotype (940). (C) Quantification of the mean number of branch points from six high-power fields (940). Please note a
decrease in capillary morphogenesis of choroidal EC cultured with PEDF�/� cells compared with wild type cells. In contrast, choroidal EC
cocultured with TSP1�/� RPE cells demonstrated enhanced capillary morphogenesis compared to WT RPE cells (*P < 0.05; n = 3). (D)
Quantification of the mean area of sprouting from eight high-power fields (940) from each animal.
2015 | Vol. 3 | Iss. 1 | e12266Page 20
ª 2015 The Authors. Physiological Reports published by Wiley Periodicals, Inc. on behalf of
the American Physiological Society and The Physiological Society.
PEDF, TSP1, and RPE Cell Function M. Farnoodian et al.

The role of MAPK pathways in oxidative stress signal-
ing is controversial, with MAP kinases JNK and p38
shown to be protective, proapoptotic or not involved
(Klettner 2012). The ERK1/2 is considered to be involved
in cell proliferation and differentiation. However, it may
also contribute to an apoptotic response (Gilley et al.
2009). Increased ERK1/2 activation of RPE cell has been
demonstrated in the AMD patients with GA, and its inhi-
bition shown therapeutic benefit (Dridi et al. 2012).
TSP1�/� RPE cells demonstrated increased levels of p-
ERK1/2, and lower levels of total ERK1/2 compared to
PEDF�/� and wild-type cells. Thus, there is a potential
mechanism whereby decreased TSP1 expression may
result in increased ERK1/2 activation in RPE cell of AMD
patients. PEDF�/� and TSP1�/� RPE cells exhibited an
increase in p-JNK level compared with wild-type cells,
without affecting the total level of JNK (Fig. 14). The
level of p-p38 was increased in TSP1�/� RPE cells com-
pared with PEDF�/� and wild-type cells. We did not
observe any significant change in the total level of p38 in
all cells. Altered proliferation rate in PEDF�/� and
TSP1�/� suggested a potential change in AKT activation
and/or expression. AKT plays a key role in cell survival
and proliferation (Klettner 2012). Here, we observed
decreased AKT activation in TSP1�/� RPE cells com-
pared with PEDF�/� and wild-type cells. However,
increased expression of total AKT was detected in
PEDF�/� and TSP1�/� RPE cells (Fig. 14). Thus,
absence of PEDF and TSP1 were associated with altered
MAPK and AKT signaling pathways, which may contrib-
ute to the altered cellular functions observed in these
cells.
Discussion
The clinical and pathological signs of AMD, especially the
dry form or the geographic atrophy, are associated with
degeneration and loss of RPE cells. Although an impor-
tant role for RPE cell dysfunction has also been demon-
strated in exudative form of AMD, these roles may be
somewhat distinct and need further elucidation. RPE is a
monolayer of specialized epithelial cells which perform a
wide variety of functions to preserve retina. However, the
detailed mechanisms regulating RPE cell function remain
poorly understood. One major function of RPE cells is
the maintenance of ocular vascular homeostasis. This is
accomplished through a balanced production of pro- and
antiangiogenic factors including VEGF, PEDF, and TSP1.
However, how these factors impact RPE cell function are
poorly understood. Here we determined the impact of
PEDF and TSP1 deficiency on RPE cell function. Using
RPE cells prepared from PEDF�/� and TSP1�/� mice,
we showed that the PEDF or TSP1 deficiency resulted in
increased proliferation of RPE cells. These cells were also
more adherent and less migratory, exhibited increased
oxidative stress with minimal impact on basal levels of
A B
C D
Figure 13. Increased expression of inflammatory mediators in PEDF�/� and TSP1�/� RPE cells. The expression of various inflammatory
mediators (MCP-1, RANTES, TNF-a, IL-18) was assessed by quantitative real-time PCR using RNA from RPE cells as described in the Material and
Methods. Please note increased expression of inflammatory cytokines in PEDF�/� and TSP1�/� REP cells compared with wild-type cells
(*P < 0.05, **P < 0.01, n = 3). These experiments were repeated with three different isolations of RPE cells with similar results.
ª 2015 The Authors. Physiological Reports published by Wiley Periodicals, Inc. on behalf ofthe American Physiological Society and The Physiological Society.
2015 | Vol. 3 | Iss. 1 | e12266Page 21
M. Farnoodian et al. PEDF, TSP1, and RPE Cell Function
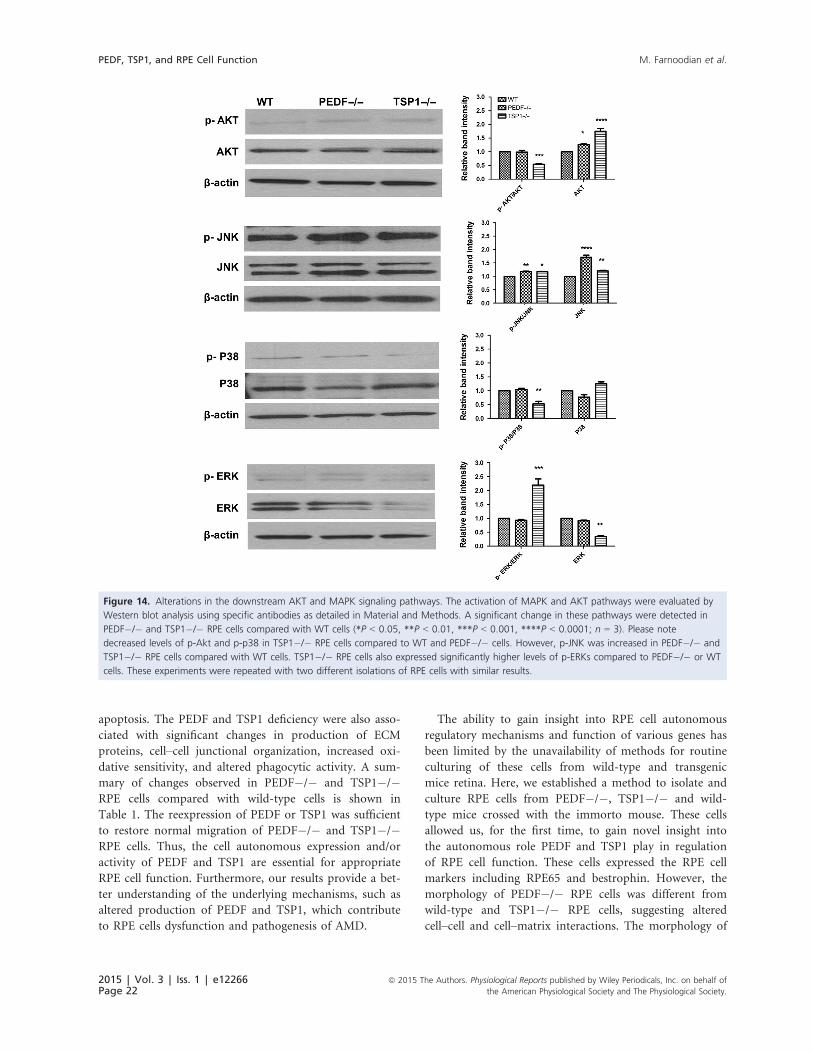
apoptosis. The PEDF and TSP1 deficiency were also asso-
ciated with significant changes in production of ECM
proteins, cell–cell junctional organization, increased oxi-
dative sensitivity, and altered phagocytic activity. A sum-
mary of changes observed in PEDF�/� and TSP1�/�RPE cells compared with wild-type cells is shown in
Table 1. The reexpression of PEDF or TSP1 was sufficient
to restore normal migration of PEDF�/� and TSP1�/�RPE cells. Thus, the cell autonomous expression and/or
activity of PEDF and TSP1 are essential for appropriate
RPE cell function. Furthermore, our results provide a bet-
ter understanding of the underlying mechanisms, such as
altered production of PEDF and TSP1, which contribute
to RPE cells dysfunction and pathogenesis of AMD.
The ability to gain insight into RPE cell autonomous
regulatory mechanisms and function of various genes has
been limited by the unavailability of methods for routine
culturing of these cells from wild-type and transgenic
mice retina. Here, we established a method to isolate and
culture RPE cells from PEDF�/�, TSP1�/� and wild-
type mice crossed with the immorto mouse. These cells
allowed us, for the first time, to gain novel insight into
the autonomous role PEDF and TSP1 play in regulation
of RPE cell function. These cells expressed the RPE cell
markers including RPE65 and bestrophin. However, the
morphology of PEDF�/� RPE cells was different from
wild-type and TSP1�/� RPE cells, suggesting altered
cell–cell and cell–matrix interactions. The morphology of
Figure 14. Alterations in the downstream AKT and MAPK signaling pathways. The activation of MAPK and AKT pathways were evaluated by
Western blot analysis using specific antibodies as detailed in Material and Methods. A significant change in these pathways were detected in
PEDF�/� and TSP1�/� RPE cells compared with WT cells (*P < 0.05, **P < 0.01, ***P < 0.001, ****P < 0.0001; n = 3). Please note
decreased levels of p-Akt and p-p38 in TSP1�/� RPE cells compared to WT and PEDF�/� cells. However, p-JNK was increased in PEDF�/� and
TSP1�/� RPE cells compared with WT cells. TSP1�/� RPE cells also expressed significantly higher levels of p-ERKs compared to PEDF�/� or WT
cells. These experiments were repeated with two different isolations of RPE cells with similar results.
2015 | Vol. 3 | Iss. 1 | e12266Page 22
ª 2015 The Authors. Physiological Reports published by Wiley Periodicals, Inc. on behalf of
the American Physiological Society and The Physiological Society.
PEDF, TSP1, and RPE Cell Function M. Farnoodian et al.

Table 1. A summary of PEDF and TSP1 deficiency effects on expression of RPE cell markers.
RPE cell
marker
WT PEDF�/� TSP1�/�
Potential marker functionExpression
Compared to
wild type
Compared
to wild type
RPE 65 + Similar1 Similar1 RPE cell specific marker
Bestrophin + Similar1 Similar1 RPE cell specific marker
VACM- 1 + Increased Decreased Migration and activation of RPE
VEGF-R1 + Increased Decreased VEGF receptor, angiogenesis
VEGF-R2 � � � VEGF receptor, angiogenesis
PDGF- Ra + Increased Highly increased Cell migration and proliferation
PDGF- Rb + Increased Highly increased Cell migration and proliferation
Endoglin � � � Not described
ICAM- 1 + � Decreased Inflammation
ICAM- 2 + very low � � Inflammation
CD36 + Similar1 Similar1 Phagocytosis
CD47 + Similar1 Decreased Phagocytosis, TSP1 receptor
MFG-E8 + Decreased Similar 1 Phagocytosis, inflammation
PDI + Increased Decreased Cell viability and protein folding
ZO-1 + Highly decreased Decreased Cell proliferation, polarity, and paracellular
diffusion and permeability
N-cadherin + Similar Increased Maintaining tissue integrity and normal
morphology, Wnt signaling pathway
b-catenin + Highly increased Increased Maintaining tissue integrity and normal morphology
P120- catenin + Increased Highly increased Maintaining tissue integrity and normal morphology
FAK + Increased Increased Focal adhesion, migration
Vinculin + Similar Increased Actin stress fibers, migration
a1 - Similar1 Similar1 Adhesion
a2 + Increased Decreased Adhesion
a3 + Decreased Similar1 Adhesion
a5 + Similar1 Similar 1 Adhesion
aV + Similar1 Similar 1 Adhesion
b1 + Similar1 Similar1 Adhesion
b3 + Similar 1 Similar 1 Adhesion
b5 + Similar 1 Similar1 Adhesion
b8 + very low Similar 1 Similar1 Adhesion
a5b1 + Similar1 Similar 1 Adhesion
aVb3 + Similar1 Similar1 Adhesion, phagocytosis
Fibronectin + Increased (CM, L) Increased (L), decreased (CM) Wound closure, inflammatory responses,
cell migration, and various developmental processes
Collagen IV + Decreased (CM, L) Decreased (CM, L) Wound closure, inflammatory responses,
cell migration, and various developmental processes
TSP1 + Decreased (CM, L) � Wound closure, inflammatory responses,
cell migration, and various developmental
processes and angiogenesis
TSP2 � � Increased (CM, L) Similar as TSP1
Tenascin C + Similar (L), increased (CM) Similar (L), increased (CM) Wound closure, inflammatory responses,
cell migration, and various developmental processes
PEDF + � Increased (CM) Similar as TSP1, antioxidant, Neuro-protective factor
Periostin + Increased (CM, L) Increased (L), similar (CM) Wound closure, inflammatory responses,
cell migration, and various developmental processes
Opticin + Decreased (L), similar (CM) Increased (L), similar (CM) Wound closure, inflammatory responses,
cell migration, and various developmental processes
Cathepsin-B + Similar Decreased Major lysosomal cysteine protease, lysosome activity
Total NOS + Similar Similar Modulation of angiogenic response
nNOS � � � Not described
iNOS + very low Increased � Modulation of angiogenic response, inflammation
eNOS + very low Decreased Decreased Modulation of angiogenic response
ª 2015 The Authors. Physiological Reports published by Wiley Periodicals, Inc. on behalf ofthe American Physiological Society and The Physiological Society.
2015 | Vol. 3 | Iss. 1 | e12266Page 23
M. Farnoodian et al. PEDF, TSP1, and RPE Cell Function

PEDF�/� RPE cells observed here were consistent with
those reported in RPE cells cultured in the absence of ret-
inoic acid. The incubation of RPE cells with retinoic acid
resulted in a more hexagonal and epitheloid morphology,
instead of an elongated and spindle-like fibroblast appear-
ance. This was mainly attributed to increased levels of
PEDF in RPE cells incubated with retinoic acid (Uchida
et al. 2005). In addition, the increased level of PEDF in
TSP1�/� RPE cells may be responsible, at least in part,
for their similar morphology to wild-type cells.
Although the junctional localization of cell adhesion
proteins was not dramatically affected in PEDF�/� and
TSP1�/� RPE cells, a significant decrease in the expres-
sion of ZO-1 was observed. The tight junctional protein
ZO-1 is critical for normal cell proliferation, differentia-
tion, and homeostasis of RPE cells. Consistent with our
results a marked disruption of the tight-junction-associ-
ated protein ZO-1 and abnormal RPE morphology has
been demonstrated in human AMD patients. Further-
more, the total level of b-catenin was also increased in
PEDF�/� RPE cells but not TSP1�/� RPE cells, which
have significant amounts of PEDF. This is consistent with
the proposed role of PEDF in inhibition of Wnt/b-cateninsignaling pathway (Park et al. 2011). The pathological
role of Wnt signaling pathway in AMD has been previ-
ously reported (Zhou T et al. 2010). Thus, lack of PEDF
may result in increased levels of b-catenin and sustained
activation of Wnt signaling pathway and development of
AMD. This may be compensated to some extent by
downregulation of TSP1 expression and increased PEDF
expression, as observed in TSP1�/� RPE cells. However,
the detailed regulatory mechanisms involved in coordi-
nated regulation of PEDF and TSP1 need further investi-
gation.
The N-cadherin level was increased in TSP1�/� RPE
cells. However, a significant increase in p120 catenin
was observed in both PEDF�/� and TSP1�/� cells.
Interestingly, the localization of N-cadherin to sites of
cell–cell contact was decreased in PEDF�/� RPE cells
consistent with their elongated spindly morphology and
sustained activation of Wnt signaling. The P120 catenin
plays an important role in formation of adherence
junctions, and its increased production may be a
compensatory feedback for defects in cellular adherens
and gap junctions. Thus, PEDF and TSP1 may have
significant impact on ZO-1 expression with potential
impact on its junctional localization, stability, and
barrier function.
The proliferation of RPE cells plays a major role in the
development of PVR (Pastor et al. 2002; Tamiya et al.
2010). Previous studies demonstrated that cell junctions
and junctional proteins have a significant role in the pro-
liferation of RPE cells. Loss of cell–cell contact contributesto RPE cell proliferation. In addition, downregulation of
ZO-1 is involved in induction of RPE cell proliferation
(Georgiadis et al. 2010; Tamiya et al. 2010). Here, we
observed a significant increase in proliferation of PEDF�/
� and TSP1�/� RPE cells. These results are consistent
with lack of appropriate N-cadherin junctional localiza-
tion and decreased ZO-1 expression in PEDF�/� and
TSP1�/� RPE cells. Furthermore, our results are sup-
ported by studies demonstrating that increased PEDF and
TSP1 expression in RPE cells incubated with retinoic acid
attenuates their proliferation (Ma et al. 2012; Du et al.
2013).
PEDF was initially identified as a contact inhibitor
factor, since its expression was induced when cells
reached confluence and stopped growing. PEDF as a tro-
phic factor may also contribute to attenuation of prolifer-
ation by decreasing the number of cells entering S phase
of the cell cycle and increasing the number of cells enter-
ing G0 (Barnstable and Tombran-Tink 2004). Thus,
PEDF may play a significant role in RPE cells prolifera-
tion. The impact of TSP1 on cell proliferation is cell spe-
cific which is derived from conformational flexibility of
TSP1 or different TSP1 receptors (Majack et al. 1986;
Adams and Lawler 2011). TSP1 acts as a negative regula-
tor of proliferation in endothelial cells and induces their
Table 1. Continued.
RPE cell
marker
WT PEDF�/� TSP1�/�
Potential marker functionExpression
Compared to
wild type
Compared
to wild type
VEGF + Decreased Increased Proangiogenic factor, angiogenesis
p-AKT/ AKT + Similar Decreased Cell survival and proliferation
p-JNK/ JNK + Increased Increased Protective, proapoptotic or not involved in apoptosis
p-P38/ P38 + Similar Decreased Protective, proapoptotic or not involved in apoptosis
p-ERK/ ERK + Similar Increased Cell proliferation and differentiation
1Not statistically significant.
2015 | Vol. 3 | Iss. 1 | e12266Page 24
ª 2015 The Authors. Physiological Reports published by Wiley Periodicals, Inc. on behalf of
the American Physiological Society and The Physiological Society.
PEDF, TSP1, and RPE Cell Function M. Farnoodian et al.

apoptosis (Tolsma et al. 1993). However, TSP1 expression
is essential for PDGF-mediated proliferation of perivascu-
lar supporting cells (Scheef et al. 2009). Here, we
observed increased proliferation in TSP1�/� RPE cells,
which was concomitant with increased levels of PDGF-
Rb. Thus, TSP1 expression may also negatively contribute
to RPE cell proliferation as occurs in endothelial cell,
involving CD36 and CD47 receptors, both of which were
expressed in RPE cells. Collectively, our results suggest
PEDF and TSP1 expression are involved in modulating
RPE cell–cell adhesion and proliferation, and their
absence resulted in altered adhesion and increased prolif-
eration.
Alteration in RPE cell migration contributes to some
pathological conditions including AMD, proliferative dia-
betic retinopathy (PDR), and PVR (Dong et al. 2009;
Chan et al. 2010). Here, we demonstrated that PEDF and
TSP1 deficiency resulted in more adhesive and less migra-
tory phenotype of RPE cells. Furthermore, reexpression of
PEDF and TSP1 in PEDF�/� and TSP1�/� RPE cells
was sufficient to restore RPE cell migration. These results
are contradictory to those reported by Ma et al. (Ma
et al. 2012) who showed increased PEDF expression as a
result of over expression of microphthalmia-associated
transcription factor or exogenous PEDF inhibited RPE
cell migration. These contradictory results may be attrib-
uted to the different levels of PEDF in these studies and
require further evaluation.
Cell migration is influenced by cell–ECM protein
interactions. Thus, the abrogated migratory features of
PEDF�/� and TSP1�/� RPE cells are consistent with
their enhanced adhesion. Although, lack of PEDF and
TSP1 was associated with minimal changes in expres-
sion of integrins, the possibility of alteration in avidity
and affinity of integrins, however, cannot be excluded
and requires further investigation. We detected altered
expression of ECM proteins in PEDF�/� and TSP1�/
� RPE cells, which may contribute to the altered
migratory and adhesive features of RPE cells with PEDF
and TSP1 deficiency. Taken together, these observations
suggest that PEDF and TSP1 play key roles in cell–celland cell–ECM interactions, which modulate proprolifer-
ative and promigratory signaling pathways of RPE cells.
Additionally, altered ECM composition of RPE cells
due to PEDF and TSP1 deficiency may result in
defective ocular angiogenesis such as abnormal CNV in
AMD.
VEGF is a proangiogenic factor with prosurvival activ-
ity and maintenance of RPE integrity (Ford et al. 2011).
The increased production of VEGF has been identified as
essential in the development and progression of AMD
and CNV. Here, we demonstrated that TSP1�/� cells
expressed significantly higher levels of VEGF while,
PEDF�/� cells produced significantly lower amounts of
VEGF compared to wild-type cells. The increased level of
VEGF in TSP1�/� RPE cells is consistent with the pro-
angiogenic state of the retinal vasculature in global TSP1
null retina (Hiscott et al. 1996a,b) and enhanced neovas-
cularization observed in mouse laser-induced CNV model
(Wang et al. 2012).This was mainly attributed to
increased recruitment of microglial cells to the site of
lesions, perhaps through enhanced inflammatory signaling
through the CCR5/RANTES (CCL5) axis in the absence
of TSP1 (Zhou T et al. 2010; Lavalette et al. 2011). This
notion is supported by observed increased production of
RANTES/CCL5 in TSP1�/� RPE cells compared to
PEDF�/� or wild-type mice. Furthermore, we have
observed no significant differences in degree of CNV in
PEDF�/� mice subjected to laser-induced CNV (our
unpublished results). The reason for significant decrease
in VEGF level in PEDF �/� RPE cells is not clear, and is
in contrast to reports that increased VEGF level is associ-
ated with increased oxidative stress and decreased level of
PEDF in diabetic ocular samples (Boehm et al. 2003).
These results are, however, consistent with our previous
findings where no association was observed between dia-
betic retinopathy where VEGF level is shown to be
increased without a major effect on PEDF levels (Wang
et al. 2009). Altogether our results demonstrate that
PEDF and TSP1 may share some common pathways in
regulation of RPE cell function, they may behave differ-
ently development and progression of AMD, perhaps as a
result of their different impact on VEGF production in
RPE cell.
In summary, consistent with previous studies (Adams
and Lawler 2004; Barnstable and Tombran-Tink 2004),
we demonstrated that PEDF and TSP1 play key roles in
RPE cell function and subsequently in pathogenesis of
AMD. We showed TSP1 and PEDF deficiency in RPE
cells resulted in their enhanced proliferation and reduced
migration. These changes were associated with alterations
in adhesion and production of various ECM proteins.
Significant changes in the expression and localization of
junctional proteins were also observed. The alterations
in MAPK and AKT signaling pathways were consistent
with abnormalities observed in adhesion, oxidative stress,
and sensitivity to oxidative challenge. Collectively, our
results imply that PEDF and TSP1 play a critical role in
regulation of the RPE cell proliferation and migration
through alterations of their inflammatory and oxidative
state.
Conflict of Interest
No conflict of interest, financial or otherwise, is declared
by the authors.
ª 2015 The Authors. Physiological Reports published by Wiley Periodicals, Inc. on behalf ofthe American Physiological Society and The Physiological Society.
2015 | Vol. 3 | Iss. 1 | e12266Page 25
M. Farnoodian et al. PEDF, TSP1, and RPE Cell Function

References
Adamis, A. P., D. T. Shima, K. T. Yeo, T. K. Yeo, L. F. Brown,
B. Berse, et al. 1993. Synthesis and secretion of vascular
permeability factor/vascular endothelial growth factor by
human retinal pigment epithelial cells. Biochem. Biophys.
Res. Commun. 193:631–638.
Adams, J. C., and J. Lawler. 2004. The thrombospondins. Int.
J. Biochem. Cell Biol. 36:961–968.
Adams, J. C., and J. Lawler. 2011. The thrombospondins. Cold
Spring Harb. Perspect. Biol. 3:a009712. doi: 10.1101/
cshperspect.a009712.
Aghdam, S. Y., Z. Gurel, A. Ghaffarieh, C. M. Sorenson, and
N. Sheibani. 2013. High glucose and diabetes modulate
cellular proteasome function: Implications in the
pathogenesis of diabetes complications. Biochem. Biophys.
Res. Commun. 432:339–344.
Al-Shabrawey, M., R. Mussell, K. Kahook, A. Tawfik, M. Eladl,
V. Sarthy, et al. 2011. Increased expression and activity of
12-lipoxygenase in oxygen-induced ischemic retinopathy
and proliferative diabetic retinopathy: implications in retinal
neovascularization. Diabetes 60:614–624.
Bailey, T. A., N. Kanuga, I. A. Romero, J. Greenwood,
P. J. Luthert, and M. E. Cheetham. 2004. Oxidative stress
affects the junctional integrity of retinal pigment epithelial
cells. Invest. Ophthalmol. Vis. Sci. 45:675–684.
Barnstable, C. J., and J. Tombran-Tink. 2004. Neuroprotective
and antiangiogenic actions of PEDF in the eye: molecular
targets and therapeutic potential. Prog. Retin. Eye Res.
23:561–577.
Bernard, A., J. Gao-Li, C.-A. Franco, T. Bouceba, A. Huet, and
Z. Li. 2009. Laminin receptor involvement in the
anti-angiogenic activity of pigment epithelium-derived
factor. J. Biol. Chem. 284:10480–10490.
Bhutto, I., and G. Lutty. 2012. Understanding age-related
macular degeneration (AMD): Relationships between the
photoreceptor/retinal pigment epithelium/Bruch’s
membrane/choriocapillaris complex. Mol. Aspects Med.
33:295–317.Bhutto, I. A., T. Baba, C. Merges, D. S. McLeod, and
G. A. Lutty. 2010. Low nitric oxide synthases (NOSs) in
eyes with age-related macular degeneration (AMD). Exp.
Eye Res. 90:155–167.Boehm, B. O. L. G., O. Volpert, P. M. Jehle, A. Kurkhaus,
S. Rosinger, G. K. Lang, et al. 2003. Low content of the
natural ocular anti-angiogenic agent pigment
epithelium-derived factor (PEDF) in aqueous humor
predicts progression of diabetic retinopathy. Diabetologia
4:394–400.Byeon, S. H., S. C. Lee, S. H. Choi, H.-K. Lee, J. H. Lee,
Y. K. Chu, et al. 2010. Vascular endothelial growth factor as
an autocrine survival factor for retinal pigment epithelial
cells under oxidative stress via the VEGF-R2/PI3K/Akt.
Invest. Ophthalmol. Vis. Sci. 51:1190–1197.
Campochiaro, P. A. 2000. Retinal and choroidal
neovascularization. J. Cell. Physiol. 184:301–310.
Chan, C. M., J. H. Huang, H. S. Chiang, W. B. Wu,
H. H. Lin, J. Y. Hong, et al. 2010. Effects of
(-)-epigallocatechin gallate on RPE cell migration and
adhesion. Mol. Vis. 3:586–595.Chen, H.-J., and Z.-Z. Ma. 2007. N-Cadherin expression in a
rat model of retinal detachment and reattachment. Invest.
Ophthalmol. Vis. Sci. 48:1832–1838.
Ciulla, T. A., R. P. Danis, M. Criswell, and L. M. Pratt. 1999.
Changing therapeutic paradigms for exudative age-related
macular degeneration: antiangiogenic agents and
photodynamic therapy. Expert Opin. Investig. Drugs
8:2173–2182.Deroide, N., X. Li, D. Lerouet, E. Van Vr�e, L. Baker,
J. Harrison, et al. 2013. MFGE8 inhibits
inflammasome-induced IL-1b production and limits
postischemic cerebral injury. J. Clin. Investig. 123:1176–1181.DiMaio, T. A., and N. Sheibani. 2008. PECAM-1
isoform-specific functions in PECAM-1-deficient brain
microvascular endothelial cells. Microvasc. Res. 75:188–201.
Dong, A., B. Xie, J. Shen, T. Yoshida, K. Yokoi, S. F. Hackett,
et al. 2009. Oxidative stress promotes ocular
neovascularization. J. Cell. Physiol. 219:544–552.Dridi, S., Y. Hirano, V. Tarallo, Y. Kim, B. J. Fowler,
B. K. Ambati, et al. 2012. ERK1/2 activation is a therapeutic
target in age-related macular degeneration. Proc. Natl Acad.
Sci. 109:13781–13786.Du, Y. H., K. Hirooka, O. Miyamoto, Y. Q. Bao, B. Zhang,
J. B. An, et al. 2013. Retinoic acid suppresses the adhesion
and migration of human retinal pigment epithelial cells.
Exp. Eye Res. 109:22–30.Duh, E. J., H. S. Yang, J. A. Haller, E. De Juan,
M. S. Humayun, P. Gehlbach, et al. 2004. Vitreous levels of
pigment epithelium-derived factor and vascular endothelial
growth factor: implications for ocular angiogenesis. Am.
J. Ophthalmol. 137:668–674.
Dunaief, J. D. T., G. Ying, A. Milam. 2002. The role of
apoptosis in age-related macular degeneration. Arch.
Ophthalmol. 120:1435–1442.
Finnemann, S. C., V. L. Bonilha, A. D. Marmorstein, and
E. Rodriguez-Boulan. 1997. Phagocytosis of rod outer
segments by retinal pigment epithelial cells requires avb5integrin for binding but not for internalization. Proc. Natl
Acad. Sci. 94:12932–12937.Ford, K. M., M. Saint-Geniez, T. Walshe, A. Zahr, and
P. A. D’Amore. 2011. Expression and role of VEGF in the
adult retinal pigment epithelium. Invest. Ophthalmol. Vis.
Sci. 52:9478–9487.Georgiadis, A., M. Tschernutter, J. W. B. Bainbridge,
K. S. Balaggan, F. Mowat, E. L. West, et al. 2010. The tight
junction associated signalling proteins ZO-1 and ZONAB
regulate retinal pigment epithelium homeostasis in mice.
PLoS One 5:e15730.
2015 | Vol. 3 | Iss. 1 | e12266Page 26
ª 2015 The Authors. Physiological Reports published by Wiley Periodicals, Inc. on behalf of
the American Physiological Society and The Physiological Society.
PEDF, TSP1, and RPE Cell Function M. Farnoodian et al.

Gilley, R., H. N. March, and S. J. Cook. 2009. ERK1/2, but not
ERK5, is necessary and sufficient for phosphorylation and
activation of c-Fos. Cell. Signal. 21:969–977.Hahm, E., J. Li, K. Kim, S. Huh, S. Rogelj, and J. Cho. 2013.
Extracellular protein disulfide isomerase regulates ligand-
binding activity of aMb2 integrin and neutrophil recruitment
during vascular inflammation. Blood 121:3789–3800.
He, S., F. Incardona, M. Jin, S. J. Ryan, and D. R. Hinton.
2006. Thrombospondin-1 expression in RPE and choroidal
neovascular membranes. Yan Ke Xue Bao 22:265–274.Hecquet, C. L. G., M. Valtink, K. Engelmann, and
F. Mascarelli. 2002. cAMP inhibits the proliferation of
retinal pigmented epithelial cells through the inhibition of
ERK1/2 in a PKA-independent manner. Oncogene 21:
6101–6112.
Hiscott, P., L. Sorokin, U. Schlotzer-Schrehardt, K. Bluthner,
K. Endress, and U. Mayer. 1996a. Expression of
thrombospondin 1 by adult lens epithelium. Exp. Eye Res.
62:709–712.
Hiscott, P., L. Sorokin, U. Schl€OTzer-Schrehardt,
K. Bl€UThner, K. Endress, and U. Mayer. 1996b. Letter to
the Editor: expression of thrombospondin 1 by adult lens
epithelium. Exp. Eye Res. 62:709–712.
Hua, J. G. N., B. Schulze, U. Michaelis, H. Bohnenkamp,
E. Guenzi, L. Hansen, et al. 2012. In vivo imaging of
choroidal angiogenesis using fluorescence-labeled cationic
liposomes. Mol. Vis. 18:1045–1054.
Kaida, M., F. Cao, C. M. B. Skumatz, P. E. Irving, and
J. M. Burke. 2000. Time at confluence for human RPE cells:
effects on the adherens junction and in vitro wound closure.
Invest. Ophthalmol. Vis. Sci. 41:3215–3224.
Karakousis, P. C. J. S., K. C. Behling, E. M. Surace, J. E. Smith,
A. Hendrickson, W. X. Tang, et al. 2001. Localization of
pigment epithelium derived factor (PEDF) in developing
and adult human ocular tissues. Mol. Vis. 7:154–163.
Kato, K., S. Ishiguro, H. Yamamoto, N. Yanai, M. Obinata,
and M. Tamai. 1996. A retinal pigment epithelium-derived
cell line from transgenic mouse harboring
temperature-sensitive simian virus 40 large T-antigen gene.
Cell Struct. Funct. 21:459–468.
Kevany, B. M., and K. Palczewski. 2010. Phagocytosis of
retinal rod and cone photoreceptors. Physiology (Bethesda,
Md) 25:8–15.Klettner, A. 2012. Oxidative stress induced cellular signaling in
RPE cells. Front. Biosci. (Schol. Ed.) 4:392–411.Kliffen, M., H. S. Sharma, C. M. Mooy, S. Kerkvliet, and
P. T. V. M. de Jong. 1997. Increased expression of
angiogenic growth factors in age-related maculopathy. Br.
J. Ophthalmol. 81:154–162.Kobayashi, S., M. Fukuta, H. Kontani, S. Yanagita, and
I. Kimura. 1998. A quantitative assay for angiogenesis of
cultured choroidal tissues in streptozotocin-diabetic Wistar
and spontaneously diabetic GK rats. Jpn. J. Pharmacol.
78:471–478.
Korte, G. E., V. Reppucci, and P. Henkind. 1984. RPE
destruction causes choriocapillary atrophy. Invest.
Ophthalmol. Vis. Sci. 25:1135–1145.Lavalette, S. R. W., M. Houssier, S. Camelo, O. Levy,
B. Calippe, L. Jonet, et al. 2011. Interleukin-1b inhibition
prevents choroidal neovascularization and does not
exacerbate photoreceptor degeneration. Am. J. Pathol.
178:2416–2423.Lavine, J. A., Y. Sang, S. Wang, M. S. Ip, and N. Sheibani.
2013. Attenuation of choroidal neovascularization by
beta2-adrenoreceptor antagonism. JAMA Ophthalmol.
131:376–382.Lawler, J., M. Sunday, V. Thibert, M. Duquette,
E. L. George, H. Rayburn, et al. 1998. Thrombospondin-1 is
required for normal murine pulmonary homeostasis and its
absence causes pneumonia. J. Clin. Invest. 101:982–992.Ma, X., L. Pan, X. Jin, X. Dai, H. Li, B. Wen, et al. 2012.
Microphthalmia-associated transcription factor acts through
PEDF to regulate RPE cell migration. Exp. Cell Res.
318:251–261.Machali�nska, A. S. K., K. Mozolewska-Piotrowska,
V. Dziedziejko, and D. Karczewicz. 2012. PEDF and VEGF
plasma level alterations in patients with dry form of
age-related degeneration–a possible link to the development
of the disease. Klin. Oczna 114:115–120.
Majack, R. A., S. C. Cook, and P. Bornstein. 1986. Control of
smooth muscle cell growth by components of the
extracellular matrix: autocrine role for thrombospondin.
Proc. Natl Acad. Sci. 83:9050–9054.
Martin, P. M., S. Ananth, G. Cresci, P. Roon, S. Smith, and
V. Ganapathy. 2009. Expression and localization of
GPR109A (PUMA-G/HM74A) mRNA and protein in
mammalian retinal pigment epithelium. Mol. Vis. 15:
362–372.Mascarelli, F. H. C., X. Guillonneau, and Y. Courtois. 2001.
Control of the intracellular signaling induced by fibroblast
growth factors (FGF) over the proliferation and survival of
retinal pigment epithelium cells: example of the signaling
regulation of growth factors endogenous to the retina.
J. Soc. Biol. 195:101–106.
Masli, S., N. Sheibani, C. Cursiefen, and J. Zieske. 2014.
Matricellular protein thrombospondins: influence on ocular
angiogenesis, wound healing and immuneregulation. Curr.
Eye Res. 39:759–774.
McLaren, A. T., P. A. Marsden, C. D. Mazer, A. J. Baker,
D. J. Stewart, A. K. Y. Tsui, et al. 2006. Increased expression
of HIF-1a, nNOS, and VEGF in the cerebral cortex of
anemic rats. Am. J. Physiol. Regul. Integr. Comp. Physiol.
292:R403–R414.Mochizuki, M., S. Sugita, and K. Kamoi. 2013. Immunological
homeostasis of the eye. Prog. Retin. Eye Res. 33:10–27.Mustafi, D., B. M. Kevany, C. Genoud, X. Bai, and K.
Palczewski. 2013. Photoreceptor phagocytosis is mediated by
phosphoinositide signaling. FASEB J. 27:4585–4595.
ª 2015 The Authors. Physiological Reports published by Wiley Periodicals, Inc. on behalf ofthe American Physiological Society and The Physiological Society.
2015 | Vol. 3 | Iss. 1 | e12266Page 27
M. Farnoodian et al. PEDF, TSP1, and RPE Cell Function

Nagineni, C. N., W. Samuel, S. Nagineni, K. Pardhasaradhi,
B. Wiggert, B. Detrick, et al. 2003. Transforming growth
factor-b induces expression of vascular endothelial growth
factor in human retinal pigment epithelial cells: Involvement
of mitogen-activated protein kinases. J. Cell. Physiol.
197:453–462.Nandrot, E. F., M. Anand, D. Almeida, K. Atabai,
D. Sheppard, and S. C. Finnemann. 2007. Essential role for
MFG-E8 as ligand for avb5 integrin in diurnal retinal
phagocytosis. Proc. Natl Acad. Sci. 104:12005–12010.Papapetropoulos, A., G. Garc�ıa-Carde~na, J. A. Madri, and
W. C. Sessa. 1997. Nitric oxide production contributes to
the angiogenic properties of vascular endothelial growth
factor in human endothelial cells. J. Clin. Investig.
100:3131–3139.
Park, S., T. A. DiMaio, E. A. Scheef, C. M. Sorenson, and
N. Sheibani. 2010. PECAM-1 regulates proangiogenic
properties of endothelial cells through modulation of
cell-cell and cell-matrix interactions. Am. J. Physiol. Cell
Physiol. 299:C1468–C1484.Park, K., K. Lee, B. Zhang, T. Zhou, X. He, G. Gao, et al.
2011. Identification of a novel inhibitor of the canonical
Wnt pathway. Mol. Cell. Biol. 31:3038–3051.
Pastor, J. C., E. R. G. de la R�ua, and F. Martı́n. 2002.
Proliferative vitreoretinopathy: risk factors and
pathobiology. Prog. Retin. Eye Res. 21:127–144.Rizzolo, L. J., S. Peng, Y. Luo, and W. Xiao. 2011. Integration
of tight junctions and claudins with the barrier functions of
the retinal pigment epithelium. Prog. Retin. Eye Res.
30:296–323.Saika, S., T. Miyamoto, I. Ishida, W. K. Barbour, Y. Ohnishi,
and A. Ooshima. 2004. Accumulation of thrombospondin-1
in post-operative capsular fibrosis and its down-regulation
in lens cells during lens fiber formation. Exp. Eye Res.
79:147–156.
Scheef, E. A., C. M. Sorenson, and N. Sheibani. 2009.
Attenuation of proliferation and migration of retinal
pericytes in the absence of thrombospondin-1. Am.
J. Physiol. Cell Physiol. 296:C724–C734.Schlingemann, R. O. 2004. Role of growth factors and the
wound healing response in age-related macular degeneration.
Graefes Arch. Clin. Exp. Ophthalmol. 242:91–101.
Sheibani, N., and W. A. Frazier. 1999. Thrombospondin-1,
PECAM-1, and regulation of angiogenesis. Histol.
Histopathol. 14:285–294.Sheibani, N., C. M. Sorenson, L. A. Cornelius, and
W. A. Frazier. 2000. Thrombospondin-1, a natural inhibitor
of angiogenesis, is present in vitreous and aqueous humor
and is modulated by hyperglycemia. Biochem. Biophys. Res.
Commun. 267:257–261.
Solowiej, A. B. P., D. Graesser, and J. A. Madri. 2003. Lack of
platelet endothelial cell adhesion molecule-1 attenuates
foreign body inflammation because of decreased
angiogenesis. Am. J. Pathol. 162:953–962.
Sorenson, C. M., S. Wang, R. Genderon, H. Paradis, and
N. Sheibani. 2013. Thrombospondin-1 deficiency
exacerbates the pathogenesos of diabetic retinopathy.
J. Diabetes Metab. S12:005. doi:10.4172/2155-6156.S12-005.
Sparrow, J. R., D. Hicks, and C. P. Hamel. 2010. The retinal
pigment epithelium in health and disease. Curr. Mol. Med.
10:802–823.
Strauss, O. 2005. The retinal pigment epithelium in visual
function. Physiol. Rev. 85:845–881.
Su, X., C. M. Sorenson, and N. Sheibani. 2003. Isolation and
characterization of murine retinal endothelial cells. Mol. Vis.
9:171–178.Suraweera, A., C. Munch, A. Hanssum, and A. Bertolotti.
2012. Failure of amino acid homeostasis causes cell death
following proteasome inhibition. Mol. Cell 48:242–253.
Tamiya, S., L. Liu, and H. J. Kaplan. 2010.
Epithelial-mesenchymal transition and proliferation of
retinal pigment epithelial cells initiated upon loss of cell-cell
contact. Invest. Ophthalmol. Vis. Sci. 51:2755–2763.
Tolsma, S. S., O. V. Volpert, D. J. Good, W. A. Frazier,
P. J. Polverini, and N. Bouck. 1993. Peptides derived from
two separate domains of the matrix protein
thrombospondin-1 have anti-angiogenic activity. J. Cell Biol.
122:497–511.Uchida, H., H. Hayashi, M. Kuroki, K. Uno, H. Yamada,
Y. Yamashita, et al. 2005. Vitamin A up-regulates the expression
of thrombospondin-1 and pigment epithelium-derived factor in
retinal pigment epithelial cells. Exp. Eye Res. 80:23–30.Uno, K., I. A. Bhutto, D. S. McLeod, C. Merges, and
G. A. Lutty. 2006. Impaired expression of
thrombospondin-1 in eyes with age related macular
degeneration. Br. J. Ophthalmol. 90:48–54.Wang, S., Z. Wu, C. M. Sorenson, J. Lawler, and N. Sheibani.
2003. Thrombospondin-1-deficient mice exhibit increased
vascular density during retinal vascular development and are
less sensitive to hyperoxia-mediated vessel obliteration. Dev.
Dyn. 228:630–642.
Wang, S., J. L. Gottlieb, C. M. Sorenson, and N. Sheibani.
2009. Modulation of thrombospondin 1 and pigment
epithelium–derived factor levels in vitreous fluid of patients
with diabetes. Arch. Ophthalmol. 127:507–513.Wang, S., C. M. Sorenson, and N. Sheibani. 2012. Lack of
thrombospondin 1 and exacerbation of choroidal
neovascularization. Arch. Ophthalmol. 130:615–620.
Yamagishi, S.-I., S. Amano, Y. Inagaki, T. Okamoto,
M. Takeuchi, and H. Inoue. 2003. Pigment
epithelium-derived factor inhibits leptin-induced
angiogenesis by suppressing vascular endothelial growth
factor gene expression through anti-oxidative properties.
Microvasc. Res. 65:186–190.
Yang, Y. S. R., A. Sharma, S. Awasthi, and Y. C. Awasthi.
2003. Lipid peroxidation and cell cycle signaling:
4-hydroxynonenal, a key molecule in stress mediated
signaling. Acta Biochim. Pol. 50:319–336.
2015 | Vol. 3 | Iss. 1 | e12266Page 28
ª 2015 The Authors. Physiological Reports published by Wiley Periodicals, Inc. on behalf of
the American Physiological Society and The Physiological Society.
PEDF, TSP1, and RPE Cell Function M. Farnoodian et al.

Yang, P., J. J. Peairs, R. Tano, and G. J. Jaffe. 2006a.
Oxidant-mediated Akt activation in human RPE cells.
Invest. Ophthalmol. Vis. Sci. 47:4598–4606.Yang, P., J. J. Peairs, R. Tano, and G. J. Jaffe. 2006b.
Oxidant-mediated Akt Activation in Human RPE Cells.
Invest. Ophthalmol. Vis. Sci. 47:4598–4606.Yokoyama, T., K. Yamane, A. Minamoto, H. Tsukamoto,
H. Yamashita, S. Izumi, et al. 2006. High glucose
concentration induces elevated expression of anti-oxidant
and proteolytic enzymes in cultured human retinal pigment
epithelial cells. Exp. Eye Res. 83:602–609.Zhou T, Y. H., Y. Chen, K. K. Zhou, B. Zhang, G. Gao, and
J.-X. Ma. 2010. The pathogenic role of the canonical Wnt
pathway in age-related macular degeneration. Invest.
Ophthalmol. Vis. Sci. 51:4371–4379.
ª 2015 The Authors. Physiological Reports published by Wiley Periodicals, Inc. on behalf ofthe American Physiological Society and The Physiological Society.
2015 | Vol. 3 | Iss. 1 | e12266Page 29
M. Farnoodian et al. PEDF, TSP1, and RPE Cell Function


![Mertk gene expression and photoreceptor outer segment ...Photoreceptor outer segment (POS) phagocytosis is a key function of RPE cells in supporting photoreceptors [1]. Defects in](https://static.fdocuments.us/doc/165x107/60425be6a281f837d17c8a88/mertk-gene-expression-and-photoreceptor-outer-segment-photoreceptor-outer-segment.jpg)