EXPRESSION OF LIPOLYTIC GENES IN ADIPOSE … · EXPRESSION OF LIPOLYTIC GENES IN ADIPOSE TISSUE IS...
22
1 EXPRESSION OF LIPOLYTIC GENES IN ADIPOSE TISSUE IS DIFFERENTIALLY REGULATED DURING MULTIPLE PHASES OF DIETARY INTERVENTION IN OBESE WOMEN K KOPPO a,b , C VALLE c,d , M SIKLOVÁ-VITKOVÁ a,c , E CZUDKOVA a , I DE GLISEZINSKI c,d,e , J VAN DE VOORDE b , D LANGIN c,d,f , V STICH a,c . a Department of Sports Medicine, Third Faculty of Medicine, Charles University, Prague, Czech Republic b Department of Pharmacology, Faculty of Medicine and Health Sciences, Ghent University, Ghent, Belgium c Franco-Czech laboratory of Clinical Research on Obesity, INSERM and Third Faculty of Medicine of the Charles University, Prague, Czech Republic d Laboratoire de recherches sur les Obésités, Institut des Maladies Métaboliques et Cardiovasculaires (I2MC), UMR 1048 Inserm, Université Paul Sabatier, Toulouse, France e Department of Sports Medicine, CHU Toulouse, France f Department of Clinical Biochemistry, CHU Toulouse, France Short title: Diet-induced changes in mRNA levels in obese Correspondence: Katrien Koppo Department of Sports Medicine Third Faculty of Medicine Charles University of Prague Ruska 87 100 00 Prague 10 Czech Republic Tel : +420 267 102 324 Fax : +420 267 102 263 E-mail : [email protected]
Transcript of EXPRESSION OF LIPOLYTIC GENES IN ADIPOSE … · EXPRESSION OF LIPOLYTIC GENES IN ADIPOSE TISSUE IS...
1
EXPRESSION OF LIPOLYTIC GENES IN ADIPOSE TISSUE IS DIFFERENTIALLY
REGULATED DURING MULTIPLE PHASES OF DIETARY INTERVENTION IN
OBESE WOMEN
K KOPPOa,b
, C VALLEc,d
, M SIKLOVÁ-VITKOVÁa,c
, E CZUDKOVAa, I DE
GLISEZINSKIc,d,e
, J VAN DE VOORDEb, D LANGIN
c,d,f, V STICH
a,c.
a Department of Sports Medicine, Third Faculty of Medicine, Charles University, Prague,
Czech Republic
b Department of Pharmacology, Faculty of Medicine and Health Sciences, Ghent University,
Ghent, Belgium
c Franco-Czech laboratory of Clinical Research on Obesity, INSERM and Third Faculty of
Medicine of the Charles University, Prague, Czech Republic
d Laboratoire de recherches sur les Obésités, Institut des Maladies Métaboliques et
Cardiovasculaires (I2MC), UMR 1048 Inserm, Université Paul Sabatier, Toulouse, France
e Department of Sports Medicine, CHU Toulouse, France
f Department of Clinical Biochemistry, CHU Toulouse, France
Short title: Diet-induced changes in mRNA levels in obese
Correspondence:
Katrien Koppo
Department of Sports Medicine
Third Faculty of Medicine
Charles University of Prague
Ruska 87
100 00 Prague 10
Czech Republic
Tel : +420 267 102 324
Fax : +420 267 102 263
E-mail : [email protected]
physres
razítko do pre-press

2
Summary
The aim of this study was to investigate the time-course of the expression of key lipolysis-
regulating genes in the subcutaneous adipose tissue (SCAT) during different phases of a 6-
month dietary intervention. Fifteen obese women (BMI 34.7 ± 1.0 kg.m
-2) underwent a 6-
month dietary intervention consisting of 1 month very low calorie diet (VLCD), followed by 2
months low calorie diet (LCD) and 3 months weight maintenance diet (WM). At each phase
of the dietary intervention, a needle microbiopsy of the abdominal SCAT was obtained to
evaluate mRNA expression of key lipolysis-regulating genes and a hyperinsulinemic
euglycemic clamp (HEC) was performed. Dietary intervention induced a body weight
reduction of 9.8% and an improvement of insulin sensitivity as assessed by a HEC. Compared
to pre-diet levels, mRNA levels of the adrenergic 2-receptor in SCAT were higher at the end
of VLCD and not different at the end of LCD and WM. In contrast, the expression of the
adrenergic 2-receptor was lower at the end of VLCD and LCD compared to the pre-diet
levels and did not differ at WM. Adipose triglyceride lipase and hormone-sensitive lipase
levels were lower than the pre-diet levels at the end of LCD only, while phosphodiesterase-3B
and the insulin receptor levels did not change throughout the dietary intervention. The results
suggest that the regulation pattern of the genes that are involved in the control of lipolysis is
different at the respective phases of the dietary intervention and depends on the duration of
the diet and the status of energy balance.
Key words: insulin, adipocytes, hypocaloric diet

3
Introduction
Traditional weight-reducing hypocaloric diets as well as bariatric surgery interventions lead to
an improvement in metabolic status of obese subjects already during the early stages of the
intervention. It has been suggested that the early improvement in metabolic status is
associated with calorie restriction per se - eventually combined with a mild initial weight loss
- while the later beneficial metabolic effects are linked to sustained weight loss only (Gumbs
et al. 2005, Hensrud 2001). Adipose tissue lipolysis has been suggested as one of the
candidate mechanisms underlying the obesity-related metabolic disturbances, namely insulin
resistance (Reynisdottir et al. 1994a, Reynisdottir et al. 1994b). Moreover, impaired
catecholamine-mediated lipolysis was demonstrated in first-degree relatives of obese subjects
(Hellström et al. 1996a) which suggests an association between blunted catecholamine-
induced lipolysis and excessive accumulation of body fat.
Therefore, in the present study we aimed to follow the evolution of whole-body insulin
sensitivity and the evolution of expression of genes involved in lipolysis regulation in adipose
tissue (AT) during a dietary intervention (DI) which consisted of multiple phases. The first
phase of the diet consisted of one month severe calorie restriction using a very low calorie
diet (VLCD) of 3000 kJ/d. The subsequent phase consisted of 2 months low calorie diet
(LCD) with a calorie intake of 5000-6000 kJ, followed by a 3 month weight maintenance diet
(WM). This model provides an opportunity to study the “lipolysis - metabolic status - energy
status” relationship.
Previous studies that reported mRNA data of genes involved in lipolysis regulation in AT
during dietary interventions yielded various results, possibly related to differences in duration

4
and severity of the diet as well as to the characteristics of the study populations. For example,
the mRNA and protein levels of hormone-sensitive lipase (HSL) in subcutaneous AT (SCAT)
of obese subjects were reduced after 8-12 weeks of diet (Jocken et al. 2007, Reynisdottir et al.
1995), while no differences or an increase in the HSL protein level were reported for dietary
interventions with a shorter duration (4 weeks of VLCD) (Hellström et al. 1996b, Stich et al.
1997). Capel et al. (2009) showed that the regulation of adipocyte and macrophage genes
during a multi-phase diet was dependent on the phase of the diet, namely the metabolism-
related genes predominantly expressed in adipocytes were downregulated during energy
restriction and upregulated during weight stabilization, while the genes related to immune
functions that were predominantly expressed in macrophages were not changed or
upregulated during energy restriction and downregulated during weight stabilization. Similar
results were demonstrated regarding the regulation of lipolysis in situ: in obese women it was
shown that the responsiveness of SCAT to adrenergic regulation of lipolysis varied during the
respective phases of the diet (Koppo et al. 2012).
In the present study, we explored the lipolysis regulation at the transcriptional level and
measured mRNA expression of key lipolytic genes in needle biopsy-derived samples of
SCAT in a group of obese women that followed the above mentioned multiple-phase dietary
intervention. In each individual, the SCAT samples were obtained at baseline and at the end
of each dietary phase. At each phase of the diet, the whole-body insulin sensititivity was
measured using a hyperinsulinemic euglycemic clamp. We demonstrated that the lipolysis is
regulated at the transcriptional level during a multiple-phase dietary intervention and that the
regulation during the early phase of the diet differs from that during the later periods. No
straightforward relationship between the evolution of gene expression and that of insulin
sensitivity was found.

5
Methods
Subjects.
Fifteen obese premenopausal women were recruited for the study (Table 1). They all had a
stable weight during the 3 months that preceded the study. Exclusion criteria were
hypertension, diabetes, hyperlipidemia treated by drugs, drug-treated obesity, drug or alcohol
abuse, pregnancy or participation in other studies. All subjects were fully informed about the
aim and the protocol of the study and signed an informed consent approved by the Ethics
committee of the Third Faculty of Medicine of the Charles University (Prague, Czech
Republic).
Dietary intervention.
During the first month of the dietary intervention program, subjects received an 3000 kJ/d
VLCD (liquid formula diet; Redita, Promil, Czech Republic). During the next 2 months, a
LCD was designed to provide 2500 kJ/d less than the individually estimated energy
requirement based on an initial resting metabolic rate multiplied by 1.3 (the coefficient of
correction for physical activity level; Toubro et al 1996.). The final 3 months consisted of a
WM diet during which subjects kept a stable weight. Subjects consulted a dietician once a
week during the first 3 months and once a month during the WM phase. They provided a
written 3-days dietary record at each consultation. Subjects were instructed not to change the
level of their leisure time physical activity during the intervention. This was monitored by
self-reported questionnaires.

6
Experimental protocol.
On 4 occasions (i.e. before the start of the dietary intervention (baseline) and at the end of the
VLCD, LCD and WM phase, respectively) subjects entered the laboratory at 8.00 a.m. after
an overnight fast. A complete clinical investigation was performed, anthropometric
parameters were measured and body composition was determined with multifrequency
bioimpedance (Bodystat QuadScan 4000; Bodystat Ltd., Isle of Man, British Isles).
Subsequently, subjects were placed in a semi-recumbent position. Venous blood samples were
taken from an antecubital vein in order to determine the blood parameters related to lipid and
carbohydrate metabolism. A needle microbiopsy of the abdominal SCAT (14-20 cm lateral to
the umbilicus) was performed under local anesthesia (1% Xylocaine; AstraZeneca PLC,
London, UK) as previously described (Klimcakova et al. 2006) to evaluate mRNA of key
genes that are involved in SCAT lipolysis regulation. The samples were frozen immediately
in liquid nitrogen and stored at -80°C until analysis. Finally, a 3-h hyperinsulinemic
euglycemic clamp (HEC) was performed to determine the glucose disposal rate.
Hyperinsulinemic euglycemic clamp.
HEC was performed according to the DeFronzo method (DeFronzo et al. 1979). Priming plus
continuous infusion of crystalline human insulin (Actrapid Human; Novo, Bagsvaerd,
Denmark), 40 mU/m2 body area
.min, was given for 180 min. Euglycemia (the fasting blood
glucose concentration) was maintained by a variable 20% glucose infusion. The infusion rate
was determined by measuring arterialized plasma glucose every 5 min (Beckman Glucose
Analyzer; Beckman Coulter Inc., Fullerton, CA, USA).
Quantification of mRNA analysis.

7
Total RNA was extracted from the adipose tissue biopsy samples with an RNeasy Mini kit
(Qiagen, Valencia, CA) and reverse transcribed using random hexamers (Promega Corp.,
Madison, WI) and SuperScript II Reverse Transcriptase (Invitrogen Corp., Carlsbad, CA).
Real-time quantitative PCR was performed with TaqMan probe-based gene expression assays
(Applied Biosystems, Foster City, CA). An 18S ribosomal RNA was used as control to
normalize gene expression (Ribosomal RNA Control TaqMan Assay kit; Applied
Biosystems). Each sample was performed in duplicate and 10 ng cDNA was used as a
template for real-time PCR. The relative expression was calculated using the Ct method
(Livak and Schmittgen 2001).
Drugs and biochemical determinations.
Plasma glucose was determined with a glucose hexokinase technique (Konelab 60i,
Labsystems CLD, Konelab, Finland). Plasma insulin concentrations were measured using a
chemiluminescent immunometric assay (Immulite 2000 Insulin, DPC Czech sro, Brno, Czech
Republic). Other laboratory analyses (lipids) were performed using standard biochemical
laboratory methods.
Statistical Analysis.
All values are presented as means ± SEM. Statistical evaluation of the data was performed
using ANOVA for repeated measures with an LSD post-hoc test (SPSS statistical software,
version 19, SPSS Inc, Chicago). Correlations between mRNA gene expression and the diet-
induced change in body fat mass were examined with the Pearson correlation coefficient.
Significance was determined at P < 0.05.

8
Results
Anthropometric and plasma parameters of subjects during the different phases of the diet
Pre-diet values and values measured at different phases during the weight reduction program
(i.e. at the end of VLCD, LCD and WM) are reported in Table 1. Subjects’ body weight
progressively decreased during VLCD and LCD and stabilized during WM. The loss in body
weight was mainly due to a decrease in fat mass. Plasma triglycerides were significantly
lower at the end of VLCD, LCD and WM compared to the pre-diet values. Similarly, baseline
insulin levels were significantly lower at the end of VLCD, LCD and WM (Table 1). The
glucose disposal rate (GDR) normalized to body weight significantly increased at the end of
VLCD and the increase was maintained at the end of LCD and WM (Table 1).
Effect of the dietary intervention on gene expression.
SCAT mRNA levels of key genes involved in adipose tissue lipolysis regulation, i.e. the
adrenergic 2-receptor (ADRB2), adrenergic 2A-receptor (ADRA2A), adipose triglyceride
lipase (ATGL), hormone-sensitive lipase (HSL), phosphodiesterase-3B (PDE3B) and insulin
receptor (INSR), were quantified (Table 2). ADRB2 expression significantly increased at the
end of VLCD when compared with the pre-diet baseline level and then, at the end of LCD and
WM, returned to the pre-diet baseline levels. The expression of ADRA2A was significantly
lower at the end of VLCD and LCD compared to the pre-diet baseline and increased back
towards the pre-diet levels during WM. Expression of PDE3B and INSR did not significantly
change throughout the intervention. The diet-induced adaptation of HSL and ATGL was
similar: mRNA levels of the two lipases were significantly lower at the end of LCD compared
with pre-diet levels and returned to the pre-diet levels at the end of WM. At the end of VLCD,
9
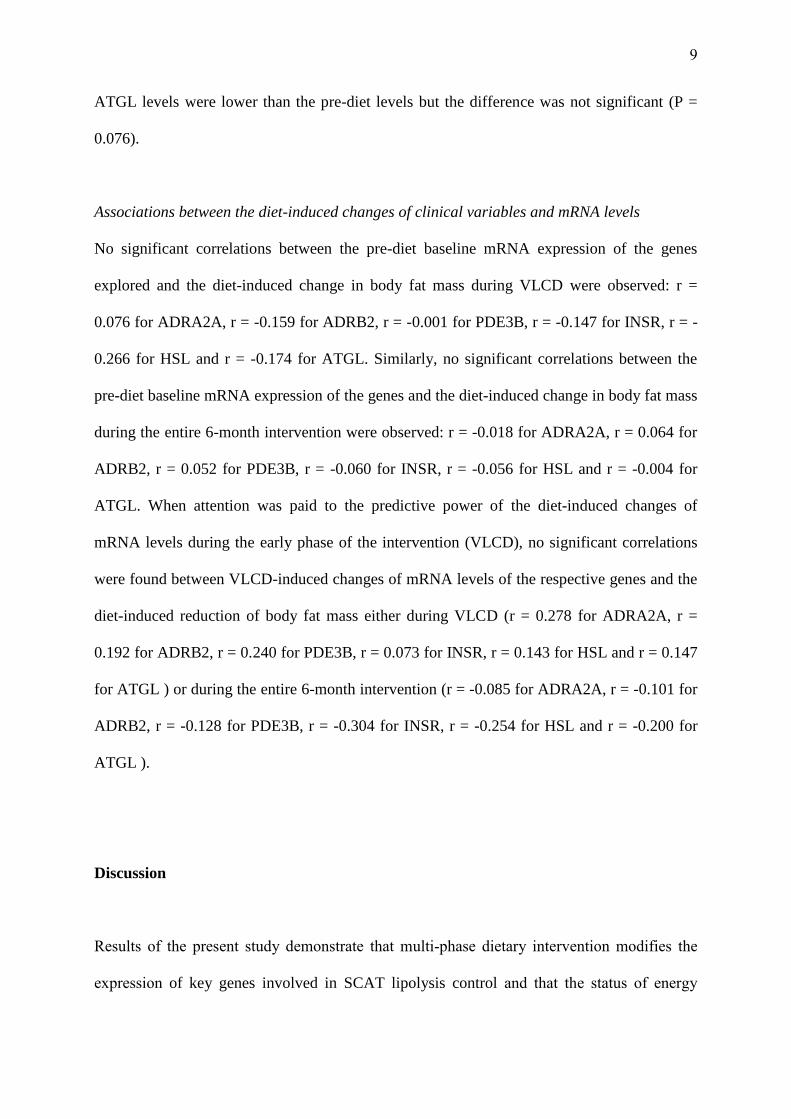
ATGL levels were lower than the pre-diet levels but the difference was not significant (P =
0.076).
Associations between the diet-induced changes of clinical variables and mRNA levels
No significant correlations between the pre-diet baseline mRNA expression of the genes
explored and the diet-induced change in body fat mass during VLCD were observed: r =
0.076 for ADRA2A, r = -0.159 for ADRB2, r = -0.001 for PDE3B, r = -0.147 for INSR, r = -
0.266 for HSL and r = -0.174 for ATGL. Similarly, no significant correlations between the
pre-diet baseline mRNA expression of the genes and the diet-induced change in body fat mass
during the entire 6-month intervention were observed: r = -0.018 for ADRA2A, r = 0.064 for
ADRB2, r = 0.052 for PDE3B, r = -0.060 for INSR, r = -0.056 for HSL and r = -0.004 for
ATGL. When attention was paid to the predictive power of the diet-induced changes of
mRNA levels during the early phase of the intervention (VLCD), no significant correlations
were found between VLCD-induced changes of mRNA levels of the respective genes and the
diet-induced reduction of body fat mass either during VLCD (r = 0.278 for ADRA2A, r =
0.192 for ADRB2, r = 0.240 for PDE3B, r = 0.073 for INSR, r = 0.143 for HSL and r = 0.147
for ATGL ) or during the entire 6-month intervention (r = -0.085 for ADRA2A, r = -0.101 for
ADRB2, r = -0.128 for PDE3B, r = -0.304 for INSR, r = -0.254 for HSL and r = -0.200 for
ATGL ).
Discussion
Results of the present study demonstrate that multi-phase dietary intervention modifies the
expression of key genes involved in SCAT lipolysis control and that the status of energy

10
balance during the dietary intervention is an important determinant of the lipolysis genes
regulation. These findings are in agreement with previous research in humans (Capel et al.
2009, Kovacikova et al. 2010, Vitkova et al. 2007) and in experimental models (Kosteli et al.
2010) that showed that the diet-induced changes of adipose tissue expression of genes related
to metabolism or immune function are strongly dependent on the phase of the diet.
One of the regulators of lipolysis that received substantial attention in dietary intervention
studies are catecholamines as they are believed to be one of the major players that regulate
lipid mobilization in adipose tissue. Most of the studies that examined the lipolytic response
to -adrenergic stimulation after 3-12 weeks VLCD reported an increased lipolytic response
in situ (Barbe et al. 1997, Flechtner-Mors et al. 1999, Sengenes et al. 2002) and in vitro (Stich
et al. 1997, Wahrenberg et al. 1999). After 15-weeks LCD, the maximal lipolytic response to
isoprenaline (a -adrenoreceptor agonist) was unchanged when compared to the pre-diet
level, while the -adrenoreceptor lipolytic sensitivity was increased in isolated adipocytes
(Mauriège et al. 1999). The 2-adrenoceptor mediated anti-lipolytic action in isolated
adipocytes was found to be unchanged after 4-12 weeks VLCD (Kather et al. 1985, Stich et
al. 1997, Wahrenberg et al. 1999) and to be reduced after 12-15 weeks LCD in vitro
(Mauriège et al. 1999) and in situ (Stich et al. 2002). Results of the above mentioned single-
phase dietary intervention studies were in agreement with a recent study in which the SCAT
lipolysis was examined during a long-term multi-phase diet (Koppo et al. 2012). The authors
reported that the adrenaline-induced SCAT lipolysis in vivo was enhanced during the calorie-
restricted phases of the diet and returned back to the pre-diet levels during the WM phase. The
diet-induced changes in SCAT lipolysis were rather related to a decreased 2-adrenergic
regulation than to an increased -adrenergic regulation (Koppo et al. 2012). Changes in
postreceptor signaling pathways as well as changes in density of the adrenoceptors should be

11
considered as possible mechanisms that underlie the changes in lipolytic responsiveness
during the dietary intervention. It was found that in SCAT of obese women the -
adrenoreceptor density increased after VLCD compared with the pre-diet levels, while the -
adrenoreceptor density remained unchanged (Mauriège et al. 1999, Wahrenberg et al. 1999).
On the transcriptional level, it was reported that, after 12 weeks of LCD, SCAT ADRA2A
mRNA levels decreased and ADRB2 mRNA levels did not change compared with the pre-diet
condition in obese women (Stich et al. 2002). The present study investigated the changes in
adrenoceptor gene expression during different phases of the dietary intervention in the same
individual. The lipolytic ADRB2 gene was up-regulated after VLCD, and not after LCD and
WM, while the anti-lipolytic ADRA2A gene was down-regulated after VLCD and LCD.
After WM, the adrenoceptor mRNA levels returned back to the pre-diet values. Although
there are many intermediate steps between the adrenergic regulation of SCAT lipolysis in
vivo and the transcriptional level of the adrenoceptor gene expression, these findings parallel
the results of our previous study mentioned above (Koppo et al. 2012) in which adrenergic
regulation of lipolysis was investigated in situ using microdialysis. Indeed, in that study, the
2-mediated antilipolytic action was reduced in situ at VLCD and LCD, similarly to the
evolution of ADRA2A mRNA levels. In contrast, the -adrenoceptor-mediated stimulation of
lipolysis in situ increased at VLCD and went back to pre-diet levels, similarly to ADRB2
mRNA levels.
Another important lipolysis-regulating pathway is that of insulin. In the present study mRNA
levels of PDE3B and INSR were explored. The anti-lipolytic effect of insulin is mediated
through activation of PDE3B; more specifically, insulin activates phosphatidylinositol 3-
kinase serine kinase, the kinase that activates PDE3B, through binding to INSR (Rondinone et
al. 2000). The activation of PDE3B promotes cAMP degradation, which in turn inactivates
12
protein kinase A (PKA) that reduces phosphorylation of lipases and perilipins. In the present
study, no changes in mRNA levels of PDE3B and INSR were observed throughout the dietary
intervention. It cannot be excluded that a change in the activation of PDE3B might have
occurred. Nevertheless, in situ data also suggest a lack of change in insulin sensitivity of
adipose tissue during this dietary intervention: it was reported that, during a hyperinsulinemic
euglycemic clamp performed at different time points of a multi-phase diet, the decrease in
SCAT dialysate glycerol was similar at the respective phases of the diet. This demonstrated
that the anti-lipolytic effect of insulin did not change throughout the dietary intervention
during which subjects’ whole-body insulin sensitivity improved (Koppo et al. 2012).
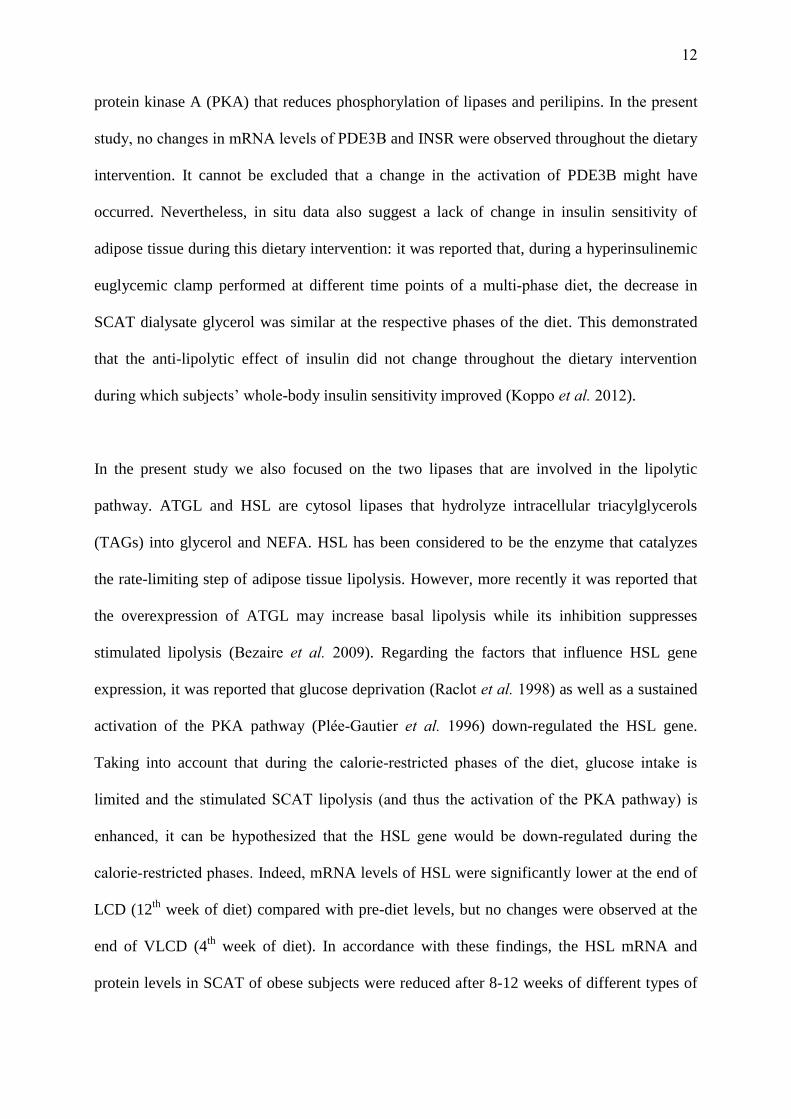
In the present study we also focused on the two lipases that are involved in the lipolytic
pathway. ATGL and HSL are cytosol lipases that hydrolyze intracellular triacylglycerols
(TAGs) into glycerol and NEFA. HSL has been considered to be the enzyme that catalyzes
the rate-limiting step of adipose tissue lipolysis. However, more recently it was reported that
the overexpression of ATGL may increase basal lipolysis while its inhibition suppresses
stimulated lipolysis (Bezaire et al. 2009). Regarding the factors that influence HSL gene
expression, it was reported that glucose deprivation (Raclot et al. 1998) as well as a sustained
activation of the PKA pathway (Plée-Gautier et al. 1996) down-regulated the HSL gene.
Taking into account that during the calorie-restricted phases of the diet, glucose intake is
limited and the stimulated SCAT lipolysis (and thus the activation of the PKA pathway) is
enhanced, it can be hypothesized that the HSL gene would be down-regulated during the
calorie-restricted phases. Indeed, mRNA levels of HSL were significantly lower at the end of
LCD (12th
week of diet) compared with pre-diet levels, but no changes were observed at the
end of VLCD (4th
week of diet). In accordance with these findings, the HSL mRNA and
protein levels in SCAT of obese subjects were reduced after 8-12 weeks of different types of

13
diet (Jocken et al. 2007, Reynisdottir et al. 1995), while no differences or an increase in HSL
protein level were reported for dietary interventions with a shorter duration (4 weeks of
VLCD) (Hellström et al. 1996b, Stich et al. 1997). The duration of the calorie restriction
seems to play an important role in the regulation of the lipase expression. Similarly to HSL,
ATGL mRNA and protein level were shown to be decreased in SCAT of obese subjects that
had followed a 10 week low-fat or medium-fat diet (Jocken et al. 2007). Also in the present
study, mRNA levels of ATGL were significantly lower at the end of LCD compared with pre-
diet levels. Interestingly, the pattern of evolution of ATGL mRNA levels during this dietary
intervention paralleled the evolution of basal lipolysis in situ observed in our previous
microdialysis study (Koppo et al. 2012). In contrast, no such parallel was found for the
pattern of evolution of mRNA HSL: it was different when compared with either basal
lipolysis or adrenaline-stimulated lipolysis in situ.
As mentioned above, results of this study and of previous ones show that the diet-induced
changes of adipose tissue gene expression are dependent on the phase of the diet. Capel et al.
(2009) showed that the regulation of adipocyte and macrophage genes during a multi-phase
diet was dependent on the phase of the diet. The metabolism-related genes (predominantly
expressed in adipocytes) were downregulated during energy restriction and upregulated
during weight stabilization, while the genes related to immune functions (predominantly
expressed in macrophages) were not changed or upregulated during energy restriction and
downregulated during weight stabilization (Capel et al. 2009). Furthermore, recent studies
showed the dependence of lipolysis on the phase of the hypocaloric diet in mice (Kosteli et al.
2010) and in humans (Koppo et al. 2012). In the former study (Kosteli et al. 2010) it was
suggested that lipolysis drives the adipose tissue macrophage accumulation since the peak in
macrophage number coincided with the peak in adipose tissue lipolysis. Furthermore, after an

14
extended period of weight loss, adipose tissue lipolysis decreased, as did the macrophage
content. It would be tempting to hypothesize that the same regulatory effect could occur in
humans. It was reported that markers of macrophage infiltration in human SCAT show a
similar time-pattern, i.e. a slight or no increase during one month of VLCD and a decrease
under the pre-diet levels at the end of a 6 month diet (Capel et al. 2009, Kovacikova et al.
2010). This would suggest that the biological role of SCAT lipolysis goes beyond serving as
an energy substrate and that it may play a role in the regulation of macrophage infiltration and
the inflammation of the adipose tissue.
Similarly to the studies of Mutch et al. (2007,2011) it might be hypothesized that the baseline
levels of the lipolytic genes or their diet-induced changes are predictors of the diet-induced
loss in fat mass. We tested specifically whether subjects with higher “responsiveness”, i.e.
larger modifications of mRNA levels of the respective genes during the initial phase of the
diet (i.e. VLCD), would be those with higher diet-induced fat loss either during VLCD or
during the entire 6-month intervention. This association was not confirmed in the present
study. Similarly, no associations between the pre-diet mRNA expression of lipolysis-
regulating genes and the diet-induced loss in fat mass during either VLCD or entire
intervention were observed.
In conclusion, this study demonstrates that the dietary intervention associated with an
improvement in insulin sensitivity modifies the mRNA expression of key genes that are
involved in SCAT lipolysis regulation. The pattern of this diet-induced modification varies
during the course of the diet and is related to the status of energy balance. No straightforward
relationship between the evolution of expression of the respective genes and that of insulin
sensitivity was found.
15
Acknowledgements
This study was supported by grant IGA NT 11450-3/2010 of the Ministry of Health of Czech
Republic, by a grant from the Direction Générale de la Coopération Internationale et du
Développement (Programme d’Action Intégré Franco-Tchèque), by a grant from Novartis
Pharma S.A.S, by the grant of the Ministry of Education of Czech Republic MSM
0021620814, and by Integrated Project HEPADIP (www.hepadip.org), (Contract No. LSHM-
CT-2005-018734) and Collaborative Project ADAPT (www.adapt-eu.net), (Contract No.
HEALTH-F2-2008-2011 00). K Koppo was supported by a postdoctoral research grant from
the Special Research Fund of the Ghent University. We are indebted to Zuzana Parizkova for
her technical expertise.

16
References
BARBE P, STICH V, GALITZKY J, KUNESOVA M, HAINER V, LAFONTAN M,
BERLAN M: In vivo increase in beta-adrenergic lipolytic response in subcutaneous
adipose tissue of obese subjects submitted to a hypocaloric diet. J Clin Endocrinol Metab
82: 63-69, 1997.
BEZAIRE V, MAIRAL A, RIBET C, LEFORT C, GIROUSSE A, JOCKEN J,
LAURENCIKIENE J, ANESIA R, RODRIGUEZ AM, RYDEN M, STENSON BM,
DANI C, AILHAUD G, ARNER P, LANGIN D: Contribution of adipose triglyceride
lipase and hormone-sensitive lipase to lipolysis in hMADS adipocytes. J Biol Chem 284:
18282-18291, 2009.
CAPEL F, KLIMCÁKOVÁ E, VIGUERIE N, ROUSSEL B, VÍTKOVÁ M,
KOVÁCIKOVÁ M, POLÁK J, KOVÁCOVÁ Z, GALITZKY J, MAORET JJ,
HANÁCEK J, PERS TH, BOULOUMIÉ A, STICH V, LANGIN D: Macrophages and
adipocytes in human obesity: adipose tissue gene expression and insulin sensitivity during
calorie restriction and weight stabilization. Diabetes 58: 1558-1567, 2009.
DEFRONZO RA, TOBIN JD, ANDRES R: Glucose clamp technique: a method for
quantifying insulin secretion and resistance. Am J Physiol 237: E214-223, 1979.
FLECHTNER-MORS M, DITSCHUNEIT HH, YIP I, ADLER G: Sympathetic
modulation of lipolysis in subcutaneous adipose tissue: effects of gender and energy
restriction. J Lab Clin Med 134: 33-41, 1999.
GUMBS AA, MODLIN IM, BALLANTYNE GH: Changes in insulin resistance
following bariatric surgery: role of caloric restriction and weight loss. Obes Surg 15: 462-
473, 2005.

17
HELLSTRÖM L, LANGIN D, REYNISDOTTIR S, DAUZATS M, ARNER P:
Adipocyte lipolysis in normal weight subjects with obesity among first-degree relatives.
Diabetologia 39:921–928, 1996a.
HELLSTRÖM L, REYNISDOTTIR S, LANGIN D, RÖSSNER S, ARNER P: Regulation
of lipolysis in fat cells of obese women during long-term hypocaloric diet. Int J Obes
Relat Metab Disord 20: 745-752, 1996b.
HENSRUD DD: Dietary treatment and long-term weight loss and maintenance in type 2
diabetes. Obes Res 9: 348S-353S, 2001.
JOCKEN JW, LANGIN D, SMIT E, SARIS WH, VALLE C, HUL GB, HOLM C,
ARNER P, BLAAK EE: Adipose triglyceride lipase and hormone-sensitive lipase protein
expression is decreased in the obese insulin-resistant state. J Clin Endocrinol Metab 92:
2292-2299, 2007.
KATHER H, WIELAND E, FISCHER B, WIRTH A, SCHLIERF G: Adrenergic
regulation of lipolysis in abdominal adipocytes of obese subjects during caloric restriction:
reversal of catecholamine action caused by relief of endogenous inhibition. Eur J Clin
Invest 15: 30-37, 1985.
KLIMCAKOVA E, POLAK J, MORO C, HEJNOVA J, MAJERCIK M, VIGUERIE N,
BERLAN M, LANGIN D, STICH V: Dynamic strength training improves insulin
sensitivity without altering plasma levels and gene expression of adipokines in
subcutaneous adipose tissue in obese men. J Clin Endocrinol Metab 91: 5107-5112, 2006.
KOPPO K, SIKLOVÁ-VITKOVÁ M, KLIMCÁKOVÁ E, POLÁK J, MARQUES MA,
BERLAN M, VAN DE VOORDE J, BULOW J, LANGIN D, DE GLISEZINSKI I,
STICH V: Catecholamine and insulin control of lipolysis in subcutaneous adipose tissue
during long-term diet-induced weight loss in obese women. Am J Physiol Endocrinol
Metab 302: E226-232, 2012.

18
KOSTELI A, SUGARU E, HAEMMERLE G, MARTIN JF, LEI J, ZECHNER R,
FERRANTE AW JR: Weight loss and lipolysis promote a dynamic immune response in
murine adipose tissue. J Clin Invest 120: 3466-3479, 2010.
KOVÁČIKOVÁ M, SENGENES C, KOVÁČOVÁ Z, SIKLOVÁ-VÍTKOVÁ M,
KLIMČÁKOVÁ E, POLÁK J, ROSSMEISLOVÁ L, BAJZOVÁ M, HEJNOVÁ J,
HNĚVKOVSKÁ Z, BOULOUMIÉ A, LANGIN D, STICH V: Dietary intervention-
induced weight loss decreases macrophage content in adipose tissue of obese women. Int
J Obes (Lond) 35: 91-98, 2010.
LIVAK KJ, SCHMITTGEN TD: Analysis of relative gene expression data using real-time
quantitative PCR and the 2(Delta Delta C(T)) Method. Methods 25:402-408, 2001.
MAURIÈGE P, IMBEAULT P, LANGIN D, LACAILLE M, ALMÉRAS N,
TREMBLAY A, DESPRÉS JP: Regional and gender variations in adipose tissue lipolysis
in response to weight loss. J Lipid Res 40: 1559–1571, 1999.
MUTCH DM, PERS TH, TEMANNI MR, PELLOUX V, MARQUEZ-QUIÑONES A,
HOLST C, MARTINEZ JA, BABALIS D, VAN BAAK MA, HANDJIEVA-
DARLENSKA T, WALKER CG, ASTRUP A, SARIS WH, LANGIN D, VIGUERIE N,
ZUCKER JD, CLÉMENT K, DIOGENES PROJECT: A distinct adipose tissue gene
expression response to caloric restriction predicts 6-mo weight maintenance in obese
subjects. Am J Clin Nutr 94: 1399-1409, 2011.
MUTCH DM, TEMANNI MR, HENEGAR C, COMBES F, PELLOUX V, HOLST C,
SØRENSEN TI, ASTRUP A, MARTINEZ JA, SARIS WH, VIGUERIE N, LANGIN D,
ZUCKER JD, CLÉMENT K: Adipose gene expression prior to weight loss can
differentiate and weakly predict dietary responders. PLoS One 2: e1344, 2007.

19
PLÉE-GAUTIER E, GROBER J, DUPLUS E, LANGIN D, FOREST C: Inhibition of
hormone-sensitive lipase gene expression by cAMP and phorbol esters in 3T3-F442A and
BFC-1 adipocytes. Biochem J 318: 1057-1063, 1996.
RACLOT T, DAUZATS M, LANGIN D: Regulation of hormone-sensitive lipase
expression by glucose in 3T3-F442A adipocytes. Biochem Biophys Res Commun 245:
510-513, 1998.
REYNISDOTTIR S, ELLERFELDT K, WAHRENBERG H, LITHELL H, ARNER P:
Multiple lipolysis defects in the insulin resistance (metabolic) syndrome. J Clin Invest 93:
2590-2599, 1994a.
REYNISDOTTIR S, WAHRENBERG H, CARLSTRÖM K, RÖSSNER S, ARNER P:
Catecholamine resistance in fat cells of women with upper-body obesity due to decreased
expression of beta 2-adrenoceptors. Diabetologia 37: 428-435, 1994b.
REYNISDOTTIR S, LANGIN D, CARLSTRÖM K, HOLM C, RÖSSNER S, ARNER P:
Effects of weight reduction on the regulation of lipolysis in adipocytes of women with
upper-body obesity. Clin Sci (Lond) 89: 421-429, 1995.
RONDINONE CM, CARVALHO E, RAHN T, MANGANIELLO VC, DEGERMAN E,
SMITH UP: Phosphorylation of PDE3B by phosphatidylinositol 3-kinase associated with
the insulin receptor. J Biol Chem 275: 10093-10098, 2000.
SENGENES C, STICH V, BERLAN M, HEJNOVA J, LAFONTAN M, PARISKOVA Z,
GALITZKY J: Increased lipolysis in adipose tissue and lipid mobilization to natriuretic
peptides during low-calorie diet in obese women. Int J Obes Relat Metab Disord 26: 24-
32, 2002.
STICH V, HARANT I, DE GLISEZINSKI I, CRAMPES F, BERLAN M, KUNESOVA
M, HAINER V, DAUZATS M, RIVIÈRE D, GARRIGUES M, HOLM C, LAFONTAN
M, LANGIN D: Adipose tissue lipolysis and hormone-sensitive lipase expression during

20
very-low-calorie diet in obese female identical twins. J Clin Endocrinol Metab 82: 739-
744, 1997.
STICH V, MARION-LATARD F, HEJNOVA J, VIGUERIE N, LEFORT C,
SULJKOVICOVA H, LANGIN D, LAFONTAN M, BERLAN M: Hypocaloric diet
reduces exercise-induced alpha 2-adrenergic antilipolytic effect and alpha 2-adrenergic
receptor mRNA levels in adipose tissue of obese women. J Clin Endocrinol Metab 87:
1274-1281, 2002.
TOUBRO S, SORENSEN TI, RONN B, CHRISTENSEN NJ, ASTRUP A: Twenty-four-
hour energy expenditure: The role of body composition, thyroid status, sympathetic
activity, and family membership. J Clin Endocrinol Metab 81: 2670-2674, 1996.
VITKOVA M, KLIMCAKOVA E, KOVACIKOVA M, VALLE C, MORO C, POLAK J,
HANACEK J, CAPEL F, VIGUERIE N, RICHTEROVA B, BAJZOVA M, HEJNOVA J,
STICH V, LANGIN D: Plasma levels and adipose tissue messenger ribonucleic acid
expression of retinol-binding protein 4 are reduced during calorie restriction in obese
subjects but are not related to diet-induced changes in insulin sensitivity. J Clin
Endocrinol Metab 92: 2330-2335, 2007.
WAHRENBERG H, EK I, REYNISDOTTIR S, CARLSTROM K, BERGQVIST A,
ARNER P: Divergent effects of weight reduction and oral anticonception treatment on
adrenergic lipolysis regulation in obese women with the polycystic ovary syndrome. J
Clin Endocrinol Metab 84: 2182-2187, 1999.

21
Table 1. Subjects’ Characteristics
Pre-diet VLCD LCD WM
Weight (kg) 94.9 ± 3.4 87.9 ± 3.2 a 85.2 ± 3.2
a,b 85.6 ± 3.2
a,b
BMI (kg/m2) 34.7 ± 1.0 32.1 ± 1.0
a 31.1 ± 1.0
a,b 31.3 ± 1.0
a,b
Fat mass (kg) 38.2 ± 2.7 32.7 ± 2.4 a 29.7 ± 2.0
a,b 30.6 ± 2.4
a
Fat free mass (kg) 56.8 ± 1.4 55.2 ± 1.5 a 55.6 ± 1.7 55.1 ± 1.5
a
Waist circumference (cm) 102.9 ± 3.1 97.2 ± 3.3 a 95.4 ± 3.3
a,b 95.1 ± 3.2
a,b
Cholesterol (mmol/l) 4.8 ± 0.1 3.9 ± 0.2 a 4.3 ± 0.2
a,b 4.6 ± 0.2
b
HDL cholesterol (mmol/l) 1.10 ± 0.09 0.94 ± 0.07 a 1.12 ± 0.08
b 1.22 ± 0.06
a,b,c
Triglycerides (mmol/l) 1.57 ± 0.21 1.12 ± 0.10 a 1.11 ± 0.10
a 1.07 ± 0.06
a
Glycerol (mol/l) 222 ± 21 157 ± 10 a 140 ± 17
a 142 ± 12
a
NEFAs (mol/l) 653 ± 45 684 ± 46 553 ± 50 a,b
515 ± 53 a,b
Fasting glucose (mmol/l) 5.6 ± 0.1 5.4 ± 0.2 5.5 ± 0.1 5.3 ± 0.2
Fasting insulin (mU/l) 12.4 ± 2.0 6.7 ± 0.6 a 5.6 ± 0.6
a 7.3 ± 0.7
a,c
GDR (mg/kg.min) 3.1 ± 0.4 3.9 ± 0.5 a 4.3 ± 0.5
a 4.3 ± 0.4
a
BMI: body mass index, HDL: high-density lipoprotein, NEFAs: non-esterified fatty acids and
GDR: glucose disposal rate normalized to kg of body weight.
a = significantly different from pre-diet values (P < 0.05),
b = significantly different from
VLCD (P < 0.05), c = significantly different from LCD (P < 0.05).
22
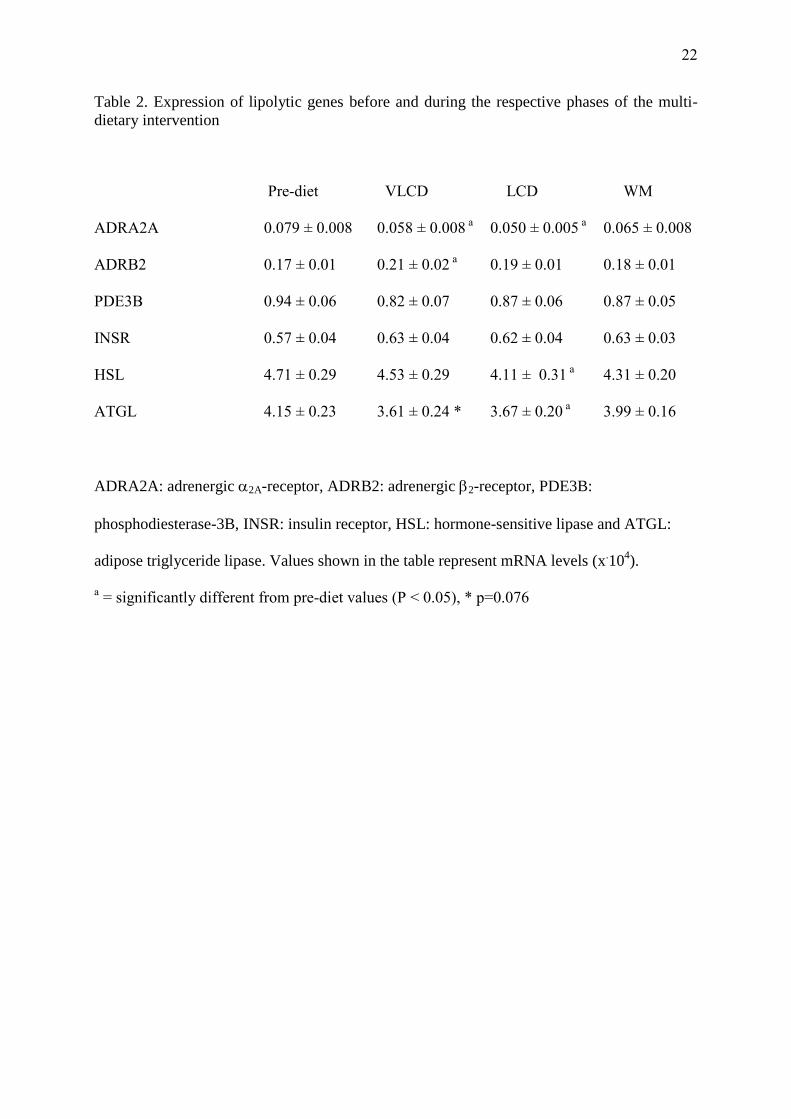
Table 2. Expression of lipolytic genes before and during the respective phases of the multi-
dietary intervention
Pre-diet VLCD LCD WM
ADRA2A 0.079 ± 0.008 0.058 ± 0.008 a 0.050 ± 0.005
a 0.065 ± 0.008
ADRB2 0.17 ± 0.01 0.21 ± 0.02 a 0.19 ± 0.01 0.18 ± 0.01
PDE3B 0.94 ± 0.06 0.82 ± 0.07 0.87 ± 0.06 0.87 ± 0.05
INSR 0.57 ± 0.04 0.63 ± 0.04 0.62 ± 0.04 0.63 ± 0.03
HSL 4.71 ± 0.29 4.53 ± 0.29 4.11 ± 0.31 a 4.31 ± 0.20
ATGL 4.15 ± 0.23 3.61 ± 0.24 * 3.67 ± 0.20 a 3.99 ± 0.16
ADRA2A: adrenergic 2A-receptor, ADRB2: adrenergic 2-receptor, PDE3B:
phosphodiesterase-3B, INSR: insulin receptor, HSL: hormone-sensitive lipase and ATGL:
adipose triglyceride lipase. Values shown in the table represent mRNA levels (x.10
4).
a = significantly different from pre-diet values (P < 0.05), * p=0.076