“Explore Hyderabad” An Interactive Web-based GIS ...21905/FULLTEXT01.pdf · Master’s Thesis...
83
Master’s Thesis in Geoinformatics “Explore Hyderabad” An Interactive Web-based GIS Application Prototype By Mir Mahammed Hussain Hashmi (30 th May 2006) Master of Science in Geoinformatics ISRN LIU-IDA-D20--06/007--SE Supervisor & Examiner: Dr. Åke Sivertun, IDA, Linköpings University Department of Computer and Information Science Linköpings universitet SE – 581 83 Linköping, Sweden Linköping, 2006
Transcript of “Explore Hyderabad” An Interactive Web-based GIS ...21905/FULLTEXT01.pdf · Master’s Thesis...

Master’s Thesis in Geoinformatics
“Explore Hyderabad”
An Interactive Web-based GIS Application Prototype
By
Mir Mahammed Hussain Hashmi (30th May 2006)
Master of Science in Geoinformatics ISRN LIU-IDA-D20--06/007--SE
Supervisor & Examiner: Dr. Åke Sivertun, IDA, Linköpings University
Department of Computer and Information Science Linköpings universitet
SE – 581 83 Linköping, Sweden
Linköping, 2006

”Explore Hyderabad” – An Interactive Web-based GIS Application Prototype.
2

”Explore Hyderabad” – An Interactive Web-based GIS Application Prototype.
3
I wish to dedicate this thesis to my dear parents, sister & relatives.

”Explore Hyderabad” – An Interactive Web-based GIS Application Prototype.
4

”Explore Hyderabad” – An Interactive Web-based GIS Application Prototype.
5
Abstract Products are displayed in a shelf to market and sell to the public. It creates an interest and attracts people towards it. Likewise, any country or city can showcase itself by using Web over the internet which will attract the tourists from around the world. This example can be used for the city of Hyderabad. Hyderabad has truly become an international city and there are many multinational companies establishing themselves. It is rapidly becoming a hot spot for tourists from around the world because of its exotic locations and facilities provided by the government. The city has been famous for historical monuments and culture, but in the recent years it has developed into a world class IT destination for many multinational IT companies and due to this it has attained world recognition on the global scenario. The time is to reap the benefits of this image and promote the city’s tourist sector by globally marketing the tourist attractions, facilities and services in an innovative and better way so that tourists from around the world visit the city and thereby contribute to the country’s economy with the foreign currency. This research deals with developing a Web-based GIS application that can promote the city’s tourist activities and also provide the users with an innovative way to access the spatial content of the city. GIS content forms the core component of this application as it provides the users with the spatial information about the place that is very close to reality. It supports the human tendency of “What you see is what you believe” by displaying the spatial information on the map. The application has been developed with the latest mapping server technology provided by Environmental Science Research Institute’s ArcIMS 9.1. This server software provides simple and easy methods to launch a Web-based GIS application over the Internet. Keywords Explore Hyderabad, ArcIMS, Geographical Information System (GIS), Tourism, Web-based Tourist Application, Interactive Tourist Guide.

”Explore Hyderabad” – An Interactive Web-based GIS Application Prototype.
6

”Explore Hyderabad” – An Interactive Web-based GIS Application Prototype.
7
Acknowledgements Although I am indeed the sole author of this thesis, I am by no means the sole contributor! Many people have contributed to my thesis, to my education, and to my life, and it is now my great pleasure to take this opportunity to thank them. This thesis would not appear in its present form without the kind support, stimulating suggestions, remarkable patience and encouragement of my thesis supervisor, Prof. Dr. Åke Sivertun. I am deeply indebted to him for his help in providing all the necessary software’s and facilities to carry out this work. I thank Mr. Dhanunjaya Reddy, for providing the GIS data of Hyderabad city, without which this work would have been very difficult. I am also grateful to my colleague Mr. Mohammed Hassan for his valuable hints, suggestions and motivation throughout my work. I would also like to thank all my friends from Linköping University, and my room mates Mohammed Abdul Qader Nayati, Syed Tariq Mehdi & Shaikh Moiz Ahmed and for being a surrogate family during the time I stayed and for their continued moral support and encouragement. And everyone else, who kept asking me all these months: "Have you finished your thesis yet?" Silencing that question was a prime motivation when life's other intellectual enticements kept singing to me. Finally, I am forever indebted to my parents and sister for their understanding, endless patience and encouragement when it was most required.
Mir Mahammed Hussain Hashmi Linköping, Sweden 30th May, 2006.

”Explore Hyderabad” – An Interactive Web-based GIS Application Prototype.
8

”Explore Hyderabad” – An Interactive Web-based GIS Application Prototype.
9
Table of Contents ABSTRACT........................................................................................................................................................... 5 ACKNOWLEDGEMENTS.................................................................................................................................. 7 LIST OF FIGURES ............................................................................................................................................ 11 LIST OF TABLES .............................................................................................................................................. 12 LIST OF ABBREVIATIONS............................................................................................................................. 13 1 INTRODUCTION ..................................................................................................................................... 15
1.1 INTRODUCTION ................................................................................................................................... 15 1.2 PROBLEM CONTEXT............................................................................................................................ 16 1.3 PROBLEM STATEMENT........................................................................................................................ 16 1.4 OBJECTIVES ........................................................................................................................................ 17 1.5 RESEARCH METHODOLOGY ................................................................................................................ 18 1.6 DISPOSITION ....................................................................................................................................... 19
2 GIS IN TOURISM – A PERSPECTIVE ................................................................................................. 21 2.1 TOURISM..................................................................................................................................................... 21 2.2 SIGNIFICANCE OF GIS IN TOURISM.............................................................................................................. 23 2.3 MARKETING CITIES – A WEB-BASED GIS APPROACH................................................................................ 26
2.3.1 Internet, World Wide Web & Tourism Marketability ......................................................................... 26 2.3.2 GIS Enhanced Tourism Web Site........................................................................................................ 28
3 INTERNET MAP SERVER ..................................................................................................................... 33 3.1 INTERNET GIS – BASIC COMPONENTS................................................................................................ 33
3.1.1 Client ............................................................................................................................................. 33 3.1.2 Web Server and Application Server .............................................................................................. 33 3.1.3 Data Server ................................................................................................................................... 34 3.1.4 Map Server .................................................................................................................................... 34
3.2 ARCIMS ARCHITECTURE – AN OVERVIEW ........................................................................................ 34 3.2.1 Presentation Tier........................................................................................................................... 35 3.2.2 Business Logic Tier ....................................................................................................................... 35 3.2.3 Data Tier ....................................................................................................................................... 37 3.2.4 External Supporting Components for ArcIMS............................................................................... 38
4 SYSTEM DESIGN AND IMPLEMENTATION.................................................................................... 39 4.1 PROTOTYPE SYSTEM DEVELOPMENT LIFE CYCLE .............................................................................. 39 4.2 SYSTEM REQUIREMENT ANALYSIS ..................................................................................................... 40 4.3 PROTOTYPE SYSTEM ARCHITECTURE DESIGN .................................................................................... 40
5 DATA ACQUISITION FOR “EXPLORE HYDERABAD” ................................................................. 43 5.1 GIS DATABASE DESIGN ...................................................................................................................... 43
5.1.1 Tourism Data Classification ......................................................................................................... 43 5.2 HARDWARE AND SOFTWARE .............................................................................................................. 44 5.3 FLOW OF DATA INTO THE GIS DATABASE.......................................................................................... 44 5.4 PRIMARY DATA COLLECTION ............................................................................................................. 45 5.5 DATA PREPARATION........................................................................................................................... 46 5.6 RESULTANT GIS DATABASE............................................................................................................... 47
6 INTERFACE DESIGN, CUSTOMISATION & RESULTS.................................................................. 49 6.1 WEB-BASED GIS WEBSITE SETUP ...................................................................................................... 49 6.2 USER INTERFACE ................................................................................................................................ 50 6.3 CUSTOMISATION................................................................................................................................. 52 6.4 RESULTS ............................................................................................................................................. 55
6.4.1 Enhanced User Interface............................................................................................................... 55 6.4.2 Toolbar.......................................................................................................................................... 56 6.4.3 Toggle Buttons .............................................................................................................................. 57

”Explore Hyderabad” – An Interactive Web-based GIS Application Prototype.
10
6.4.4 Map Navigation............................................................................................................................. 58 6.4.5 Search Functions........................................................................................................................... 59 6.4.6 Hyperlink, Print and Help............................................................................................................. 63
7 SYSTEM EVALUATION......................................................................................................................... 65 7.1 EVALUATION OBJECTIVES .................................................................................................................. 65 7.2 EVALUATION METHOD ....................................................................................................................... 65
7.2.1 Participants & Venue .................................................................................................................... 65 7.2.2 Material......................................................................................................................................... 65 7.2.3 Procedure...................................................................................................................................... 65
7.3 EVALUATION RESULTS ....................................................................................................................... 66 7.3.1 Quantitative Results ...................................................................................................................... 66 7.3.2 Discussion ..................................................................................................................................... 71
8 CONCLUSION.......................................................................................................................................... 73 8.1 ADVANTAGES AND LIMITATIONS........................................................................................................ 73
8.1.1 Advantages .................................................................................................................................... 73 8.1.2 Limitations..................................................................................................................................... 73
8.2 FUTURE WORK ................................................................................................................................... 74 APPENDIX.......................................................................................................................................................... 75 REFERENCES.................................................................................................................................................... 79

”Explore Hyderabad” – An Interactive Web-based GIS Application Prototype.
11
List of Figures Figure
Number Title Page
Number(i) (ii) (iii) 1.1 Research Model. 18 1.2 Location of Hyderabad city in Andhra Pradesh, India. 20 2.1 USA and Europe, the leading markets for India. 22 2.2 Classification of GIS Use in Tourism 24 2.3 Tourism distribution systems 27 2.4 Levels in Destination Management System 28 2.5 Categories of tourism services A & B. 29 2.6 Durham County Council’s GIS Online Interactive Mapping Service. 30 3.1 Basic components of Internet GIS 33 3.2 ArcIMS architecture overview 34 3.3 Communication between client viewers and the server 35 3.4 Components of business logic tier. 36 3.5 External components for ArcIMS 38 4.1 Prototyping lifecycle process model 39 4.2 Prototype system architecture design for Explore Hyderabad. 41 5.1 Classification of tourism data 43 5.2 Flow of data into the GIS database 44 5.3 Available data of Hyderabad city 46 5.4 Resultant dataset for Explore Hyderabad. 47 6.1 ArcIMS website development process 49 6.2 Layout view of the basic user interface 50
6.3 (a) HTML files 51 6.3 (b) JavaScript files 51
6.4 Basic website of Explore Hyderabad 51 6.5 Displaying the different parts in an enhanced interface of Explore
Hyderabad. 55
6.6 Display of tools buttons in the tool bar. 56 6.7 Legend list is visible in the right side of window. Layer list is
invisible 57
6.8 Overview map in the upper left corner of map frame is turned off 57 6.9 Zoom In function 58 6.10 Zoom Out function 58 6.11 Identify Feature function 59 6.12 The user can pass a query using the Query function 59 6.13 Query results displaying the five star hotels in the text frame and
also highlighting them on the map. 60
6.14 Search function is being used by typing the keyword ‘FIVE’ to find the five start hotels in the city
60
6.15 Results returned for searching the Five Start hotels. 61 6.16 Clear function clears the previous results 61 6.17 Features can be selected using the Select tool. A monument has
been selected 62

”Explore Hyderabad” – An Interactive Web-based GIS Application Prototype.
12
(i) (ii) (iii) 6.18 Finding a restaurant within a distance of 1 km around the selected
monument using Closest Facility tool. 62
6.19 Two restaurants were found in a buffer of 1 km around the selected monument
63
6.20 The hyperlink function opens the website link associated with the feature.
63
6.21 Print option helps in generating a hard copy for the user 64 6.22 Help tool opens an instruction manual useful to operate Explore
Hyderabad 64
7.1 Graph of results obtained on look and feel of the website 66 7.2 Graph illustrating the basic tools usage by the users 67 7.3 Graph showing the search and closest facility tool’s level of
easiness 68
7.4 Showing the graph of customised tools in terms of their usefulness 69 7.5 Graph describing the GIS content on the website 70
List of Tables
Table Number
Title Page Number
2.1 Top ten International markets for India during 2004. 22 2.2 Questions concerning management users 25 2.3 Questions concerning public users 25 5.1 List of available data sets before data processing 45 5.2 Available data sets after data processing 48 6.1 Description of tools in “Explore Hyderabad” 53 7.1 Post evaluation results on look and feel of the website 66 7.2 Results on using the basic tools 67 7.3 Showing the level of easiness with the customised tools 68 7.4 Shows the most useful and helpful customised tools 69 7.5 Table describing user feedback on the GIS content 70 7.6 Users suggestions and comments 71

”Explore Hyderabad” – An Interactive Web-based GIS Application Prototype.
13
List of Abbreviations GIS Geographic Information System
DBMS Data Base Management System
IT Information Technology
HTML Hypertext Mark-up Language
IMS Internet Map Serve
ArcIMS Arc View Internet Map Server
GDP Gross Domestic Product
WTTC World Travel & Tourism Council
ARPANET Advanced Research Projects Agency Network
TCP/IP Transfer Control Protocol / Internet Protocol
Internet International Nework
WWW World Wide Web
URL Uniform Resource Locator
HTTP Hypertext Transfer Protocol
DMS Destination Management System
UN United Nations
ESRI Environmental Science Research Institute
SQL Structured Query Language
DHTML Dynamic Hypertext Mark-up Language
JSP Java Server Pages
ArcXML Arc View Extensible Mark-up Language
JPEG Joint Photography Experts Group Format
PNG Portable Network Graphics
GIFF Graphics Interchange Format
ArcSDE Arc View Spatial Database Engine
JVM Java Virtual Machine
JRE Java Runtime Environment
RDBMS Relational Database Management System
APSRTC Andhra Pradesh State Road Transport Corporation

”Explore Hyderabad” – An Interactive Web-based GIS Application Prototype.
14

”Explore Hyderabad” – An Interactive Web-based GIS Application Prototype.
15
1 Introduction
1.1 Introduction Berno (1999) and Mckercher (1996) describe the word tourism as any business like transport, entertainment or places to stay, involved in the service of people who are on a holiday. A tourist is an individual, who visits a place for interest or pleasure, usually during a holiday (Mckercher, 1996). The tourism industry involves many businesses that are directly or indirectly involved in providing services to the tourists. Tourism is regarded as one of the largest economic source to a country’s finances (Donoho, 1996). Developing countries account for almost 30 percent of world tourism revenue (Dondo et al, 2002). It is a source of foreign currency for developing countries as it involves mobility of tourists to and from one place to another. The authors Van Arragon and Wessels(1994) states the direct association between tourism and cartography. As it is known that the tourism involves traveling between close and distant places, hence, maps are an important tool for providing locations of those places. The use of maps in tourism sector is much popular for communication and traveling. Maps such as those containing travel routes and general information about the areas to visit are used to select the destinations, travel planning, and stay. Over the ages, tourism has been supported by travel books and tour guides. Typically, such guides include maps that are marked so as to link descriptions of place with their location. For the average tourist, these guides have certainly served their purpose. On the other hand for the tourist seeking more than just a description, the typical tour guide has proved to be unsatisfactory (John O’ Looney, 2004). Geographic Information System (GIS) comes into picture when we talk about the maps and its use. “Geographic information systems are used to collect, analyze and present information describing the physical and logical properties of the geographic world” (Brajesh Goyal et al., 1997). In other words, it deals with the collection, storage, manipulation, analyzing and presentation of spatial or geographic data. Simply, put GIS is an information system that makes us use spatial information effectively for human life (Dockkey et al, 2004). The power of GIS lies in organising and manipulating spatial information by using, both a database management system (DBMS) and an automated cartographic system for rationally linking map features to attribute data (Nasimudheen et al, 1997). It gives us information in form of a map but not just picture of a map (Pulusani, 2001). Almost everyone is now aware of GIS and its implications of using it in various areas and applications. Tourism is one such area where GIS is being used to further support its services. Before the GIS it was Internet revolution which changed the way to access information for the people. Everyone hosted a dot com website for their business or company with the information about their products or services. The tourism sector also used the web technology to publish their web pages full of information about the travel and tour information. Products and services were offered online directly to the customers by both tourism suppliers and tourism agencies (Standing & Vasudavan, 2000). Through the web customers can get relevant information easily over the Internet by means of accessing useful and updated information, inquire questions, look for the tourist product catalogues, order bookings and make payments to airlines, hotels and other services. All this can be done by the traveler sitting at home without the need for going to the travel agents and other places for the purpose

”Explore Hyderabad” – An Interactive Web-based GIS Application Prototype.
16
(Lu Jie & Lu Zi, 2004). In spite of all the above facts, currently the users are facing a problem with extensive information. They have to dig down in the hyper links before reaching their answer. Shneiderman (1997) refers this situation as a tragedy of the flood of information. People want access to what-they-want and when-they-want-it (Pulusani, 2001). Here the web-based GIS mapping solution comes in handy providing an interface, from where the user can directly select or query the information they need from or to the map. People can specify their areas of interest and then look at the information described in a map. Otherwise they can also click on the interactive informative map and get the attribute information about the points of interest from the map database. The purpose of this research is to explore the role of GIS and Internet together, in the current scenario of new and emerging technologies for the area of tourism; and to develop a web-based GIS mapping prototype to assist the tourism department of Hyderabad by enabling dynamic and interactive response to the user and thus increasing the marketability of the city of Hyderabad in the domain of tourism.
1.2 Problem Context This application is created for Hyderabad and Secunderabad twin cities. Hyderabad is more than 400 years old and at present the fifth largest metropolitan city of India (for location on map, see Figure 1.2 at the end of this chapter). It is also the capital city for the state of Andhra Pradesh. Secunderabad is a twin city attached to Hyderabad. The city is bounded by the coordinates, latitudes – 17°-30`-00`` N & 17°-19`-48`` N and longitudes – 78°-22`-12`` E & 78°-34`-48`` E and spread on an area of 260 sq.kms., with a population of 5.5 million (2001 census). It is known for its rich history and culture with natural and architectural beauty, mosques, minarets, temples, chapels, bazaars and parks. It has also many ultra-modern shopping malls which add to the charm of the city. Presently the city is hosting many Multinational and IT companies from around the world with a well developed infrastructure to support related activities and due to this it is also called as “Cyberabad” which means Cyber City. The city has become a hub for most of the software development companies establishing their research activities. It has got many tourist attractions and modern facilities for the visitors which makes it a significant tourist destination. With all the means and efforts to serve the world, now the city needs to be presented in a better way to the world which could be done by using the Web-based interactive mapping using the GIS technology.
1.3 Problem Statement A web-based GIS application is developed to help the tourists to explore the city of Hyderabad with all its facilities and attractions and thus promote tourism. Presently the tourism department displays the tourism information for the intended visitors on a website. The website is in the form of HTML files providing static information. The problems associated with the existing system are as follows:
1. The web site is static with textual description without any interactive map. 2. The menu only displays a list of tourist attractions consisting of various tourist spots in
the city. 3. It is time consuming and boring for end users to dig down a heap of hyperlinks who
wish to get information about specific tourist location or facility.

”Explore Hyderabad” – An Interactive Web-based GIS Application Prototype.
17
4. There is an option called as “How to Reach this place” which gives general information about the city railway station and airport addresses and their telephone numbers rather than directions to the particular tourist spot selected by the tourist.
5. The other option “Where to stay” lists a number of restaurants and hotels with their addresses and contact details which should have been displayed on map with their spatial locations.
6. The information about each tourist spot includes only a description and a picture about the attraction with the other information such as fee, timings and address.
7. Further, an option called as “Map” is also provided on the site which shows a thematic boundary map of Hyderabad and Secunderabad cities. It is not more than a picture which does not provide any information and meant for the aesthetic appeal of the web site. The user cannot change the scale of a map, select an area of interest, or find the route to the facility.
8. The site provides the tourist with basic descriptive information of the interests which is not enough to convince the tourist. The descriptive information available is not linked to the map with the spatial location.
9. The city being a hub of activities for the Multinational & IT companies, various conferences are being held regularly in the city, due to which many national & international visitors from different places outside come in the city. Therefore, it should provide the people with a map with which they can easily find the direction of the interest or facility and its related information.
10. The current web site gives the tourist only descriptive information about the tourist spots which is not enough to create interest and excitement. In order to attract the tourists to the city right form the deciding stage of their tour i.e. when the tourist visits the web site for details of the city, it should be innovative and informative There is a very famous proverb that a first impression is always the best impression and this fits for marketing the tourism of the city. This could be done by spatially linking the descriptive information with the map and by adding other functionalities such as tour path and route finder which will involve them in the tour right from the start and thus generates interest attracting a prospective tourist to the city.
The problems that are to be addressed in this research are summarized below:
• How to develop a web-based information system prototype that provides the tourists with the information they want to access?
• How to develop a prototype application that showcases the tourist and other facilities of the city leading to the promotion of tourism in the city?
• How to develop the suitable query tools for the prototype system?
1.4 Objectives The objectives of this research thesis are as follows:
• Develop a GIS enabled online interactive guide for the tourists and residents of Hyderabad.
• Designing and developing a prototype website that provides both spatial and non-spatial tourism information using ArcIMS (Internet Map Server).
• Customizing the website for enhancements with added functionalities of finding a location through queries, hyperlink the features and proximity search.

”Explore Hyderabad” – An Interactive Web-based GIS Application Prototype.
18
1.5 Research Methodology
Figure 1.1: Research Model
”Explore Hyderabad” – An Interactive Web-based GIS Application Prototype.
19
The Research Model in figure 1.1 illustrates the flow of work in the research in order to achieve the objectives. The research work flow model has been divided into four modules and each of the modules dealing with a specific task to complete. The four modules involved are discussed below.
• Problem Analysis & Definition: The research starts with an analysis of the existing system and then defining the problems associated with it. This module involves studying the impact of tourism on the economy of the city in a global scenario. Problems associated with the present system i.e. tourist websites of Hyderabad, were analysed and defined. Literature review was a key source of information in determining the various trends and solutions to the existing problems in the system. A study on the Web-based mapping technology using GIS and its implications in promoting and marketing the city tourism facilities was also done. Based on all the above study, the objectives were set for the research work.
• Prototype Design: After determining the problems and setting the objectives, the next task involved designing a prototype model based on which the application will be developed. This phase of prototype design depends upon the expected output and the user requirements which were taken as input from the first module. The prototype model describes all the components which will build the system. The other tasks necessary to implement the prototype model were also carried out. It includes creating a database, which is the backbone of the entire application. This deals with the collection and the processing of the spatial as well as non-spatial data according to the user requirements. It involves primary data collection followed by the data processing which results in the final spatial database that can be used to develop the application i.e. “Explore Hyderabad”.
• Prototype Implementation: Once the database is populated, the application is ready to be developed. Based on the prototype model designed for the application, ESRI’s ArcIMS was installed and configured. This is followed by designing the user interface which sets up a website. After the website setup completes, the basic default look of the viewer is customized and few more functions which are necessary in the application such as hyper links, nearest facility search, and querying were included.
• Evaluation & Results: This module includes evaluation of Explore Hyderabad and the feedback in form of results form the users.
1.6 Disposition The thesis is organized into eight chapters. A brief description of each chapter is summarized below: Chapter 2: GIS in tourism – A perspective This chapter provides an overview of GIS and its significance in the tourism industry. It will also explain the importance of using web GIS technology to enhance the city tourist websites that will lead to a better platform that portrays and markets the facilities of a city. Chapter 3: Internet Map Server This chapter provides an overview of Internet GIS model. It explains in detail the architecture of ArcIMS that is used as a Map Server for Explore Hyderabad.

”Explore Hyderabad” – An Interactive Web-based GIS Application Prototype.
20
Chapter 4: System Design and Implementation This chapter describes the methodology of prototype lifecycle process model, which is followed to develop the application for Explore Hyderabad. This also includes a discussion upon the system requirements and the developed prototype model for the system. Chapter 5: Data Acquisition for “Explore Hyderabad” This chapter presents an overview of the steps and methods followed in collecting and processing the spatial and non-spatial data that can be used and implemented in the intended application prototype. Chapter 6: Interface Design, Customisation & Results It describes the interface design and development process of Explore Hyderabad. This includes the procedure followed in developing the ArcIMS website and further enhancing the user interface and functionalities of finding closest facilities, stored queries, hyper links and search. It also explains the various functions and the operating procedures that facilitate the user in the application. Chapter 7: System Evaluation This chapter includes a discussion upon the results derived from evaluation of Explore Hyderabad. It also describes the method and procedure followed for evaluation. Chapter 8: Conclusion This chapter includes a concluding discussion on the research work, the advantages & limitations associated with the prototype application and also the possible enhancements to the application in future.
Figure 1.2: Location of Hyderabad city in Andhra Pradesh, India.
Hyderabad City

”Explore Hyderabad” – An Interactive Web-based GIS Application Prototype.
21
2 GIS in tourism – A perspective This chapter emphasizes on the importance of tourism industry in the economic growth of a region. There is also an overview of GIS & Internet technology and there significance on the tourism industry. Further, the importance and impact of using both technologies together to improve the marketability of the tourist facilities is discussed. It presents the theoretical base for the GIS enabled web application being developed for the city of Hyderabad.
2.1 Tourism “Tourism is a composite of activities, facilities, services and industries that deliver a travel experience, that is, transportation, accommodation, eating and drinking establishments, entertainment, recreation, historical and cultural experience, destination attractions, shopping and other services available to travelers away from home.” (Dondo et al, 2002). The definition suggests that the tourism business is not confined to a single service rather it involves a large variety of diverse, exclusive and specialized services that can be provided by different groups. Tourism sector is the world’s leading industry in terms of revenue generation with an approximate value of U.S $ 4 trillion plus and still growing at an average rate of 10 percent per annum (Kumar, 2003). It is the foremost export earner industry and comprises around 11 percent of the world’s GDP (Gross Domestic Product) (Law, 1992)(Staab & Werthner, 2002). With such a huge share it will have a great impact on the economies of countries world wide. According to Alipour and Kilic (2003), developing countries can utilise the opportunities lying with the tourism sector and attain economic prosperity. The flow of tourists in a country increases the foreign currency reserves which can be a boost to a country’s economy. With respect to India, if it manages to acquire a share of even 2.5 percent of the total tourism receipts generated world-wide, then it can easily pay of its external debt (Kumar, 2003). The statistics provided by Ministry of Tourism, India (2004) and United Nations for the year 2005 reveal that India accounted for 0.8 percent of the world’s tourism receipts with foreign currency inflow of 4.8 million US dollars. This contributed to 4.9 per cent of India’s GDP as estimated by WTTC (World Travel & Tourism Council). The main source of International tourists to India is US and Europe. According to the United Nations Information Economy Report (2005) and India’s Ministry of tourism (2004), the top markets of visitors to India were U.S.A and U.K followed by Sri Lanka, France, Germany and other countries. Out of a total of 3.37 million arrivals in 2004, USA visitors accounted at 13.9 per cent and visitors from UK contributed 13.6 percent, which is summarized in the table 2.1 and illustrated in the corresponding graph of figure 2.1. Apart from international, domestic tourism also generates a considerable amount of revenue. In the year 2004, there were a total of 367.6 million visitors to the top ten Indian States (Incredible India, 2004). The success of tourism in any country depends on the ability to adequately develop, manage and market the tourism services and activities in that country (Dondo et al, 2002). India has realised the great potential of this industry and is now encouraging and gearing up to reap the benefits out of this sector. As the tourism industry involves many related business sectors, it can be seen as a source and influencing factor for the regional economic development to a great extent due to the promotion of small and medium sized enterprises creating new jobs and also the development in the infrastructure will benefit the local community (Staab & Werthner, 2002) (Jackson, 2006). Therefore, with a broad range of opportunities in itself, this sector presents a great gift to a region’s economy if accepted and acted upon wisely.

”Explore Hyderabad” – An Interactive Web-based GIS Application Prototype.
22
Table 2.1: Top ten International markets for India during 2004. (Incredible India, 2004)
Figure 2.1: USA and Europe, the leading markets for India. (Incredible India, 2004) Hyderabad city is the capital of Andhra Pradesh state which is the second hottest destination for the tourists with a share of 24.4 percent of visitors in India (Incredible India, 2004). The city has an age old history of more than 400 years in itself with many historical events and monuments. Also presently, India has branded Hyderabad as one of its world-class IT centers. This attracted many multinational companies to outsource their IT projects to firms in the city and also establishing their developmental and research centers (Zuckerman, 2003). The city is being chosen and hosting many international conferences, events and exhibitions.

”Explore Hyderabad” – An Interactive Web-based GIS Application Prototype.
23
This speaks in volumes about the facilities and the infrastructure of the city. With this blend of historical and modern infrastructure it is a potential tourist destination. Large cities such as this are already tourist centres and have many facilities for visitors, but the industry can only create an impact on the regional economy if those facilities are marketed properly. Hundreds of thousands of more tourists are required to be attracted, bringing in additional revenue and thereby generating jobs (Law, 1992). According to Staab & Werthner (2002) tourism industry is based on information which indicates that the tourism is a product of confidence. The tourist can only get the information about the product i.e. destination and not the product itself at the time of making a decision or deciding their destination tourist spots. Marketing is one of the proponents of tourism. In order to promote and attract the tourists to a region, Law (1992) suggests marketing and selling of the image. There are many mediums of promotion and marketing. One of the latest and available technologies being used is the Internet and Web coupled with GIS.
2.2 Significance of GIS in tourism GIS is such a fascinating technology that many people have started or starting to use it in their fields. GIS is being used as a stand alone or a supporting technology. There are many definitions being given for the GIS. Ton Bernhardsen (1999) defines GIS as a “system that captures, stores, manage, manipulates, retrieve and analyse geographic or spatial data through computer hardware/software and other cartographic special devices to create map products”. McAdam (1999) also defines GIS in a very simple way as a relational database that is capable of manipulating both kinds of spatial and non-spatial data together. Spatial data is in the form of digitised maps and non-spatial data is the attribute data in the form of alpha numeric records associated with the spatial data. Cartography is the art or technique of making maps. It is been practised since a long time but GIS is relatively a new field. It would be appropriate to say that using computers and other latest technologies for dealing with collecting, creating, analysing or manipulating the cartographic data and maps have been combined together in a system known as GIS. GIS is applicable to any of those fields using location information and maps to support their services. It is being used in many fields today in the world. Due to its flexibility it can support endless applications in various domains. It has become a valuable tool and is been applied in the natural, social, medical, and engineering sciences, as well as in business and service planning (Wahi, 2002). For example, in public health issues such as finding the geographical distribution of congenital heart defects in Saudi Arabia (Al-Menieir M., et al., 2004); analysing the patterns of crime in a region as done by Canter (1998) in Baltimore County; solving the route problem for the school bus (Nasimudheen, et al. 1997); developing cadastral maps and managing land information system (Raghavendran, 2002); finding the suitable locations for the retail outlets and also mapping the existing outlets to analyse the current and prospective sales (Agarwala, 2002); and evaluating an existing irrigation project (Babu, et al. 2002). There are many such instances using GIS to support or leverage their services. Tourism is another such area which requires and uses maps. The tourism industry is information intensive and consists of huge amount of data to be dealt with (Yojae & Kwang-Hoon, 2004). GIS is a better tool in dealing with huge location specific and non spatial data, and therefore, easy to organise and automate the data that can facilitate planners, official employees and general public in planning, development and marketing of tourism activity (Caldera, et al. 2000). As the tourism industry is vast and includes many inter related

”Explore Hyderabad” – An Interactive Web-based GIS Application Prototype.
24
segments, the use of GIS system is therefore classified into two categories according to the user. Management user and public user (Duran, et al. 2004).
Figure 2.2: Classification of GIS Use in Tourism. Management users consist of individual employers such as tour operators, a tourism group, policy makers or a local municipal administration for tourism specific strategic planning or decision making. The users of management are more interested to know the location of their customers, their socio-economic background and potential location for new tourist sites in the region (Duran, et al. 2004). Bulgaria’s Pamporovo resort situated in Eastern Europe, for example, was planned and developed using the GIS technology. The boundaries of the resort were delineated with its structural elements, creating buffer zones, terrain analysis for more classification of the possibilities of construction in future, tracing the new ski tracks and lifts, tourist routes selection, and general visualisations (ArcNews, 2003). The tourist map of Hachijojima, in Japan was also developed using GIS. The island was volcanic and the map produced was distinct with colour contrast to show the beautiful shape of the island, which was created by the volcanic mountains. With various functions performed on the map it was made to appear like floating on the ocean. This was helpful in attracting many tourists towards the spot (ESRI Map Book). Another example is the Local Area Map of London underground stations. To facilitate the underground passengers in London a local area map and a bus service “Spider Map” informing customers of nearby places reachable from the station at street level was produced using the GIS software (ESRI Map Book). Likewise, numerous cases can be cited where a GIS has been used to bring significant value in tourism planning, development or marketing. Public users are the tourists using the maps for navigating towards their destination. They are interested in finding geographic or location specific information about a place or a region. Further, the tourists maybe interested to know about the available amenities, facilities and also the climate of the region or place where they intend to visit. The following tables 2.2 & 2.3 illustrate the questions that concern the management and public users from a GIS system respectively.
GIS in Tourism
Planning
Development
Marketing
Finding geographic information of any destination or region for tour.
Finding region specific amenities, facilities, climate, etc
Management User Public User

”Explore Hyderabad” – An Interactive Web-based GIS Application Prototype.
25
Table 2.2: Questions Concerning Management Users (Caldera, et al. 2000)
1. Where is the city, the state or the country located? 2. How is the climate? Does it have a warm or cold weather? What is the better time in
the year to visit it? What clothes would be better to wear during the visit? 3. Which is the official language? 4. What are the kinds of public transport, which tourists can use? Where are the car-
rentals and tourism shuttle agencies located and the types of services they offer? 5. Where are the accommodations located in the city? What is their classification, rates
and services offered by them? 6. Where are the natural and/or the cultural attractions of the city located? How much
are the rates? What is their operation schedule? 7. What are the different attractions near the lodging? 8. Where are recreational sites located in the city and their visiting schedule? 9. Where are banks and currency exchange offices, hospitals, police stations, health
centres, embassies, consulates of countries located? 10. What are the phone numbers needed during an emergency? 11. Where are the shopping centres located? Where are the popular markets located in
the area of visit?
Table 2.3: Questions Concerning Public Users (Caldera, et al. 2000) 1. What are territorial divisions of municipalities, regions or states? 2. What are the areas that tourists are interested in? 3. What are the physical-geographic characteristics of those areas? 4. What are location, categorization and hierarchical structuring of natural and cultural
tourist resources? 5. What are the accessibility means, stops and station facilities of public transport? 6. Where are the accommodations available and how are they classified and
categorized? 7. What are the demographic and social-economic characteristics of local population of
each tourist spaces? 8. Where are facilities such as education, health, security and financial services
located? 9. What are public and private institutions available that are competent in tourism
planning? 10. What are the plans, programs and projects that would stimulate and give boost to the
development of "tourist spaces" 11. What is the tourist demand of attractive places, tourist equipment and services? What
are their social, geographic and economic characteristics? 12. What infrastructure services are in current and potential tourist areas? Which is the
service quality?
A typical GIS software provides functions such as layering that enables the user to add or remove certain features from the map thereby enhancing the visualization; querying and reclassification provides the user to adjust an image for analysis; buffering defines an area around the specified facility or activity; and data integration which is the most important function providing with the facility of laying one map layer on the top of another map layer of same area to form a new layer (McAdam, 1999). There are many other functions of GIS which helps in creation, analysis and manipulation of maps and related products. Thus, GIS can act as a potential toolbox of techniques in planning, managing and marketing the tourism products. Presently the tourism is being promoted and marketed to the world

”Explore Hyderabad” – An Interactive Web-based GIS Application Prototype.
26
through the Internet and Web as one of the mediums of advertising. But still it needs to be projected in a better way to the customer with the utmost possible information to increase its marketability. GIS spatial data can be used to enhance the tourist web site of a region which will give a new look with added functions to browse the information in a more innovate, interesting and better way, so that the prospective tourist researcher turns into a tourist for the region.
2.3 Marketing Cities – A Web-Based GIS approach
2.3.1 Internet, World Wide Web & Tourism Marketability The Internet is a network of networks across the globe transferring data among the many publicly connected computer networks (Peng and Tsou, 2003). The first network was developed in 1970’s by the U.S. Department of Defence for their project ARPANET (Advanced Research Projects Agency Network). Their aim was to connect their three research facilities to share the data between them. The first application created for ARPANET was Email, and it was so popular that many other defence research and educational institutes were linked to the network and used the facility (Mowery and Simcoe, 2002). Then there was this TCP/IP data networking communication protocol which was developed and standardised for communications across the computer networks. It was this facility which paved the way for more people to join the network with diverse hardware and operating systems which evolved into a larger network world wide i.e. Internet (International Network). Although the Internet was evolving into a big network but its use was limited to researchers, computer scientists and networking engineers. But the situation prevailed until an application was developed in 1991 and called as WWW (World Wide Web) or Web. Hors et al, (1999) in the specifications of HTML describes World Wide Web as “network of information resources”. And it requires three components to access these resources publicly.
1. URL (Universal Resource Locator). It is a unique address through which an HTML document, image, program, etc can be identified and accessed over the Internet.
2. HTTP (Hypertext Transfer Protocol). It is a document retrieval protocol used to access the resources over the web.
3. HTML (Hypertext Mark-up Language). It is a document formatting language responsible for creating and formatting the web pages with text, images and hyperlinks, which can be displayed in a web browser over the Internet.
With Internet and web as a medium to dissipate information to unthinkable locations has allowed the development of new way of presenting the tourism services information to the tourists both domestically and internationally. This medium was more responsible in making this world an Information Age, which can be accessed by many people together all around the world (Fesenmaier et al, 2002). Many of the tourist departments in the world adopted this technology to present the attractions, services and facilities they offer. This is a very good and a cost effective means of marketing their city tourist activities. The present tourism industry regards Internet as a significant tool in advertising a city’s tourist activities to the whole world (Ishida, 2002). The Hyderabad city tourist activities were also published and advertised over the Internet by Andhra Pradesh department of tourism. Internet provided a way to publish the tourist information over the web which can be accessed anywhere in the world through proper means. The technology gained popularity among the public or the users as it was more convenient, time saving and independent to use without

”Explore Hyderabad” – An Interactive Web-based GIS Application Prototype.
27
depending on any individual like travel operators, etc. The tourism industry involves many direct selling business segments such as hotel and transportation companies which had to pay to the third parties for advertising or conveying on their behalf to the customers. But the Internet enabled those direct sellers to enter the market eliminating third party role and selling their services or products directly to the customer (Information Economy Report, 2005). The figure 2.3 below shows the different tourism distribution systems with intermediaries and using the Internet web facility. The Internet paved a way to communicate and market the services and facilities directly to the potential tourists without any other intermediaries.
Figure 2.3: Tourism distribution systems (Information Economy Report, 2005). Using Internet for the purpose of tourism is a recent development and not so popular among the people of India (Sinha, 2004). Literacy rate is one of the reasons for the slow adoption rate and usage of technology by the common man in India. But talking about the international countries such as US and Europe which are the top markets of India in terms of visitors, the Internet diffusion rate is very high. The United States is the largest market in terms of Internet users (Bristow, 2003) (Puhretmair et al. 2002) (Staab & Werthner, 2002) (Information Economy Report, 2005). It constitutes 23 per cent of the world’s internet users with a diffusion rate of 55.58 per cent (Information Economy Report, 2005). As the Internet rate is higher in US and other European countries, the medium of Internet and Web can be used efficiently and effectively to market and attract more tourists towards the city of Hyderabad. The present web site offer more textual information to the user which is quite boring and exhaustive to search through. Although the website displays much information, but it is of less use due to the issues such as extensive information. The user has to search through a number of hyperlinks before reaching to their required information. If the user looses interest and moves on to another thing, then the basic idea of advertising the tourist facilities and giving information to the prospective tourist through the web and Internet gets invalidate here itself. Further, tourism is an aspect which can be understood in a better way through the use of maps. As it involves far and unfamiliar destinations, maps prove to be a great tool in understanding the geographic locations and giving the tourists an idea of where they are going to visit. Therefore, the tourism department displayed static maps on their website for the tourists. The static maps were same like pictures that had to be printed on a paper and navigated manually to search for the required information. This also did not proved to be a very effective way to satisfy the tourist. Here comes the GIS processed spatial data to

”Explore Hyderabad” – An Interactive Web-based GIS Application Prototype.
28
fit in and enhance the web site by providing dynamic and interactive maps to the tourists and help them in searching the required information in a more appealing and satisfying manner.
2.3.2 GIS Enhanced Tourism Web Site O’Connor (1999) describes four levels of tourism Destination Management System (DMS) as illustrated in figure 2.4. Level one being the basic and most important, as it involves giving information to the tourists about the destination and services. It will act as an “electronic brochure” that can convince the tourist to visit the destination. The U.N’s Information Economy Report (2005) states that “Internet is the cheapest and quickest form of promoting
Figure 2.4: Levels in Destination Management System (O’Connor, 1999) tourism offers” of developing countries i.e. can act as a medium to deliver the electronic brochure. It will save costs and increase their share of profit by promoting and trading services or products directly to the customers, provided they have an effective website. As the visits of tourists are determined by the attractiveness of a region, the presentation of the attractiveness must be done in a compelling way so that the tourist gets convinced to visit the place. As the tourism activity involves many businesses, the value chain starts from identifying the customers which can be done by presenting the attractiveness of destination in an interactive manner (Kumar, 2003). Figure 2.5 from Kumar (2003) categorizes the services into “A” & “B” categories that needs to be provided to the tourist. The elements in category “A” are necessary for promotional and developmental aspects such as inducing and attracting the tourists to bring them from the place of their origin to the region of destination. The category “B” includes the activities involved in serving the tourists once they reach the destination. The current situation of tourism in India is such that they are more focussed on activities related to category “B” i.e. after the tourist arrives in a region of country. But they are behind in practising and delivering the elements of the category “A”. The author points to the “glaring nature” and the inability of the Indian tourism websites to deliver the information related to category “A” to the international tourists. The Andhra Pradesh tourism website showcasing Hyderabad city as a tourist destination is an example of such situation. The website gives textual information with few static maps of the city, which is not enough to attract the tourists towards the city.

”Explore Hyderabad” – An Interactive Web-based GIS Application Prototype.
29
Figure 2.5: Categories of tourism services A & B (Kumar, 2003).
In the above scenario it is necessary to pay attention to the caution given by Information Economy Report (2005) to the developing countries that Internet & Web technologies are an opportunity as well as a challenge in itself for them. They should utilise the medium in an effective manner to gain profits from it. The tourism website is a vital asset in promoting a regions tourism activity. It should be supported by high quality content and functionalities. The customers are interested in looking for information on web that is more customized, flexible and supported by “technological innovations”. Tourism websites enhanced with GIS spatial data is a latest and significant development to facilitate the customers with information and thus increase marketability of ones region. There is a great enthusiasm seen in the public users in using such kind of systems which allows in browsing the spatial data. Tsou (2005) refers to a recent survey report released by ComScore Network and states the increase in the huge market of Internet GIS services and online map users. In May 2005, the U.S., visitors to Mapquest.com belonging to Time Warner has been estimated at 43.7 million. Yahoo maps has attracted around 20.2 million users while Google maps was accessed by 6.1 million and MSN MapPoint developed by Microsoft has a visitor hit figures of 4.68 million visitors. The figures provided, substantiates the popularity of the Internet GIS services among the people. Although the above figures belong to the search engines but it shows how curious the people are in using such kind of services related to online maps. The GIS data can improve the quality and level of tourist information presentation on the web by providing the spatial data to be browsed rather than searching the traditional text content (Lu & Lu, 2004). An application called “Explore Dubai” was developed by Dubai government to promote and showcase its tourism activities as well as utilities for its citizens. The Dubai municipality generated around 35 layers of data which was made available online to the citizens and other tourists around the world. The application provided few
Tourism Services
CATEGORY “A” 1. Knowledge of * Tourist place & their attractiveness. * Availability of proper - Accommodation - Transport / carrier - Food - Accessories * Money transfer facilities / banks * Booking / reservation 2. Assurance of the * above arrangement * safety/security 3. Helps and guidance in case of Exigencies.
CATEGORY “B” 1. Actually providing on their arrival at different places, the facilities of
- Accommodation - Food - Transport - Communication - Money exchange facility
2. Providing facilities for site seeing / shopping etc. 3. Providing timely guidance for any change in programme needed on account of emergency. 4. Assistance of interpretation to overcome problems arising on account of difficulties in language barriers.

”Explore Hyderabad” – An Interactive Web-based GIS Application Prototype.
30
functionalities such as finding an address in the city; finding facilities like famous landmarks, hotels, restaurants, etc; using the public transport facility and also emailing or printing the maps for the users. The application developed received tremendous response from the visitors as well as the citizens. (Dubai, 2006) Durham County Council’s GIS system called as “Online Mapping Service” which can be seen in figure 2.6 was also developed to promote tourism, which is also being utilized by the citizens. It consists of more than 70 layers of GIS data like hospital locations, coffee shops, offices, etc which was made available to the public on the web. The application developed was simple and made in such a way that even a non-GIS professional can use it. Apart from zooming and panning, a function called as “My Nearest” is provided which helps the user to find the nearest facilities around a specific point of location by giving the distance. The online application is still being enhanced with new added functionalities to explore the maps. (Durham, 2006) A similar kind of application was
Figure 2.6: Durham County Council’s GIS Online Interactive Mapping Service (Durham, 2006).
also developed by the government of Qatar. The GIS department of Qatar i.e “Center for GIS” was responsible in developing the GIS data for the entire region. Presently 16 government agencies in the country use the developed GIS data in their day to day activities. The same data was used and an application called as “Explore Qatar” (see figure 2.6) was developed to promote tourism (Ghanim, 1999). The application provided services such as finding an address, locating streets and various landmarks (GISQatar, 2006). Another example is the web atlas which was developed to disseminate spatial data for the island of San

”Explore Hyderabad” – An Interactive Web-based GIS Application Prototype.
31
Andres in Colombia to promote tourism in the area using the GIS as a tool. The application also used the GIS spatial data which is more appealing and realistic for the user to understand, which may in-turn attract the user to visit the region (Salamanca, 2004). In all the above applications, the GIS spatial data was published online using ESRI’s Internet Map Server called as ArcIMS. These Internet map servers are responsible in managing, dispatching and publishing the dynamic spatial content over the web to the end user.

”Explore Hyderabad” – An Interactive Web-based GIS Application Prototype.
32

”Explore Hyderabad” – An Interactive Web-based GIS Application Prototype.
33
3 Internet Map Server This chapter gives an overview on the Internet Map Server technology and the ArcIMS architecture. Also an emphasis is on the advantages of using the server software i.e. ArcIMS for providing online maps to the users.
3.1 Internet GIS – Basic Components It is necessary to know the four basic components involved in the Internet GIS when developing a web based GIS application. There four components of Internet GIS are listed below (Figure 3.1)
1. Client, 2. Web Server with Application Server, 3. Map Server, and 4. Data Server.
Figure 3.1: Basic Components of Internet GIS (Peng & Tsou, 2003)
3.1.1 Client The client is the Web interface or browser through which the end user can interact with the spatial data in Internet GIS. A typical Web interface with HTML and forms is a simple client of Internet GIS. As this type of interface posses very limited user interactivity, as a result it is not possible for the users to interact with the spatial objects and maps. In order to overcome this problem and provide the user with an interface to interact with the spatial data, alternative clients using Web add-ons were developed. These types of alternative interactive clients include dynamic HTML and client-side applications such as plug-ins, Java applets, and ActiveX controls (Peng & Tsou, 2003).
3.1.2 Web Server and Application Server Web server and application server constitutes the second component of the Internet GIS. A Web server is also called as the HTTP server. The HTTP server is responsible for replying to the requests from the clients. The Web server can reply in several ways to the client by sending the existing HTML documents or the map images; or by sending Java applets or ActiveX controls; or by passing requests to and invoking other programs that can process the inquiry. Application server receives requests from the Web server. When the Web server receives a request that needs to be processed by some other program, it passes the requests to the Application Server which in turn searches for the respective applicable application program e.g., map server, and then passes on the request to process it. The application server acts as a bridge or connector between the Web server and the map server.

”Explore Hyderabad” – An Interactive Web-based GIS Application Prototype.
34
3.1.3 Data Server A data server is responsible for maintaining the spatial as well as non-spatial data in a relational or non-relational database structures. The data server responds to the requests sent through the SQL by a client or the map server for the required data, and thus also called as an SQL server.
3.1.4 Map Server “Map server is a major workhorse component that fulfills spatial queries, conducts spatial analysis, and generates and delivers maps to the client based on the user’s request” (Peng & Tsou, 2003). The map server performs the GIS functions or services such as query filtering, data extraction, geocoding, spatial analysis, map-making, etc. Output from the map server is either of the two forms i.e. feature data sent to the client for manipulation by the user or a simple map image in a graphic format. There are many web mapping servers and image servers running around the world.
3.2 ArcIMS Architecture – An Overview In the year 2000, Environmental Systems Research Institute, which is one of the major GIS vendors today, developed a standalone Web mapping package called as ArcIMS (ArcView Internet Map Server). It is engineered to publish maps, data and metadata on the web. ArcIMS is based on a multi-tier architecture and posses its own mapping engine. The ArcIMS architecture consists of presentation, business logic and the data tiers which are illustrated in the figure 3.2 below.
Figure 3.2: ArcIMS architecture overview (ESRI, 2004)

”Explore Hyderabad” – An Interactive Web-based GIS Application Prototype.
35
3.2.1 Presentation Tier The presentation tier provides an interface called as a Viewer for the users to access, view and analyse the spatial content. In simple words, a viewer enables the client (user’s browser e.g. Internet Explorer) to make a request for a service residing at an ArcIMS site so that the ArcIMS site processes it and send the result back to be displayed (Figure 3.3). ArcIMS supports two types of client viewers:
1. HTML Viewer 2. Java Viewers
Figure 3.3: Communication between Client Viewers and the Server i.e. Business Logic Tier.
3.2.1.1 HTML Viewer This type of viewer makes a thin client system, wherein the user has only the interface to communicate with the server and display the results. All the processing and manipulations are done at the server side. The viewer is created using HTML, DHTML, and JavaScript. It supports ArcMap Image Service or the Image Service and displays only one image at a time. The requests and responses are generated using JavaScript. The client browser should be Internet Explorer or Netscape version 4.x or higher.
3.2.1.2 Java Viewers The Java Viewer constitutes a fat client system, in which the client can perform some tasks by itself rather than requesting for the service from the server side. The client can use the local data with the server data and display the results on the same viewer. The viewer is written in Java language and can be embedded in the browser as a Java 2 applet. It supports Image, ArcMap Image, and Feature Services. There are two types of Java Viewers i.e. Java Custom and Java Standard. Both the viewers are same in the functionality but the Java Custom Viewer uses JavaScript in communicating with the applets. These types of Java Viewers are more suitable for the Intranet applications that can afford fast network speed and client side processing rather than Internet applications.
3.2.2 Business Logic Tier The business logic tier consists of server side components that are necessary to run services and process responses and requests to and from the clients. The components include the Web Server, Application Server Connectors, ArcIMS Application Server, and ArcIMS Spatial Server. The communication between the components is in the form of ArcXML. Web server is the first component which comes in direct contact with the Viewer upon a request to the ArcIMS. The request is passed through one of the connectors to the Application Server, which

”Explore Hyderabad” – An Interactive Web-based GIS Application Prototype.
36
in turn forwards the request to the Spatial Server for the required processing. The communication between the components is illustrated in the following figure 3.4.
Figure 3.4: Components of Business Logic Tier (ESRI, 2004).
3.2.2.1 Web Server A Web server is responsible for managing the HTTP requests by passing the request to the respective service or server, and also responding to them with the results i.e. serving web pages. It is necessary for the ArcIMS to work and it is the component which directly interacts with the client’s Viewer. Although it is not included with the ArcIMS suite, but needs to be installed in order to work with ArcIMS.
3.2.2.2 Application Server Connectors Application Server Connectors are the essential components in ArcIMS communication scheme, responsible for providing a pipeline in connecting the Application Server to the Web server. There are many Application Server Connectors such as Servlet Connector, Cold Fusion Connector, Active X Connector and .NET Link Connector. Out of these, Servlet Connector is the most important and default connector for ArcIMS and available on all the supported platforms. Servlet Engine is used as a communicating link between the Web server and the Application Server. Cold Fusion Connector processes the requests coming from the Cold Fusion Server and then passes on the request to the Application Server. ActiveX Connector, which is available only on Windows, handles the requests coming from Active Server Pages or other ActiveX applications. .Net Link, consisting of classes and functions to connect to the Application Server, is a valuable connecter in developing applications on the .Net platform. It is also available only on Windows. Similarly, Java Connector, which is a set of Java Beans, allows the developers to create client and server applications, custom servlets, and JSP applications. Contrary to .Net Link connector, Java Connector is available on all supported platforms.
3.2.2.3 ArcIMS Application Server Application Server is a background process and acts as a load distributing agent for the incoming requests. The Application Server holds an inventory of all the services running on the Spatial Servers, so that it can direct the incoming requests to the appropriate service.

”Explore Hyderabad” – An Interactive Web-based GIS Application Prototype.
37
Application Server can handle the requests only in the form of ArcXML, and therefore all the incoming requests should be translated into ArcXML before reaching the Application Server.
3.2.2.4 ArcIMS Spatial Server ArcIMS Spatial Server is the workhorse and the backbone of the ArcIMS. It is responsible for processing the requests and dispatching the maps with the attribute data to the client. The Spatial Server consists of seven server types supporting different functionality. The seven different types of servers are described below.
• Image Server: This type of server generates and dispatches the maps to the client viewers as JPEG, PNG or GIFF images. Cartographic images can be generated from shape file, ArcSDE data sets, and other supported image formats.
• Feature Server: Feature streaming, a temporary compressed format, sends features from shapefiles and ArcSDE data sets to a Java Applet in a client Web browser. It allows functions such as client side labeling, changing the map appearance, map tips, and client side spatial selection.
• Geocode Server: The Geocode Server performs geocoding function which locates points on a map based on address, intersection or place name.
• Query Server: The Query Server processes the query requests from the clients and returns the attribute data for spatial and tabular queries. The Query Server is required when using an Image Service for handling the attribute data.
• Extract Server: The extracted data from shapefiles and ArcSDE layers is returned in a shape file format to the client.
• Metadata Server: The Metadata Server provides information about the maps, data and services.
• ArcMap Server: It is similar to the Image Server except that ArcMap Server generates images using ArcGIS ArcMap document as the input.
The above mentioned servers are accessed by four types of services i.e. Image, ArcMap Image, Feature and Metadata Service. These map services are the processes running on the ArcIMS Spatial Server which define the contents and appearance of the map. Image Service uses the Image Server and produces a GIF or JPG image to be displayed on a request from the client. The service can also access the other servers like Extract, Geocode, and Query if required. Feature Service uses the Feature Server. It sends the data in a bundled form to the client rather than the image itself. ArcMap Image Services use the ArcMap Server and sends the Spatial Server generated map to the client as an image. Metadata Services use the Metadata Server for searching the documents concerning mapping, data and services. Every Map Service is assigned to a Virtual Server. A Virtual Server combines one or more Spatial Servers and responsible to administer and manage the load distribution among the Spatial Servers.
3.2.3 Data Tier The data tier consists of the spatial as well as corresponding attribute data. The data is stored in file servers that contain Image files, shape files, as well as Oracle based server and SDE.

”Explore Hyderabad” – An Interactive Web-based GIS Application Prototype.
38
3.2.4 External Supporting Components for ArcIMS There are few components that are external to ArcIMS and necessary to run it successfully. These components provide a platform and a foundation for a working ArcIMS site. The components include Web Server, Java Virtual Machine, and a Servlet Engine. The figure 3.5 illustrates the external components for ArcIMS.
Figure 3.5: External Components for ArcIMS. Web Server is necessary and acts as an intermediary channel by accepting the requests from HTTP clients and passing it to the appropriate application. It also responds to the client with the results. Java VM (Virtual Machine) comes with the JRE (Java Runtime Environment) or JDK (Java Development Kit). Due to the reason that many of the ArcIMS components are based on Java, therefore in order to run those, it requires Java VM which provides a basic application programming interface. ArcIMS also needs a Servlet Engine that provides a link between the Java VM and a Web Server.

”Explore Hyderabad” – An Interactive Web-based GIS Application Prototype.
39
4 System Design and Implementation This chapter describes the system development model to be followed and the system requirements necessary for the application system development.
4.1 Prototype System Development Life Cycle GIS based project development consists of components such as data development, data organization and application development that are not similar and different from the standard software development projects. But still there exists similarities in the development process in assessing user requirements, system requirements and other aspects of development (Wahi, 2002). There are many different methodologies of software development. The prototyping model is one of those and provides the feedback from the user during the development process rather than at the end. This will enable the developer to validate the requirements and specifications before implementation of the system which will save the resources allotted for the project in case if the result is undesirable. Therefore, prototyping lifecycle process model is followed to develop the Web-based GIS application i.e. Explore Hyderabad. The prototyping lifecycle process model can be seen in the following figure 4.1.
Figure 4.1: Prototyping lifecycle process model (Luqi & Zhu, 1998)
The prototype life cycle starts with the activity of analysing requirements, followed by prototype construction, execution and finally implementation. The requirement analysis determines the initial version of the requirements that are taken as input in designing the prototype. Then a prototype is designed based on the requirements which is then executed and opened for the user feedback. This activity of taking the user feedback encourages in building and implementing an improved system. At this stage it can also be optimised for more improvements in the application by going back and analysing the requirements.
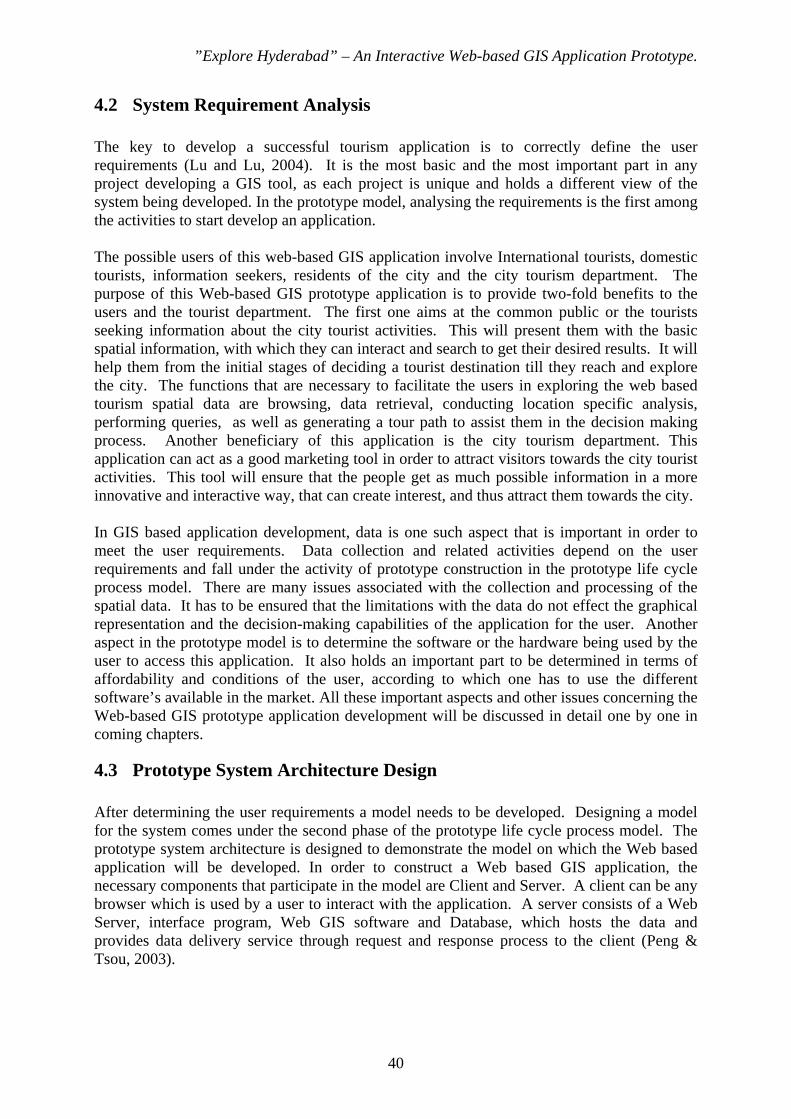
”Explore Hyderabad” – An Interactive Web-based GIS Application Prototype.
40
4.2 System Requirement Analysis The key to develop a successful tourism application is to correctly define the user requirements (Lu and Lu, 2004). It is the most basic and the most important part in any project developing a GIS tool, as each project is unique and holds a different view of the system being developed. In the prototype model, analysing the requirements is the first among the activities to start develop an application. The possible users of this web-based GIS application involve International tourists, domestic tourists, information seekers, residents of the city and the city tourism department. The purpose of this Web-based GIS prototype application is to provide two-fold benefits to the users and the tourist department. The first one aims at the common public or the tourists seeking information about the city tourist activities. This will present them with the basic spatial information, with which they can interact and search to get their desired results. It will help them from the initial stages of deciding a tourist destination till they reach and explore the city. The functions that are necessary to facilitate the users in exploring the web based tourism spatial data are browsing, data retrieval, conducting location specific analysis, performing queries, as well as generating a tour path to assist them in the decision making process. Another beneficiary of this application is the city tourism department. This application can act as a good marketing tool in order to attract visitors towards the city tourist activities. This tool will ensure that the people get as much possible information in a more innovative and interactive way, that can create interest, and thus attract them towards the city. In GIS based application development, data is one such aspect that is important in order to meet the user requirements. Data collection and related activities depend on the user requirements and fall under the activity of prototype construction in the prototype life cycle process model. There are many issues associated with the collection and processing of the spatial data. It has to be ensured that the limitations with the data do not effect the graphical representation and the decision-making capabilities of the application for the user. Another aspect in the prototype model is to determine the software or the hardware being used by the user to access this application. It also holds an important part to be determined in terms of affordability and conditions of the user, according to which one has to use the different software’s available in the market. All these important aspects and other issues concerning the Web-based GIS prototype application development will be discussed in detail one by one in coming chapters.
4.3 Prototype System Architecture Design After determining the user requirements a model needs to be developed. Designing a model for the system comes under the second phase of the prototype life cycle process model. The prototype system architecture is designed to demonstrate the model on which the Web based application will be developed. In order to construct a Web based GIS application, the necessary components that participate in the model are Client and Server. A client can be any browser which is used by a user to interact with the application. A server consists of a Web Server, interface program, Web GIS software and Database, which hosts the data and provides data delivery service through request and response process to the client (Peng & Tsou, 2003).

”Explore Hyderabad” – An Interactive Web-based GIS Application Prototype.
41
Figure 4.2: Prototype System Architecture Design for Explore Hyderabad The above figure 4.2 illustrates the architecture of the Web based GIS application i.e. Explore Hyderabad. This prototype model is based on and fits into the three-tier architectural framework of ESRI’s ArcIMS 9.1 (refer chapter 3 for details). In ArcIMS the “Client” is represented in the Presentation tier, the “Server” comes under the Business tier and Data Storage comes in the domain of Data tier. This model provides advantages at both ends i.e. Client side as well as the Server side. Thin client architecture was used at the Client end which uses an HTML Viewer that is run by DHTML and JavaScript. DHTML and JavaScript enable the application to be accessed on systems which are not highly configured. As the application can be accessed by many people over the Internet and therefore HTML viewer is recommended for such type. It also eliminates the need to install additional plug-ins at client side which is necessary for Java Viewers. The Server side follows the business logic of ArcIMS architecture and also includes its components. Chapter three can be referred for a detailed discussion on these components. Once the prototype model was designed it is ready for the implementation phase. The prototype implementation phase involved installing all the necessary server side components. Microsoft’s Internet Information Services 5.1 (IIS) was installed as a Web Server, J2SE JRE 1.5.0.6 & J2SE JDK were installed as Servlet Engine while ServletExec 5.0 was installed for the ArcIMS Servlet Connector.

”Explore Hyderabad” – An Interactive Web-based GIS Application Prototype.
42

”Explore Hyderabad” – An Interactive Web-based GIS Application Prototype.
43
5 Data Acquisition for “Explore Hyderabad” This chapter deals with the GIS database development necessary for the application. The GIS database development comprises the second module of the research model as illustrated in chapter one. The various steps, sources and methods used for collecting and updating the data; as well as the derived data sets available at the end have been discussed.
5.1 GIS Database design According to the New York state Archives GIS development Guide, database planning is the single most important activity in any GIS based project. It is one of the most valuable assets for any GIS analysis in a project and therefore forms an integral part in the process (Jones, 1997). An updated and an accurate database is necessary in order to give the best results to the users. Chawla & Shekhar (2003) mentions the three classes of GIS or spatial database users as the business users, scientific users and the common public user. Our application i.e. Explore Hyderabad is intended for the public users as they are more interested in using spatial data to personalise their experience and interaction on the worldwide Web.
5.1.1 Tourism Data Classification Tourism industry is data demanding (Yojae & Kwang-Hoon, 2004) as it consists of many other enterprise services in itself. In this research, the acquired tourism data was categorised (see figure 5.1) (Ayeni et al, 2004), and represented in form of layers or sub layers in the designed GIS database. The data collected under these categories was then correlated to their spatial locations on the map.
Figure 5.1: Classification of Tourism Data
5.1.1.1 Cultural Tourism This category constitutes the traditional, cultural and historical attractions of the city. It also includes the various festivals or any other regular events held every year in the city.
5.1.1.2 Nature Tourism It includes the natural attractions such as the mountains, rivers, lakes, national parks or sanctuaries, botanical and zoological gardens.
5.1.1.3 Tourists Facilities & Services This category comprises of those facilities and services which a tourist requires during planning, managing and visiting the city. It includes services such as the hospitals in case of emergency, or pharmacies, hotels and restaurants for living and dining, clubs and pubs, banks, travel agents, etc.

”Explore Hyderabad” – An Interactive Web-based GIS Application Prototype.
44
5.2 Hardware and Software The GIS database for Explore Hyderabad is developed with the help of Environmental Systems Research Institute’s (ESRI) ArcGIS suite. ESRI use the term geodatabase, short form for geographic database, for referring to the spatial or GIS database. There are two types of geodatabases i.e. personal geodatabase and multiuser geodatabase, based on number of users and size of the data. Personal geodatabase stores data in form of a collection of files in a file system such as coverages, shapefiles, grids, images and triangulated irregular networks (TINs). It is simple and single user oriented but limited in terms of data storage. If the data is more than 2 GB then an external RDBMS such as DB2, Informix, Oracle or SQL Server is required. These come under the category of multiuser geodatabases. Multiuser geodatabase stores the data as a collection of tables in a Relational Database Management System (RDBMS). This type of database can be accessed by many users and is capable of handling large amounts of data. In the context of Explore Hyderabad, shapefiles were implemented in the form of a personal geodatabase as the available data was not large in size and thus manageable in the shape file attribute tables.
5.3 Flow of Data into the GIS Database Due to the unavailability of the accurate and required data for the project from the city authorities and other agencies, existing datasets were bundled together to build a functional database and avoid the delay. The following diagram (figure 5.2) illustrates the different sources and the flow of data into the GIS when developing a working database for the project.
Figure 5.2: Flow of data into the GIS Database

”Explore Hyderabad” – An Interactive Web-based GIS Application Prototype.
45
5.4 Primary Data Collection Primary data collection involved collecting the spatial as well as non-spatial data. The data was gathered from many different sources (see figure 5.2). The Hyderabad digital road map was acquired by a city based company which originally acquired the base map from HUDA and Survey of India. The road map was digitized by the company based on a topographical city map of scale 1:25,000 for NW, NE, SW, SE directions. The road map also includes the speed limits on roads, road names and the information about one-way road segments. But this information is limited to a few road segments in the road network. The road network data is represented as the line feature in the layer map. Bus route data was acquired from Andhra Pradesh Road Transport Corporation (APSRTC) in the form of a text file. Non spatial data such as the images, information and history about tourist attractions, services, facilities was acquired from the websites of Indian Ministry of Tourism and Department of A.P. tourism. Reviews on the user interests provided the input in regard to the data they may be interested in when searching for the tourist information. Further, the data upon hotels in Hyderabad was collected from the official website of All India Group of Hotels. The other sources used to collect non spatial data were Internet websites, newspapers, travel guides, brochures, etc. Below is a list of data sets available for the GIS database in the form of a table (Table 5.1) as well as illustrated in ArcMap (Figure 5.3). S.No Data Set Type Description Remarks 1 Education Point Only the name of the establishment is
mentioned. Unclassified information about educational institutions without their addresses.
2 Government Offices
Point Location of the local and central government offices.
Unclassified and few non-governmental offices are also present.
3 Hospitals Point Consists of hospital names and categorized into government or public hospitals.
Addresses of hospitals are not present.
4 Hyderabad Road Network
Line The road network consists of major, minor and highway roads. Speed limits and one-way roads are also mentioned.
All the roads are not named and labeled. The speed limits and the one-way data is available for only few road segments.
5 Lakes Polygon Lakes in the city. - 6 Railway Line Line Railway tracks in the entire city. - 7 River Polygon River Musi passing along the city. - 8 Stations Point Contains a list of bus and railway
stations in the city. Unclassified list of stations.
9 Tourist Point List of historical and modern monuments.
Unclassified list of tourist attractions without any addresses.
Table 5.1: List of available data sets before data processing.

”Explore Hyderabad” – An Interactive Web-based GIS Application Prototype.
46
Figure 5.3: Available data of Hyderabad city.
5.5 Data Preparation The primary data collected for the database was required to be edited. For the purpose ArcGIS suite applications i.e. ArcCatalog and ArcMap were used. ArcCatalog was used for viewing the metadata, for creating new shapefiles and managing the spatial data assets. ArcMap was used for the actual editing purpose. It is meant for the design and interaction by viewing, editing or analysing the geographical data in a visual context. The digital road map did not have all the names of the road segments in its attribute table. Therefore, the names and labels were edited and added into its attribute table for few more roads which were necessary in the project. This road network layer was used as a base map to add other new layers into the database. The bus route data from APSRTC was also included into the roads database. The city bus data is in the form of bus numbers on each route. Therefore, each bus number was stored into the database and associated with the corresponding road segments on which it runs. The other new layers were also compiled and added according to the classification of tourism data (Figure 5.1). The new layers were created in the form of shapefiles and each attraction or facility was represented as a point feature. The feature’s

”Explore Hyderabad” – An Interactive Web-based GIS Application Prototype.
47
attribute table was then updated with details like its name, address and the URL of the image, if any. The features in each layer were also categorized according to the different types available and given a category code. On the basis of the categories the symbology was also defined in the layers.
5.6 Resultant GIS Database The data was ready to use after editing the existing layers as well as adding new layers to the database. The resultant data sets available for the application development can be seen below in the figure 5.4 and table 5.2.
Figure 5.4: Resultant Dataset for Explore Hyderabad.

”Explore Hyderabad” – An Interactive Web-based GIS Application Prototype.
48
S.No Data Set Type Categories Data Format 1 Banks & Other Financial
Institutions Point 1. Money Exchange
2. Bank Shape file
2 Education Point 1. University 2. College 3. School
Shape file
3 Government Offices Point - Shape file 4 Hospitals Point 1. Government
2. Private Shape file
5 Hotels Point 1. Five Star 2. Four Star 3. Three Star
Shape file
6 Hyderabad Road Network Line 1. Major 2. Minor 3. Highway
Shape file
7 Lakes Polygon Shape file 8 Leisure spots Point Shape file 9 Monuments Point 1. Historical
2. Modern Shape file
10 Museums Point - Shape file 11 Parks & Sanctuaries Point 1. Leisure
2. Wild Life 3. Others
Shape file
12 Petrol Stations Point - Shape file 13 Pharmacies Point - Shape file 14 Police Stations Point - Shape file 15 Pubs and Bars Point 1. Pub
2. Bar Shape file
16 Religious Centers Point 1. Mosque 2. Temple 3. Chapel 4. Others
Shape file
17 Restaurants Point 1. Hydrabadi 2. Andhra 3. Others
Shape file
18 River Polygon - Shape file 19 Shopping Malls Point 1. Mall
2. Bazaar Shape file
20 Stadiums Point 1. Cricket 2. Hockey 3. Football 4. Others
Shape file
21 Stations Point 1. Bus station 2. Major railway station 3. Minor railway station 4. Airport
Shape file
22 Theaters Point 1. Cinema 2. Others
Shape file
Table 5.2: Available data sets after data processing.
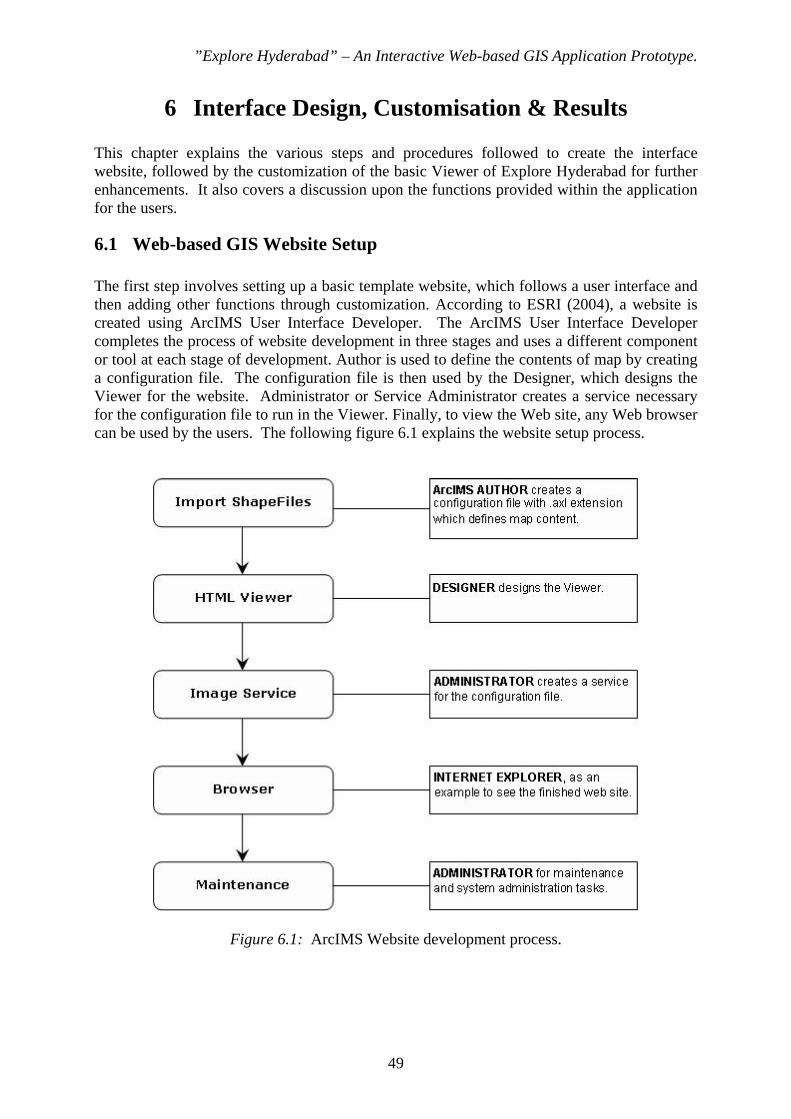
”Explore Hyderabad” – An Interactive Web-based GIS Application Prototype.
49
6 Interface Design, Customisation & Results This chapter explains the various steps and procedures followed to create the interface website, followed by the customization of the basic Viewer of Explore Hyderabad for further enhancements. It also covers a discussion upon the functions provided within the application for the users.
6.1 Web-based GIS Website Setup The first step involves setting up a basic template website, which follows a user interface and then adding other functions through customization. According to ESRI (2004), a website is created using ArcIMS User Interface Developer. The ArcIMS User Interface Developer completes the process of website development in three stages and uses a different component or tool at each stage of development. Author is used to define the contents of map by creating a configuration file. The configuration file is then used by the Designer, which designs the Viewer for the website. Administrator or Service Administrator creates a service necessary for the configuration file to run in the Viewer. Finally, to view the Web site, any Web browser can be used by the users. The following figure 6.1 explains the website setup process.
Figure 6.1: ArcIMS Website development process.

”Explore Hyderabad” – An Interactive Web-based GIS Application Prototype.
50
• ArcIMS Author: The first step involves importing all the shapefiles in a mapping environment which is provided by an ArcIMS Author. An Author creates a map to be displayed on the Web site by adding data layers, setting the layer symbology, creating stored queries, and then saving map to a configuration file. A Configuration File is used as input to an ArcIMS service. It is saved as an .axl file.
• ArcIMS Administrator: An ArcIMS Service called as Image service is created using an Administrator. This step is termed as starting an ArcIMS Service. Creating a new service involves using the configuration file generated by the Author as input to an ArcIMS Service. On receiving a request from a client for an ArcIMS Service, the ArcIMS Service follows the information in the map configuration file and responds with the data to the client.
• ArcIMS Designer: After completing the authoring of map and publishing it as a service, the platform is ready to build a Web site or viewer. The designer runs as a wizard and enables us to select the service, the viewer and the different tools to be included in the website. At this point of time, a basic GIS web page starts running on the Server.
6.2 User Interface HTML Viewer has been developed for the user interface as it supports a thin client architecture and convenient for users of Web based Internet applications. Plug-ins are not required at the user site to run the application and therefore it is easy to access. As already mentioned, DHTML and JavaScript forms the base of an HTML Viewer and therefore it consists of a set of DHTML and JavaScript files. The following diagram (figure 6.2) illustrates the layout view of HTML Viewer user interface. Size of the frame and the corresponding HTML file that fills in each frame can be seen in the layout.
Figure 6.2: Layout view of the basic user interface (HTML Viewer). (ESRI, 2004)

”Explore Hyderabad” – An Interactive Web-based GIS Application Prototype.
51
There were a total of 29 HTML (.htm) and 16 JavaScript (.js) files that were created to develop the user interface of Explore Hyderabad. The following figures 6.3 (a) and (b) shows the HTML and JavaScript files used for developing “Explore Hyderabad”.
Figure 6.3 (a): HTML Files. Figure 6.3 (b): JavaScript Files.
Figure 6.4: Basic Web site of Explore Hyderabad.

”Explore Hyderabad” – An Interactive Web-based GIS Application Prototype.
52
The HTML files generate each frame in the Viewer and the JavaScript files handle and support the actions performed on the Viewer. Default.htm is the first page which runs when the viewer is requested. The images folder consists of the images and icons that are used on the web page for buttons in toolbar and background images. The basic viewer is divided into sections which are called as frames in HTML, are allotted to each specific activity. It includes title bar, layers information, tool bar, legends, overview and a detailed map with the display area for query results. These defined sections can be seen in the above figures 6.2 & 6.4 of HTML viewer.
6.3 Customisation The main goal of this application is to provide a powerful application with a simple and user friendly interface which a user with no GIS experience and knowledge of using the GIS tools should be able to navigate through the system without any confusion. The GIS interface provided by ArcIMS is very powerful yet too complex for an average Internet user. In order to simplify the interface and functionality, customising is required by removing or combining some of the advanced GIS tools so that the tasks for the users become easy and they perform a least number of steps. The basic HTML viewer which came on setting up the website was customised to look different. A banner was displayed in the top frame representing the attractions of the city and the name of the application. The banner was developed using Paint and Ms-Word. The size of the toolbar frame was reduced in order to increase the main map frame display so that the users get a broader picture of the map. The basic HTML viewer provides twenty two (22) tools for navigating the map and performing various functions over it. Some of these tools are complex to operate for a naive GIS user, and therefore, needed to be simplified by combining or removing them according to the user requirements. The tools arranged in two columns were reduced to a single column after eliminating those tools whose functionality was not required to the users. Only the tools which are important and help the users to browse the application were placed in the tool bar. The tools were represented by buttons in toolbar created in Adobe Photoshop. The buttons created are medium sized with a picture representing the functionality but no names are described on them. This was done to accommodate the toolbar in a single column and increase the map display area. But whenever the mouse pointer comes over the tool, respective function is dynamically displayed in the form of a tool tip. All together this application consists of seventeen functions represented by buttons in the toolbar frame. As the application is required for the purpose of tourism and exploring the city locations, and therefore, the tools are divided into the following categories as follows: Map Navigation Tools – Zoom In, Zoom Out, Zoom to Full Map, Zoom to Last Extent
& Move. Attribute Data Retrieval Tools – Identify, Search (Stored Query), Query, Closest
Facility (buffer). Other Tools – Toggle buttons, Measure, Hyperlink, Select Feature, Clear Selection,
Print & Help.

”Explore Hyderabad” – An Interactive Web-based GIS Application Prototype.
53
The list of tools with functionality is described in the table 6.1 below. S.No. Tool Name Function
1 Toggle between Legend and Layer List
Switches on and off between the Legend List and the Layer List.
2 Toggle overview map Switches on or off overview map. 3 Zoom In To display a larger region of a map. 4 Zoom Out To display a smaller region of a map. 5 Zoom to Full Map Displays full extent of map. 6 Back to Last Extent Displays the last. 7 Move Moves the map in map frame in any direction. 8 Hyperlink It opens another window, if linked to the selected
feature. 9 Identify Displays the attribute data for the selected feature.
10 Query Helps the user to form a query and retrieves the attribute data for them.
11 Search Retrieves the attribute data of features based on category or key words.
12 Measure Calculates the distance from point x to point y. 13 Closest Facility Displays the nearest features of interest around a
selected point for a specified distance. 14 Select Feature Selects one or more features of interest. 15 Clear Selection Clears the selected features. 16 Print Map Creates a hard copy of the map. 17 Help pages An online help guide for the users to operate
“Explore Hyderabad”.
Table 6.1: Description of tools in “Explore Hyderabad” “Map navigation tools” are the basic tools necessary to work with the map i.e. to move it, zoom in and zoom out. “Attribute data retrieval” tools provide the user with the textual data for the requested feature or features. There are four functions which were classified under this category, each of which will be discussed here. The first among them is the Identify feature function which retrieves the feature’s attributes on applying by clicking on it. Search is the function based on Stored Queries created in the ArcMap author. In each layer two stored queries were created and stored which were used to find the information based on the keywords of category or name of the feature. Stored queries are SQL based. Below is an example of an SQL query that will retrieve the attributes of features from “Hotels” layer and also highlights them on the map. SELECT * FROM HOTELS WHERE CAT= [%var%]; The above query will retrieve the data based on the CAT field which holds the attributes of Category. In Hotels layer there are three categories i.e. five, three and two. If a user enters “FIVE” to search the five-start hotels in the city, then it becomes CAT=’FIVE’ in place of CAT= [%var%]. This query retrieves all the five-start hotels in the city and displays them on the map. Another query is created in a similar fashion to retrieve those features that match the hotel name. SELECT * FROM HOTELS WHERE NAME=[%var%];

”Explore Hyderabad” – An Interactive Web-based GIS Application Prototype.
54
Query function is also SQL based. The main difference between this Query and Search’s Stored Query is that in Search the queries are created in the ArcIMS author whereas here the user is given a choice to form there own query to get there desired result. In this Query function the user will can see a list of all the field names in a layers attribute table and therefore, he can perform a search based on any of those field’s. Further, this feature can be used by those who do not know much about the city, as this function lists all the categories or names based on which a search runs. The last function among the list of Attribute Data Retrieval tools is the Closest Facility Search. This function is also called as a buffer. This function is used to find some specific features that fall under a specified proximity around a selected feature. For example, if a tourist plans to eat lunch after watching a movie in a theater, then in this situation, this function can find the restaurants that are within a kilometer or 2 kilometers around the theater where the tourist is going to watch the movie. The distance for search is given by the tourist itself. The “Other Tools” also help the users to operate the application. The Measure tool helps the users to calculate the distance in kilometers between two or more points on the maps. Hyperlink is another function which is very useful for the users in terms of information. In any tourism based application, hyperlinks were always encouraged so that the tourists are given as much possible relevant information. Information regarding the tourist attractions and other websites of restaurants, hotels, etc can be reached using this hyperlink tool. The features that have a link associated with them can be visited using this hyperlink tool. Toggle function is also provided in order to switch on or off between the layer and legend list. The toggle function is also given for the overview map. If the user feels to use the functionality then they can turn it on, otherwise turn it off. Select is an important function when performing a Closest Facility search. Select function enables the user to select by clicking on a feature or by dragging a rectangle around the feature, around which they can perform the facility search. Clear Selection is a very important function and tool for the users to clear the selected or highlighted features on map after performing a query, search or selection. Print option allows the users to create a hard copy of the map. And finally a Help option is provided which act as an instruction manual to operate the GIS application i.e. Explore Hyderabad. The help opens in a separate window upon clicking the Help button. Layers and Legend List is present on the right side in the TOCFrame of application window. Layer list consists of all the layers that were authored and compiled in ArcIMS author for the application. Each layer is provided with two options of Visible and Active. When the map is downloaded for the first time, it is set to display only the layers of road network, railway line, lakes, river, and tourist spots in the city. Therefore, if a user wants to see the features of other layers then one has to manually check the checkbox before the respective layer under the ‘Visible’ column and press the Refresh button. If the user wants to perform functions such as retrieving data, query, search, or any other operations on a visible layer, then it is necessary to make it an ‘Active’ layer by clicking the radio button provided before the respective layer in the ‘Active’ column and again pressing the Refresh button. There are a total of 24 layers in the Layer List, out of which 20 layers were listed visible to operate with and 4 layers were made invisible in the layers list. The Legend List displays the visible layers on map and the corresponding symbol for the layer in the legend list. Further, in regard to display of query results in form of attribute data, field names such as ‘SHAPE’ and ‘ID’, which are not relevant for the users, were hidden from being displayed in the text frame of application window.

”Explore Hyderabad” – An Interactive Web-based GIS Application Prototype.
55
6.4 Results
6.4.1 Enhanced User Interface
Figure 6.5: Displaying the different parts in an enhanced Interface of Explore Hyderabad.
Banner in the Top Frame
Mode Frame
Toolbar Frame
Map Frame
Text Frame displays attribute data
Layer & Legend List
Overview Map
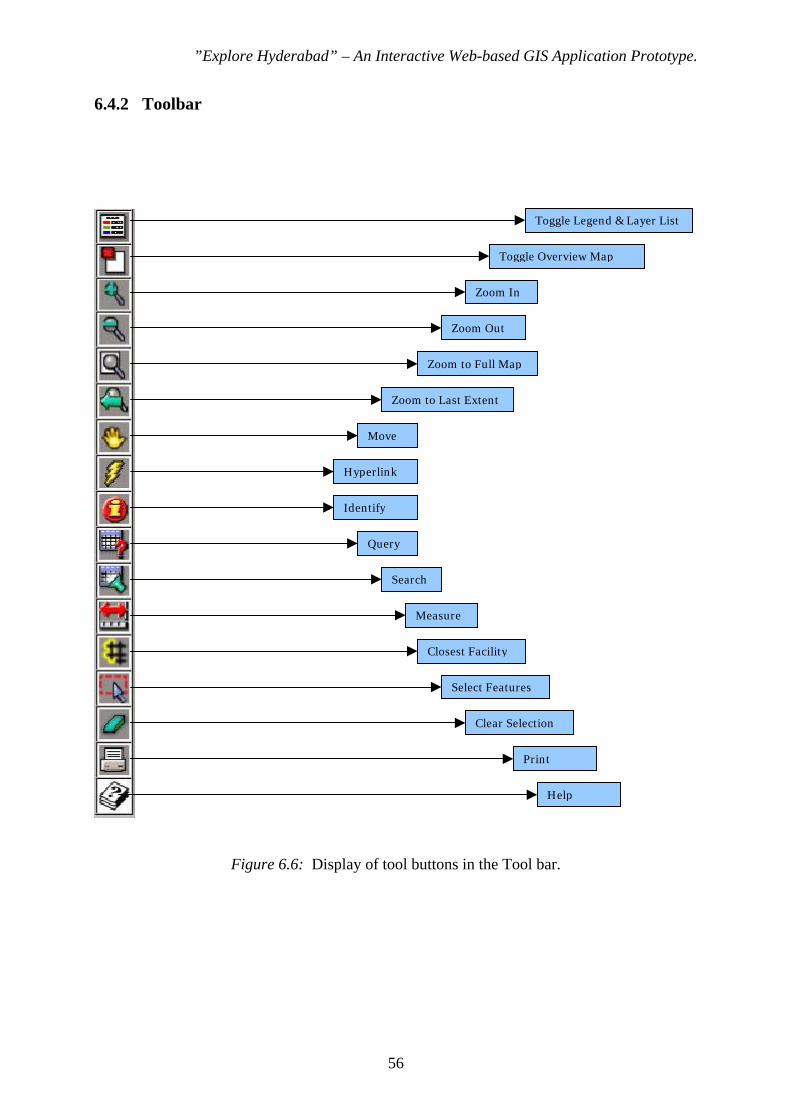
”Explore Hyderabad” – An Interactive Web-based GIS Application Prototype.
56
6.4.2 Toolbar
Figure 6.6: Display of tool buttons in the Tool bar.
Toggle Legend & Layer List
Toggle Overview Map
Zoom In
Zoom Out
Zoom to Full Map
Zoom to Last Extent
Move
Hyperlink
Identify
Query
Search
Measure
Closest Facility
Select Features
Clear Selection
Help

”Explore Hyderabad” – An Interactive Web-based GIS Application Prototype.
57
6.4.3 Toggle Buttons
Figure 6.7: Legend list is visible in the right side of window. Layer list is invisible.
Figure 6.8: Overview map in the upper left corner of map frame is turned off.

”Explore Hyderabad” – An Interactive Web-based GIS Application Prototype.
58
6.4.4 Map Navigation
Figure 6.9: Zoom In function.
Figure 6.10: Zoom Out function.

”Explore Hyderabad” – An Interactive Web-based GIS Application Prototype.
59
6.4.5 Search Functions
Figure 6.11: Identify Feature function.
Figure 6.12: The user can pass a query using the Query function.

”Explore Hyderabad” – An Interactive Web-based GIS Application Prototype.
60
Figure 6.13: Query results displaying the five star hotels in the text frame and also highlighting them on the map.
Figure 6.14: Search function is being used by typing the keyword ‘FIVE’ to find the five star
hotels in the city.

”Explore Hyderabad” – An Interactive Web-based GIS Application Prototype.
61
Figure 6.15: Results returned for searching the Five Start hotels.
Figure 6.16: Clear function clears the previous results.

”Explore Hyderabad” – An Interactive Web-based GIS Application Prototype.
62
Figure 6.17: Features can be selected using the Select tool. A monument has been selected.
Figure 6.18: Finding a restaurant within a distance of 1 km around the selected monument using Closest Facility tool.

”Explore Hyderabad” – An Interactive Web-based GIS Application Prototype.
63
Figure 6.19: Two restaurants were found in a buffer of 1 km around the selected monument.
6.4.6 Hyperlink, Print and Help
Figure 6.20: The hyperlink function opens the website link associated with the feature.

”Explore Hyderabad” – An Interactive Web-based GIS Application Prototype.
64
Figure 6.21: Print option helps in generating a hard copy for the user.
Figure 6.22: Help tool opens an instruction manual useful to operate Explore Hyderabad.

”Explore Hyderabad” – An Interactive Web-based GIS Application Prototype.
65
7 System Evaluation This chapter provides a discussion upon the methods and procedure of evaluation and thereby the evolved results.
7.1 Evaluation Objectives Carver et al (2002) states the importance of validating the output produced by a system. It is important that the application developed is usable, valid and meets the goals set at the beginning of the project. And therefore, in order to validate “Explore Hyderabad” the primary goals of this evaluation were a) To determine the marketing capability of application from the implementers view point. b) To determine whether the application will be helpful and useful for the end users.
7.2 Evaluation Method
7.2.1 Participants & Venue There were a total of 10 non-GIS users who participated in the evaluation process of “Explore Hyderabad”. The exercise was carried out in GIS lab of E-huset in Linköping University in two sessions. There were five users participating in each session. The first session was at 4 pm on Monday i.e. 22.05.2006 and the second session was executed on Friday i.e. 26.05.2006 at 4 pm.
7.2.2 Material A Web-based application is successful if it is found to be useful and helpful for the users. In order to find its usability, functionality and easiness, an appropriate evaluation technique is to survey the users after using the system and find their opinions with a questionnaire (Harries et al, 2003)(Hall et al, 2005). Each user was handed a questionnaire to answer, after using the application i.e. Explore Hyderabad. The application was hosted on a stand-alone PC in the GIS Lab.
7.2.3 Procedure The users were given a very brief introduction about the aim of developing the application. Without going into the details of operating, the users were asked to use the Web-based application. As the application is intended for a tourist or resident without any prior knowledge of GIS, and therefore, the users were not explained about the tools of the application. After exploring the application for a period of about 15 minutes they were given a questionnaire comprising of three sections evaluating the Presentation, Tools and Contents of website. Further, in each section they were asked for comments and any suggestions to improve the application or any specific function or tool they had thought of. The results obtained from all the questionnaires was summarised in the form of tables and graphs. The suggestions and comments are also discussed in the results section.

”Explore Hyderabad” – An Interactive Web-based GIS Application Prototype.
66
7.3 Evaluation Results
7.3.1 Quantitative Results The following tables and graphs illustrate the results obtained by summarising the results of feedback from user questionnaires after using “Explore Hyderabad”. Section 1: Presentation
Options Layout & Structure
Ease of Use Overall Rating
Excellent 9 2 9 Very Good 1 8 1 Good 0 0 0 Average 0 0 0 Poor 0 0 0
Table 7.1: Post evaluation results on look and feel of the website.
Website Presentation
0
1
2
3
4
5
6
7
8
9
10
Layout & Structure Ease of Use Overall Rating
No. o
f use
rs
ExcellentVery GoodGoodAveragePoor
Figure 7.1: Graph of results obtained on look and feel of the website.

”Explore Hyderabad” – An Interactive Web-based GIS Application Prototype.
67
Section 2: Tools
Options Ease of Use Clarity of Controls
Ease of Navigation
Excellent 1 1 1 Very Good 8 8 9 Good 1 1 0 Average 0 0 0 Poor 0 0 0
Table 7.2: Results on using the basic tools.
Tools Evaluation
0
1
2
3
4
5
6
7
8
9
10
Ease of Use Clarity of Controls Ease of Navigation
No. o
f use
rs
ExcellentVery GoodGoodAveragePoor
Figure 7.2: Graph illustrating the basic tools usage by the users.

”Explore Hyderabad” – An Interactive Web-based GIS Application Prototype.
68
Table 7.3: Showing the level of easiness with the customised tools.
Search and Closest Facility Tools
0
1
2
3
4
5
6
7
Search Tool Closest Facility Tool
No. o
f use
rs
Very EasyEasyAverageDifficultVery Difficult
Figure 7.3: Graph showing the search and closest facility tool’s level of easiness.
Options Search Tool
Closest Facility Tool
Very Easy 0 0 Easy 6 5 Average 3 4 Difficult 1 1 Very Difficult 0 0

”Explore Hyderabad” – An Interactive Web-based GIS Application Prototype.
69
Tool Name Percentage Hyperlink 7 Search 6 Find Closest Facility 5 Query 4
Table 7.4: Shows the most useful and helpful customised tools.
Most Useful Tools
0
1
2
3
4
5
6
7
8
Hyperlink Search Find Closest Facility Query
No. o
f use
rs
Figure 7.4: Showing the graph of customised tools in terms of their usefulness.

”Explore Hyderabad” – An Interactive Web-based GIS Application Prototype.
70
Section 3: Content
Options Content Organisation Help Excellent 6 2 1 Very Good 3 4 2 Good 1 3 4 Average 0 1 2 Poor 0 0 1
Figure 7.5: Table describing user feedback on the GIS content.
GIS Content
0
1
2
3
4
5
6
7
Content Organisation Help
No. o
f use
rs
ExcellentVery GoodGoodAveragePoor
Figure 7.5: Graph describing the GIS content on the website.

”Explore Hyderabad” – An Interactive Web-based GIS Application Prototype.
71
7.3.2 Discussion This evaluation shows that generally, users find the site useful, usable and appealing. This also makes it clear that this Web-based GIS application can be a better resource for marketing the city tourism activities and services over the Internet for the city’s tourism department. There was an overwhelming response from the users over the web-site presentation i.e. overall look and feel, and the GIS content provided at their disposal as information (See figures 7.1 & 7.5 for the graph). The feedback in this regard indicates that the users were impressed and therefore GIS content can be a better solution for providing a more concrete and impressive results for the users and thereby improving the inflow of tourists into the city if they decide upon it. Some of the other feedback on the tools highlighted the issue of the “help tool” for the users, which can be fixed by making it more enhanced and user friendly and providing them with maximum information to operate the application. The other aspects such as the response time could not be evaluated as the application was hosted on a stand alone computer, and therefore, the response time was obviously good. The following table describes the suggestions and comments obtained from the users in questionnaire.
Layer & Legend List
Some users faced difficulty in selecting, activating and then using the refresh button to get the features of layer on map in the display.
Map Detail
Few users suggested for a street level detail so that they can have a better idea of the place.
Map Information
Suggestions for more information on the tourist sites needed. Another suggestion was to direct each and every feature with a hyperlink so that they can get more information about it.
Others
Idea of incorporating the route services such as finding the tour path and the shortest path was encouraged by the users. There were few comments to improve the layers and legend section in order to operate it with more easiness.
Table 7.6: Users suggestions and comments.
As the application was developed for both tourists and the residents of the city, and therefore, few students belonging to the city were also requested to participate in the evaluation. It was found that the users belonging to the city were more interested in using the search and closest facility tools rather than the international users. It was observed that the international users tried the search and closest facility tools but they were more interested in using the hyperlink tool to find more information about the features and the city tourist attractions. The other tools, such as Measure and Query tool was appreciated by the users in finding the distance and forming queries to find their relevant information in the application. Further, the user’s feedback was enthusiastic on the idea of incorporating the route services in future such as the shortest path or the tour path. The users also suggested including a bus routes facility in the application.

”Explore Hyderabad” – An Interactive Web-based GIS Application Prototype.
72

”Explore Hyderabad” – An Interactive Web-based GIS Application Prototype.
73
8 Conclusion This chapter includes a concluding discussion on the research work, the advantages and limitations associated with the prototype application and the possible enhancements in future. This research has developed an accessible Web GIS prototype, through which the spatial information related to the tourism of Hyderabad city can be dissipated to the world wide users. This integrated online tourist information system can help the tourists from far destinations to explore the city tourist activities and decide their tour in an appropriate manner by performing on-line GIS queries, analysis and ‘what-if’ scenarios. This application can also assist the city tourist department to promote the tourist activities and increase foreign revenue in the state.
8.1 Advantages and Limitations
8.1.1 Advantages
• This application will enable even naive users who are not familiar with GIS to browse the tourism spatial content through Web over the Internet.
• This application will help the tourists in making arrangements before commencement
of the journey.
• This application will improve the quality and level of web information presentation.
• It is a utility for the public user as well as a marketing tool for the city tourism management to promote and attract tourists towards the city.
• As the Server is centrally controlled and therefore it is easier to maintain and update
the data.
8.1.2 Limitations There exist limitations with the GIS data involved in the application and as well as the prototype application.
• The city roads network consists of only the major and minor roads. A tourism application should be equipped with the street level data so that the tourists get utmost information to explore the city on their own.
• The speed limits, one-way information and road names in the roads layer were not
updated and inaccurate.
• There is also a technical barrier in those regions with low Internet access speeds. In a major part of India an average Internet speed is 56 Kbps, which is a great hindrance for the people in accessing this application.

”Explore Hyderabad” – An Interactive Web-based GIS Application Prototype.
74
• As much of the processing is done at the server side and due to which the network has more requests and responses, which may result in longer response time.
• As the HTML Viewer does not require any additional plug-in to install at the client
side, and due to this reason, vector data cannot appear at the client side. Instead an image of vector data is generated and dispatched to the client for viewing.
8.2 Future Work The application can be enhancement further so that the users can drive the maximum benefit from the application. In order to do so, there are many other functions that can be incorporated into the application. Following is a list of suggestions that can enhance the application to a better level of implementation.
• Route finding services such as tour path and shortest path can be included. The tourist can use this online facility to get the route details so that they can visit the attractions or explore the city in an easier manner.
• A bus route service can also be added in the application so that the users can get the
information about the bus services to visit their destination. This can also be created as a separate web service so that it can be accessed by any application world wide.
• The application can be enhanced for the management side with an online data entry
option to keep the database updated and accurate at all times.

”Explore Hyderabad” – An Interactive Web-based GIS Application Prototype.
75
Appendix
User Evaluation Questionnaire for “Explore Hyderabad” “Explore Hyderabad” is a Web-based GIS application facilitating the tourists and residents of the city to explore facilities, services and tourist attractions. I hope that this GIS prototype application has been of value to you. Please use this form to help improve the application prototype. Answer any or all of the questions below. You are encouraged to include any questions, comments, or suggestions that you believe will enhance the capabilities of this Web-based application. NOTE: Please put a tick mark before your answer. Section 1: Presentation Evaluate the look and feel of this web application. How is the information organised and presented? 1. Website layout and structure a. Excellent b. Very Good c. Good d. Average e. Poor 2. Ease of use a. Excellent b. Very Good c. Good d. Average e. Poor 3. Overall rating of presentation a. Excellent b. Very Good c. Good d. Average e. Poor 4. Comments ____________________________________________________________________________________________________________________________________________________________________________________________________________________________________________________________________________________________________________

”Explore Hyderabad” – An Interactive Web-based GIS Application Prototype.
76
______________________________________________________________________________________________________________________________________________________ Section 2: Tools Evaluate the tools provided in the application. Are the tools helpful in finding the required information? 1. Ease of use a. Excellent b. Very Good c. Good d. Average e. Poor 2. Clarity of controls a. Excellent b. Very Good c. Good d. Average e. Poor 3. Ease of navigation a. Excellent b. Very Good c. Good d. Average e. Poor 4. Search tool a. Very easy b. Easy c. Average d. Difficult e. Very difficult 5. Tool to find the closest facility a. Very easy b. Easy c. Average d. Difficult e. Very difficult

”Explore Hyderabad” – An Interactive Web-based GIS Application Prototype.
77
6. Apart from the basic tools of navigation i.e. zoom in, zoom out and move, which tools in the application were most helpful to decide or explore? More than one option can be selected. a. Hyperlink b. Search c. Find Closest Facility 7. Comments __________________________________________________________________________________________________________________________________________________________________________________________________________________________________________________________________________________________________________________________________________________________________________________________________________________________________________________________________ Section 3: Content Evaluate the information available on this GIS application. How is the information introduced and organised? Is the information beneficial and meaningful? 1. Content a. Excellent b. Very Good c. Good d. Average e. Poor 2. Organisation a. Excellent b. Very Good c. Good d. Average e. Poor 3. Was the help provided in the application to use the tools simple and useful? a. Excellent b. Very Good c. Good d. Average e. Poor

”Explore Hyderabad” – An Interactive Web-based GIS Application Prototype.
78
4. What level was the information presented? a. Got what I was looking for. b. Near to my expectations. c. Average d. Very poor 5. Would you recommend others to visit this Web-based GIS application for information on Hyderabad city? a. Yes b. No 6. There is a proposal to add a routing facility in the application. The application will find an optimum path of one’s tour according to the different sites to be visited. It can also provide the shortest path facility. Do you think that it will be useful for you? Please indicate your status whether you are a resident of the city or a tourist. __________________________________________________________________________________________________________________________________________________________________________________________________________________________________________________________________________________________________________________________________________________________________________________________________________________________________________________________________ 7. If I were to add one thing to this application it would be, __________________________________________________________________________________________________________________________________________________________________________________________________________________________________________________________________________________________________________________________________________________________________________________________________________________________________________________________________
”Explore Hyderabad” – An Interactive Web-based GIS Application Prototype.
79
References Books & Articles Agarwala, Sanjay K. (2002). Retail outlet mapping. Conference proceedings, Map India 2002. Alipour, Habib and Kilic, Hasan (2003). “An institutional appraisal of tourism development and planning: the case of the Turkish Republic of North Cyprus (TRNC)”. Tourism Management 26 (2005) 79 – 94. Al-Menieir, M., Al-Rowais, A., Greer, W., and Sandridge, A. L. (2005). Geographical distribution of congenital heart defects in Saudi Arabia, Ann Saudi Med 2005; 25 (1): 63-69. ArcIMS 9 Architecture and Functionality. An ESRI White Paper, May 2004. Ayeni, O. O., Ikwuemesi, G. and Saka, D. N. (2004). Developing a multimedia GIS database for tourism industry in Nigeria. Conference proceedings Istanbul ISPRS 2004, Commission II, Vol XXXV, part B2, 630 ff. Babu, Suresh A. V., Chakraborti, A. K., Rao, V. V., and Shanker, M. (2002). Performance evaluation of an irrigation project using satellite remote sensing, GIS & GPS. Conference proceedings, Map India 2002. Bernhardsen, T. (1999): Geographic Information Systems, an Introduction (2nd edition) Wiley, New York. Berno Tracy. (1999). When a Guest is a Guest Cook Islanders View of Tourism. Annals of Tourism Research, Vol. 26, No. 3, pp. 656 – 675. Elsevier Science Ltd. Brajesh Goyal, Duen-Ren Liu, Mark Coyle, Shashi Shekhar & Shyamsundar Sarkar, (1997). Data Models in the geographic information systems. Communications of the ACM, Volume 40, Issue 4(April 1997) pages 103 – 111. Publisher: ACM Press, New York., USA. Bristow Robert S. (2003). Serving maps on the Internet: A recreation and tourism example. Proceedings of the 2003 Northeastern recreation research symposium. Caldera Nelly, Cuberos Ricardo, Indriago Jose and Molina Nixon. (2000). Sigtur-Zulia: An Application of GIS Technologies for Tourism Planning. 20th Annual ESRI User Conference, 2000, San Diego, California. Canter, Philip R. (1998). Geographic information systems and crime analysis in Baltimore County, Maryland. Crime Mapping and Crime Prevention, 1998. Carver Steve, Cornelius Sarah, and Heywood Ian. (2002). An Introduction to Geographical Information Systems. 2nd edition. Pearson Education Limited, 2002.

”Explore Hyderabad” – An Interactive Web-based GIS Application Prototype.
80
Chawla, Sanjay and Shekhar, Shashi (2003). Spatial Databases: A Tour. Pearson Education Inc., New Jersey. Chou, Yue-Hong. (1995). Automatic Bus Routing and Passenger Geocoding with a Geographic Information System. Dockkey Kim & Myungshin Chae, (2004). GIS for a policy Decision Support in National Tourism Portal. 24th Annual ESRI User Conference, San Diego, C.A. Dondo, C. Bhunu, S. T. Rivett, U., (2002). GIS in Tourism – A Zimbabwean Perspective. International archives of photogrammetry and remote sensing, Vol 34; part 6/w6, pages 197 – 200. Publisher: International Society for Photogrammetry & remote sensing, Great Britain. Donoho Kayce, (1996), CD Technote 5. Duran, E., Seker, D. Z. and Shrestha, M. (2004). Web based information system for tourism resorts; A case study for side/Manavgat. XXth ISPRS congress. Page 90. Istanbul 2004. Fesenmaier Daniel R., Wang Youcheng and Yu Quaehee. (2002). Defining the virtual tourist community: implications for tourism marketing. Tourism Management 23 (2002) 407 – 417. Ghanim, Qassim Mohammed Ali Al. (1999). Qatar’s GIS – A Unique Model for Next Millinnium GIS. Proceedings of ESRI User Conference, 1999. CA. Hall R, Luna R, Lawrence W and Sullivan J. (2005). Evaluation of a prototype GIS learning system to teach civil engineering concepts. Campus.umr.edu. Harries I, Kerry J. T., and Marker S. (2003). Web-based Geographic Locator. Genesis – doc.ic.ac.uk. Hors Le Arnaud, Jacobs Ian and Ragget Dave. (1999). HTML 4.01 Specification. W3C Recommendation. http://www.student.oulu.fi/~ttlinna/JTH/Avoin/h6/html40.pdf. Huxhold, and Levinsohn, 1995. Managing Geographic Inormation Systems Projects, Oxford University Press. Ishida, T. (2002). Digital city Kyoto: Social Information Infrastructure for Everyday Life. Communications of the ACM, vol. 45, no. 7, pp. 76-81. Information Economy Report (2005). United Nations conference on trade and development, Geneva, 2005. Jackson Julie (2006). Developing regional tourism in China: The potential for activating business clusters in a socialist market economy. Tourism Management 27 (2006) 695 – 706.

”Explore Hyderabad” – An Interactive Web-based GIS Application Prototype.
81
Jansen-Verbeke, M. (1988) Leisure, Recreation and Tourism in Inner Cities. Netherlands Geographical Studies No. 58, Amsterdam. John O’Looney, (2004). Using ArcIMS to develop location-based tourism information systems. 24th Annual ESRI User Conference, San Diego, CA. Jones, Christopher B.(1997). Geographical Information Systems and Computer Cartography. Addison Wesley Longman Limited 1997. Kumar Krishna (2003). International Tourism In India: Strategic Gaps and Vulnerabilities. Strategic Management Forum. www.smfi.org. Law N. Chirstopher. (1992). Urban Tourism and its contribution to economic regeneration. Urban Studies, Vol 29, Nos. 3 / 4, page nos. 599 – 618. Lu Jie and Lu Zi. (2004). “Development, Distribution and Evaluation of Online Tourism Services in China.” Electronic Commerce Research, Kluwer Academic Publishers, Netherlands. 4: 221 – 239 (2004). Luqi, Chang, C. K., & Zhu, H. (1998). Specifications in software prototyping. Journal of Systems and Software, 42, 124 – 140. McAdam, David. (1999). The value and scope of geographical information systems in tourism management. Journal of sustainable tourism. Vol. 7, No. 1, 1999. Mckercher Bob. (1996). Differences Between Tourism And Recreation In Parks. Annals of Tourism Research, Vol. 23, No. 3, pp. 563 – 575, 1996. Elsevier Science Ltd. Mowery David C. and Simcoe Timothy. (2002). Is the Internet a US invention? – An economic and technological history of computer networking. Research Policy 31(2002) 1369 – 1387. Nasimudheen M.A., Shafey Moines EL., Al Hady, (1997). Decision Support System for Vehicle Routing. Proceedings of ESRI User Conference, 1997. San Diego, CA. O’ Connor P (1999). Electronic Information Distribution in Tourism and Hospitality. Wallingford, UK, CAB International. Peng Zhong-Ren and Tsou Ming-Hsiang. (2003). Internet GIS: distributed geographic information services for the internet and wireless networks. John Wiley & Sons, Inc., Hoboken, New Jersey. Puhretmair Franz, Rumetshofer Hildegard and Schaumlechner Erwin. (2002). Extended decision making in tourism information systems. Proceedings of the third international conference on E-commerce and web technologies. P. 57-66, September 02-06, 2002. Pulusani Preetha. “Internet GIS – One perspective”. (2001). Conference Proceedings Map India 2001, www.gisdevelopment.net.

”Explore Hyderabad” – An Interactive Web-based GIS Application Prototype.
82
Raghavendran, S. (2002). Cadastral mapping and land information system. Proceedings of Map India 2002. Salamanca, L.A.R. (2004). The web tourist atlases assist the dissemination of spatial data. Proceedings of ESRI User conference, 2004. C.A. Shneiderman, B. (1997). “Designing information – abundant sites web sites: issues and recommendations.” International Journal of Human Computer Studies (1997) Vol 47; Number 1, pages 5 – 30. Academic Press, Great Britain. Sinha Arun P. (2004). E-Marketing of tourism in an emergent economy – perceptions of product benefits & barriers. Academy of Business & Administrative Sciences (ABAS) International Conference, Monterux, June 12 – 14, 2004. Staab Sefffan and Werthner Hannes (2002). “Intelligent Systems for Tourism”. IEEE Intelligent Systems, November/December 2002, pp. 53-55. Standing, C. and T. Vasudavan. (2000). “Diffusion of Internet Technologies in Travel Agencies in Australia.” In The 8th European Conference on Information Systems (ECIS) 2000, pp. 1112 – 1119. Tsou Ming-Hisang, 2005, Recent developments in Internet GIS, gisdeveloment.net. Van Arragon, J., Wessels, C., (1994).Travelling by the computer: application of GIS in tourism and recreation. Proc. EGIS’94. Wahi, Ramesh Col. (2002). Managing GIS projects, ESRI India. Proceedings of Map India, 2002. Yojae, Joun & Kwang-Hoon, Ryu. (2004). Using GIS for Middle or Low Rate Hotel Reservation. 24th Annual ESRI User Conference, 2004. San Diego, C.A. Zuckerman Ethan. (2003). Global Attention Profiles – A working paper: First steps towards a quantitative approach to the study of media attention. The Berkman Center for Internet & Society Research publication series. No. 2003-06, 8/2003. www.cyber.law.harvard.edu. Other Sources & websites Andhra Pradesh state tourism corporation. www.aptourism.com ArcNews Online (2003). Solving Several Post-Communism Challenges, Bulgaira’s Pamporovo Resort Implements GIS for Development Plan. ESRI News, Fall 2003. Dubai Geographic Information Systems Center,(2006). Dubai Municipality. www.gis.gov.ae Durham County Council. (2006) Geographic Information System. www.durham.gov.uk

”Explore Hyderabad” – An Interactive Web-based GIS Application Prototype.
83
ESRI – Map Book Gallery Volume 17 – Island Map—Hachijojima, Izu, Ogasawara (Bonin) Islands, Tokyo, Japan. Federation of Hotel and Restaurant Association of India. http://www.fhrai.com/ Hotels Association of India. http://www.hotelassociationofindia.com/home/index.htm Hyderabad Urban Development Authority. www.hudahyd.org/new/index.html Incredibl e India, Figures 2004. www.incredibleindia.com (official website of Ministry of Tourism, Government of India) The Center for GIS State of Qatar (2006). www.gisqatar.org