Understanding the formation process of the liquid slug in ...

HAL Id: hal-01340709https://hal.archives-ouvertes.fr/hal-01340709
Submitted on 1 Jul 2016
HAL is a multi-disciplinary open accessarchive for the deposit and dissemination of sci-entific research documents, whether they are pub-lished or not. The documents may come fromteaching and research institutions in France orabroad, or from public or private research centers.
L’archive ouverte pluridisciplinaire HAL, estdestinée au dépôt et à la diffusion de documentsscientifiques de niveau recherche, publiés ou non,émanant des établissements d’enseignement et derecherche français ou étrangers, des laboratoirespublics ou privés.
Experiments of mass transfer with liquid–liquid slugflow in square microchannels
Nathalie Di Miceli Raimondi, Laurent E. Prat, Christophe Gourdon, JosianeTasselli
To cite this version:Nathalie Di Miceli Raimondi, Laurent E. Prat, Christophe Gourdon, Josiane Tasselli. Experimentsof mass transfer with liquid–liquid slug flow in square microchannels. Chemical Engineering Science,Elsevier, 2014, 105, pp.169-178. �10.1016/j.ces.2013.11.009�. �hal-01340709�

Open Archive TOULOUSE Archive Ouverte (OATAO) OATAO is an open access repository that collects the work of Toulouse researchers and makes it freely available over the web where possible.
This is an author-deposited version published in : http://oatao.univ-toulouse.fr/ Eprints ID : 10290
To link to this article : DOI : 10.1016/j.ces.2013.11.009 URL : http://dx.doi.org/10.1016/j.ces.2013.11.009
To cite this version : Di Miceli Raimondi, Nathalie and Prat, Laurent E. and Gourdon, Christophe and Tasselli, J. Experiments of mass transfer with liquid–liquid slug flow in square microchannels. (2014) Chemical Engineering Science, vol. 105. pp. 169-178. ISSN 0009-2509
Any correspondence concerning this service should be sent to the repository
administrator: [email protected]

Experiments of mass transfer with liquid–liquid slug flowin square microchannels
N. Di Miceli Raimondi a,b,n, L. Prat a,b, C. Gourdon a,b, J. Tasselli c
a Université de Toulouse, INPT, UPS, Laboratoire de Génie Chimique, 4, Allée Emile Monso, 31030 Toulouse, Franceb CNRS, Laboratoire de Génie Chimique, 31030 Toulouse, Francec Laboratory for Analysis and Architecture of Systems, CNRS, 7 Avenue du Colonel Roche, 31077 Toulouse Cedex 4, France
H I G H L I G H T S
! Experiments are carried out to study liquid–liquid mass transfer in microchannels.! Solute concentration in the continuous phase is measured function of contact time.! Droplet side mass transfer coefficients are identified from experimental results.! The results are compared with models available in literature.
Keywords:
Liquid–liquid mass transfer
Slug flow
Microchannel
Confined droplets
a b s t r a c t
Liquid–liquid mass transfer mechanism with slug flow in microreactor is investigated by means of
experiments in square microchannels of 0.21 and 0.30 mm width. An experimental bench has been
designed and an analytical protocol developed in order to follow the transfer of a solute from the
dispersed phase to the continuous phase. The methodology used allows the identification of droplet side
mass transfer coefficients. Total flow rate ranges from 5 to 50 mL h"1, resulting in droplets velocities of
0.02–0.35 m s"1. Volumetric mass transfer coefficient kda values obtained in the present work ranges
from 0.72 to 8.44 s"1. The results reasonably fit with a model suggested by a previous study based on 2D
direct numerical simulations. A comparison with other models available in the literature shows that
in the operating conditions considered in this work, the flow pattern inside the confined droplets at
microscale leads to an enhancement of mass transfer compared to droplets that are not confined.
1. Introduction
Microreactors and microchannels are non-conventional devices
in chemical engineering field but have been for few years the
subject of numerous research studies and programs such as the
European project IMPULSE (Integrated Multiscale Process Units
with Locally Structured Elements) in 2005. This interest lies in the
abilities of such devices in terms of heat transfer and mass transfer
notably due to the increase of specific area by the miniaturization
effect and the decrease of diffusion length. Ehrfeld et al. (2000)
proposed a state of the art on microtechnologies: they observed
that typical interfacial areas for two-phase flow are 5000–
30,000 m2 m"3, while Kashid and Agar (2007) showed that the
production130 of such dispersions requires low power input
compared to common devices. Moreover, despite laminar flow,
the confinement of two-phase flow in microchannels allows the
appearance of recirculation vortices that can have positive effect
on transfer mechanisms.
The use of miniaturized processes is promising according to
two main frameworks: (i) process intensification (Stankiewicz and
Moulijn, 2000; Commenge et al., 2005) with an improvement
of safety due to confinement and small amount of chemicals
(Burns and Ramshaw, 2001; De Mello and Wooton, 2002) and
(ii) microdevices designed as labs on chips for data acquisition at
laboratory scale such as kinetic data (Sarrazin, 2006; Tsoligkas
et al., 2007), physico-chemical properties (Guillot et al., 2006) or
biological mechanisms information (Stanley et al., 2012) for a
better sizing and control of pilot and industrial plants. For both
applications it is important to understand the physical and
chemical mechanisms at microscale. To carry out liquid–liquid
process, mass transfer coefficients estimation is required to obtain
reliable process designs and/or data acquisitions for kinetic laws
identification. Few works focused on experimental mass transfer
http://dx.doi.org/10.1016/j.ces.2013.11.009
n Corresponding author at: Université de Toulouse, INPT, UPS, Laboratoire de
Génie Chimique, 4, Allée Emile Monso, F-31030 Toulouse, France.
Tel.: þ33 562 25 89 20; fax: þ33 562 25 88 91.
E-mail address: [email protected] (N. Di Miceli Raimondi).

with liquid–liquid slug flow in microchannels using reactive (with
instantaneous reactions) or non-reactive systems. Burns and
Ramshaw (2001) conducted experiments of acetic acid titration
in kerosene within 0.38 mm width square microchannels.
Dummann et al. (2003) carried out the nitration of single ring
aromatics and Ghaini et al. (2010) used the alkaline hydrolysis of
ester in n-butylformate in circular capillaries of 0.5 and 1 mm
diameter. Dessimoz et al. (2008) worked in rectangular micro-
channels of 0.4 mm equivalent diameter and carried out the
instantaneous neutralisation of trichloroacetic acid by NaOH in
toluene or hexane. Assmann and von Rohr (2011) studied the
extraction of vanillin in water with toluene with or without adding
an inert gas in rectangular microchannels (173 μm$300 μm).
These works show an increase of the mass transfer coefficients
with the droplets velocity (or total flow rate).
In a previous work based on 2D direct numerical simulations (Di
Miceli Raimondi et al., 2008), a correlation has been proposed that
shows the influence of the operating parameters on mass transfer
coefficients. The present work consists in the development of a
laboratory pilot and an analysis protocol to conduct liquid–liquid
mass transfer experiments in square microchannels to validate this
correlation and increase the comprehension of transfer mechanisms
in such systems. Slug flow pattern is generated in T-shape micro-
reactors. Transfer of acetone from toluene to water is carried out.
This article presents the materials used to carry out mass
transfer experiments with liquid–liquid slug flow and the experi-
mental protocol. The results obtained in terms of mass transfer
coefficients on the droplet side are compared with the correlation
suggested by the previous simulation work. Finally a comparison
with models proposed for similar systems is conducted in order to
understand the impact of the hydrodynamic structures in confined
liquid–liquid slug flows on the mass transfer mechanism.
2. Materials
2.1. Microreactors
The experiments are carried out in two microreactors manufac-
tured by the LAAS (Laboratory for Analysis and Architecture of
Systems, CNRS Toulouse, France), whose main microchannels have
square section of 0.2170.01 and 0.3070.01 mm width (Fig. 1).
These ones are made of silicon and glass and present a very good
chemical resistance.
The manufacturing of silicon microfluidic chips is achieved by
means of the photolithography technique (Gawron et al., 2001; Chun
et al., 2006). High-aspect-ratio microchannels are fabricated in a
silicon wafer by plasma etching using the deep reactive ion etching
(DRIE) technique and the Bosch process (Tang et al., 2007; Laermer
and Schilp, 1996). Through-wafer holes are also etched by DRIE for
creating the microreactor inlets and outlets. The structured silicon
wafer is capped by a borosilicate glass wafer (Pyrexs 7740 from
Corning) using anodic bonding technique. Resulting squared micro-
channels are made of three walls in silicon and one in glass.
Silicon and glass are hydrophilic so that the organic phase is
dispersed into the aqueous phase. The fluids get in contact in a T-
junction. Liquid–liquid slug flow is produced as illustrated in Fig. 2,
with droplets and continuous phase slug that regularly alternates
(a droplet and a continuous phase slug constitute a “unit cell”).
The microreactors present secondary channels made of several
small microchannels (20 μm width and 0.21 or 0.30 mm depth
depending on the main channel size). They act like filters in order
to extract in a selective way the continuous phase. This allows
the analysis of the extracted fluid, i.e. the measurement of the solute
concentration in the continuous phase (Fig. 3). Similar secondary
channels have already been used for the management of dispersed
flow pattern in microchannels (Gunther et al., 2005; Prat et al., 2006;
Marcati et al., 2010).
2.2. Experimental bench
Fig. 3 presents a scheme of the experimental bench. The
introduction of the fluids is performed by syringes with stainless
steel needles placed on syringe pumps (Harvard Apparatus
PHD2000 or PicoPlus). A high-speed camera HCC-1000 (VDS
Vosskühler GmbH) coupled with a binocular Nikon SMZ-10
enables the visualization of the flow in the microchannel. The
chip lighting is provided through optical beams. The camera is
characterized by an acquisition frequency up to 1800 frames s"1.
Data acquisition and treatment is carried out using the software
NV 1000 (New Vision Technologies). This system allows the
measurement of the droplets length, velocity and frequency.
The analysis system is connected to one of the secondary
channels to measure the solute concentration in the continuous
phase at a given location. The others are blocked using plugged
capillaries. The measuring system and the analytical method will
be described in more details in Section 3.1.
2.3. Microfluidic connections
Silicon and glass are tough materials but highly breakable.
Therefore, the microfluidic connection system with such chips is
not trivial. The fragility of the materials prohibits the use of
connections directly screwed on the chip. Moreover stuck connec-
tions are excluded because of the use of solvents. Tight micro-
fluidic connections were obtained using silicon septa. As described
on Fig. 4, a PFA (perfluoroalcoxy polymer, 1/16″ OD) capillary
passes through a septum placed on each inlet and outlet. The septa
and the microfluidic chip are put between two PMMA (poly-
methylmethacrylate) plates screwed each other to constitute the
1 cm
Fig. 1. Microreactor in silicium and glass.
Fig. 2. Illustration of the microreactor structure (main and secondary channels).

housing. The screwing allows the septa to be flattened against the
silicium wafer. This provides a good tightening of the connection
while applying a soft mechanical pressure on the chip. At last,
connections between PFA capillaries and stainless steel needles are
insured using Swagelok fittings.
3. Methods
3.1. Analytical method
Water/acetone/toluene two-phase system was used to character-
ize mass transfer in square microchannels. It is defined as a standard
test system for liquid extraction by the European Federation of
Chemical Engineering (Misek et al., 1985). Acetone is the solute
which transfers from toluene (dispersed phase) to water (continuous
phase).
As previously described, the concentration of acetone in the
continuous phase is determined using secondary channels to
extract this phase. For that purpose, the secondary channel which
is subjected to analysis is linked to a syringe (by means of
capillaries) which is placed on a syringe-pump running in refill
mode (Fig. 3). In order to analyze continuous phase samples
representative of this phase in the microchannel, half of its flow
rate is constantly extracted. There are five secondary channels per
microreactor located at a distance of 2.4 mm, 7.8 mm, 17.6 mm,
32.2 mm and 48.8 mm from the middle of the T-shape droplets
generator. The total length of the main channel in which mass
transfer occurs is 50.6 mm (from the droplets generator to the
main outlet). The concentration of acetone in the continuous
phase is determined by UV-spectrophotometry measurements.
A measuring cell is placed between the secondary channel and the
refill syringe as described in Fig. 5. The extracted fluid circulates in the
cell while it is analyzed by mean of two optical beams (one acts like a
light transmitter, the other like a receiver). This material allows the
estimation of the fluid absorbance which can be directly linked to the
concentration of acetone thanks to a prior calibration of the system
with an uncertainty of 10%. The beams are connected to the spectro-
photometer (AvaSpec-2048-USB2 Grating UA). The received signal is
analyzed with the software Avasoft-Full.
Water and toluene are nearly mutually immiscible. However the
very small solubility of toluene in water is enough to distort the
measurement of acetone concentration in water (at ambient tem-
perature, the solubility of toluene is roughly 0.5 g/L of water). This
measurement allows the estimation of the solute flux transferred
between the two phases. Therefore, to avoid the transfer of toluene
and water, water saturated with toluene and toluene saturated with
water have been used in the whole experiments performed at
ambient temperature. Acetone concentrations are low in order to
avoid a flow hydrodynamic perturbation due to mass transfer
notably linked to Marangoni effects. Moreover the calibration of
the system showed a linear relationship between fluid absorbance
and acetone concentration up to 0.4% in weight of acetone in water.
In these conditions, the physical properties of the two phase system
are assumed to remain constant during the experiments equal to
those of pure water (ρc¼1 g cm"3; μc¼1$ e"3 Pa s) and pure
toluene (ρd¼0.864 g cm"3; μd¼0.6$ e"3 Pa s). Viscosity is mea-
sured with the rheometer CSL2 500 (TA Instruments). Density is
measured with the pycnometer DMA 38 (Anton Paar). The interfacial
tension between water and toluene is determined using the tensi-
ometer 3S (GBX Instruments) at 33.7 mNm"1.
3.2. Experimental protocol
The continuous and dispersed phases flow rates, Qc and Qd,
are varied. For every operating conditions, the droplets length Ld,
velocity Ud and frequency fd are measured. Table 1 describes the
ANALYSIS
SYSTEM
PROCESS
Syringe pump
Syringe
Speed
camera
Binocular
Silicon/glass
chip
Optical beam
Light source
Collector
Spectrophotometer
Receiver
Transmitter
Measuring cell
Optical beam
ANALYSIS
SYSTEM
PROCESS
Syringe pump
Syringe
Speed
camera
Binocular
Silicon/glass
chip
Optical beam
Light source
Collector
Spectrophotometer
Transmitter
Measuring cell
Optical beam
Fig. 3. Scheme of the experimental bench.
Housing in PMMA
Screw
Glass wafer
Etched siliconwafer
Microfluidicchip
Septum
PFA capillary
Housing in PMMA
Screw
Glass wafer
Etched siliconwafer
Microfluidicchip
Septum
PFA capillary
Fig. 4. Scheme of a microfluidic connection.

set of experiments carried out (wC stands for the microchannel
width). The solute (acetone) is initially mixed in the dispersed
phase (toluene). Its concentration Cd0 is settled so that the
concentration measurements are included in the range where
concentration and absorbance of the analyzed solution are pro-
portional. The continuous phase (water) is initially pure. Concen-
trations are expressed in acetone mass fraction. The method
developed to measure the mass transfer coefficient kd,expa and
the interfacial area a is described in Section 4.
These experiments aim at estimating the droplet side mass
transfer coefficient and identifying the impact of the dispersed
flow characteristics on this coefficient. This requires deducing
the impoverishment kinetics of the droplets in solute for every
operating conditions investigated. The monitoring of the transfer
all along the microchannel is achieved by connecting the measur-
ing cell at the different secondary channels. The analysis method
allows the measurement of the concentration of acetone in the
continuous phase Cc. The concentration profile of acetone in the
dispersed phase Cd is then obtained with the following mass
balance:
QdρdCd0 ¼ QdρdCdðtÞþQ cρcCcðtÞ ð1Þ
where ρ is the fluid density, and t is the residence time. It assumes
that flow rates and densities of both phases remain constant
during the transfer operation regarding the low concentrations
of acetone used. Fig. 6 illustrates the curves trend obtained with
such a protocol. The experimental error is estimated from the
uncertainties on the droplets velocity, on the initial concentration
of acetone in toluene and on the concentration of acetone
measured by the spectrophotometry technique.
4. Results
4.1. Volumetric mass transfer coefficients identification
Droplet side mass transfer coefficient kd,exp is identified from
the experimental concentration profiles. It is derived from the
expression of the mass flux through the interface per droplet
surface unit Φexp given by Eq. (2). The driving force is calculated
from the difference between the concentration of acetone in the
droplet at time t, Cd(t), and the one at infinite time, Cd1:
Φexp ¼ "kd;expðCdðtÞ"C1d ÞUρd ð2Þ
kd,exp is deduced from the experiments by fitting concentration
profiles with those calculated by means of the mass balance
within the droplets:
VddCdðtÞdt
¼ "kd;expaVUCðCdðtÞ"C1d Þ ð3Þ
a stands for the interfacial area of the two-phase flow. Vd and VUC
respectively represent the volumes of a droplet and a unit cell.
A unit cell corresponds to the flow pattern which comprises a
droplet and a continuous phase liquid slug. VUC is obtained from
the product of the unit cell length LUC with the section of the main
microchannel. The droplet volume Vd,exp corresponds to the ratio
Fluid to analyse
Optical beams
Fluid to analyse
Optical beams
Fig. 5. Measuring cell associated to the UV-spectrophotometer.
Table 1
Operating conditions of the mass transfer experiments.
wC (mm) Qc (mL h"1) Qd (mL h"1) Ld (mm) Ud (m s"1) fd (s"1) kd,expa (s"1) a (m2 m"3)
0.21 2.5 2.5 0.8870.04 0.03070.003 20.473.7 1.6170.73 10 240
0.21 2.5 5.0 1.3070.12 0.04470.002 25.972.8 2.7271.43 13 400
0.21 5.0 2.5 0.5770.02 0.04570.003 31.972.9 1.5370.35 6 760
0.21 5.0 5.0 0.7270.06 0.06070.002 51.073.7 3.5870.42 10 400
0.21 20.0 20.0 0.4770.03 0.27070.025 319.8712.0 8.4471.91 9 130
0.21 30.0 10.0 0.3570.02 0.26670.052 288.0711.5 4.3370.66 6 090
0.21 30.0 20.0 0.3670.04 0.34770.034 426.9721.4 8.4371.56 7 060
0.30 5.0 2.5 1.0070.11 0.02570.003 10.270.7 1.0670.39 4 540
0.30 5.0 5.0 1.2870.14 0.03470.004 16.070.9 1.2370.46 7 300
0.30 5.0 10.0 1.6470.18 0.05270.007 24.573.7 0.7270.21 4 630
0.30 7.0 3.5 0.8570.06 0.03670.003 16.471.0 1.5370.61 6 700
0.30 7.0 7.0 1.0470.15 0.04970.004 26.672.9 2.6571.14 9 600
0.30 7.5 15.0 1.4370.19 0.07770.004 42.573.4 1.1870.33 4 640
0.30 10.0 5.0 0.7970.04 0.05270.005 26.171.5 1.8570.62 7 150
0.30 10.0 10.0 1.0570.07 0.07070.008 40.172.8 1.4570.50 4 630
0.30 15.0 7.5 0.7570.03 0.07970.008 41.571.9 2.2071.09 9 420
between the dispersed phase flow rate and the droplets frequency:
Vd;exp ¼Qd
f dð4Þ
The integration of the mass balance over time can be written as
follows:
CdðtÞ ¼ C1d þðCdðtref Þ"C1
d Þexp "kd;expaVUC
Vd;expðt"tref Þ
! "
ð5Þ
tref is a reference time from which it assumes that Eq. (2) can
reliably predict mass transfer fluxes. The effect of the droplet
formation generally leads to a global overestimation of mass
transfer coefficients due to the appearance of mixing hydrody-
namic structures when the phases get in contact. In this study,
tref was chosen in the zone where the laminar flow in the micro-
channel is fully developed in order to avoid the entrance effects
impact on kd,exp estimation (Skelland andWellek, 1964). The entrance
length Le considering laminar flow in smooth channel can be
estimated using Eq. (6) (Gao et al., 2002; Shen et al., 2006):
Le
dCRe¼ 0:1 ð6Þ
In the experiments carried out, the entrance length is evaluated to be
less than 1.4 mm in the channel of 0.21 mmwidth, and 0.7 mm in the
channel of 0.30 mm width. The first secondary channel is located at
2.4 mm from the T-junction. Therefore, it is expected that the flow is
fully developed at that level of the main channel. Consequently, the
time of reference tref is defined as the time for a droplet to reach the
first secondary channel. Cd1 is calculated from a mass balance at
infinite contact time given by Eq. (7):
C0dρdQd ¼ Cd
1ρdQdþCc
1ρcQ c ð7Þ
Cd1 and Cc
1 are linked together by the thermodynamic equilibrium.
A prior study showed that this equilibrium can be written in terms of
Eq. (8) in the concentration domain considered in this work, with a
constant partition coefficient m¼0.76.
C1d ¼mUCc
1 ð8Þ
Therefore, Eqs. (7) and (8) allows the estimation of Cd1:
C1d ¼ C0
d
ρdQd
ρdQdþρcQ c=mð9Þ
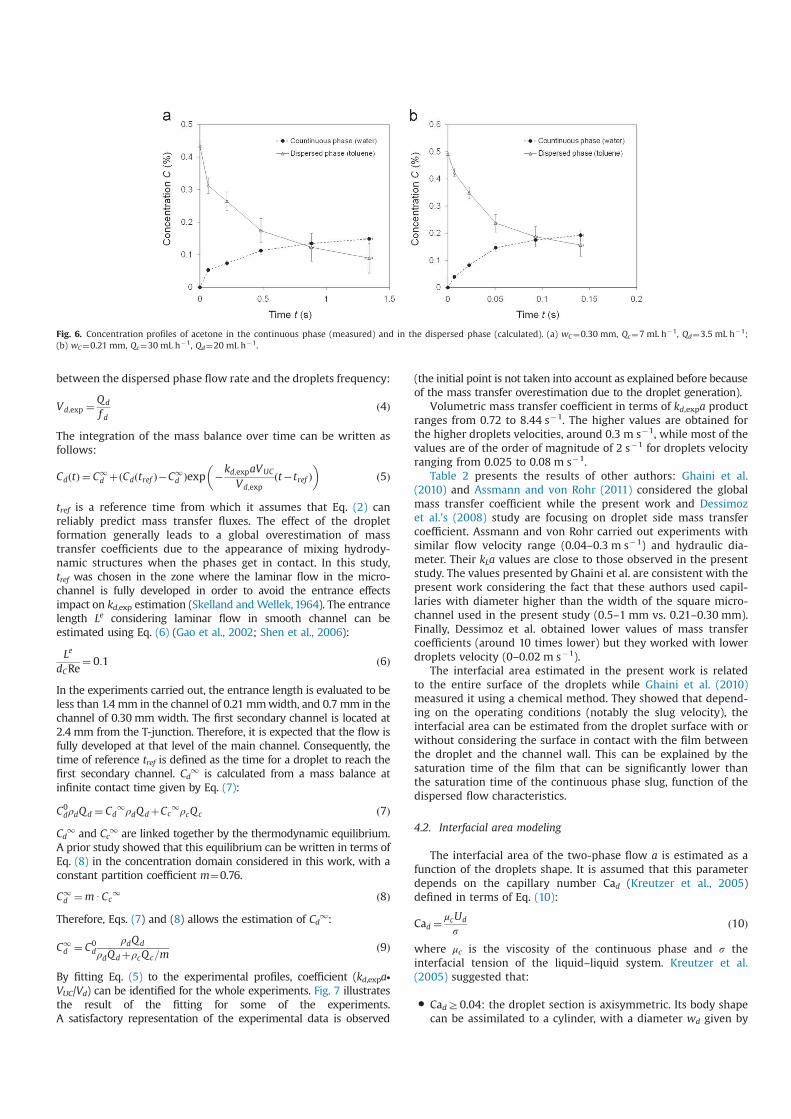
By fitting Eq. (5) to the experimental profiles, coefficient (kd,expa∙
VUC/Vd) can be identified for the whole experiments. Fig. 7 illustrates
the result of the fitting for some of the experiments.
A satisfactory representation of the experimental data is observed
(the initial point is not taken into account as explained before because
of the mass transfer overestimation due to the droplet generation).
Volumetric mass transfer coefficient in terms of kd,expa product
ranges from 0.72 to 8.44 s"1. The higher values are obtained for
the higher droplets velocities, around 0.3 m s"1, while most of the
values are of the order of magnitude of 2 s"1 for droplets velocity
ranging from 0.025 to 0.08 m s"1.
Table 2 presents the results of other authors: Ghaini et al.
(2010) and Assmann and von Rohr (2011) considered the global
mass transfer coefficient while the present work and Dessimoz
et al.’s (2008) study are focusing on droplet side mass transfer
coefficient. Assmann and von Rohr carried out experiments with
similar flow velocity range (0.04–0.3 m s"1) and hydraulic dia-
meter. Their kLa values are close to those observed in the present
study. The values presented by Ghaini et al. are consistent with the
present work considering the fact that these authors used capil-
laries with diameter higher than the width of the square micro-
channel used in the present study (0.5–1 mm vs. 0.21–0.30 mm).
Finally, Dessimoz et al. obtained lower values of mass transfer
coefficients (around 10 times lower) but they worked with lower
droplets velocity (0–0.02 m s"1).
The interfacial area estimated in the present work is related
to the entire surface of the droplets while Ghaini et al. (2010)
measured it using a chemical method. They showed that depend-
ing on the operating conditions (notably the slug velocity), the
interfacial area can be estimated from the droplet surface with or
without considering the surface in contact with the film between
the droplet and the channel wall. This can be explained by the
saturation time of the film that can be significantly lower than
the saturation time of the continuous phase slug, function of the
dispersed flow characteristics.
4.2. Interfacial area modeling
The interfacial area of the two-phase flow a is estimated as a
function of the droplets shape. It is assumed that this parameter
depends on the capillary number Cad (Kreutzer et al., 2005)
defined in terms of Eq. (10):
Cad ¼μcUd
s
ð10Þ
where μc is the viscosity of the continuous phase and s the
interfacial tension of the liquid–liquid system. Kreutzer et al.
(2005) suggested that:
! CadZ0.04: the droplet section is axisymmetric. Its body shape
can be assimilated to a cylinder, with a diameter wd given by
Fig. 6. Concentration profiles of acetone in the continuous phase (measured) and in the dispersed phase (calculated). (a) wC¼0.30 mm, Qc¼7 mL h"1, Qd¼3.5 mL h"1;
(b) wC¼0.21 mm, Qc¼30 mL h"1, Qd¼20 mL h"1.
the following correlation (wC refers to the channel width):
wd
wC¼ 0:7þ0:5expð"2:25Ca0:445d Þ ð11Þ
! Cado0.04: the droplet body fits the channel walls very closely.
Its section can be assimilated to the channel section, i.e. as a
square, with a width equal to 0.95wC.
The droplet ends are assimilated to hemispheres. In the
experiments carried out, Cad ranges from 0.001 to 0.01 (Cado
0.04). In order to validate the shape model, the calculated droplets
volume (given by Eq. (12)) is compared to the experimental one
(Eq. (4)). Fig. 8 shows a good agreement between both of them:
Vd;calc ¼πw3
d
6þw2
dðLd"wdÞ for Cado0:04 ð12Þ
Therefore, the surface of one droplet Sd is estimated from the
following:
Sd ¼ πw2dþ4wdðLd"wdÞ for Cado0:04 ð13Þ
The interfacial area of the liquid–liquid system a is defined as the
ratio between the surface of one droplet and the unit cell volume
(given by the following):
a¼ Sd
LUC UdC2
ð14Þ
In this work, it ranges from 4540 to 13,400 m2 m"3. Consequently,
the kd,expa values previously identified allows the estimation of
the mass transfer coefficient kd,exp that ranges from 1.5e"04 to
1.4e"03 m s"1. Fig. 9 shows that, as expected, the mass transfer
coefficient tends to increase with the droplets velocity. The error
bars represent the uncertainties on the measured values given in
Table 1.
5. Comparison with models for mass transfer coefficient
estimation
5.1. Validation of a previous numerical study
In a previous work, a correlation for the estimation of droplet
side mass transfer coefficient has been proposed for liquid–liquid
mass transfer with slug flow as a function of the flow character-
istics (Di Miceli Raimondi et al., 2008). It is based on 2D direct
numerical simulations. The correlation is as follows:
kddd ¼ αUVd
VUC
! "0:17
ðUdwCÞ0:69Ud
s
! ""0:07 wC
dd
! "0:75
ð15Þ
Fig. 7. Comparison between experimental and calculated (Eq. (5)) concentration profiles in the dispersed phase. (a) wC¼0.30 mm, Qc¼7 mL h"1, Qd¼3.5 mL h"1;
(b) wC¼0.21 mm, Qc¼30 mL h"1, Qd¼20 mL h"1.
Table 2
Liquid–liquid mass transfer coefficients and interfacial area in microreactor.
Liquid–liquid contactor kLa or kda (s"1) a (m2 m"3) Reference
Square microchannel, wC¼0.21 mm 1.61–8.44 6090–13400 Present work
Square microchannel, wC¼0.30 mm 0.72–2.65 4540–9600 Present work
Rectangular microchannel, dH¼0.22 mm 5–12 – Assmann and von Rohr (2011)
Rectangular microchannel, dH¼0.4 mm 0.2–0.5 )10,000 Dessimoz et al. (2008)
Capillary microreactor, ID¼0.5 mm 0.90–1.67 1600–3200 Ghaini et al. (2010)
Capillary microreactor, ID¼0.75 mm 0.91–1.46 1075–2770 Ghaini et al. (2010)
Capillary microreactor, ID¼1 mm 0.88–1.29 830–2480 Ghaini et al. (2010)
Fig. 8. Comparison between calculated (Eq. (12)) and experimental (Eq. (9))
droplet volume.

where dd is the droplet equivalent diameter (diameter of a
spherical droplet with the same volume). α is a constant that
depends on the fluid properties and the flow characteristics inside
the droplets differentiated according to the flow structures type
inside the droplets. In the present work, capillary number is low
and the droplets are highly confined resulting in flow patterns
with numerous vortices as illustrated by Fig. 10. Indeed Cad ranges
from 0.0007 to 0.0103 and Ld/wC from 1.7 to 6.6. In this particular
case, it leads to α¼4.36e"04.
As illustrated in Fig. 11, mass transfer coefficients obtained
in the present experimental study are well estimated by Eq. (14).
The maximal relative error between the model and the experi-
ments observed is 55% and the median relative error is about 10%.
5.2. Comparison with literature
5.2.1. Mass transfer models description
Mass transfer models proposed in literature for systems
approaching liquid–liquid slug flow are described afterwards.
5.2.1.1. Dispersed liquid–liquid systems in infinite media. Numerous
empirical models are available (Knudsen et al., 1998; Slater, 1994).
Skelland and Wellek correlation seems appropriate for comparison
with experiments in microchannels since they developed a model
for circulating droplets, i.e. with internal recirculation loops and a
non-oscillating interface which is close from the flow structures
observed with liquid–liquid slug flow in microdevices (Harries
et al., 2003; Sarrazin et al., 2008; Kashid et al., 2008). This model is
given by Eq. (15). Mass transfer coefficient depends on Fourier
number defined as a function of the exposure time te and the
diffusion time. The exposure time is estimated using Eq. (16)
assuming that the contact length corresponds to the length
traveled by a fluid element by convection at the droplets
interface at the interface velocity, i.e. the droplet velocity. The
diffusion time is related to the diffusivity of the solute in the
dispersed phase Dd and the characteristic length of diffusion in this
phase, assumed to be equal to half the equivalent diameter of the
droplet:
kdddDd
¼ 31:4ρcUddd
μc
! "0:371μcUd
s
! "0:371 4Dd
tedd2
!"0:338μd
ρdDd
! ""0:125
ð16Þ
te ¼ðLd"wdÞþπwd=2
Udð17Þ
The diffusion coefficient of acetone in toluene in highly diluted
solutions at ambient temperature is estimated at 2.8e"09 m2 s"1
(Bulicka and Prochazka, 1976).
5.2.1.2. Gas–liquid Taylor flow at microscale. Gas–liquid two-phase
flow in microchannels has been recently intensely investigated,
notably in Taylor flow regime. This interest is notably due to the
diversity of potential applications for these systems (miniaturization
of chemical processes for safety and/or heat and mass transfer
enhancement, biotechnology systems, space applications, etc.).
Several authors proposed models to predict mass transfer co-
efficients in such two-phase flow (Bercic and Pintar, 1997;
Irandoust et al., 1992; Kreutzer, 2003; Van Baten and Krishna,
2004; Vandu et al., 2005; Yue et al., 2007; Liu and Wang, 2011).
Shao et al. (2010) compared most of these models with their own
mass transfer coefficients obtained by computational fluid dynamics
simulations. They observed three tendencies: (i) models based on
mass transfer contributions from both bubble caps and film between
the bubble and the wall tend to overestimate their values (van );
(ii) models where only the film contributes to mass transfer give
reasonable predictions (Vandu et al., 2005); and (iii) models where
only the bubble caps contribute to mass transfer tend to under-
estimate their values. These models were established under
conditions where the film quickly saturates because of large bubble
lengths (Bercic and Pintar, 1997) or high bubble velocities (Yue
et al., 2007).
In order to compare mass transfer mechanisms in gas–liquid
flow and in liquid–liquid slug flow, three models are considered:
! Van Baten and Krishna (2004) model which considers that the
entire bubble surface contributes to mass transfer. They express
mass transfer coefficient as the sum of two contributions given
by Eq. (17). Bubble caps contribution is estimated according
to Higbie penetration theory Eq. (18). The term related to the
Fig. 9. Mass transfer coefficient in function of droplets velocity.
Fig. 10. Flow structure observed for confined droplets at low capillary number
(Di Miceli Raimondi et al., 2008).
Fig. 11. Comparison between experimental and calculated mass transfer coeffi-
cients (Eq. (14)).
transfer through the film is obtained by referring to the model
of mass transfer from a bubble to a laminar falling film, as a
function of Fourier number (Eqs. (19)–(22)). This number is
relevant for the saturation rate of the film (Pohorecki, 2007).
In the experiments, the Fourier number ranges from 0.02 to 1.1.
The formulation given by Eq. (20) has been privileged for
Foo0.1; Eq. (21) for Fo40.1. The film thickness δfilm can be
estimated at 0.025 wC for Cao0.04 (Kreutzer et al., 2005).
Dc corresponds to the diffusion coefficient of acetone in
water in dilute solution at ambient temperature, equal to
1.2e"09 m2 s"1 (Grossmann and Winkelmann, 2005):
kLa¼ kL;capacapþkL;f ilmaf ilm ð18Þ
kL;capacap ¼2ffiffiffi
2p
π
ffiffiffiffiffiffiffiffiffiffiffi
DcUd
wd
s !
πw2d
LUCw2C
!
ð19Þ
Fof ilm ¼DcLf ilm
Udδ2f ilm
ð20Þ
kL;f ilmaf ilm ¼ 2
ffiffiffiffiffiffiffiffiffiffiffiffiffiffiffiffiffiffiffiffiffi
DcUd
πðLd"wdÞ
s
lnð1=ΔÞ1"Δ
!
4wdðLd"wdÞLUCw
2C
!
for Fof ilmo0:1
ð21Þ
kL;f ilmaf ilm ¼ 3:41Dc
δf ilm
! "
4wdðLd"wdÞLUCw2
C
!
for Fof ilm41 ð21Þ
Δ¼ 0:7857expð"5:121Fof ilmÞþ0:1001expð"39:21Fof ilmÞþ0:0360expð"105:6Fof ilmÞ70:04 ð22Þ
! Van Baten and Krishna (2004) model where only the film
contribution is taken into account.! Bercic and Pintar (1997) model where only the bubble caps
contribution is taken into account because of fast film satura-
tion:
kLa¼0:111Ud
1:19
ðð1"εdÞLUCÞ0:57ð23Þ
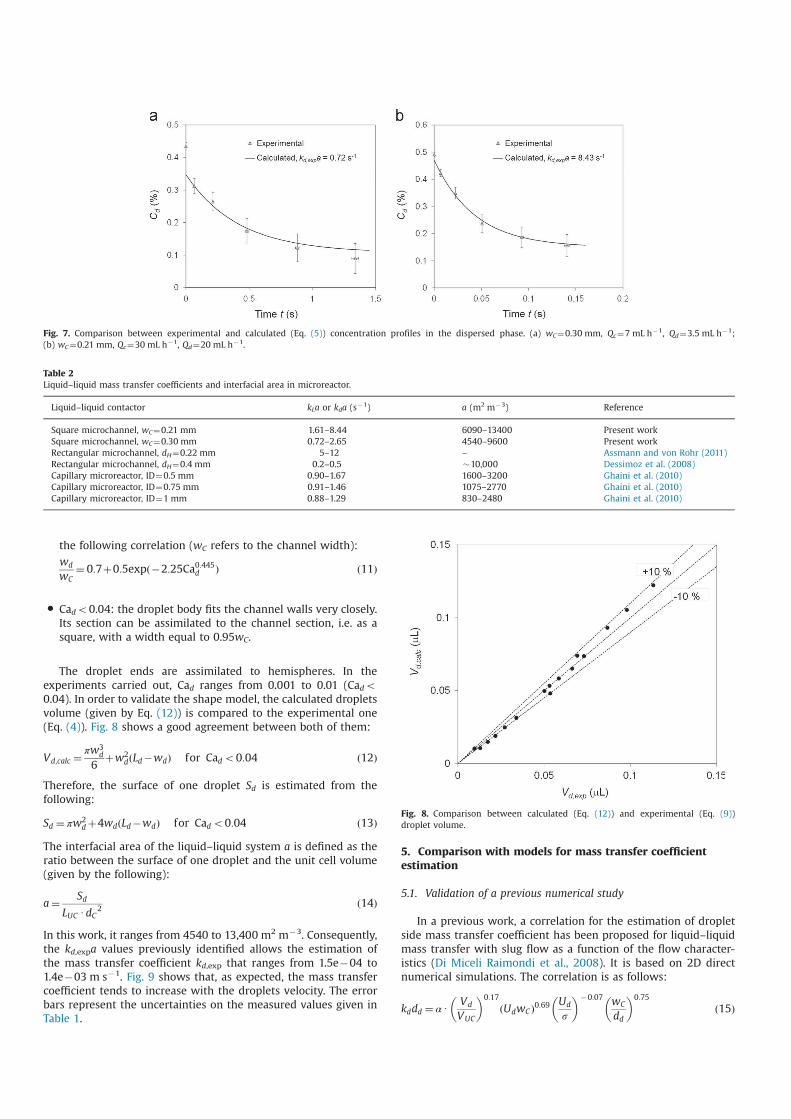
5.2.2. Comparison of experimental volumetric mass transfer
coefficient with models
Fig. 12 shows the comparison between our experimental
results obtained for liquid–liquid slug flow in square microchan-
nels and the different models described above.
Concerning the models established for gas–liquid mass transfer
in microchannels, Bercic and Pintar model underestimates the
experimental results (90% of relative error). Film saturation is not
quickly achieved: this is consistent with Fourier number values
that are lower than 1. Van Baten and Krishna and film models
overestimate the experiments. Mixing in bubbles is more intense
than in confined droplets. The resistance in the dispersed phase
to transfer that is neglected in gas–liquid Taylor flow limits the
reliability of the gas–liquid models to predict liquid–liquid mass
transfer.
Skelland and Wellek model underestimates the experiments
with a mean relative error of 50%. It may be more appropriate to
represent mass transfer with microfluidic flow patterns where
droplets are not confined. Indeed, their model gives reasonable
estimation of the experimental data for the higher values of kda
where the droplets confinement is minimal (Ld/wC¼1.77–2.35).
Therefore, it appears that confinement is favorable to mass
transfer thanks to the appearance of mixing flow structures inside
the droplets.
6. Conclusions
Liquid–liquid mass transfer experiments have been carried out
in square microchannels of 0.21–0.30 mmwidth. The microreactor
is composed of a main channel where the transfer operates
and secondary channels that allows the selective extraction of
the continuous phase for analysis. The pilot and the analytical
method used enable to follow the enrichment of the continuous
phase (water) in solute (acetone). The concentration profile of
solute in the dispersed phase (toluene) all along the microchannel
is obtained by mass balance from which a droplet side mass
transfer coefficient is identified. The experimental results validate
the correlation for mass transfer coefficients estimation for liquid–
liquid slug flow in microchannels issued in a previous work from
2D direct numerical simulations.
In order to understand the transfer mechanism in the studied
system, the experimental results are compared with models
available in literature: liquid–liquid mass transfer in recirculating
drops with non-oscillating interface in channel of conventional
size and gas–liquid mass transfer in microchannels with Taylor
flow pattern. The comparison shows that when the flow structure
in the droplets presents numerous vortices (Cado0.01, Ld/wC41),
the droplets have a behavior intermediate between bubbles with
high mixing rate in the gas phase and droplets that are not
confined by the channel walls, the confinement being a factor of
enhancement of mass transfer thanks to the appearance of
recirculation flow structures.
This work could be completed by carrying out experiments
with different flow pattern inside the droplets. Moreover the
operating temperature and/or the fluids should be modified in
order to investigate the influence of the fluids physical properties
on mass transfer.
Nomenclature
a interfacial area (m2 m"3)
C concentration in terms of mass fraction (kg of
solute kg"1 of phase)
Ca Capillary numberFig. 12. Comparison between experimental results and models.

dd droplet equivalent diameter (m)
dH channel hydraulic diameter (m)
D diffusion coefficient (m s"2)
f frequency (s"1)
Fo Fourier number
k mass transfer coefficient (m s"1)
L length (m)
m equilibrium constant
Q volumetric flow rate (m3 s"1)
S surface (m2)
t residence time (s)
te exposure time (s)
U velocity (m s"1)
V volume (m3)
w width (m)
Greek letters
δ thickness (m)
Δ parameter defined by Eq. (22)
μ dynamic viscosity (Pa s)
ρ density (kg m"3)
s interfacial tension (N m"1)
Φ mass flux by droplet surface unit (kg s"1 m"2)
Subscripts
c continuous phase
C channel
calc calculated
cap refers to the droplets caps
d dispersed phase or droplets
exp refers to experimental data
film refers to the film
L liquid phase
mod estimated with a mass transfer coefficient model
ref at time of reference
Superscripts
0 at inlet
1 at thermodynamic equilibrium
Acknowledgments
This work has been supported by the 6th Framework EU under
Grant IMPULSE no NMP2-CT-2005–011816 and the Institut
National Polytechnique of Toulouse. Other contributing partners
are CNRS, the University of Toulouse and LAAS.
References
Assmann, N., von Rohr, P.R., 2011. Extraction in microreactors: intensification byadding an inert gas phase. Chem. Eng. Proc. Process Intensification 50, 822–827.
Bercic, G., Pintar, A, 1997. The role of gas bubbles and liquid slug lengths on masstransport in the Taylor flow through capillaries. Chem. Eng. Sci. 52 (21–22),3709–3719.
Bulicka, J., Prochazka, J., 1976. Diffusion coefficients in some ternary systems.J. Chem. Eng. Data 21 (4), 452–456.
Burns, J.R., Ramshaw, C., 2001. The intensification of rapid reactions in multiphasesystems using slug flow in capillaries. Lab Chip 1, 10–15.
Chun, M.-S., Shim, M.S., Choi, N.W., 2006. Fabrication and validation of a multi-channel type microfluidic chip for electrokinetic streaming potential devices.Lab Chip 6, 302–309.
Commenge, J.M., Falk, L., Corriou, J.P., Matlosz, M., 2005. Analysis of microstructuredreactor characteristics for process miniaturization and intensification. Chem.Eng. Technol. 28 (4), 446–458.
De Mello, A., Wooton, R., 2002. But what is it good for? Applications of microreactortechnology for the fine chemical industry. Lab Chip 2, 7N–13N.
Dessimoz, A.L., Cavin, L., Renken, A., Kiwi-Minsker, L., 2008. Liquid–liquid two-phase flow patterns and mass transfer characteristics in rectangular glassmicroreactors. Chem. Eng. Sci. 63, 4035–4044.
Di Miceli Raimondi, N., Prat, L., Gourdon, C., Cognet, P., 2008. Direct numericalsimulations of mass transfer in square microchannels for liquid–liquid slugflow. Chem. Eng. Sci. 63, 5522–5530.
Dummann, G., Quittmann, U., Groschel, L., Agar, D.W., Worz, O., Morgenschweis, K.,2003. The capillary-microreactor: a new reactor concept for the intensificationof heat and mass transfer in liquid–liquid reactions. Catal. Today 79–80,433–439.
Ehrfeld, W., Hessel, V., Lowe, H., 2000. State of the art of microreaction technology,Microreactors: New Technology for Modern Chemistry. Wiley-VCH, Weinheim,pp. 1–14.
Gao, P., Le Person, S., Favre-Marinet, M., 2002. Scale effects on hydrodynamics andheat transfer in two-dimensional mini and microchannels. Int. J. Therm. Sci. 41,1017–1027.
Gawron, A.J., Scott Martin, R., Lunte, S.M., 2001. Microchip electrophoretic separa-tion systems for biomedical and pharmaceutical analysis. Eur. J. Pharm. Sci. 14,1–12.
Ghaini, A., Kashid, M.N., Agar, D.W., 2010. Effective interfacial area for mass transferin the liquid–liquid slug flow capillary microreactors. Chem. Eng. Proc. ProcessIntensification 49, 358–366.
Grossmann, T., Winkelmann, J., 2005. Ternary diffusion coefficients of glycer-olþacetoneþwater by Taylor dispersion measurements at 298.15 K. J. Chem.Eng. Data 50, 1396–1403.
Guillot, P., Panizza, P., Salmon, J.B., Joanicot, M., Colin, A., Bruneau, C.H., Colin, T.,2006. Viscosimeter on a microfluidic chip. Langmuir 22, 6438–6445.
Gunther, A., Jhunjhunwala, M., Thalmann, M., Schmidt, M.A., Jensen, K.F., 2005.Micromixing of miscible liquids in segmented gas–liquid flow. Langmuir 21,1547–1555.
Harries, N., Burns, J.R., Barrow, D.A., Ramshaw, C., 2003. A numerical model forsegmented flow in a microreactor. Int. J. Heat Mass Transfer 46, 3313–3322.
Irandoust, S., Ertlé, S., Andersson, B., 1992. Gas–liquid mass transfer in Taylor flowthrough a capillary. Can. J. Chem. Eng. 70, 115–119.
Kashid, M.N., Agar, D.W., 2007. Hydrodynamics of liquid–liquid slug flow capillarymicroreactor: flow regimes, slug size and pressure drop. Chem. Eng. J. 131, 1–13.
Kashid, M.N., Fernandez Rivas, D., Agar, D.W., Turek, S., 2008. On the hydrody-namics of liquid–liquid slug flow capillary microreactors Asia-Pac. J. Chem. Eng.3, 150–160.
Knudsen, J.G., Hottel, H.C., Sarofim, A.F., Wankat, P.C., Knaebel, K.S., 1998. Heat andmass transfer. In: Perry, R.H., Green, D.W. (Eds.), Perry's Chemical Engineer'sHandbook, 7th ed. McGraw-Hill, New York.
Kreutzer, M.T., 2003. Hydrodynamics of Taylor Flow in Capillaries and MonolithReactors. Ph.D. Thesis. Delft University of Technology, Delft, The Netherlands.
Kreutzer, M.T., Kapteijn, F., Moulijn, J.A., Heiszwolf, J.J., 2005. Multiphase monolithreactors: chemical reaction engineering of segmented flow in microchannels.Chem. Eng. Sci. 60, 5895–5916.
Laermer, F., Schilp, A., 1996. Method of anisotropically etching silicon, U.S. Patent5501893.
Liu, D., Wang, S., 2011. Gas–liquid mass transfer in Taylor flow through circularcapillaries. Ind. Eng. Chem. Res. 50, 2323–2330.
Marcati, A., Serra, C., Bouquey, M., Prat, L., 2010. Handling of polymer particles inmicrochannels. Chem. Eng. Technol. 33, 1779–1787.
Misek, T., Berger, R., Schröter, J., 1985. Standard Test Systems for Liquid Extraction.The Institution of Chemical Engineers, Rugby, England.
Pohorecki, R., 2007. Effectiveness of interfacial area for mass transfer in two-phaseflow in microreactors. Chem. Eng. Sci. 62, 6495–6498.
Prat, L.E., Sarrazin, F., Tasseli, J., Marty, A., 2006. Increasing and decreasing dropletsvelocity in micro channels. Microfluidics Nanofluidics 2, 271–274.
Sarrazin, F., 2006. Microréacteurs diphasiques pour le développement rapide desprocédés. Ph.D. Thesis. University of Toulouse, Toulouse, France.
Sarrazin, F., Bonometti, T., Prat, L., Gourdon, C., Magnaudet, J., 2008. Hydrodynamicstructures of droplets engineered in rectangular micro-channels. MicrofluidicsNanofluidics 5 (1), 131–135.
Shen, S., Xu, J.L., Zhou, J.J., Chen, Y., 2006. Flow and heat transfer in microchannelswith rough wall surface. Energy Convers. Manage. 47, 1311–1325.
Shao, N., Gavriilidis, A., Angeli, P., 2010. Mass transfer during Taylor flow inmicrochannels with and without chemical reaction. Chem. Eng. J. 160, 873–881.
Skelland, A.H.P., Wellek, R.M., 1964. Resistance to mass transfer inside droplets.AIChE J. 10 (4), 491–496.
Stanley, C.E., Wootton, R.C.R, de Mello, A.J., 2012. Continuous and segmented flowmicrofluidics: applications in high-throughput chemistry and biology. Chimia66, 88–98.
Slater, M.J., 1994. Rate coefficients in liquid–liquid extraction systems. In: Godfrey,J.C., Slater, M.J. (Eds.), Liquid–Liquid Extraction Equipment. Wiley, New York,pp. 45–94.
Stankiewicz, A.I., Moulijn, J.A., 2000. Process intensification: transforming chemicalengineering. Chem. Eng. Prog. 96 (1), 22–34.
Tang, M., Liu, A.Q., Agarwal, A., Habib, M.H., 2007. A single-mask substrate transfertechnique for the fabrication of high-aspect-ratio micromachined structures.J. Micromech. Microeng. 17, 1575–1582.

Tsoligkas, A.N., Simmons, M.J.H., Wood, J., Frost, C.G., 2007. Kinetic and selectivitystudies of gas–liquid reaction under Taylor flow in a circular capillary. Catal.Today 128, 36–46.
Van Baten, J.M., Krishna, R., 2004. CFD simulations of mass transfer from Taylorbubbles rising in circular capillaries. Chem. Eng. Sci. 59, 2535–2545.
Vandu, C.O., Liu, H., Krishna, R., 2005. Mass transfer from Taylor bubbles rising insingle capillaries. Chem. Eng. Process. 60, 6430–6437.
Yue, J., Chen, G., Yuan, Q., Luo, I., Gonthier, Y., 2007. Hydrodynamics and masstransfer characteristics in gas–liquid flow through a rectangular microchannel.Chem. Eng. Sci. 62, 2096–2108.