Experimental study of a kerosene fuelled internal ... · Experimental study of a kerosene fuelled...
68
Experimental study of a kerosene fuelled internal combustion engine Tomás de Almeida Formosinho Sanchez Dissertação para obtenção do Grau de Mestre em Engenharia Mecânica Júri Presidente: Professor Luís Rego da Cunha Eça Orientador: Professor José Miguel Carrusca Mendes Lopes Vogais: Professor Tiago Alexandre Abranches Teixeira Lopes Farias Setembro de 2008
Transcript of Experimental study of a kerosene fuelled internal ... · Experimental study of a kerosene fuelled...
Experimental study of a kerosene fuelled internal combustion engine
Tomás de Almeida Formosinho Sanchez
Dissertação para obtenção do Grau de Mestre em
Engenharia Mecânica
Júri
Presidente: Professor Luís Rego da Cunha Eça
Orientador: Professor José Miguel Carrusca Mendes Lopes
Vogais: Professor Tiago Alexandre Abranches Teixeira Lopes Farias
Setembro de 2008

Etude expérimentale d’un moteur à combustion interne fonctionnant au kérosène
Master thesis performed at the Industrial Energy Systems Laboratory of the Federal Institute of Technology in Lausanne
Tomás Formosinho Sanchez Candidate
Matthieu Charrier and Claudia Täschler
Responsible Engineers
Prof. Daniel Favrat Responsible Lecturer
June 20, 2008

Abstract
Mistral Engines, a Swiss Aeronautical Company wishes to be able to have operating Wankel
engines on kerosene fuel because of its market availability.
Kerosene is a fuel with lower cetane number than diesel fuel, thus it should give a longer ignition
delay. This makes it viable for lower emissions since the longer ignition delay means longer time for
the fuel to mix with the in-cylinder gas prior to combustion onset.
With the cooperation of the Industrial Energy Systems Laboratory of the Swiss Federal Institute of
Technology in Lausanne, a study on the combustion of kerosene in an internal combustion engine
(ICE) is here presented.
This study is performed in a mono cylinder ICE with variable Compression Ratio (CR) and
Variable Valve Timing (VVT).
Different strategies, such as Homogeneous Charge Compression Ignition (HCCI), Homogeneous
Charge Spark Ignition (HCSI), Controlled Auto Ignition (CAI) and a combustion pre-chamber concept
are considered.

Resumo
A Mistral Engines, uma empresa aeronáutica Suíça, pretende ter os seus motores Wankel a
trabalhar com querosene uma vez que o mercado dispõe mais deste tipo de combustível.
O querosene é um combustível com menor índice de cetano que o diesel, desta forma deve ter
um maior atraso de ignição. Isto torna este tipo de combustível viável para menores emissões de
poluentes uma vez que o maior atraso de ignição faz com que o combustível tenha mais tempo para
se misturar com os gases no cilindro antes do início da combustão.
O estudo da combustão do querosene foi efectuado no Industrial Energy Systems Laboratory no
Swiss Federal Institute of Technology em Lausanne.
Este estudo é realizado num motor de combustão interna (ICE) mono cilíndrico com razão de
compressão (CR) e regulação dos tempos de válvulas (VVT) variáveis.
Várias estratégias são tidas em consideração, tais como, Ignição por Compressão com mistura
Homogénea (HCCI), Ignição por Faísca com mistura Homogénea (HCSI), Auto Ignição Controlada
(CAI) e por último uma pré-câmara de combustão é considerada.

Acknowledgments
I would like to show my gratitude to several groups of people.
Principally, engineers Matthieu Charrier and Claudia Täschler for spending their valuable time to
help me with my project.
To the Industrial Energy Systems Laboratory for providing me with added technology and a
workplace at EPFL and the materials and documentation to help me with my research.
To Ricardo Beira who has helped me with the pre-chamber CAD drawings and to Marc Salle and
his technicians for the pre-chamber manufacturing.
To Prof. Mendes Lopes, who has helped me with several details communicating from Portugal by
e-mail.
In addition, I wish to thank Dr. Daniel Favrat. Without his input I would not have been able to study
the topic in such great detail and it is as a result of him that I undertook this project at all.
Finally, to Elspeth Gray and Alina Dütting for the English issues that I have been through and for
the intensive readings on a matter that is not their field of studies.

1
Contents
CONTENTS............................................................................................................................................. 1
SYMBOLS AND ACRONYMS................................................................................................................ 3
TABLE OF FIGURES.............................................................................................................................. 5
CHAPTER 1 ............................................................................................................................................ 7
INTRODUCTION ...................................................................................................................................... 7
CHAPTER 2 ............................................................................................................................................ 8
STATE OF THE ART................................................................................................................................. 8
CHAPTER 3 .......................................................................................................................................... 10
INTERNAL COMBUSTION ENGINES THEORY............................................................................................. 10 3.1. Fundamental operating principles ............................................................................................. 10 3.2. Combustion in engines ............................................................................................................. 10
3.2.1. Normal combustion .............................................................................................................. 11 3.2.2. Abnormal Combustion.......................................................................................................... 13 3.2.3. Combustion pre-chamber..................................................................................................... 14 3.2.4. Lean combustion mode and HCCI ....................................................................................... 15 3.2.5. Arrhenius Law ...................................................................................................................... 16 3.2.6. Fuel Factors ......................................................................................................................... 17
3.3. Rotary Wankel engine............................................................................................................... 18 3.3.1. Working cycle and principles of motion ................................................................................ 19 3.3.2. Advantages/disadvantages .................................................................................................. 20
CHAPTER 4 .......................................................................................................................................... 22
EXPERIMENTAL INSTALLATION AND METHODOLOGY................................................................................ 22 4.1. Engine test bench and fuel properties....................................................................................... 22
4.1.1. Common-rail injection characteristics................................................................................... 24 4.1.2. Ignition system ..................................................................................................................... 24
4.2. Variables and formulas ............................................................................................................. 25 4.2.1. Cylinder Volume................................................................................................................... 25 4.2.2. Cylinder Gas Temperature................................................................................................... 25 4.2.3. Mean Effective Pressures .................................................................................................... 26 4.2.4. Efficiencies ........................................................................................................................... 26 4.2.5. Polytrophic coefficient .......................................................................................................... 27 4.2.6. Instantaneous heat release (IHR) ........................................................................................ 27 4.2.7. Cumulative heat release (CHR) ........................................................................................... 28 4.2.8. Coefficient COV ................................................................................................................... 29
4.3. Calculation Methodology........................................................................................................... 29
CHAPTER 5 .......................................................................................................................................... 30
RESULTS AND DISCUSSION .................................................................................................................. 30 5.1. Effects of kerosene temperature on combustion performance.................................................. 30 5.2. Excess of air ratio λ variation with SI ........................................................................................ 32 5.3. Pre-Injection timing variation..................................................................................................... 35 5.4. Excess of air ratio λ variation with pre-chamber, SI and CI comparison ................................... 38
CHAPTER 6 .......................................................................................................................................... 44
CONCLUSIONS AND PERSPECTIVES....................................................................................................... 44 6.1. Conclusions .............................................................................................................................. 44 6.2. Perspectives ............................................................................................................................. 45
REFERENCES ...................................................................................................................................... 46
BIBLIOGRAPHY ................................................................................................................................... 47
APPENDIX A......................................................................................................................................... 50
VARIMAX TEST STAND .......................................................................................................................... 50 A1-Geometrical parameters .................................................................................................................... 50 A2-Technical parameters ........................................................................................................................ 50

2
A3-Injector fuel quantity........................................................................................................................... 50
APPENDIX B......................................................................................................................................... 52
BOSCH GLOW-PLUG PROPERTIES AND PRE-CHAMBER DESIGN................................................................ 52 B1-Bosch Glow Plug ............................................................................................................................... 52 B2-Pre-chamber drawings....................................................................................................................... 54
APPENDIX C......................................................................................................................................... 56
RESULTS: PLOTS AND TABULATED RESULTS......................................................................................... 56 C1-Fuel tank temperature variation......................................................................................................... 56 C2-Pre-injection timing variation ............................................................................................................. 58 C3-Excess of air ratio λ variation............................................................................................................. 60 C4-Excess of air ratio λ variation (Pre-chamber)..................................................................................... 62
3
Symbols and Acronyms a Crank shaft radius [mm] ABDC After bottom dead centre ATDC After top dead centre BBDC Before bottom dead centre BDC Bottom dead centre BMEP Break mean effective pressure [bar] BTDC Before top dead centre CA or CAD Craft shaft angle [º] CAI Controlled auto igniton cc Cubic centimetres [cm3] CHR Cumulative heat release [J] CI Compression ignition COV Coefficient of variation CR Compression ratio d Cylinder bore [mm] DI Direct Injection ECU Engine unit control EGR Exhaust gas recirculation EVC Exhaust valve closure EVO Exhaust valve opening FuelMEP Fuel mean effective pressure [bar] HAP Hazardous air pollutant HCCI Homogeneous Charge Compression Ignition HTHR High temperature heat release IHR Instantaneous heat release [J] IMEP Indicated mean effective pressure [bar] IVC Intake valve closure IVO Intake valve opening L Piston rod length [mm] LHV Low heat value [MJ/kg] LTHR Low temperature heat release MBT Maximum brake torque MEP Mean effective pressure [bar] MIE Minimum ignition energy [mJ] N Engine speed [RPM, RPS, Hz] NOX Oxides of nitrogen P Cylinder pressure [bar] Pi Indicated power [W, kW] PM Particle mater Q Cylinder energy release [J,kJ] QMEP Heat release mean effective pressure RPM Rotation per minute [rpm] SI Spark ignition TDC Top dead centre THC Total hydrocarbons UAV Unmanned Aeronautical Vehicles V Total cylinder volume [cm3] VVT Variable valve timing Wi Indicated work cycle [J, kJ]

4
γ Ratio between specific heats, adiabatic polytrophic index
σγ Evaluated polytrophic index
iη Indicated efficiency
combη Combustion efficiency
gasη Gas exchange efficiency
thη Thermodynamic efficiency θ Crank shaft angle [º] λ Air-to-fuel ratio or excess of air ratio τ Ignition delay [ms]
5
Table of figures
Figure 1 Hypothetical pressure diagram for SI engine.......................................................................... 12 Figure 2 Hypothetical pressure diagram for CI engine.......................................................................... 12 Figure 3 Cylinder head and combustion pre-chamber images ............................................................. 14 Figure 4 Real photos of pre-chamber and glow plug ............................................................................ 15 Figure 5 HCCI Instantaneous heat release focusing LTHR and HTHR............................................... 16 Figure 6 Wankel rotary engine components.......................................................................................... 18 Figure 7 Wankel works cycle................................................................................................................. 19 Figure 8 Schematic set-up of the engine test bench............................................................................. 22 Figure 9 Cylinder head and injector ...................................................................................................... 23 Figure 10 Calculation flow chart ............................................................................................................ 29 Figure 11 Pressure and IHR as function of crank angle for fuel tank temperature variation ................ 30 Figure 12 Combustion duration and Thermodynamic efficiency as function of fuel tank temperature . 31 Figure 13 CHR and Cylinder gas temperature as function of crank angle for various fuel tank
temperatures .......................................................................................................................... 31 Figure 14 Q5% as function of fuel tank temperature............................................................................. 32 Figure 15 Pressure, Cylinder gas temperature, IHR and CHR as function of crank angle for various λ
............................................................................................................................................... 33 Figure 16 Q5% and Combustion duration as function of λ.................................................................... 34 Figure 17 Combustion and Thermodynamic efficiencies as function of λ............................................. 34 Figure 18 Pressure and IHR as function of crank angle for pre-injection timing variation .................... 35 Figure 19 CHR and Cylinder gas temperature as function of crank angle for pre-injection timing
variation.................................................................................................................................. 36 Figure 20 Q50% and Combustion duration as function of crank angle for pre-injection timing variation
............................................................................................................................................... 37 Figure 21 Combustion Efficiency as function of crank angle for pre-injection timing variation ............. 37 Figure 22 Pressure (Pre-chamber and SI) as function of crank angle for various λ ............................. 38 Figure 23 IHR and CHR (Pre-chamber) as function of crank angle for various λ ................................. 39 Figure 24 Q5% and Combustion duration (Pre-chamber, SI and CI) as function of λ .......................... 39 Figure 25 Combustion and Thermodynamic efficiencies (Pre-chamber, SI and CI) as function of λ ... 40 Figure 26 QMEP and FuelMEP (Pre-chamber, SI and CI) as function of λ .......................................... 40 Figure 27 Comparison of combustion stability (Pre-chamber and SI) .................................................. 41 Figure 28 Indicated Efficiency (Pre-chamber, SI and CI) as function of λ ............................................ 41

6
7
Chapter 1
Introduction
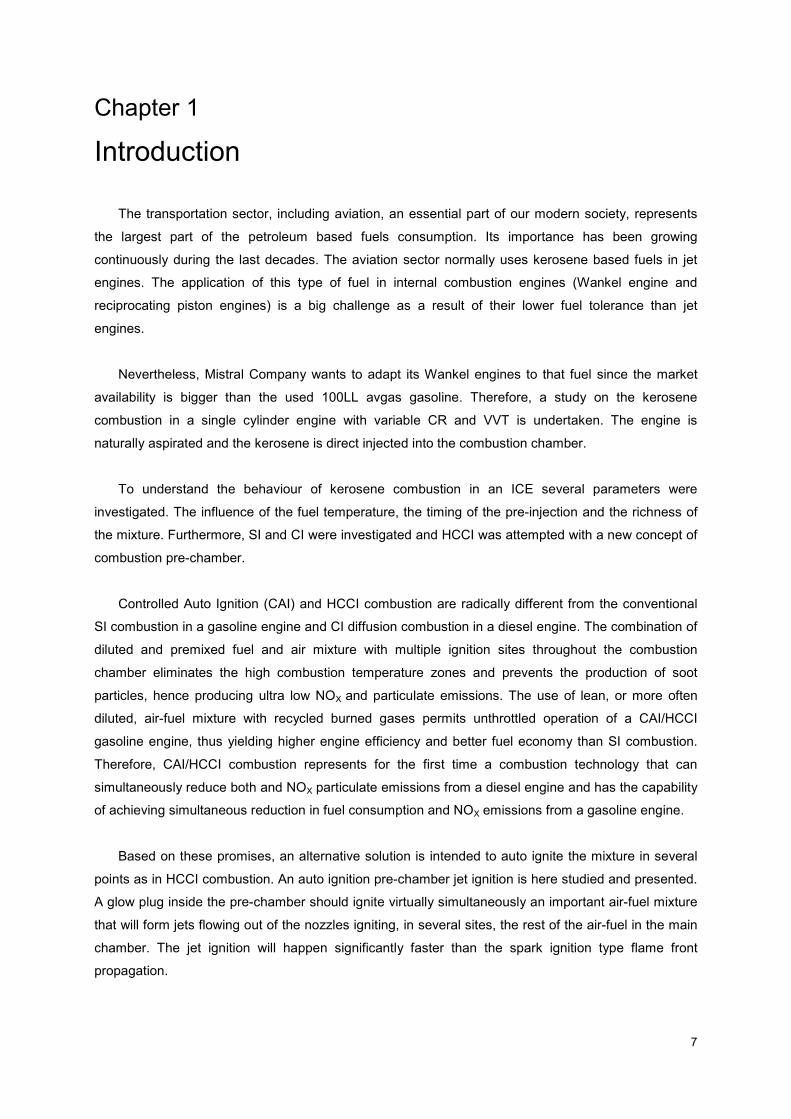
The transportation sector, including aviation, an essential part of our modern society, represents
the largest part of the petroleum based fuels consumption. Its importance has been growing
continuously during the last decades. The aviation sector normally uses kerosene based fuels in jet
engines. The application of this type of fuel in internal combustion engines (Wankel engine and
reciprocating piston engines) is a big challenge as a result of their lower fuel tolerance than jet
engines.
Nevertheless, Mistral Company wants to adapt its Wankel engines to that fuel since the market
availability is bigger than the used 100LL avgas gasoline. Therefore, a study on the kerosene
combustion in a single cylinder engine with variable CR and VVT is undertaken. The engine is
naturally aspirated and the kerosene is direct injected into the combustion chamber.
To understand the behaviour of kerosene combustion in an ICE several parameters were
investigated. The influence of the fuel temperature, the timing of the pre-injection and the richness of
the mixture. Furthermore, SI and CI were investigated and HCCI was attempted with a new concept of
combustion pre-chamber.
Controlled Auto Ignition (CAI) and HCCI combustion are radically different from the conventional
SI combustion in a gasoline engine and CI diffusion combustion in a diesel engine. The combination of
diluted and premixed fuel and air mixture with multiple ignition sites throughout the combustion
chamber eliminates the high combustion temperature zones and prevents the production of soot
particles, hence producing ultra low NOX and particulate emissions. The use of lean, or more often
diluted, air-fuel mixture with recycled burned gases permits unthrottled operation of a CAI/HCCI
gasoline engine, thus yielding higher engine efficiency and better fuel economy than SI combustion.
Therefore, CAI/HCCI combustion represents for the first time a combustion technology that can
simultaneously reduce both and NOX particulate emissions from a diesel engine and has the capability
of achieving simultaneous reduction in fuel consumption and NOX emissions from a gasoline engine.
Based on these promises, an alternative solution is intended to auto ignite the mixture in several
points as in HCCI combustion. An auto ignition pre-chamber jet ignition is here studied and presented.
A glow plug inside the pre-chamber should ignite virtually simultaneously an important air-fuel mixture
that will form jets flowing out of the nozzles igniting, in several sites, the rest of the air-fuel in the main
chamber. The jet ignition will happen significantly faster than the spark ignition type flame front
propagation.
8
Chapter 2
State of the art
The interpretation of kerosene combustion represents a real challenge because practical jet fuels
are complex mixtures of several hundreds of hydrocarbons. Nevertheless, a large-scale study [1] has
been performed to try to solve this issue, in fact some experimental kinetic studies of the ignition,
oxidation and combustion of kerosene have been carried out and nowadays it is a better known
matter.
There has always been a difference between SI (Otto-cycle) and CI (Diesel-cycle) engines using
the heavier fuels such as diesel. Many attempts to develop an engine that would bridge this difference
have been tried. Combustion occurs between limited fuel-air ratios that will be affected by cylinder
temperature, volatility and boiling point of the fuel, and method of introduction. With the advent of
today’s electronic control, combustion and fuel system developments, there is a growing interest in
combining the positive attributes of both SI and CI engines.
Typically, CI engines have been utilized with heavy fuels, however they have significant
drawbacks when utilized in a highly demanding mobility environment, such as auxiliary power sources,
outboard engines, and UAV. These drawbacks include poor power to weight ratio, poor cold start
capability, bad vibration characteristics and inability to run with lighter fuels such as petrol.
SI heavy fuel engines can retain the desirable features of the petrol engine in terms of
power/weight and packaging size and operate on a wider range of fuels than the traditional CI engine.
Previous developments of SI heavy fuels and multi-fuel engines were limited with spark plug
fouling/carbonning. The inability to be able to run satisfactorily across the total load/speed range and
poor start ability, was a problem exacerbated with cold environmental conditions.[2]
Paper [2] examines the development of both 2 and 4-stroke SI engines using air assisted DI
systems and presents the capability of both 2 and 4-stroke engines converted to operate on multi
fuels. A description of the working principle of an air assist DI combustion system can be found in that
paper. The ultra small droplet sizes aid fuel vaporisation which is especially important in heavy fuel
applications, where the fuel is less volatile. The air assisted direct injector has been shown to be a
very efficient fuel atomizer providing an extremely well atomized spray. In fact, it is highly important
that the fuel is well atomized for preventing spark plug fouling and cold start issues.
Orbital Corporation has been involved in programs to apply the air assist DI system to 2 and 4-
stroke spark ignited engine applications. From a 50cc single cylinder 2-stroke engine, to larger multi-
cylinder 3.0L V6, as well as 4-stroke engines with cylinder sizes between 380 and 550cc. The fuels
used for these applications include kerosene type fuels as well as diesel fuels.
In paper [2] it is shown that the results of air assisted heavy fuel SI engine, when working at full
load operation, present similar behaviour between 2 and 4-stroke engines. The results show that
some loss in full load performance occurs with kerosene compared to the baseline petrol engine
performance. The results also show that at the lower and higher speeds, the torque loss is less than at
the mid speeds. At higher engine speeds, not only BMEP is reduced, but the high speed operation
9
reduces the knock sensitivity. In part load operations, it is possible to say that at most conditions the
fuel consumption is slightly degraded compared to the DI petrol engine.
In fact, high load operation is limited by engine knock with heavy fuels, so spark retard is required,
and this leads to higher specific fuel consumption.
Concerning durability issues, paper [2] concludes that spark plug fouling issue has been
addressed by a small amount of engine development. There was recorded a high potential to oil
dilution due to the lower volatility of heavy fuels. The oil dilution can be so fast that oil quality is
significantly affected, leading to low oil pressure and potential engine damage.
Paper [3] has compared the petrol performance of the stepped piston engine design with other
reciprocation piston engines and Wankel engines, as well as investigated the feasibility and
performance characteristics of kerosene fuelling. Single and twin rotor Wankel engines have been
tested. Kerosene was pre-heated to mean temperature of 428ºC. The engines were not of equal
power output, but a non-dimensional factor of peak-to-peak torque to mean torque enables
fundamental comparison of the different engine types. The stepped piston engine and the Wankel
engines are the ones with less peak-to-peak torque, meaning that they have very low vibrations. This
is particularly important to UAV applications. It has been observed that fuel flow has to be increased
for kerosene operation when compared to the equivalent flow with petrol. Therefore an increase of fuel
consumption is also observed as a 5-10 % power loss when compared to petrol fuelling.
10
Chapter 3
Internal combustion engines theory
This chapter is not aiming to present a complete internal combustion engine theory. It summarizes the
working principles of internal combustion engines necessary to understand the present project.
3.1. Fundamental operating principles
The internal combustion engine is one of the most common forms of engine or prime mover. The
two main types of internal combustion engine are: SI engines, where fuel is ignited by a spark; and CI
engines, where the rise in temperature and pressure during compression is sufficient to cause
spontaneous ignition of the fuel. Both kinds of engines can work in different operating cycles. However
in the present project the four-stroke cycle is the only operating cycle considered. This operating cycle
can be explained by the following description:
1 – The induction stroke. The inlet valve is open and the piston travels down the cylinder, drawing
in a charge of air. In the case of a spark ignition engine, the fuel is usually pre-mixed with the air.
2 – The compression stroke. Both valves are closed, and the piston travels up the cylinder. As the
piston approaches TDC, ignition occurs. In the case of compression ignition engines, the fuel is
injected towards the end of the compression stroke.
3 – The expansion, power or working stroke. Combustion propagates throughout the charge,
raising the pressure and temperature and forcing the piston down. At the end of the power stroke the
exhaust valve opens and the irreversible expansion of the exhaust gases is termed “blow-down”.
4 – The exhaust stroke. The exhaust valve remains open, and as the piston travels up the cylinder
the remaining gases are expelled. At the end of the exhaust stroke, when the exhaust valve closes
some exhaust gas residuals will be left in, these will dilute the next fresh charge.
3.2. Combustion in engines
The fundamental difference between SI and CI engines lies in the type of ignition and combustion
that occurs and not in whether the process is idealised as Otto or Diesel cycle. SI engines usually
have pre-mixed flames while CI engines have diffusion flames. With pre-mixed combustion the fuel/air
mixture must always be close to stoichiometric for reliable ignition and combustion. In contrast, for CI
engines with fuel injection the mixture is close to stoichiometric only at the flame front. To control the
output power a SI engine is throttled, thus reducing the mass of fuel and air in the combustion
chamber. In a CI engine the amount of fuel injected is controlled.
Before explaining the combustion process, some concepts and terminology need to be introduced
here.
11
The auto ignition temperature of a substance is the lowest temperature at which a chemical
reaction will spontaneously combust. This temperature is required to supply the activation energy
needed. The minimum ignition energy (MIE) is the lowest energy content of a point of ignition
source which ignites the most ignitable mixture of fuel and an oxidant. Both values depend on
concentration, pressure and the geometry of the combustion chamber. The flammable limit is a
range of concentrations over which a flammable gas or vapour mixed with air will burn if an ignition
source is present.
The flash point is the lowest temperature at which the vapours above flammable liquid will ignite
on the application of an ignition source. At the flash point temperature, just enough liquid has
vaporized to bring the vapour-air space over the liquid above the lower flammability limit. The
minimum flash point of Jet A kerosene-type fuel is 38ºC.[4]
The auto ignition temperature for kerosene is 280ºC [5] at atmospheric pressure. The MIE of
kerosene depends on the operating temperature and pressure. It can vary from 0.37-7.2mJ depending
on its temperature 30-150ºC. [5] It also depends on the spraying phase or vapour/air mixture
conditions. Notice that a spark plug delivers 30-50mJ [6] of energy, of which most is dissipated by heat
transfer.
The ignition delay is the time gap between high-temperature exposure and the ignition initiation
of the vapour/air mixture. When fuel vapour/oxidizer mixture of combustible proportion is produced
and the fuel activation energy is overcome, ignition takes place.[7]
3.2.1. Normal combustion
In SI engines when piston approaches TDC, a spark is discharged between the sparking plug
electrodes, leaving a small nucleus of flame that propagates into the unburnt gas.
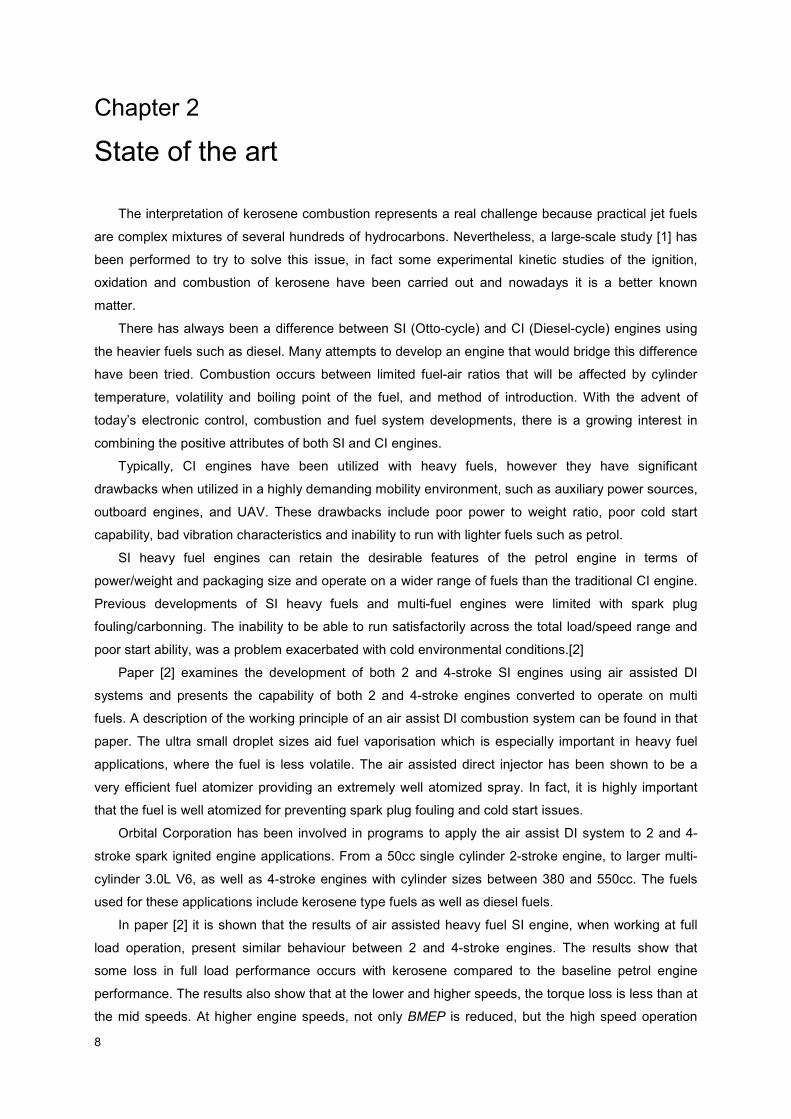
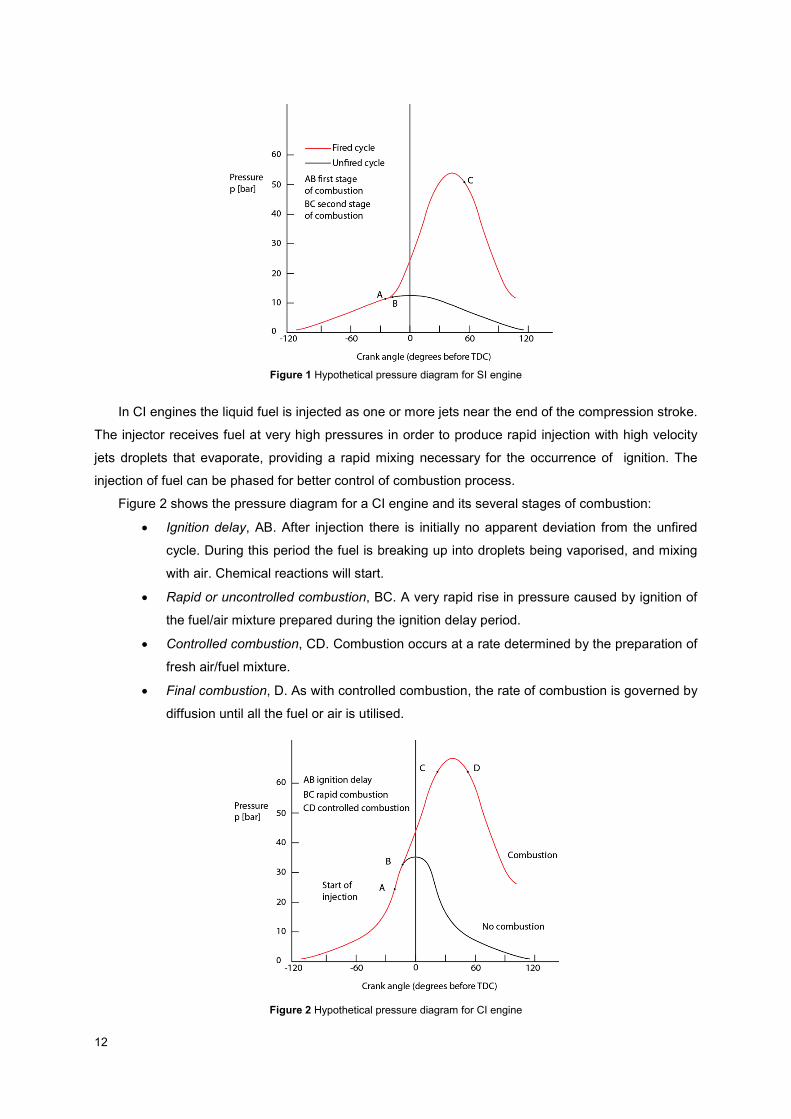
Since combustion takes a finite time (period AC seen on Figure 1), the mixture is ignited before
TDC (ignition advance A), at the end of the compression stroke. According to [8] the delay period is
typically of 1-2 ms duration.
The combustion starts after the delay period with a very short laminar period; after that period a
turbulent combustion dominates the main combustion period. Point C of Figure 1 shows the end of
that period. After the point C combustion normally ends. The flame front is contacting the combustion
chamber walls and some of the mixture remains unburned in quenching zones.
This ignition advance A is intended to lead to an optimum ignition timing, which therefore leads to
MBT. By using the minimum advance, the peak pressures and temperatures in the cylinder are
reduced; this helps to restrict heat transfer, engine noise, emissions and susceptibility to abnormal
combustion.
12
Figure 1 Hypothetical pressure diagram for SI engine
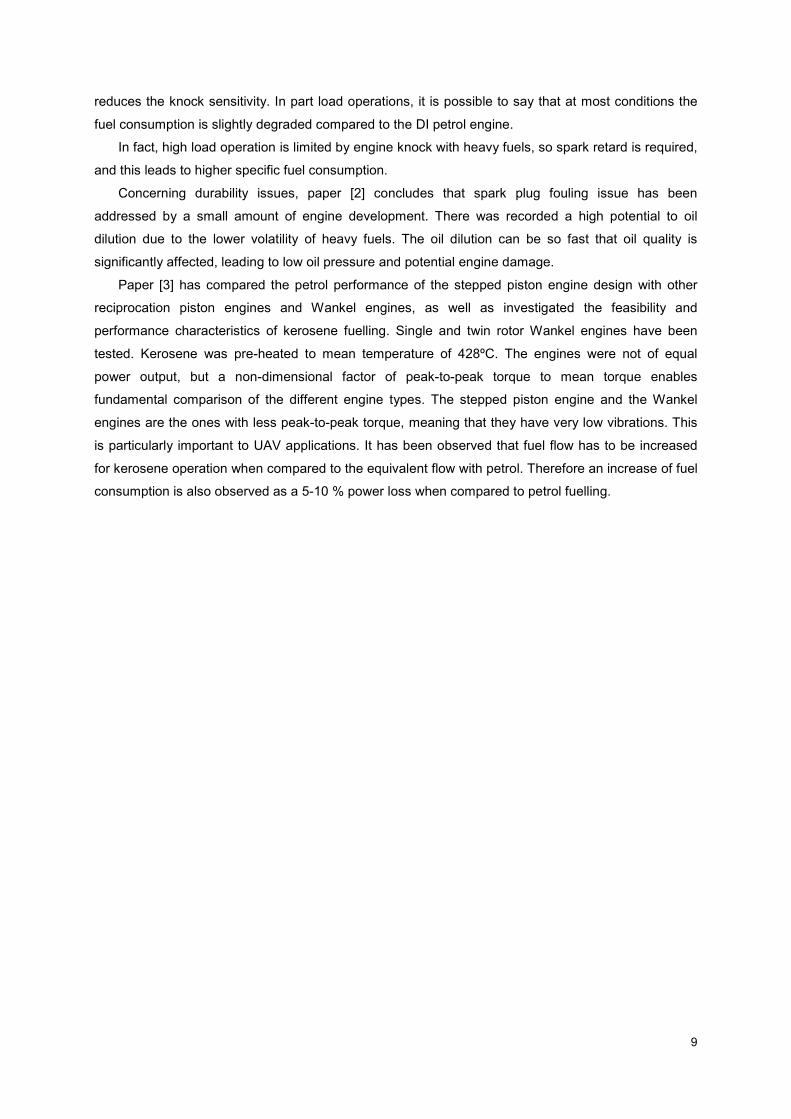
In CI engines the liquid fuel is injected as one or more jets near the end of the compression stroke.
The injector receives fuel at very high pressures in order to produce rapid injection with high velocity
jets droplets that evaporate, providing a rapid mixing necessary for the occurrence of ignition. The
injection of fuel can be phased for better control of combustion process.
Figure 2 shows the pressure diagram for a CI engine and its several stages of combustion:
• Ignition delay, AB. After injection there is initially no apparent deviation from the unfired
cycle. During this period the fuel is breaking up into droplets being vaporised, and mixing
with air. Chemical reactions will start.
• Rapid or uncontrolled combustion, BC. A very rapid rise in pressure caused by ignition of
the fuel/air mixture prepared during the ignition delay period.
• Controlled combustion, CD. Combustion occurs at a rate determined by the preparation of
fresh air/fuel mixture.
• Final combustion, D. As with controlled combustion, the rate of combustion is governed by
diffusion until all the fuel or air is utilised.
Figure 2 Hypothetical pressure diagram for CI engine

13
3.2.2. Abnormal Combustion
Two types of abnormal combustion have been identified: knock and surface ignition.
Knock is the most important abnormal combustion phenomenon. Knock is the auto ignition of a
portion of the fuel, air and residual gas mixture, ahead of the advancing flame. As the flame
propagates across the combustion chamber, the unburned mixture ahead of the flame, called end-
gas, is compressed, causing its pressure, temperature and density to increase. The end-gas fuel-air
mixture suffers chemical reactions prior to normal combustion, which may lead the fresh mixture to
auto ignite: i.e., spontaneously and rapidly release a large part or all of its chemical energy. When this
happens, the end-gas burns very rapidly, releasing its energy at a rate 5 to 25 times than a normal
combustion.[9] This causes high-frequency pressure oscillations inside the cylinder that produce the
sharp metallic noise called knock. Knock will not occur if the flame front consumes the end-gas before
these reactions have time to cause the fuel-air mixture to auto ignite.
The other important abnormal combustion phenomenon is surface ignition. Surface ignition is
ignition of the fuel-air charge by overheated valves or spark plugs, by glowing combustion-chamber
deposits, or by any other hot spot in the engine combustion chamber. It is ignition by any source other
than normal spark ignition. It may occur before the spark plug ignites the charge (pre-ignition) or after
normal ignition (post-ignition). Uncontrolled combustion is most evident and its effects most severe
when it results from pre ignition. However, even when surface ignition occurs after the spark plug fires
(post-ignition), the spark discharge no longer has complete control of the combustion process. Surface
ignition may result in knock. Knock which occurs following normal spark ignition is called spark knock.
“Diesel knock” is also a phenomenon that can occur if the rapid combustion (see Figure 2) is not
properly controlled. Diesel knock is caused by combustion which occurs too rapidly and is the result of
long ignition delay period. To avoid too large rapid combustion periods, the initial injection should be
carefully controlled. A pilot injection is therefore needed.
It is agreed, that engine knock is due to a local rapid combustion in engine cylinder. The widely
accepted theory that engine knock is caused by an auto ignition of end-gas ahead of a flame front
could not explain all kinds of engine knock over the whole range of engine operating conditions,
especially high speed knocking. The proposed mechanisms in [10] would give a more appealing
interpretation for that type of knock. High-speed operation is required to take high power from small
engines. Under high-speed conditions the time taken for the compression and heat up of the mixture
becomes shorter and the fluid motion and turbulence in the charge are intensified. At high engine
speeds these physical characteristics will have a great potential for knock initiation.
Shear-layer entrained knocking is mentioned in [10] as a high speed knocking mechanism. Mixing
of partially reacting gases inside the flame zone with an unburned pre-flame mixture could be a trigger
for a thermo-chemical ignition. These gases could react and a rapid high temperature aerodynamic
flame and pressure vibration would then follow after a short induction in time in the similar way of auto
ignition.
14
A typical example of shear-layer entrained knocking in a commercial engine is knocking-like fast
burning in trailing side in a Wankel rotary engine. There the mixture is carried over by the rotation
motion into the flame, propagating in the opposite direction of the rotor.
3.2.3. Combustion pre-chamber
Historically, pre-chambers became necessary to promote auto ignition in relatively small diesel
engines.[11]
Occasionally, in CI engines, fuel is injected into a pre-chamber where a Glow Plug helps to ignite
the mixture on cold starts.
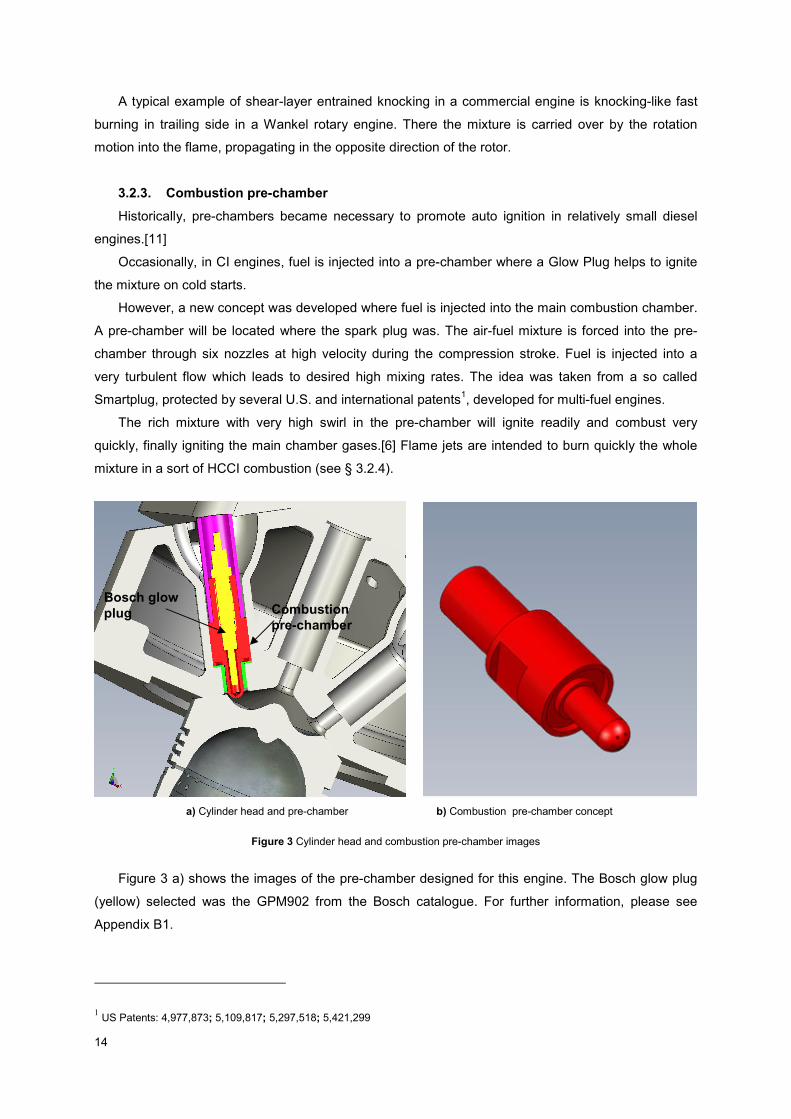
However, a new concept was developed where fuel is injected into the main combustion chamber.
A pre-chamber will be located where the spark plug was. The air-fuel mixture is forced into the pre-
chamber through six nozzles at high velocity during the compression stroke. Fuel is injected into a
very turbulent flow which leads to desired high mixing rates. The idea was taken from a so called
Smartplug, protected by several U.S. and international patents1, developed for multi-fuel engines.
The rich mixture with very high swirl in the pre-chamber will ignite readily and combust very
quickly, finally igniting the main chamber gases.[6] Flame jets are intended to burn quickly the whole
mixture in a sort of HCCI combustion (see § 3.2.4).
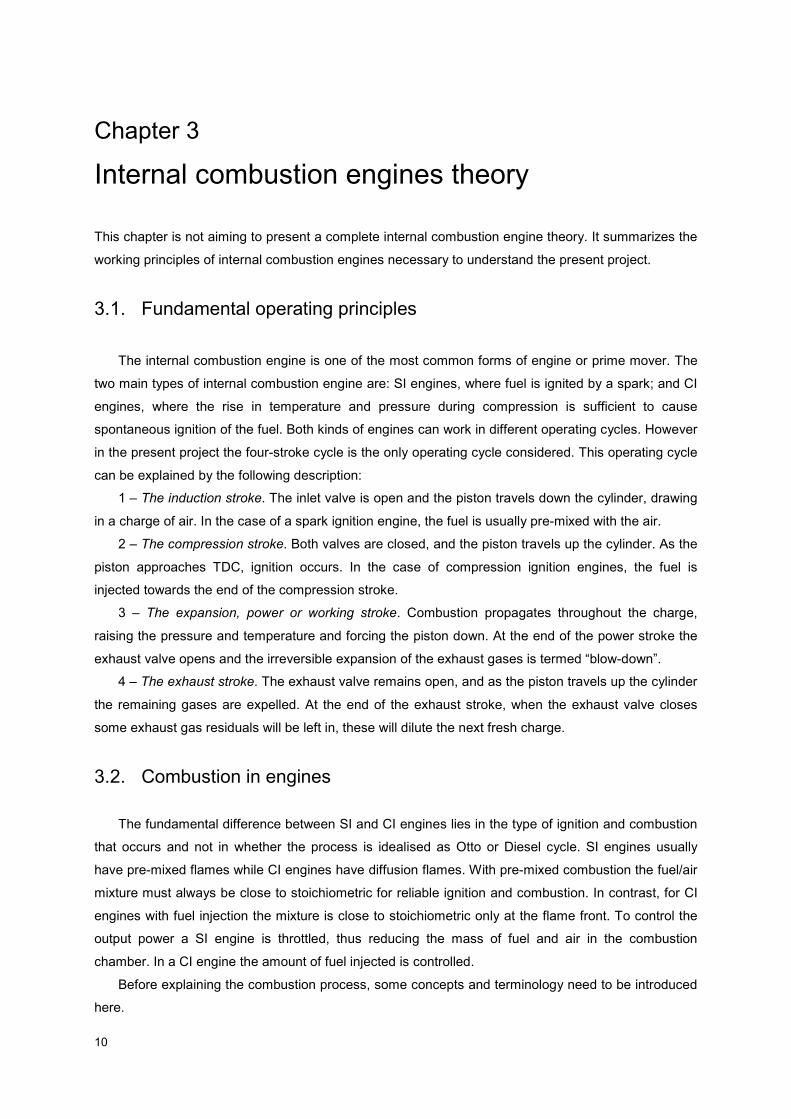
a) Cylinder head and pre-chamber b) Combustion pre-chamber concept
Figure 3 Cylinder head and combustion pre-chamber images
Figure 3 a) shows the images of the pre-chamber designed for this engine. The Bosch glow plug
(yellow) selected was the GPM902 from the Bosch catalogue. For further information, please see
Appendix B1.
1 US Patents: 4,977,873; 5,109,817; 5,297,518; 5,421,299
Combustion
pre-chamber
Bosch glow
plug
15
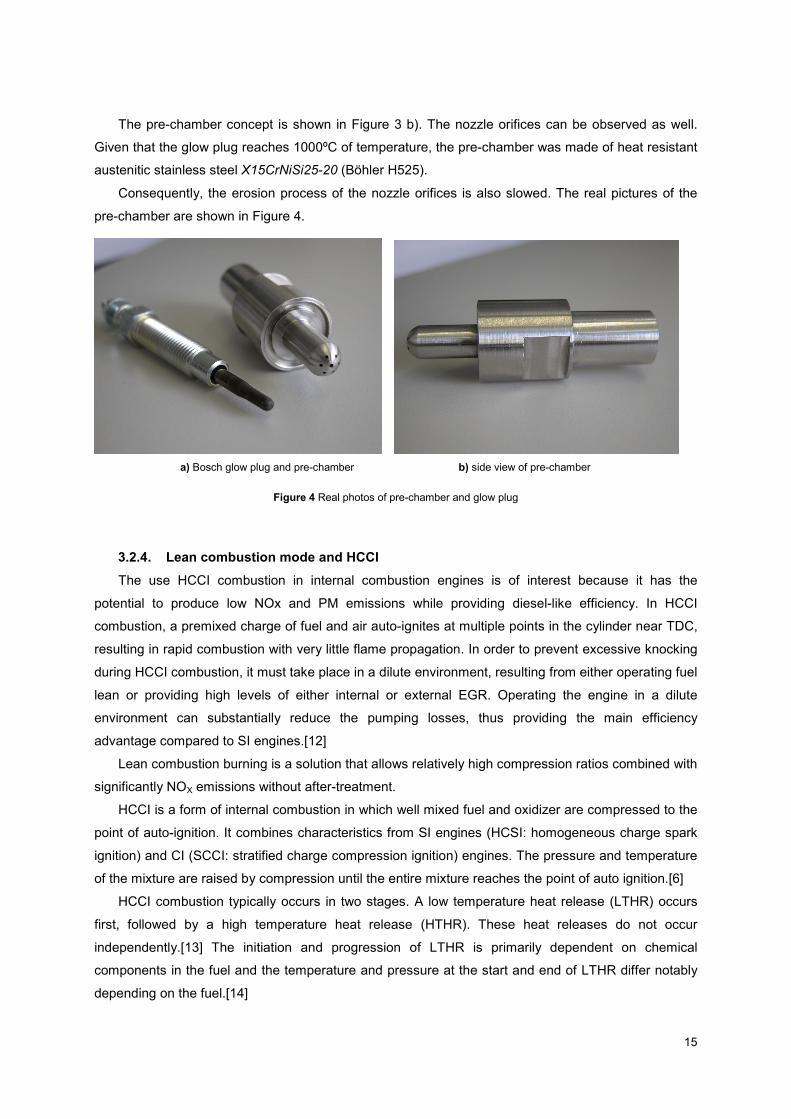
The pre-chamber concept is shown in Figure 3 b). The nozzle orifices can be observed as well.
Given that the glow plug reaches 1000ºC of temperature, the pre-chamber was made of heat resistant
austenitic stainless steel X15CrNiSi25-20 (Böhler H525).
Consequently, the erosion process of the nozzle orifices is also slowed. The real pictures of the
pre-chamber are shown in Figure 4.
a) Bosch glow plug and pre-chamber b) side view of pre-chamber
Figure 4 Real photos of pre-chamber and glow plug
3.2.4. Lean combustion mode and HCCI
The use HCCI combustion in internal combustion engines is of interest because it has the
potential to produce low NOx and PM emissions while providing diesel-like efficiency. In HCCI
combustion, a premixed charge of fuel and air auto-ignites at multiple points in the cylinder near TDC,
resulting in rapid combustion with very little flame propagation. In order to prevent excessive knocking
during HCCI combustion, it must take place in a dilute environment, resulting from either operating fuel
lean or providing high levels of either internal or external EGR. Operating the engine in a dilute
environment can substantially reduce the pumping losses, thus providing the main efficiency
advantage compared to SI engines.[12]
Lean combustion burning is a solution that allows relatively high compression ratios combined with
significantly NOX emissions without after-treatment.
HCCI is a form of internal combustion in which well mixed fuel and oxidizer are compressed to the
point of auto-ignition. It combines characteristics from SI engines (HCSI: homogeneous charge spark
ignition) and CI (SCCI: stratified charge compression ignition) engines. The pressure and temperature
of the mixture are raised by compression until the entire mixture reaches the point of auto ignition.[6]
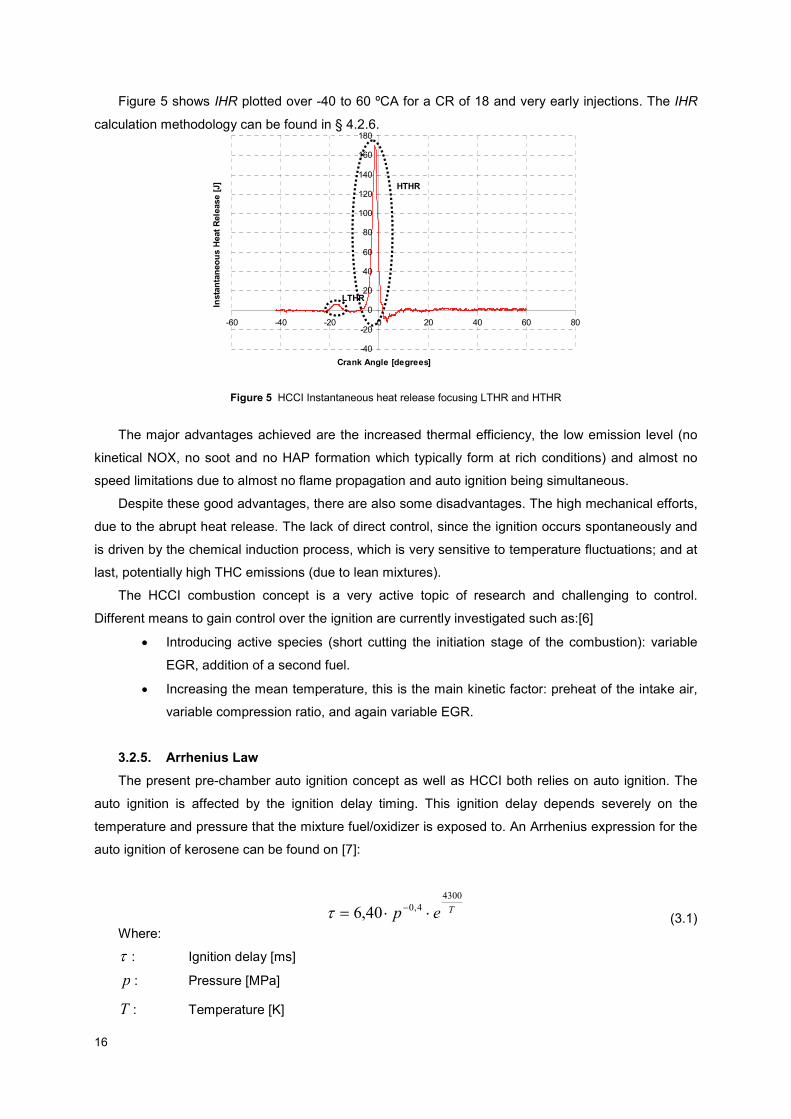
HCCI combustion typically occurs in two stages. A low temperature heat release (LTHR) occurs
first, followed by a high temperature heat release (HTHR). These heat releases do not occur
independently.[13] The initiation and progression of LTHR is primarily dependent on chemical
components in the fuel and the temperature and pressure at the start and end of LTHR differ notably
depending on the fuel.[14]
16
Tep
4300
4,040,6 ⋅⋅= −τ
-40
-20
0
20
40
60
80
100
120
140
160
180
-60 -40 -20 0 20 40 60 80
Crank Angle [degrees]
Instantaneous Heat Release [J]
LTHR
HTHR
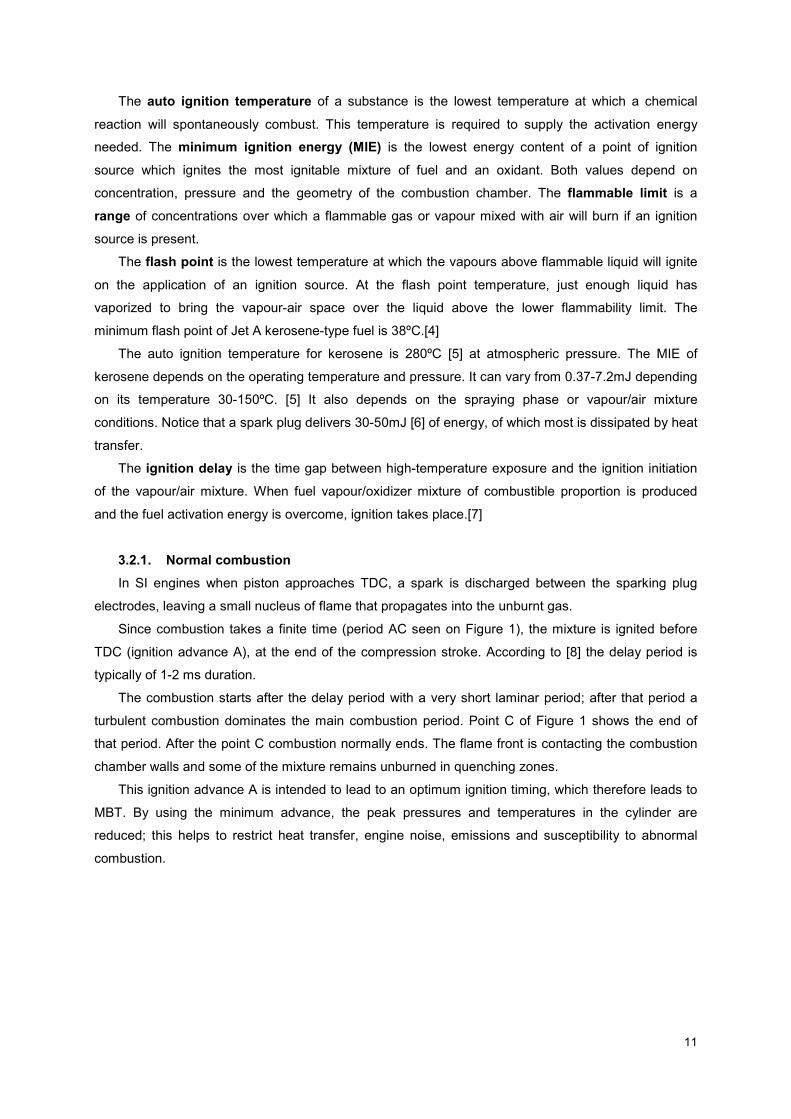
Figure 5 shows IHR plotted over -40 to 60 ºCA for a CR of 18 and very early injections. The IHR
calculation methodology can be found in § 4.2.6.
Figure 5 HCCI Instantaneous heat release focusing LTHR and HTHR
The major advantages achieved are the increased thermal efficiency, the low emission level (no
kinetical NOX, no soot and no HAP formation which typically form at rich conditions) and almost no
speed limitations due to almost no flame propagation and auto ignition being simultaneous.
Despite these good advantages, there are also some disadvantages. The high mechanical efforts,
due to the abrupt heat release. The lack of direct control, since the ignition occurs spontaneously and
is driven by the chemical induction process, which is very sensitive to temperature fluctuations; and at
last, potentially high THC emissions (due to lean mixtures).
The HCCI combustion concept is a very active topic of research and challenging to control.
Different means to gain control over the ignition are currently investigated such as:[6]
• Introducing active species (short cutting the initiation stage of the combustion): variable
EGR, addition of a second fuel.
• Increasing the mean temperature, this is the main kinetic factor: preheat of the intake air,
variable compression ratio, and again variable EGR.
3.2.5. Arrhenius Law
The present pre-chamber auto ignition concept as well as HCCI both relies on auto ignition. The
auto ignition is affected by the ignition delay timing. This ignition delay depends severely on the
temperature and pressure that the mixture fuel/oxidizer is exposed to. An Arrhenius expression for the
auto ignition of kerosene can be found on [7]:
(3.1) Where:
τ : Ignition delay [ms]
p : Pressure [MPa]
T : Temperature [K]
17
Due to the exponential character of the equation (3.1) the auto ignition phenomenon is strongly
dependant on the temperature. Therefore, the glow plug inside the combustion chamber will be
significantly hotter than the cooled engine block which promotes the auto ignition to happen in the pre-
chamber, reducing the ignition delay.
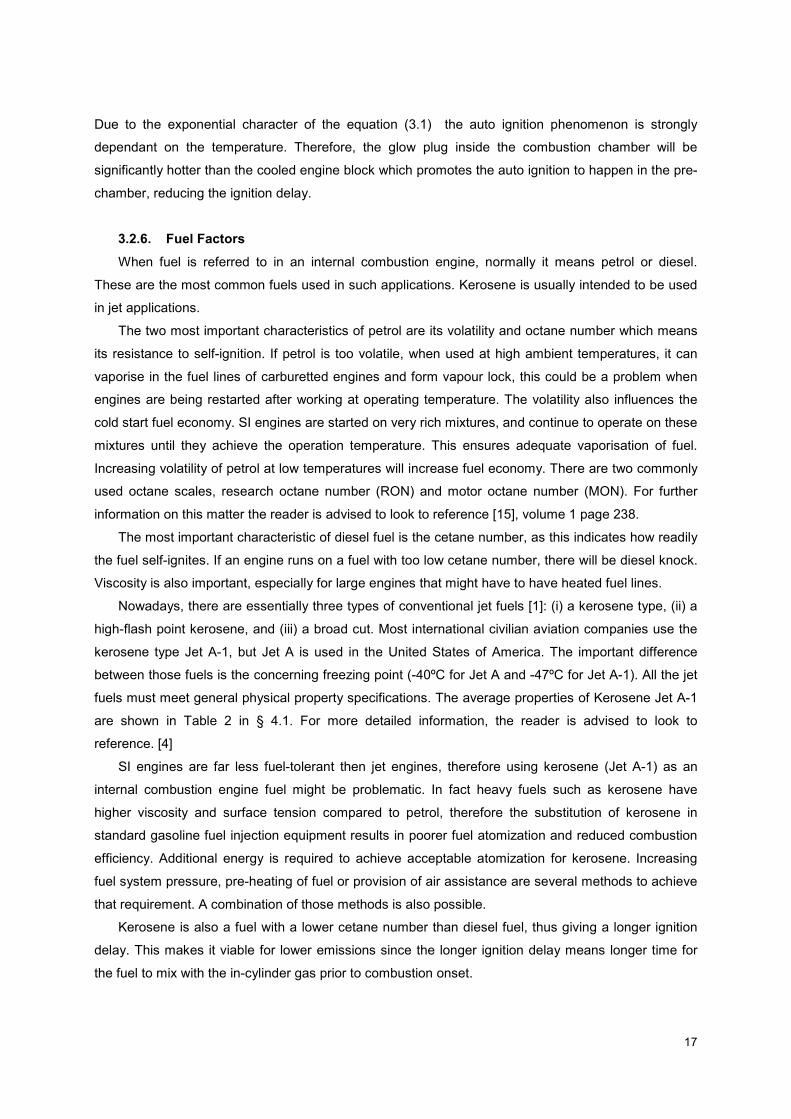
3.2.6. Fuel Factors
When fuel is referred to in an internal combustion engine, normally it means petrol or diesel.
These are the most common fuels used in such applications. Kerosene is usually intended to be used
in jet applications.
The two most important characteristics of petrol are its volatility and octane number which means
its resistance to self-ignition. If petrol is too volatile, when used at high ambient temperatures, it can
vaporise in the fuel lines of carburetted engines and form vapour lock, this could be a problem when
engines are being restarted after working at operating temperature. The volatility also influences the
cold start fuel economy. SI engines are started on very rich mixtures, and continue to operate on these
mixtures until they achieve the operation temperature. This ensures adequate vaporisation of fuel.
Increasing volatility of petrol at low temperatures will increase fuel economy. There are two commonly
used octane scales, research octane number (RON) and motor octane number (MON). For further
information on this matter the reader is advised to look to reference [15], volume 1 page 238.
The most important characteristic of diesel fuel is the cetane number, as this indicates how readily
the fuel self-ignites. If an engine runs on a fuel with too low cetane number, there will be diesel knock.
Viscosity is also important, especially for large engines that might have to have heated fuel lines.
Nowadays, there are essentially three types of conventional jet fuels [1]: (i) a kerosene type, (ii) a
high-flash point kerosene, and (iii) a broad cut. Most international civilian aviation companies use the
kerosene type Jet A-1, but Jet A is used in the United States of America. The important difference
between those fuels is the concerning freezing point (-40ºC for Jet A and -47ºC for Jet A-1). All the jet
fuels must meet general physical property specifications. The average properties of Kerosene Jet A-1
are shown in Table 2 in § 4.1. For more detailed information, the reader is advised to look to
reference. [4]
SI engines are far less fuel-tolerant then jet engines, therefore using kerosene (Jet A-1) as an
internal combustion engine fuel might be problematic. In fact heavy fuels such as kerosene have
higher viscosity and surface tension compared to petrol, therefore the substitution of kerosene in
standard gasoline fuel injection equipment results in poorer fuel atomization and reduced combustion
efficiency. Additional energy is required to achieve acceptable atomization for kerosene. Increasing
fuel system pressure, pre-heating of fuel or provision of air assistance are several methods to achieve
that requirement. A combination of those methods is also possible.
Kerosene is also a fuel with a lower cetane number than diesel fuel, thus giving a longer ignition
delay. This makes it viable for lower emissions since the longer ignition delay means longer time for
the fuel to mix with the in-cylinder gas prior to combustion onset.

18
Despite all of the inconveniences, Kerosene has considerable market availability since it is used in
the aviation transport sector. Therefore, it is easier to supply the transportation sector with this fuel in
relatively large quantities.
3.3. Rotary Wankel engine
The Wankel engine is a rotary combustion engine, developed by of Felix Wankel. It is a type
engine system wherein the crankshaft is supported by a centre main roller bearing. Figure 6 shows an
exploded view of a two rotor Wankel engine.
Figure 6 Wankel rotary engine components
The almost triangular (trochoidal) rotor has a centrally placed internal gear which meshes with the
sun gear that is part of engine casing. The rotor apexes are sealed by two piece apex seals and by
side seals. An eccentric that is an integral part of the output shaft constrains the rotor to follow a
planetary motion about the output shaft. The rear ratios are such that the output shaft rotates at three
times the speed of the rotor, and the tips of the rotor trace out the two-lobe almost elliptical
(epitrochoidal) shape of casing. The compression ratio is dictated geometrically by the eccentricity of
the rotor and the shape of its curved surfaces.
The engine system further includes an oiling system which permits oil flow through the centre
bearing and through lubrication passages in the engine rotor to provide a means for cooling the engine
rotor under high loading conditions. Rib lets are defined in the combustion face of the rotor to promote
aerodynamic lateral stratified charge control to minimize atomized fuel charge loss to surface wetting
before ignition.
19
1 2 3 4
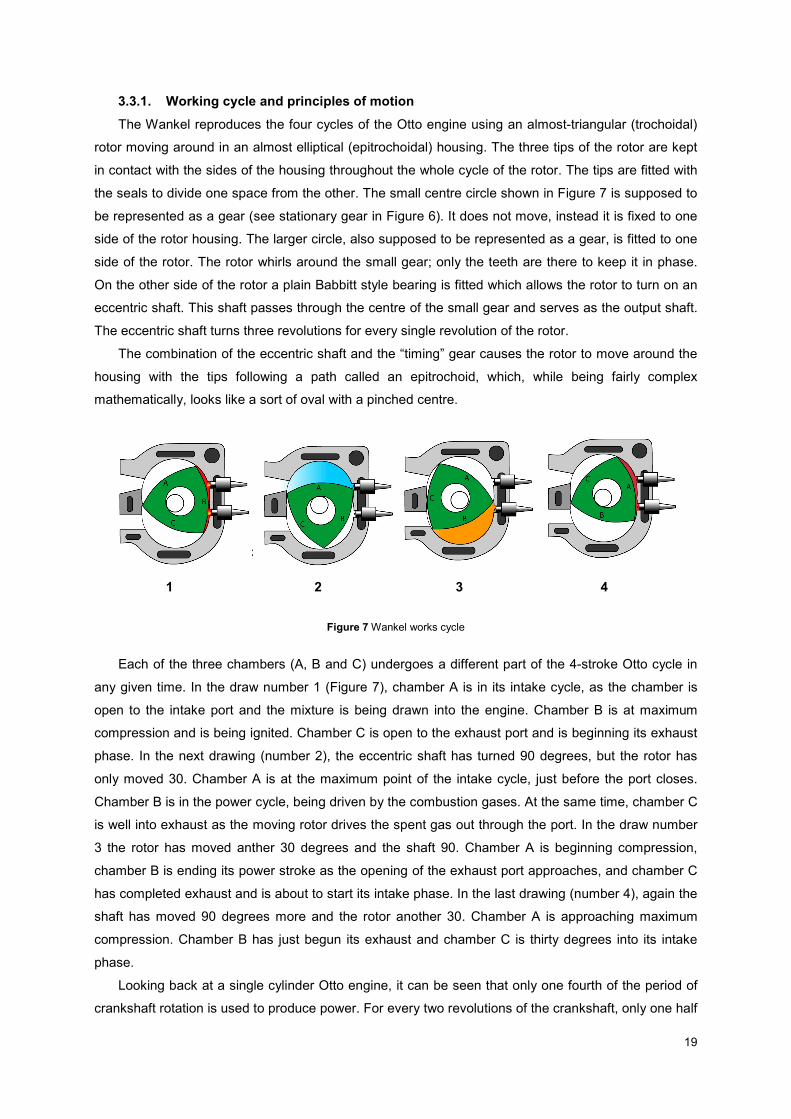
3.3.1. Working cycle and principles of motion
The Wankel reproduces the four cycles of the Otto engine using an almost-triangular (trochoidal)
rotor moving around in an almost elliptical (epitrochoidal) housing. The three tips of the rotor are kept
in contact with the sides of the housing throughout the whole cycle of the rotor. The tips are fitted with
the seals to divide one space from the other. The small centre circle shown in Figure 7 is supposed to
be represented as a gear (see stationary gear in Figure 6). It does not move, instead it is fixed to one
side of the rotor housing. The larger circle, also supposed to be represented as a gear, is fitted to one
side of the rotor. The rotor whirls around the small gear; only the teeth are there to keep it in phase.
On the other side of the rotor a plain Babbitt style bearing is fitted which allows the rotor to turn on an
eccentric shaft. This shaft passes through the centre of the small gear and serves as the output shaft.
The eccentric shaft turns three revolutions for every single revolution of the rotor.
The combination of the eccentric shaft and the “timing” gear causes the rotor to move around the
housing with the tips following a path called an epitrochoid, which, while being fairly complex
mathematically, looks like a sort of oval with a pinched centre.
Figure 7 Wankel works cycle
Each of the three chambers (A, B and C) undergoes a different part of the 4-stroke Otto cycle in
any given time. In the draw number 1 (Figure 7), chamber A is in its intake cycle, as the chamber is
open to the intake port and the mixture is being drawn into the engine. Chamber B is at maximum
compression and is being ignited. Chamber C is open to the exhaust port and is beginning its exhaust
phase. In the next drawing (number 2), the eccentric shaft has turned 90 degrees, but the rotor has
only moved 30. Chamber A is at the maximum point of the intake cycle, just before the port closes.
Chamber B is in the power cycle, being driven by the combustion gases. At the same time, chamber C
is well into exhaust as the moving rotor drives the spent gas out through the port. In the draw number
3 the rotor has moved anther 30 degrees and the shaft 90. Chamber A is beginning compression,
chamber B is ending its power stroke as the opening of the exhaust port approaches, and chamber C
has completed exhaust and is about to start its intake phase. In the last drawing (number 4), again the
shaft has moved 90 degrees more and the rotor another 30. Chamber A is approaching maximum
compression. Chamber B has just begun its exhaust and chamber C is thirty degrees into its intake
phase.
Looking back at a single cylinder Otto engine, it can be seen that only one fourth of the period of
crankshaft rotation is used to produce power. For every two revolutions of the crankshaft, only one half
20
of one revolution is spent under power. The rest of the time the crankshaft is coasting around using
the inertia of its flywheel to keep it going.
In the Wankel, there are three working faces on the rotor. When one side is producing power,
another side is on intake stroke, and the third is on exhaust. As the eccentric shaft is driven at three
times the rotor speed, and the rotor has three firing pulses per revolution, this becomes one firing
stroke per revolution at the flywheel. This is only achievable, with a normal two piston engine. This
explains why the Wankel is such a compact power plant.
3.3.2. Advantages/disadvantages
Unlike reciprocating piston engines, the Wankel rotary is in complete and precise balance, just like
a turbine or electric motor. [16]
The lack of vibration is one of most important advantages since there are no stops and starts, no
reversing direction, just smooth whirling. The loads on the eccentric shaft are always in one direction.
They do not reverse; therefore metal fatigue is reduced when compared to reciprocating piston
engines. Reversing loads are what causes metal to fatigue. Without concentrated stresses on the
eccentric shaft, those loads are softened.
The Wankel rotary engine can rotate far faster than an equivalent piston engine and therefore can
produce more power. The Wankel engine is unusually small for its power output. This is very important
for the use in aircrafts. The simplicity of design and smaller size of the Wankel engine allows savings
in construction costs, compared to reciprocating piston engines of comparable power output.
It is also important to notice that the Wankel engine breathes extremely well at high RPM’s due to
the lack of poppet valves getting in the way of the intake and exhaust ports. Nevertheless this rotation
must be limited, because of the immense centrifugal force that could damage the eccentric shaft. In
addition the engine is normally constructed with an iron rotor within an aluminium housing which has a
greater thermal expansion. This ensures that even a severely overheated Wankel engine cannot
seize, as would likely occur in an overheated piston engine. This benefit is substantially important in
aircraft use since no valves can burn out.
Another advantage of the Wankel, mentioned in [17], is its resistance to spark-knock and therefore
high power can be extracted with very low-grade fuel. This could be advantageous when using
kerosene as burning fuel.
The most important advantage is the great immunity to catastrophic failure that Wankel engines
have registered. They can lose compression, cooling or oil pressure and therefore lose a large amount
of power; however they still work for a considerable period of time. Comparatively, reciprocating piston
engines, under the same circumstances, are prone to seizing or breaking parts which almost certainly
result in complete internal engine destruction. For this reason Wankel engines are very well suited to
aircraft applications.
Rotary Wankel engine systems can also suffer from various drawbacks which prevent such
systems from achieving maximum engine performance and reliability. Such problems include high
leakage from the rotor apex and side seals, causing overheating and lubrication contamination and

21
crankshaft bending due to lack of sufficient centre main bearing support, causing side housing
gouging and limiting maximum engine RPM under high compression firing loads.
The comparison of surface/volume ratio between Wankel and reciprocating piston engines is a
complex problem, thus a direct comparison is difficult to make. Nevertheless if the same displacement
4-stroke engines are compared, it is possible to say that in the Wankel engine the real surface/volume
ratio is worst, therefore it is higher. Notice that in the Wankel engine the combustion chamber is less
compact, therefore it is wider. However, this comparison is not fair, because, normally, with the same
displacement it is possible to extract more power in a Wankel engine. The reciprocating piston engine
has an empty stroke, meaning that a cylinder only produce a power stroke every second rotation.
Concerning pollutants, in the Wankel engine, higher prevalence of hydrocarbon is found in the
exhaust than in the reciprocating piston engine. The trailing side of the rotary engine’s combustion
chamber develops a squeeze stream which pushes back the flame front, therefore in a conventional
two-spark-plug or one-spark-plug system this squeeze stream prevents flame from propagating in mid
and high engine speed ranges. This is why there can be more carbon monoxide and unburnt
hydrocarbons in Wankel exhaust engines. [18]
Summarizing, the main advantages of the Wankel are its compactness, the apparent simplicity,
the ease of balance and the potential for high outputs by running at high speeds. The major
disadvantages are the common leakage of the rotor causing overheating, low thermal efficiency, and
high exhaust emissions.

22
Chapter 4
Experimental installation and methodology
4.1. Engine test bench and fuel properties
The engine test bench consists of a single cylinder engine with variable CR and VVT. The engine
is naturally aspirated and the Kerosene is direct injected into the combustion chamber. The data
acquisition is realised by an AVL 620 Indiset rack for the high frequency signals (cylinder pressure,
ignition signal, injector signal) and a National Instruments LabView interface for the low-frequency
signals (admission & exhaust pressure, temperatures in the cooling water and oil cycle). The control of
the engine speed is done by an electric drive FlexPack 3000. An engine control unit (ECU) adjusts the
injection duration of Kerosene and its timing at a given RPM. It also controls the spark and coil charge
timing. The schematic set-up of the engine bench is shown in Figure 8.
Figure 8 Schematic set-up of the engine test bench
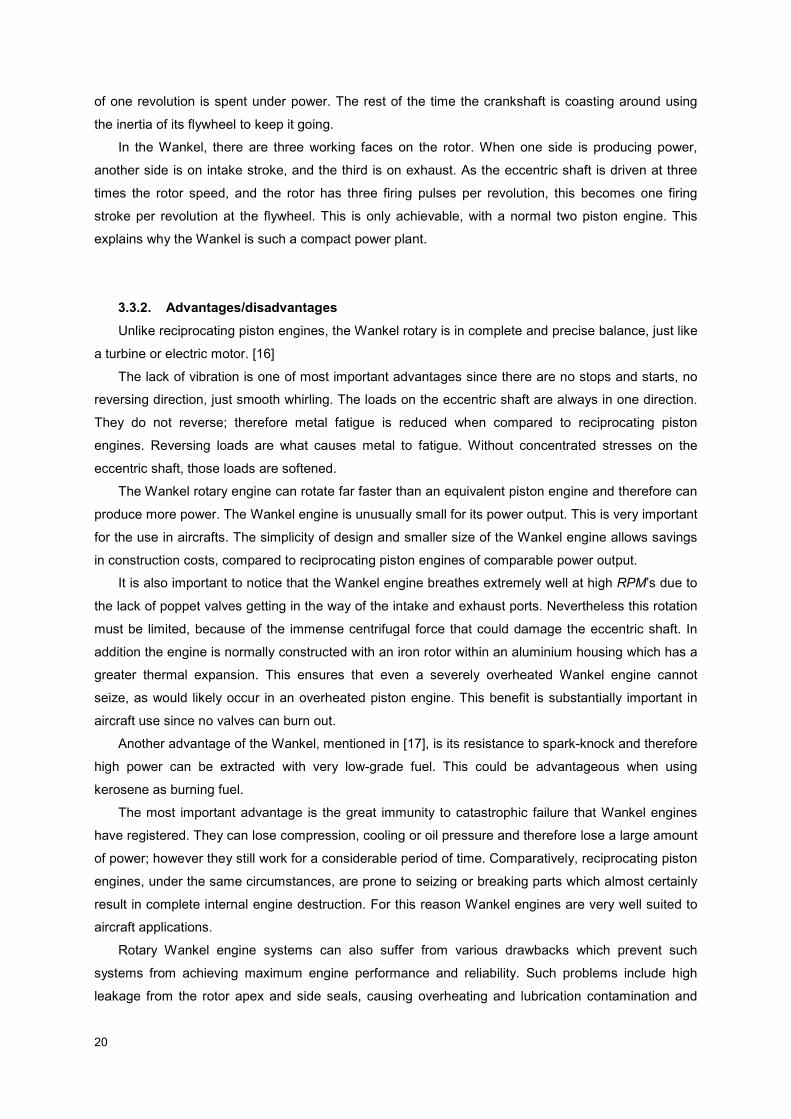
The test engine is equipped with three access ports in the cylinder head in addition to the two
valves. The injector is placed in the centre (see Figure 9) for better fuel homogenization, the spark
plug is placed in one of the lateral ports and the pressure sensor is located on the other port.
23
Later on, the spark plug is substituted by the combustion pre-chamber.
Figure 9 Cylinder head and injector
The highest possible resolution of 0,1ºCA was used for these runs to capture the pressure traces
as detailed as possible.
The cylinder pressure measurements are recorded in a file containing 100 cycles. Those cycles
are averaged to have just one single cycle and to restrict cycle-by-cycle variations.
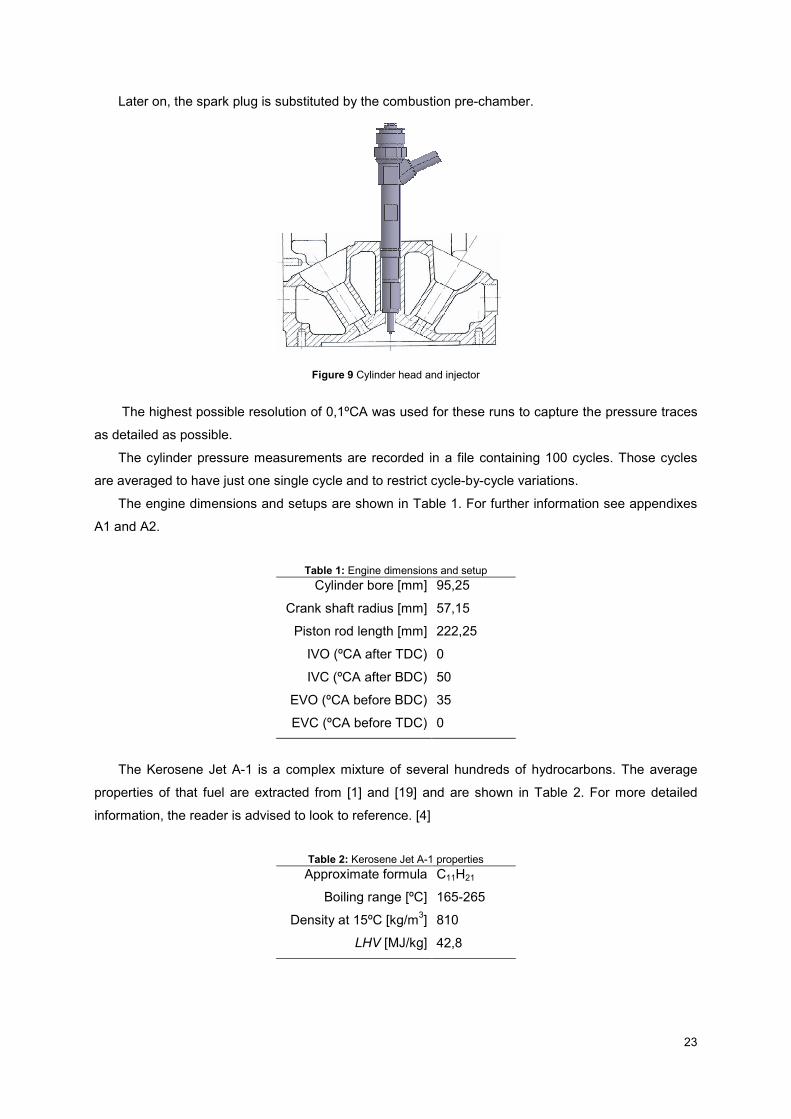
The engine dimensions and setups are shown in Table 1. For further information see appendixes
A1 and A2.
Table 1: Engine dimensions and setup
Cylinder bore [mm]
Crank shaft radius [mm]
Piston rod length [mm]
IVO (ºCA after TDC)
IVC (ºCA after BDC)
EVO (ºCA before BDC)
EVC (ºCA before TDC)
95,25
57,15
222,25
0
50
35
0
The Kerosene Jet A-1 is a complex mixture of several hundreds of hydrocarbons. The average
properties of that fuel are extracted from [1] and [19] and are shown in Table 2. For more detailed
information, the reader is advised to look to reference. [4]
Table 2: Kerosene Jet A-1 properties
Approximate formula
Boiling range [ºC]
Density at 15ºC [kg/m3]
LHV [MJ/kg]
C11H21
165-265
810
42,8

24
4.1.1. Common-rail injection characteristics
The engine is fitted with a first generation common-rail system, operating at a maximum injection
pressure of 1200 bar. This pressure is created in 2 separate stages: In the first stage fuel is
pressurized (up to 4 bar) inside the fuel tank by the fuel pump before being pumped through the fuel
feed pipes to the common-rail pump located near the engine head. The common-rail pump then
performs the second pumping operation increasing the fuel’s pressure up to 1200 bar, sending it to the
fuel rail, an hollow steel cylinder on top of the engine, directly connected to the injector. The injection
system is controlled by the ECU, and has the ability to do up to 8 injections per cycle. The fist injection
is called pre-injection and the second one post-injection.
Pre-injection
Pre-injection is required to increase temperature and pressure in the combustion chamber, before
the main injection takes place, hence increasing temperature and pressure and reducing the burning
delay. As a consequence, a clear reduction on both the noise and vibration occurs as the combustion
takes place, due to the reduction in accumulated unburnt fuel.
Post-injection
Post injection is usually one of the easiest ways to achieve pollutants control, as it helps to burn
part of the soot formed during combustion. The capability of burning large soot quantities is also
important since it allows lowering theλ , providing the engine with more power.
4.1.2. Ignition system
Most engines have a single sparking plug per cylinder, a notable exception being in aircrafts
where the complete ignition system is duplicated to improve reliability.
The spark is provided by a battery and coil. The spark timing and the spark coil charge is
commanded by the ECU and as in the injection system it has the ability to do up to 8 coil charges and
8 different spark timings.
A combustion pre-chamber is used to promote ignition. There is no direct control of the ignition
timing. The glow plug, located inside of the pre-chamber, is turned on during the experiments.

25
res
resc
res V
VV
V
VCR
+== max
)(4
2
saLd
VV res −+⋅
+=π
2/1222 )sin(cos θθ aLas −+⋅=
Rm
VpTTRmVp
⋅⋅
=⇒⋅⋅=⋅)()(
)()()()(θθ
θθθθ
4.2. Variables and formulas
4.2.1. Cylinder Volume
The cylinder volume is obtained as function of the crank angle. The equations used are extracted
from. [20]
We define the compression ratio CR as:
(4.1)
Thus the cylinder volume is function of the residual volume and the crank angle position:
(4.2)
Where:
(4.3)
cV : is the displacement [mm3; cm3]
resV : is the residual volume [mm3; cm3]
4.2.2. Cylinder Gas Temperature
The cylinder gas temperature is obtained from the ideal gas law.
(4.4)
Where:
)(θp : is the pressure as a function of CA [Pa]
)(θV : is the volume as function of CA calculated on § 4.2.1 [m3]
m : is the mass of air inside of the cylinder [kg]
R : is the ideal gas constant for air [=287 J kg-1K-1]
The mass of air inside of the cylinder is calculated using the equation (4.4), where an average
value of )()( θθ Vp ⋅ over -129ºCA and -128ºCA (1ºCA after IVC) and admission temperature are
taken into account.
26
V
W
V
dVp
V
dVpIMEP i
net =⋅
=⋅
=∫∫ −
360
360
FuelMEP
IMEPneti =η
V
dVpIMEPgross
∫− ⋅=
180
180
V
LHVmFuelMEP
f ⋅=
V
QQMEP =
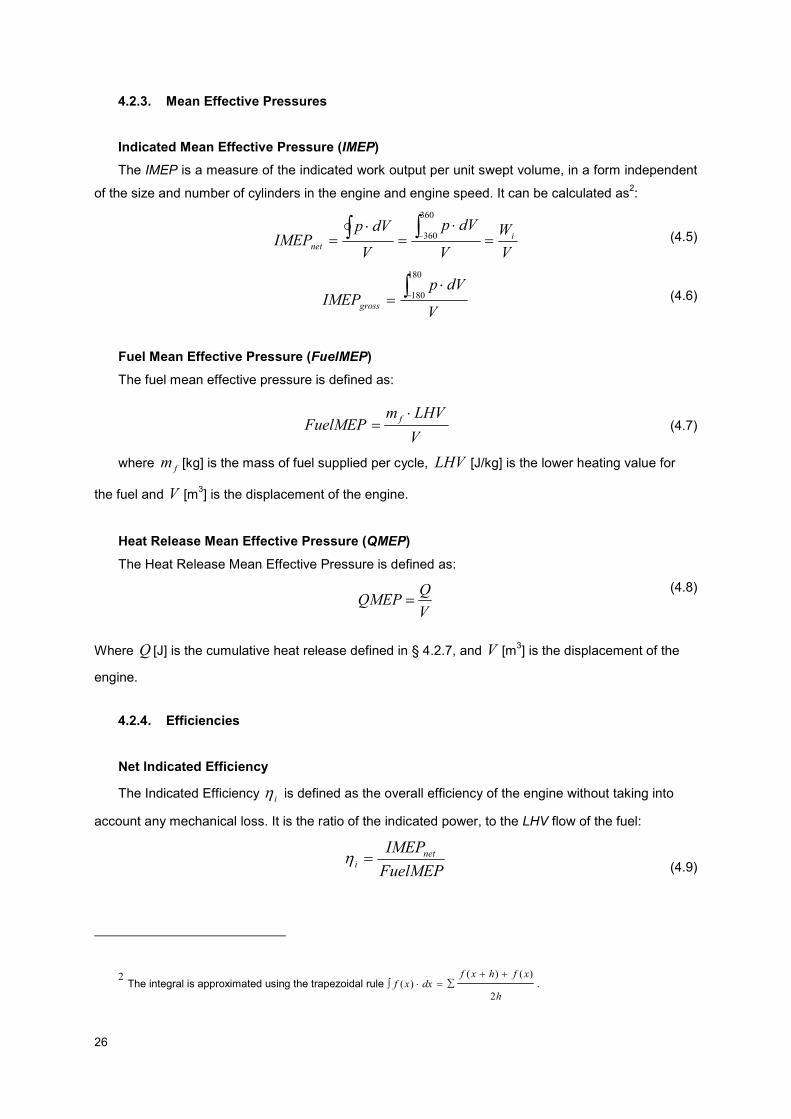
4.2.3. Mean Effective Pressures
Indicated Mean Effective Pressure (IMEP)
The IMEP is a measure of the indicated work output per unit swept volume, in a form independent
of the size and number of cylinders in the engine and engine speed. It can be calculated as2:
(4.5)
(4.6)
Fuel Mean Effective Pressure (FuelMEP)
The fuel mean effective pressure is defined as:
(4.7)
where fm [kg] is the mass of fuel supplied per cycle, LHV [J/kg] is the lower heating value for
the fuel and V [m3] is the displacement of the engine.
Heat Release Mean Effective Pressure (QMEP)
The Heat Release Mean Effective Pressure is defined as:
(4.8)
Where Q [J] is the cumulative heat release defined in § 4.2.7, and V [m3] is the displacement of the
engine.
4.2.4. Efficiencies
Net Indicated Efficiency
The Indicated Efficiency iη is defined as the overall efficiency of the engine without taking into
account any mechanical loss. It is the ratio of the indicated power, to the LHV flow of the fuel:
(4.9)
2 The integral is approximated using the trapezoidal rule ∑
++=∫ ⋅
h
xfhxfdxxf
2
)()()( .
27
∆+∆−
∆−∆+
=
)(
)(log
)(
)(log
)(
θθθθ
θθθθ
θγσ
V
V
p
p
QMEP
IMEPgross
th =η
FuelMEP
QMEPcomb =η
gross
netgas
IMEP
IMEP=η
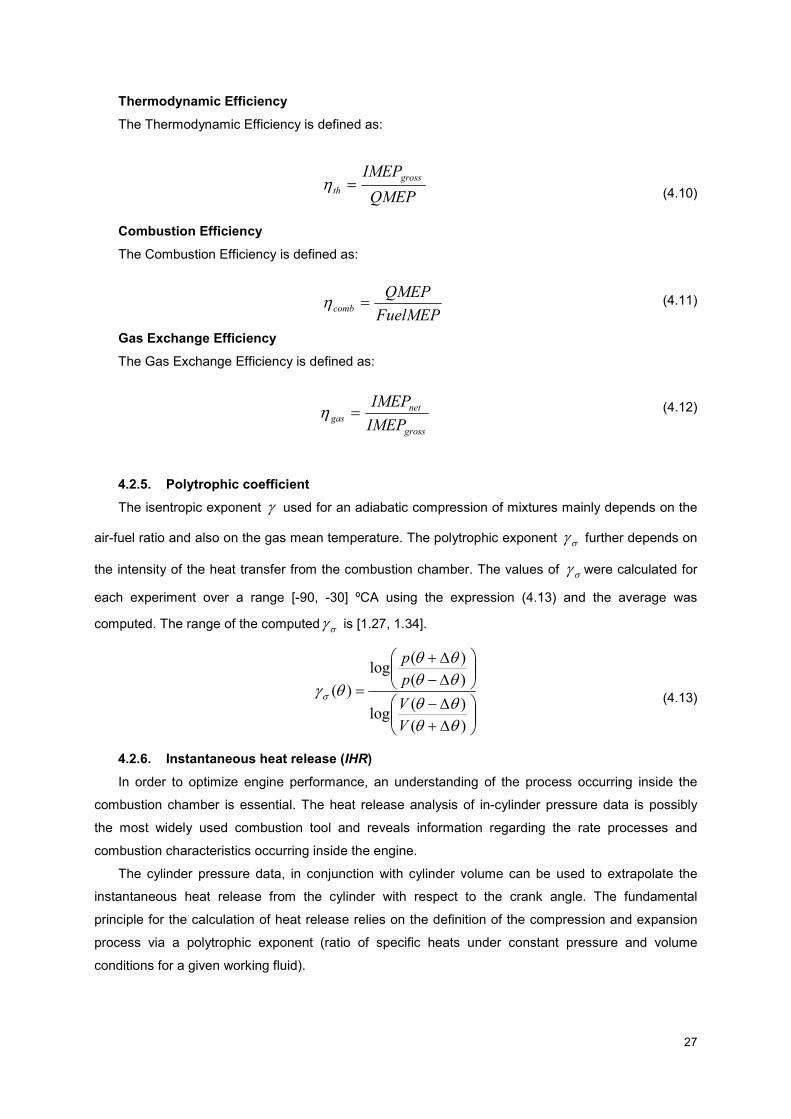
Thermodynamic Efficiency
The Thermodynamic Efficiency is defined as:
(4.10)
Combustion Efficiency
The Combustion Efficiency is defined as:
(4.11)
Gas Exchange Efficiency
The Gas Exchange Efficiency is defined as:
(4.12)
4.2.5. Polytrophic coefficient
The isentropic exponent γ used for an adiabatic compression of mixtures mainly depends on the
air-fuel ratio and also on the gas mean temperature. The polytrophic exponent σγ further depends on
the intensity of the heat transfer from the combustion chamber. The values of σγ were calculated for
each experiment over a range [-90, -30] ºCA using the expression (4.13) and the average was
computed. The range of the computed σγ is [1.27, 1.34].
(4.13)
4.2.6. Instantaneous heat release (IHR)
In order to optimize engine performance, an understanding of the process occurring inside the
combustion chamber is essential. The heat release analysis of in-cylinder pressure data is possibly
the most widely used combustion tool and reveals information regarding the rate processes and
combustion characteristics occurring inside the engine.
The cylinder pressure data, in conjunction with cylinder volume can be used to extrapolate the
instantaneous heat release from the cylinder with respect to the crank angle. The fundamental
principle for the calculation of heat release relies on the definition of the compression and expansion
process via a polytrophic exponent (ratio of specific heats under constant pressure and volume
conditions for a given working fluid).

28
∫ ⋅= θθ
dd
dQQ
If this can be stated with accuracy, then a motored pressure curve can be extrapolated for the
fired cycle. The equation (4.14) comes from the first law of thermodynamics for a closed system, for
details see [8].
(4.14)
Instead of deriving with respect to time, a simple variable transformation leads to (4.15) .
(4.15)
This calculation does not account for wall or blow-by losses in the cylinder. It also assumes that
the polytrophic index is constant throughout the process. These compromises affect accuracy in
absolute terms but in relative measurement applications this simplified calculation is well proven and
established in daily use.[21] In fact, the polytrophic index is calculated, and as a result γ is substituted
by σγ , therefore we have:
(4.16)
When plotted, the curve extracted from (4.16) can give important information about the progress
and quality of combustion inside the cylinder chamber. Note that this equation is only true when the
valves are closed, therefore it is only evaluated over a restricted CA interval [-45, 60]º CA. The
equation (4.16) when computed shows high oscillations. To avoid those oscillations, the derivatives
were calculated over one degree of CA.
4.2.7. Cumulative heat release (CHR)
The cumulative heat release Q is the integral of the instantaneous heat release over a restricted
CA interval that depends on the IHR curve. The calculation is only made from the beginning of HTHR
to 60ºCA and LTHR is not taken into account. See Figure 5 in § 3.2.4.
(4.17)
In order to characterize the start of combustion, the position of CA, where 5% of Q have been
released, was recorded. To characterize the middle of combustion the 50% of Q is computed.
Finally to characterize the end of combustion, the 90% of Q is recorded as well.
The duration of combustion, can be now calculated as the following difference %5%90 QQ − .
⋅+⋅⋅−
=dt
dptV
dt
dVtp
dt
dQ)()(
1
1γ
γ
⋅+⋅⋅−
=θ
θθ
θγγθ d
dpV
d
dVp
d
dQ)()(
1
1
⋅+⋅⋅−
=θ
θθ
θγγθ σσ d
dpV
d
dVp
d
dQ)()(
1
1

29
( )QmeanCOV
Q
Q
2σ=
Pressure-Volume-Fuel Quantity
4.2.8. Coefficient COV
In order to characterize the ignition process, the coefficient of variance COV of the total heat
release is computed over the restricted interval [-20, 60] ºCA. It represents a normalised number of the
squared mean deviation from the average value:
(4.18)
A HCCI likewise combustion with almost instantaneous release should therefore present relatively
high COV value whereas a slow combustion mode (extended over a larger crank angle) should result
in a flat heat release curve which is characterized by lower COV value [6].
4.3. Calculation Methodology
The analysis of the results has been carried out mainly by using the Mean Effective Pressures, the
efficiencies and the Heat release. The definitions of these variables can be found in § 4.2. The
calculation flow can be shown in Figure 10 .
Figure 10 Calculation flow chart
This flow chart explains how variables are introduced and calculated. It also shows the order of
calculations. The pressure was measured (see Figure 8 in § 4.1) and the volume was calculated as
shown in § 4.2.1. The fuel quantity was extracted from the linear interpolation measured from [19] and
can be found in the appendix A3.
IMEPnet and IMEPgross
FuelMEP
QMEP
combη
thη
iη
gasη
30
0
10
20
30
40
50
60
-10 -5 0 5 10 15 20
Crank Angle
Pressure[bar]
T=42ºCT=50ºCT=60ºCT=70ºCT=80ºC
-20
0
20
40
60
80
100
120
140
160
180
-10 0 10 20
Crank Angle
Instantaneous Heat Release [J]
T=42ºCT=50ºCT=60ºCT=70ºCT=80ºC
Chapter 5
Results and Discussion
5.1. Effects of kerosene temperature on combustion performance
Summary
• Higher thermodynamic efficiency for higher fuel tank temperatures
• Earlier start of combustion for higher fuel tank temperatures
• Faster combustion process for higher fuel tank temperatures
• Higher cylinder gas temperatures for higher fuel tank temperatures
Since the work undertaken by Claudia Täschler [19] noted that the engine performed better when
the fuel tank temperature was higher; the influence of the kerosene temperature on the combustion
performance is studied here. Although the exact temperature of kerosene injected in the cylinder was
not available, the fuel tank temperature can be a good indicator. In reality, if the fuel tank temperature
is higher the injected kerosene must be as well.
This test consists of keeping all the parameters constant recording measurement when the fuel
tank temperature rises. Note that when the engine is working some of the pressurised fuel returns to
the fuel tank, warming up the rest of the kerosene that remains inside. Thus, when pumped again, the
fuel temperature will rise as well.
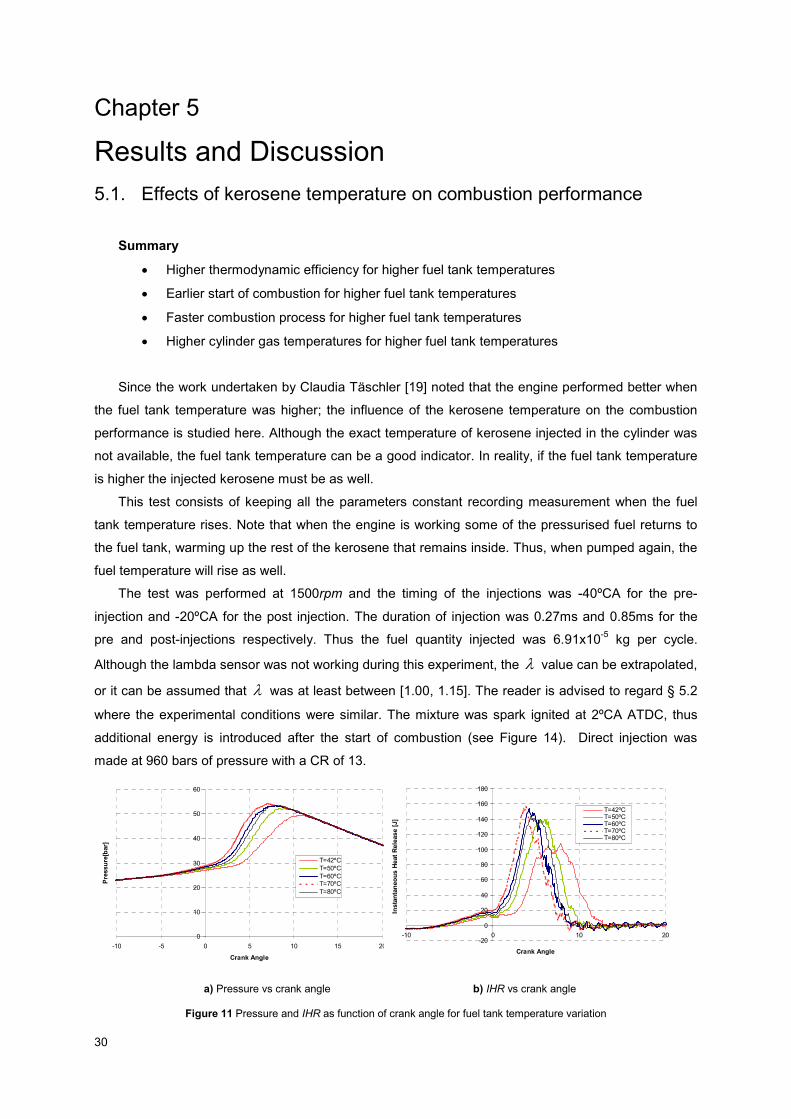
The test was performed at 1500rpm and the timing of the injections was -40ºCA for the pre-
injection and -20ºCA for the post injection. The duration of injection was 0.27ms and 0.85ms for the
pre and post-injections respectively. Thus the fuel quantity injected was 6.91x10⁻⁵ kg per cycle.
Although the lambda sensor was not working during this experiment, the λ value can be extrapolated,
or it can be assumed that λ was at least between [1.00, 1.15]. The reader is advised to regard § 5.2
where the experimental conditions were similar. The mixture was spark ignited at 2ºCA ATDC, thus
additional energy is introduced after the start of combustion (see Figure 14). Direct injection was
made at 960 bars of pressure with a CR of 13.
a) Pressure vs crank angle b) IHR vs crank angle
Figure 11 Pressure and IHR as function of crank angle for fuel tank temperature variation

31
30
32
34
36
38
40
42
44
46
48
40 45 50 55 60 65 70 75 80
Fuel Tank Temperature [ºC]
Combustion Duration [CAD]
0,600
0,610
0,620
0,630
0,640
0,650
0,660
0,670
0,680
0,690
0,700
40 45 50 55 60 65 70 75 80
Fuel Tank Temperature [ºC]
Therm
odynamic Efficiency [%]
0
10
20
30
40
50
60
70
80
90
100
-20 -10 0 10 20 30 40 50 60
Crank Angle
Cumulative Heat Release [%]
T=42ºCT=50ºCT=60ºCT=70ºCT=80ºC
0
200
400
600
800
1000
1200
1400
1600
-20 -10 0 10 20 30 40 50 60
Crank Angle
Cylinder Gas Temperature [K]
T=42ºCT=50ºCT=60ºCT=70ºCT=80ºC
Figure 11 shows the pressure and IHR as function of crank angle for the several fuel tank
temperature measures. It is possible to observe a trend on both curves. With the augmentation of the
fuel tank temperature, both pressure and IHR shift to the left and have bigger peaks. The two visible
peaks in almost all the IHR curve are due to the additional energy provided by the spark plug 2ºCA
ATDC. The higher the fuel tank temperature is, the less visible the two peaks are. This may be related
to the velocity of combustion, which increases with the fuel tank temperature (see Figure 12 a)), thus
the flame propagation after the spark kernel is not fast enough to create the second peak. It also can
be revealed in Figure 11 b) that lower fuel tank temperatures have larger IHR curves conducting to
higher combustion duration, thus lower thermodynamic efficiency (see Figure 12).
a) Combustion duration vs fuel tank temperature b) Thermodynamic efficiency vs fuel tank temperature
Figure 12 Combustion duration and Thermodynamic efficiency as function of fuel tank temperature
Despite the fact that the calculation shows higher thermodynamic efficiency to fuel tank
temperature of 70ºC it does not seem reasonable to conclude that. In fact, the higher the temperature
of the injected fuel, the easier the evaporation should occur due to the reason that the surface tension
of the spray drops is lower with the augmentation of the fuel temperature. Thus, the higher
thermodynamic efficiency should be given to 80ºC.
a) CHR vs crank angle b) Cylinder gas temperature vs crank angle
Figure 13 CHR and Cylinder gas temperature as function of crank angle for various fuel tank temperatures
The same trend found in Figure 11 can be observed in Figure 13. Concerning Figure 13 b) it can
be seen that even before combustion the cylinder gas temperature is higher for higher fuel tank

32
-2
-1,5
-1
-0,5
0
0,5
1
40 45 50 55 60 65 70 75 80
Fuel Tank Temperature [ºC]
Q5%[CAD]
temperature. Thus, the statement said before, that the injected fuel temperature should be higher
when fuel tank temperature is too, is valid. Nevertheless, it seems that cylinder gas temperature for
the fuel tank temperature of T=80ºC is lower then T=70ºC and T=60ºC. This might be because of
poor measurements, or a parameter changing during the experiment.
Finally, the start of combustion is also a function of the fuel tank temperature as shown in Figure
14. The start of combustion seems to occur earlier as the fuel tank temperature rises. This is
understandable since the surface tension of the spray drops is lower with the augmentation of the fuel
temperature, thus the vaporization process is faster and the conditions for combustion to start are
more easily achieved.
Figure 14 Q5% as function of fuel tank temperature
5.2. Excess of air ratio λ variation with SI
Summary
• Leaner mixtures have lower pressure curves, thus lower IHR
• Richer mixtures have higher pressure curves, thus higher IHR
• Very rich mixtures (λ=0.70) significantly delay start of combustion
• Leaner mixtures have lower cylinder gas temperatures
• Efficiencies increase with leaner mixtures
• Maximum combustion and thermodynamic efficiency was found for λ=1.15
In order to understand the behaviour of a kerosene fuelled engine with the variation ofλ , the fuel
quantity of the post-injection was varied on several measures. This test consists of varying the injected
fuel quantity in the post-injection and keeping all of the other parameters constant.
The test was performed at 1500rpm and the timing of the injections was -126ºCA for the pre-
injection and -26ºCA for the post-injection. Thus, a very homogeneous mixture should be reached.
These tests were spark ignited with a spark advance at a constant -8ºCA. The intention to spark ignite
the mixture was also to better comprehend the kerosene flame propagation. The duration of injection
was 0.4ms for the pre-injection and [1.7; 1.16; 0.85; 0.64; 0.55] ms for the post-injection. Thus the fuel

33
0
10
20
30
40
50
60
-10 -5 0 5 10 15 20
Crank Angle
Pressure[bar]
λ=0.70λ=0.85λ=1.00λ=1.15λ=1.30
0
200
400
600
800
1000
1200
1400
1600
1800
-20 -10 0 10 20 30 40 50 60
Crank Angle
Cylinder Gas Temperature [K]
λ=0.70λ=0.85λ=1.00λ=1.15λ=1.30
-50
0
50
100
150
200
250
300
350
400
-10 -5 0 5 10 15 20
Crank Angle
Instantaneous Heat Release [J]
λ=0.70λ=0.85λ=1.00λ=1.15λ=1.30
0
10
20
30
40
50
60
70
80
90
100
-20 -10 0 10 20 30 40 50 60
Crank Angle
Cumulative Heat Release [%]
λ=0.70λ=0.85λ=1.00λ=1.15λ=1.30
quantity injected was [12.9; 9.56; 7.66; 6.38; 5.82] x10-5kg per cycle. The lambda sensor revealed the
following values: =λ [0.7; 0.85; 1.00; 1.15; 1.30]. Direct injection was made at 950 bars of pressure
with a CR of 13.
ºC
a) Pressure vs crank angle b) Cylinder gas temperature vs crank angle
c) IHR vs crank angle d) CHR vs crank angle
Figure 15 Pressure, Cylinder gas temperature, IHR and CHR as function of crank angle for various λ
Figure 15 shows several graphics carried out by the calculation methodology technique shown in
§ 4.3.
Investigating Figure 15 a) it is possible to observe that leaner mixtures (λ>1) have lower pressure
curves and richer mixtures (λ<1) have higher pressure curves. It is also visible that for very rich
mixtures (λ=0.70) the shift of the curve to the right is considerable, clearly showing a bigger delay of
start of combustion (see also Figure 16 a)). The same drift can be observed in Figure 15 c). In fact
delaying the start of combustion has an important effect on the IHR curve as well. Notice that a big
delay on the start of combustion means that the piston will be above the TDC on its way to BDC, thus
the cylinder pressure is lowering (for this reason equation (4.16) is driven to lower values) and also the
in-cylinder temperature will peak at higher crank angle values. In fact, observing Figure 15 b) it is
possible to perceive this and also that richer mixtures have higher temperatures of cylinder gases and
that they peak at higher values of crank angle. For the same reason, the combustion reaction for
λ=0.70 is very quick (see Figure 16 b)). The conditions of pressure and temperature in the cylinder, for
combustion to continue become precarious. This situation empathises the low thermodynamic and
combustion efficiencies (see Figure 17).

34
-1
-0.5
0
0.5
1
1.5
2
2.5
3
3.5
4
0.600 0.700 0.800 0.900 1.000 1.100 1.200 1.300 1.400
Excess of air ratio λ
Q5%[CAD]
20
25
30
35
40
45
50
55
60
0.600 0.700 0.800 0.900 1.000 1.100 1.200 1.300 1.400
Excess of air ratio λ
Combustion Duration [CAD]
0.140
0.160
0.180
0.200
0.220
0.240
0.260
0.280
0.600 0.700 0.800 0.900 1.000 1.100 1.200 1.300 1.400
Excess of air ratio λ
Combustion Efficiency [%]
0.505
0.510
0.515
0.520
0.525
0.530
0.600 0.700 0.800 0.900 1.000 1.100 1.200 1.300 1.400
Excess of air ratio λ
Therm
odynamic Efficiency [%]
Figure 16 a) reinforces the idea that the excess of air ratio λ has a big influence on the start of
combustion. For values below the stoichiometric (λ=1.00) the start of combustion is delayed, and for
values above λ=1.00 little influence is observed.
In Figure 16 b) it is possible to see that the combustion process is longer for the stoichiometric
value. This can lead to the fact that kerosene flame propagation is slower at that λ value, or that
there is the right amount of oxygen to burn almost all the injected fuel. Indeed, it is more reasonable to
conclude that, for richer mixtures there is not enough oxygen to burn all the injected kerosene, thus
the combustion is faster and incomplete. In leaner mixtures there is more oxygen, consequently the
combustion is also faster than stoichiometric, burning almost all the injected fuel.
a) Q5% vs λ b) Combustion duration vs λ
Figure 16 Q5% and Combustion duration as function of λ
Figure 17 shows both combustion and thermodynamic efficiencies. A maximum efficiency (both
combustion and thermodynamic) is achieved when λ=1.15. In both figures, a and b, it is clear that
efficiency increases with leaner mixtures. Thermodynamic efficiency declines after the maximum
value. On the other hand combustion efficiency remains almost unchangeable. The values for
combustion efficiency are considerably low, they should be much higher. This fact might be related
with the calculation of injected fuel in the cylinder and its explained in §5.4.
a) Combustion efficiency vs λ b) Thermodynamic efficiency vs λ
Figure 17 Combustion and Thermodynamic efficiencies as function of λ
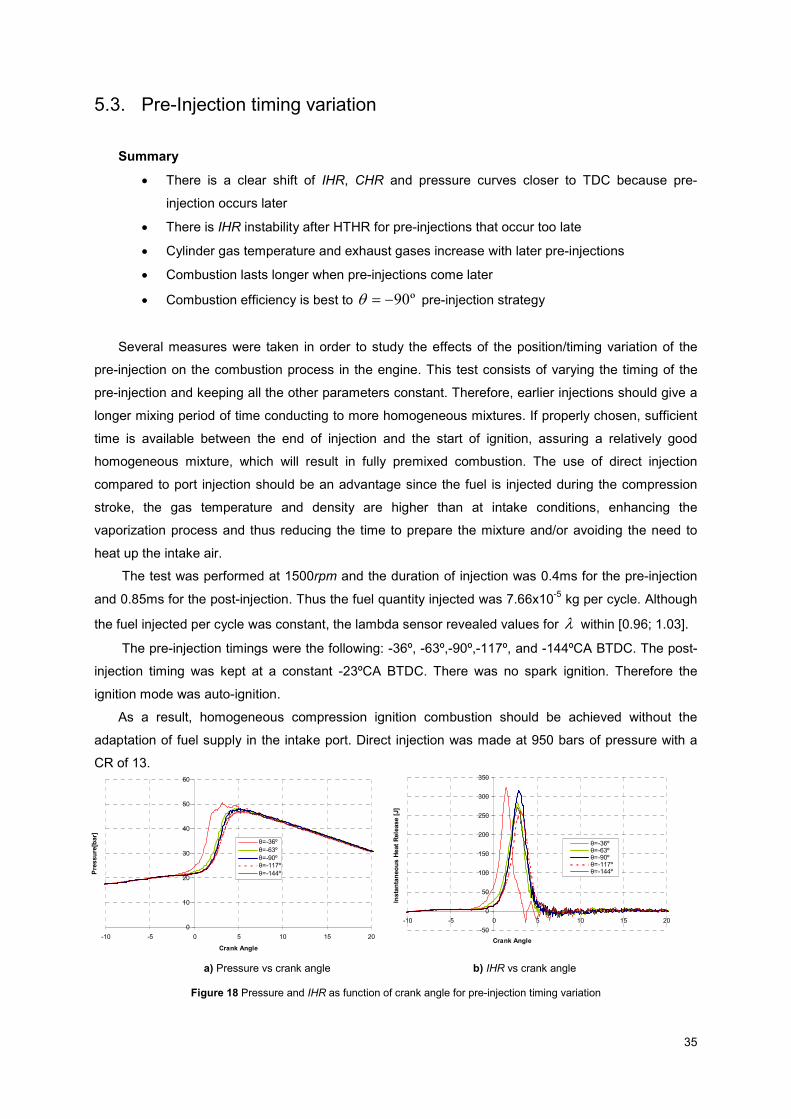
35
0
10
20
30
40
50
60
-10 -5 0 5 10 15 20
Crank Angle
Pressure[bar]
θ=-36ºθ=-63ºθ=-90ºθ=-117ºθ=-144º
-50
0
50
100
150
200
250
300
350
-10 -5 0 5 10 15 20
Crank Angle
Instantaneous Heat Release [J]
θ=-36ºθ=-63ºθ=-90ºθ=-117ºθ=-144º
5.3. Pre-Injection timing variation
Summary
• There is a clear shift of IHR, CHR and pressure curves closer to TDC because pre-
injection occurs later
• There is IHR instability after HTHR for pre-injections that occur too late
• Cylinder gas temperature and exhaust gases increase with later pre-injections
• Combustion lasts longer when pre-injections come later
• Combustion efficiency is best to º90−=θ pre-injection strategy
Several measures were taken in order to study the effects of the position/timing variation of the
pre-injection on the combustion process in the engine. This test consists of varying the timing of the
pre-injection and keeping all the other parameters constant. Therefore, earlier injections should give a
longer mixing period of time conducting to more homogeneous mixtures. If properly chosen, sufficient
time is available between the end of injection and the start of ignition, assuring a relatively good
homogeneous mixture, which will result in fully premixed combustion. The use of direct injection
compared to port injection should be an advantage since the fuel is injected during the compression
stroke, the gas temperature and density are higher than at intake conditions, enhancing the
vaporization process and thus reducing the time to prepare the mixture and/or avoiding the need to
heat up the intake air.
The test was performed at 1500rpm and the duration of injection was 0.4ms for the pre-injection
and 0.85ms for the post-injection. Thus the fuel quantity injected was 7.66x10⁻⁵ kg per cycle. Although
the fuel injected per cycle was constant, the lambda sensor revealed values for λ within [0.96; 1.03].
The pre-injection timings were the following: -36º, -63º,-90º,-117º, and -144ºCA BTDC. The post-
injection timing was kept at a constant -23ºCA BTDC. There was no spark ignition. Therefore the
ignition mode was auto-ignition.
As a result, homogeneous compression ignition combustion should be achieved without the
adaptation of fuel supply in the intake port. Direct injection was made at 950 bars of pressure with a
CR of 13.
a) Pressure vs crank angle b) IHR vs crank angle
Figure 18 Pressure and IHR as function of crank angle for pre-injection timing variation

36
0
10
20
30
40
50
60
70
80
90
100
-20 -10 0 10 20 30 40 50 60
Crank Angle
Cumulative Heat Release [%]
θ=-36ºθ=-63ºθ=-90ºθ=-117ºθ=-144º
0
200
400
600
800
1000
1200
1400
1600
1800
-20 -10 0 10 20 30 40 50 60
Crank Angle
Cylinder Gas Temperature [K]
θ=-36ºθ=-63ºθ=-90ºθ=-117ºθ=-144º
Figure 18 a) shows the evolution of the pressure as function of crank angle. There is a clear
tendency to shift the pressure curve at the vicinity of TDC as function of the timing of injection. The
later the pre-injection, the closer the curve is to TDC. The same can be observed in Figure 18 b), the
IHR shifts the same way as the pressure curve. Furthermore, it is noticeable that too late pre-
injections have oscillating behaviour at the end of HTHR. At pre-injection timing of º36−=θ big
oscillations of IHR are visible, especially between 3 to 5ºCA (at the end of HTHR). These oscillations
can be a sign of fuel stratification, small clouds of rich mixture that could auto-ignite locally or knock
(as some authors suggest [22]) and consequently some peaks on the IHR are found. This is visible
when Figure 18 a) and Figure 19 b) are observed. They both show high oscillations between 3 to 5ºCA
with a pre-injection timing of º36−=θ . As a matter of fact, during the experiments, the later the pre-
injection, the heavier the sound of the engine was perceptible.
Concerning the cumulative heat release, Figure 19 a) shows the specific performance of each of
the tests carried out.
a) CHR vs crank angle b) Cylinder gas temperature vs crank angle
Figure 19 CHR and Cylinder gas temperature as function of crank angle for pre-injection timing variation
It can be observed that too late pre-injection ( º36−=θ ) noticeably affects the CHR, shifting the
curve to the vicinity of the TDC and delaying the combustion process. There seems to be an ideal pre-
injection timing at º90−=θ where the cumulative heat release is delivered more rapidly than the
other pre-injection timings.
Figure 19 b) shows the cylinder gas temperature profile of each pre-injection timing strategy.
There is a clear tendency to shift up the gas temperature as the pre-injection delay increases. Thus,
pre-injection strategies closer to TDC appear to have gas temperatures higher than sooner pre-
injection. Consequently, later pre-injections have hotter exhaust temperatures as well. It is also
possible to observe temperature oscillations in the later pre-injection. As said before, this can occur
due to fuel stratification that can locally ignite after the main combustion.

37
0
0.5
1
1.5
2
2.5
3
3.5
-160 -140 -120 -100 -80 -60 -40 -20 0
Pre-Injection [degrees before TDC]
Q50%[CAD]
40
42
44
46
48
50
52
54
56
58
60
-160 -140 -120 -100 -80 -60 -40 -20 0
Pre-Injection [degrees before TDC]
Combustion Duration [CAD]
0.220
0.225
0.230
0.235
0.240
0.245
0.250
-160 -140 -120 -100 -80 -60 -40 -20 0
Pre-Injection [degrees before TDC]
Combustion Efficiency [%]
a) Q50% vs pre-injection timing b) Combustion duration vs pre-injection timing
Figure 20 Q50% and Combustion duration as function of crank angle for pre-injection timing variation
In Figure 20 a) the curve shifting observed in Figure 18 is emphasised. In fact, it shows the
position of 50% of the CHR as function of the various pre-injection strategies. Again, a tendency can
be observed. As the pre-injection comes later, the 50% of CHR approximates the TDC.
Figure 20 b) shows the combustion duration in CAD as function of the various pre-injection
strategies. It can be noticed that the combustion duration increases with the increase of the pre-
injection delay. Moreover, an optimal strategy seems to occur, where the combustion duration is the
fastest. That strategy is, when the pre-injection is done at º90−=θ .
To support the last statement, Figure 21 is plotted. It clearly shows the optimal pre-injection
strategy that should be used at these tests conditions. The highest combustion efficiency (24.6%) is
achieved at º90−=θ timing of pre-injection. Again, the low combustion efficiencies are discussed in
§5.4.
Figure 21 Combustion Efficiency as function of crank angle for pre-injection timing variation
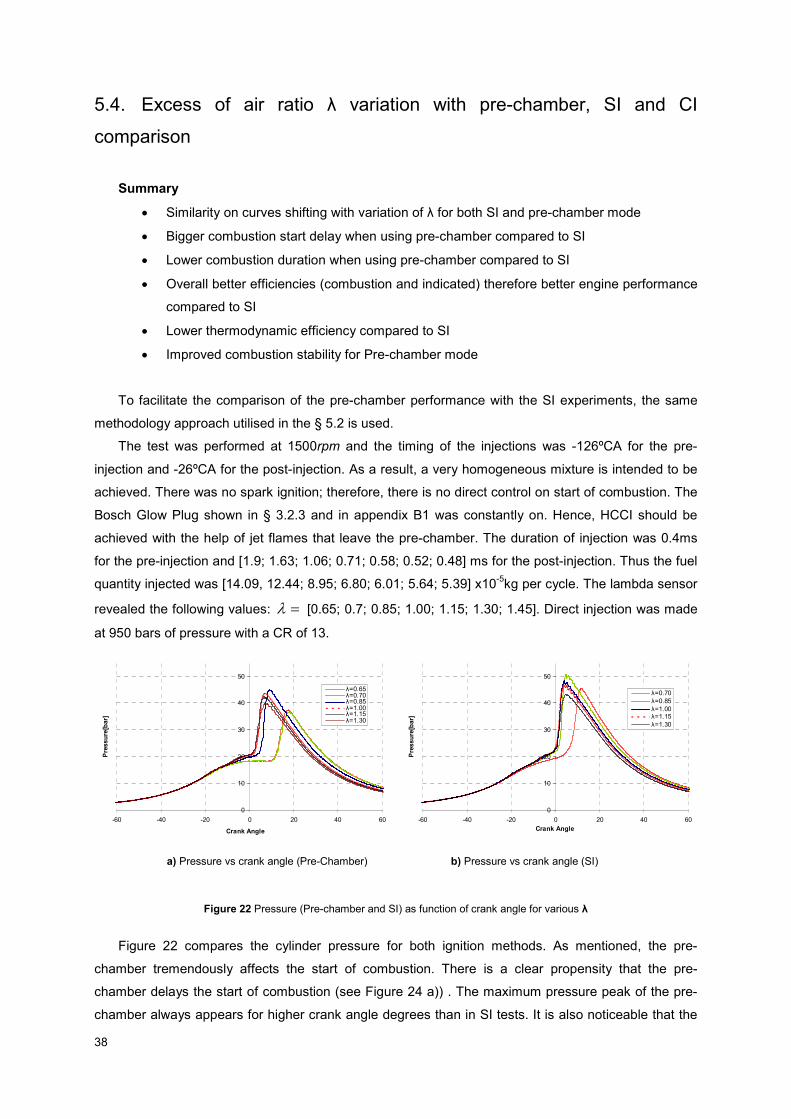
38
0
10
20
30
40
50
-60 -40 -20 0 20 40 60
Crank Angle
Pressure[bar]
λ=0.65λ=0.70λ=0.85λ=1.00λ=1.15λ=1.30
0
10
20
30
40
50
-60 -40 -20 0 20 40 60Crank Angle
Pressure[bar]
λ=0.70λ=0.85λ=1.00λ=1.15λ=1.30
5.4. Excess of air ratio λ variation with pre-chamber, SI and CI
comparison
Summary
• Similarity on curves shifting with variation of λ for both SI and pre-chamber mode
• Bigger combustion start delay when using pre-chamber compared to SI
• Lower combustion duration when using pre-chamber compared to SI
• Overall better efficiencies (combustion and indicated) therefore better engine performance
compared to SI
• Lower thermodynamic efficiency compared to SI
• Improved combustion stability for Pre-chamber mode
To facilitate the comparison of the pre-chamber performance with the SI experiments, the same
methodology approach utilised in the § 5.2 is used.
The test was performed at 1500rpm and the timing of the injections was -126ºCA for the pre-
injection and -26ºCA for the post-injection. As a result, a very homogeneous mixture is intended to be
achieved. There was no spark ignition; therefore, there is no direct control on start of combustion. The
Bosch Glow Plug shown in § 3.2.3 and in appendix B1 was constantly on. Hence, HCCI should be
achieved with the help of jet flames that leave the pre-chamber. The duration of injection was 0.4ms
for the pre-injection and [1.9; 1.63; 1.06; 0.71; 0.58; 0.52; 0.48] ms for the post-injection. Thus the fuel
quantity injected was [14.09, 12.44; 8.95; 6.80; 6.01; 5.64; 5.39] x10-5kg per cycle. The lambda sensor
revealed the following values: =λ [0.65; 0.7; 0.85; 1.00; 1.15; 1.30; 1.45]. Direct injection was made
at 950 bars of pressure with a CR of 13.
a) Pressure vs crank angle (Pre-Chamber) b) Pressure vs crank angle (SI)
Figure 22 Pressure (Pre-chamber and SI) as function of crank angle for various λ
Figure 22 compares the cylinder pressure for both ignition methods. As mentioned, the pre-
chamber tremendously affects the start of combustion. There is a clear propensity that the pre-
chamber delays the start of combustion (see Figure 24 a)) . The maximum pressure peak of the pre-
chamber always appears for higher crank angle degrees than in SI tests. It is also noticeable that the

39
-50
0
50
100
150
200
250
300
-5 0 5 10 15 20 25
Crank Angle
Instantaneous Heat Release [J]
λ=0.65λ=0.70λ=0.85λ=1.00λ=1.15λ=1.30
0
10
20
30
40
50
60
70
80
90
100
-20 -10 0 10 20 30 40 50 60
Crank AngleCumulative Heat Release [%]
λ=0.65λ=0.70λ=0.85λ=1.00λ=1.15λ=1.30
-4
-2
0
2
4
6
8
10
0.60 0.70 0.80 0.90 1.00 1.10 1.20 1.30 1.40 1.50
Excess of air ratio λ
Q5%[CAD]
CI with Pre-Chamber
SI
CI
0
10
20
30
40
50
60
0.60 0.70 0.80 0.90 1.00 1.10 1.20 1.30 1.40 1.50
Excess of air ratio λ
Combustion Duration [CAD]
CI with Pre-Chamber
SI
CI
peak of pressure in the pre-chamber tests is always lower than the corresponding SI ones. Since the
start of combustion is delayed, the piston is already in the expansion stroke on its way to BDC;
therefore the lower peaks of pressure during combustion are expected. If the pressure curves are
shifted to the right and have lower peaks of pressure in the pre-chamber tests, thus all the other
curves (cylinder gas temperature, IHR and CHR) should behave similarly as well. The cylinder gas
temperature is not plotted here because it is largely similar to the SI Figure 15 b) shown in § 5.2.
a) IHR vs crank angle (Pre-chamber) b) CHR vs crank angle (Pre-chamber)
Figure 23 IHR and CHR (Pre-chamber) as function of crank angle for various λ
Figure 23 shows the IHR and the CHR of the pre-chamber tests. When comparing with Figure 15
c) and d) it is noticeable that curves are shifted to the right. Again, IHR peak at higher crank angle
values. If compared with the SI tests, it is possible to see that they peak with lower values. Faster
combustion for richer mixtures can be seen in Figure 23 b).
All the analysis through § 5.2 is also valuable in this section. Consequently, emphasis is given to
the comparison of combustion performance between SI and pre-chamber tests.
a) Q5% vs λ b) Combustion duration vs λ
Figure 24 Q5% and Combustion duration (Pre-chamber, SI and CI) as function of λ
Figure 24 compares Q5% and the combustion duration between the pre-chamber, SI and CI tests.
As said before, Figure 24 a) shows that there is a clear propensity of delaying the start of combustion
when the pre-chamber is used.
In Figure 24 b) it is clear that the pre-chamber severely affects the combustion duration. When
used it can burn the fuel faster then flame propagation on SI mode (10ºCA faster, maximum). Thus,

40
0.120
0.140
0.160
0.180
0.200
0.220
0.240
0.260
0.280
0.300
0.60 0.70 0.80 0.90 1.00 1.10 1.20 1.30 1.40 1.50
Excess of air ratio λ
Combustion Efficiency [%]
CI with Pre-Chamber
SI
CI
0.470
0.480
0.490
0.500
0.510
0.520
0.530
0.540
0.60 0.70 0.80 0.90 1.00 1.10 1.20 1.30 1.40 1.50
Excess of air ratio λ
Therm
odynamic Efficiency [%]
CI with Pre-Chamber
SI
CI
6
7
8
9
10
11
12
0.60 0.70 0.80 0.90 1.00 1.10 1.20 1.30 1.40 1.50
Excess of air ratio λ
QMEP [bar]
CI with Pre-Chamber
SI
CI
6
16
26
36
46
56
66
76
86
0.60 0.70 0.80 0.90 1.00 1.10 1.20 1.30 1.40 1.50
Excess of air ratio λ
FuelM
EP [bar]
CI with Pre-Chamber
SI
CI
the flame jets flowing out of the pre-chamber should burn better and quicker than the mixture in the
cylinder. If the combustion duration is reduced, its efficiency should be increased as predicted in HCCI
theory shown in § 3.2.4.
Figure 25 a) proves that combustion efficiency is in fact higher when the pre-chamber is used.
Figure 25 Combustion and Thermodynamic efficiencies (Pre-chamber, SI and CI) as function of λ
Although the combustion efficiency is higher to the pre-chamber tests, the thermodynamic
efficiency (see Figure 25 b)) presents the inverse results. This is due to the definition of the
thermodynamic efficiency presented in § 4.2.4 by equation (4.10).In fact, the IMEPgross is severely
affected by the big delay of start of combustion. Figures shown in appendix C4 help to give a better
explanation. Especially in very rich mixtures (λ=0.65 and λ=0.70), there is a clear discontinuity of the
PV curve.
Figure 26 QMEP and FuelMEP (Pre-chamber, SI and CI) as function of λ
In Figure 26 a) it is possible to observe that the CHR (QMEP) is higher, for leaner and richer
mixture, in the pre-chamber tests than in SI mode. Comparing with CI mode, pre-chamber present
always higher QMEP values. This also helps to conclude that with pre-chamber the fuel burns better,
delivering more heat, thus more work is produced and consequently more power.
a) Combustion Efficiency vs λ b) Thermodynamic Efficiency vs λ
a) QMEP vs λ b) FuelMEP vs λ

41
0.060
0.070
0.080
0.090
0.100
0.110
0.120
0.60 0.70 0.80 0.90 1.00 1.10 1.20 1.30 1.40 1.50
Excess of air ratio λ
Indicated Efficiency [%]
CI with Pre-Chamber
SI
CI
0
5
10
15
20
25
30
35
40
4.2 4.3 4.4 4.5 4.6 4.7 4.8
IMEP[bar]
Counts
0
10
20
30
40
50
60
3.9 4 4.1 4.2 4.3 4.4 4.5
IMEP[bar]
Counts
Figure 27 shows a comparison between SI and Pre-chamber combustion stability at λ=1.0.
Figure 27 Comparison of combustion stability (Pre-chamber and SI)
With SI combustion, a lot more fluctuations of in-cylinder IMEP can be observed. The deterioration
of the combustion comes from cycles with poor or incomplete combustion followed by cycles with
higher IMEP.
Figure 28 Indicated Efficiency (Pre-chamber, SI and CI) as function of λ
Finally Figure 28 is plotted to give an idea on the values of the indicated efficiency. First it is
noticeable that the curve shape is similar to the combustion efficiency curve shown in Figure 25 a).
Secondly it is possible to see the slightly better efficiency in the pre-chamber tests.
In all the tests performed, the indicated efficiencies were always below 15%. For that reason,
Figure 28 is also plotted so that the reader understands that all the results here presented are as a
consequence of tests performed in a very old engine from the 1960’s (see appendix A). Thus they
should only help to understand the behaviour of kerosene when burnt inside the cylinder chamber.
The combustion and thermodynamics efficiencies should give an idea how kerosene behaves
inside the combustion chamber in different conditions. Although all the combustion efficiencies are
very low they should not invalidate the main results. The main reason for these values inconsistencies
a) Counts of IMEP on SI mode b) Counts of IMEP on Pre-chamber mode

42
is due to the fact how they are calculated. The combustion efficiency is calculated with formula (4.11)
showed in section §4.2.4. The value FuelMEP is obtained with the calculation of the mass of fuel
supplied per cycle. This mass is not measured. In fact it was calculated from the work undertaken by
Claudia Täschler [19]. In appendix A3 a relation between the fuel flow and its pressure can be found.
This relation is questionable, and can be the main cause of the very low combustion efficiencies. It is
suspected that the fuel flow values are overestimated, thus low combustion efficiencies are calculated.
Again, all the conclusions are valid despite the fact that the low combustion efficiencies values are not
representative.

43
44
Chapter 6
Conclusions and perspectives
6.1. Conclusions
To understand the behaviour of kerosene combustion in an ICE several parameters were
investigated. The influence of the fuel temperature, the timing of the pre-injection and the richness of
the mixture. Furthermore, SI and CI were investigated and HCCI was attempted to be achieved with a
new concept of combustion pre-chamber. The experiments allow to drawn the following conclusions.
1. Higher thermodynamic efficiency, earlier start of combustion, faster combustion process and
higher cylinder pressure happens for higher kerosene temperature. Vaporization process
becomes easier with increased fuel temperature once the surface tension of the drops is lowered.
Hence homogenization of mixture is improved.
2. Start of combustion is sensitive to excess of air ratio in SI and CI mode, presenting a large delay
when the mixture is very rich (λ<0.70).
3. Engine start is difficult on CI mode when engine is cold.
4. Better efficiencies are obtained for leaner mixtures, presenting a maximum when λ=1.15.
5. Too late pre-injections lead to IHR instability at the end of HTHR. Fuel stratification may take
place and auto-ignition of small clouds of rich mixture happens.
6. Curves shifting are similar with variation of λ for both SI and pre-chamber mode.
7. The pre-chamber leads to larger ignition. In fact, the ignition is not controlled as in SI mode.
8. The use of pre-chamber leads to overall better efficiencies (combustion and indicated), thus better
engine performance.
9. The use of pre-chamber and HCCI approach leads to improved combustion stability.
10. The long ignition delay, which can partly lead to low soot emissions, could be beneficial for
expanding the HCCI operation area. In combination with the market availability of kerosene, it has
the possibility to be a suitable HCCI fuel.
45
6.2. Perspectives
In this preliminary study, the pre-chamber results seem to be encouraging since overall better
efficiencies were achieved when compared with SI mode. However, the ignition delay seems to be
very high. For this reason, even better results are expected if the ignition delay could be properly
controlled.
A comparison between CI and CI with pre-chamber should complete the final conclusions. It
should also help to conclude if there is a positive influence in the use of the combustion pre-chamber
when compared with normal CI and SI mode. Therefore, further tests should be carried out with and
without pre-chamber using CI mode.
EGR can be used to increase the mixture dilution and augment its temperature so that the ignition
delay can be reduced. Thus, a Controlled Auto Ignition (CAI) of the HCCI mixture should be achieved.
Air assist DI combustion systems can be used for better fuel vaporization. This methodology can
also reduce the poor start problems once it enhances homogenization.
Pollutants measurement should be carried out once the aviation market will have its own
restrictions as in automobile market.
As the present work intends to study the kerosene combustion behaviour inside of an ICE for
aviation applications, the air admission pressure and its temperature should be fitted to the altitude
conditions.
Since Mistral Company intends to use Wankel engines, the results presented in this paper should
not be conclusive. Tests on a Wankel engine must be performed so that the study can be validated
on the application field.

46
References
[1] DAGAUT, P, & CATHONNET, M: The ignition, oxidation, and combustion of kerosene: A
review of experimental and kinetic modelling, CNRS France, 2005.
[2] CATHCART, G, DICKSON, G, & AHERN, S: The Application of Air-Assist Direct Injection for
Spark-ignited Heavy Fuel 2-Stroke and 4-Stroke Engines, Society of Automotive Engineers of
Japan, 2005.
[3] HOOPER, P: Initial development of a multi-fuel stepped piston engine for unmanned aircraft
application, Aircraft Engineering and Aerospace Technology.
[4] BACHA, J, BARNES, F, FRANKLIN, M, GIBBS, L, HEMIGHAUS, G, HOGUE, N, LESNINI, D,
JOHN, L, MAYBURY, & MORRIS, J: Aviation Fuels Technical Review, CHEVRON, 2000.
[5] CHOI, K S, YAMAGUMA, M, & OHSAWA, A: Ignitability of sprayed liquids due to an
electrostatic spark, Japan National Institute of Occupational Safety and Health, 2006.
[6] MEIER, M : Etude expérimentale de l’auto-inflammation d’une préchambre de moteur
monocylindre, EPFL Master Thesis 2006.
[7] QASIM, S K, SEUNG, W B, & HOJAT, G: On the Autoignition and Combustion Characteristics
of Kerosene Droplets at Elevated Pressure and Temperature, Korea Advanced Institute of
Science and Technology.
[8] STONE, Richard: Introduction to Internal Combustion Engines, Third edition, MACMILLAN
PRESS LTD, 1999.
[9] HEYWOOD, J B: Internal Combustion Engine Fundamentals, McGraw-Hill Book Co., 1988.
[10] OHTA, Y: Initiations of engine knock: Traditional and modern, Nagoya Institute of
Technology, 1989.
[11] WILLARD, W. Engineering Fundamentals of the Internal Combustion Engine, Second Edition,
Pearson Prentice Hall.
[12] SZYBIST, J, & BUNTING, B: Chemistry Impacts in Gasoline HCCI, Oak Ridge National
Laboratory, 2006.
[13] RYAN III, T, CALLAHAN, T, & MEHTA, D: HCCI in a Variable Compression Ratio Engine-
Effects of Engine Variables, SAE Technical Paper, No. 2004-01-1971, 2004.
[14] SHIBATA, G, & URUSHIHARA, T: The Interaction Between Fuel Chemicals and HCCI
Combustion Characteristics Under Heated Intake Conditions, SAE Technical Paper, No. 2006-
01-0207, 2006.
[15] GUIBET, J C: Carburants et Moteurs, Volume 1 & 2, Éditions Technip, Paris, 1987.
[16] LAMAR, Paul: The Rotor verses the Piston - http://www.rotaryeng.net/rotor-verses-the-
piston.txt
[17] HEGE, John B: The Wankel Rotary Engine, McFarland & Company, 2001.
[18] RITSUHARU, S, TOMOO, T, TORU, N & JUNUCHI, F: Mazda 4-Rotor Rotary Engine for the
Le Mans 24-Hour Endurance Race, Mazda Motor Corp.

47
[19] TÄSCHLER, C: Caractérisation expérimentale de l’inflammation d’un “spray” de kérosène,
dans les conditions d’un moteur, EPFL Master Thesis 2008.
[20] LOPES, J M C M: Motores de combustão interna - uma abordagem termodinâmica, AEIST,
texto provisório 2003.
[21] PLINT, M, & MARTYR, A: Engine Testing – Theory and Practice, 3rd Edition, Elsevier, 2007.
[22] ZHAO, H: HCCI and CAI engines for the automotive industry, Woodhead Publishing Limited,
Cambridge, 2007.
[23] WUNSCH, D : Numerical flow simulation of a natural gas engine equipped with an
unscavanged auto-ignition prechamber, Diploma Thesis EPFL.
Bibliography
• EIGENBROD, C, MORIUE, O, WEILMÜNSTER, P, & RATH, H J: Development of a simple
model fuel for kerosene droplet ignition, ZARM Germany, 2000.
• BURTIS, Wilson A: Rotary Wankel type engine, United States Patent, 1993.
• ARSIE, I, FLAUTI, G, PIANESE, C, & RIZZO, G: Cylinder Thermal State Detection from
Pressure Cycle in SI Engine, Dipartimento di Ingegneria Meccanica-Università di Salerno.
• BERGSTRAND, P: Effects on Combustion by Using Kerosene or MK1 Diesel, SAE Technical
Paper, No. 2007-01-0002, 2007.
• HYVÖNEN, J, & WILHELMSSON, C: The Effect of Displacement on Air-Diluted Multi-Cylinder
HCCI Engine Performance, SAE Technical Paper, No. 2006-01-0205, 2006.

48

49
Appendix
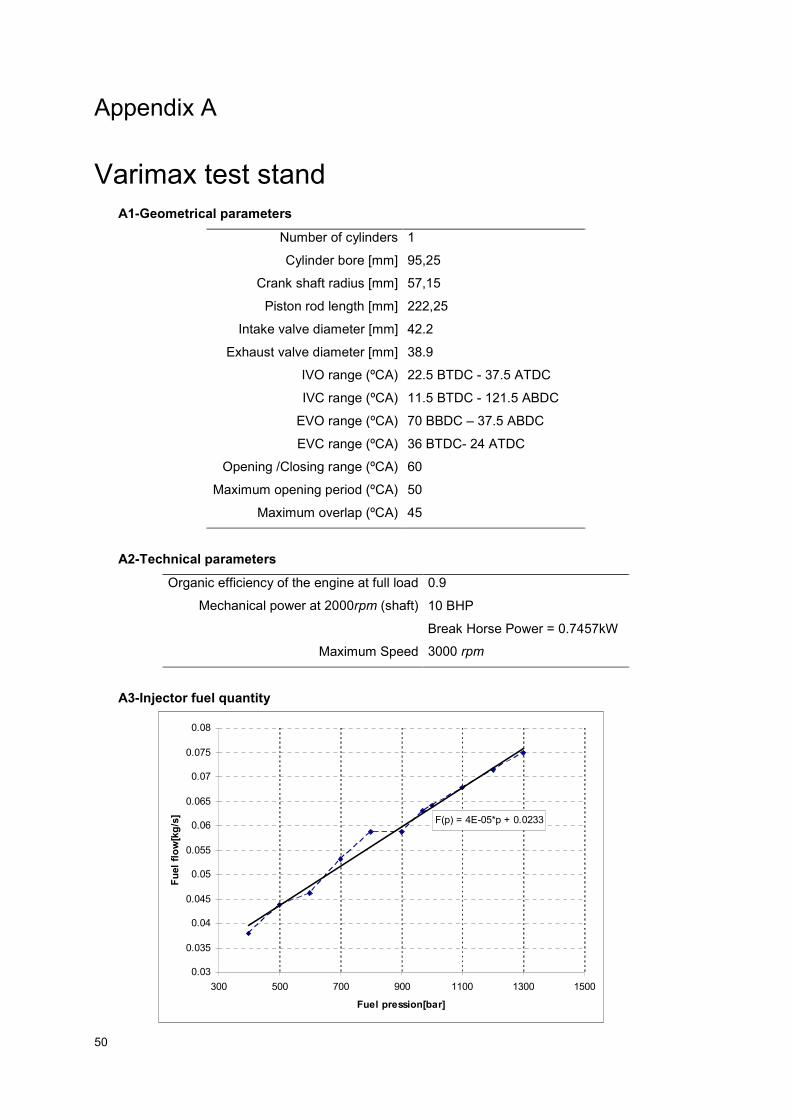
50
F(p) = 4E-05*p + 0.0233
0.03
0.035
0.04
0.045
0.05
0.055
0.06
0.065
0.07
0.075
0.08
300 500 700 900 1100 1300 1500
Fuel pression[bar]
Fuel flow[kg/s]
Appendix A
Varimax test stand A1-Geometrical parameters
Number of cylinders
Cylinder bore [mm]
Crank shaft radius [mm]
Piston rod length [mm]
Intake valve diameter [mm]
Exhaust valve diameter [mm]
IVO range (ºCA)
IVC range (ºCA)
EVO range (ºCA)
EVC range (ºCA)
Opening /Closing range (ºCA)
Maximum opening period (ºCA)
Maximum overlap (ºCA)
1
95,25
57,15
222,25
42.2
38.9
22.5 BTDC - 37.5 ATDC
11.5 BTDC - 121.5 ABDC
70 BBDC – 37.5 ABDC
36 BTDC- 24 ATDC
60
50
45
A2-Technical parameters
Organic efficiency of the engine at full load
Mechanical power at 2000rpm (shaft)
Maximum Speed
0.9
10 BHP
Break Horse Power = 0.7457kW
3000 rpm
A3-Injector fuel quantity
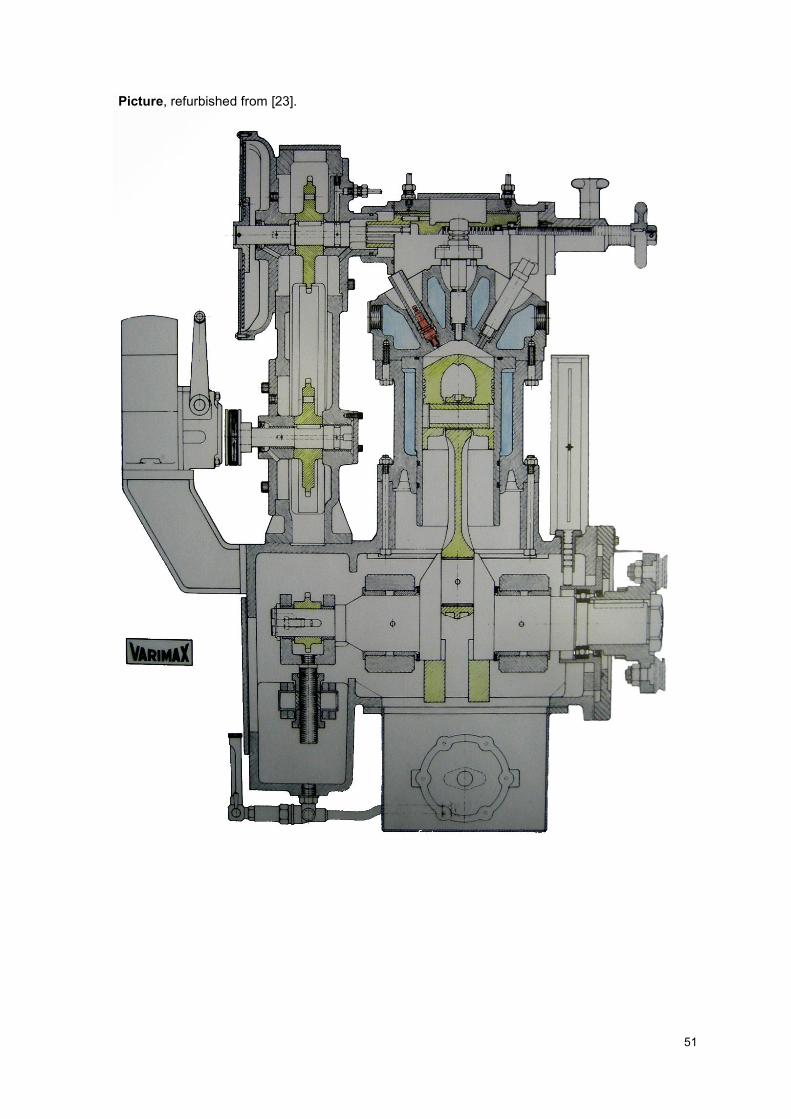
51
Picture, refurbished from [23].

52
Appendix B
Bosch glow-plug properties and Pre-chamber
design B1-Bosch Glow Plug
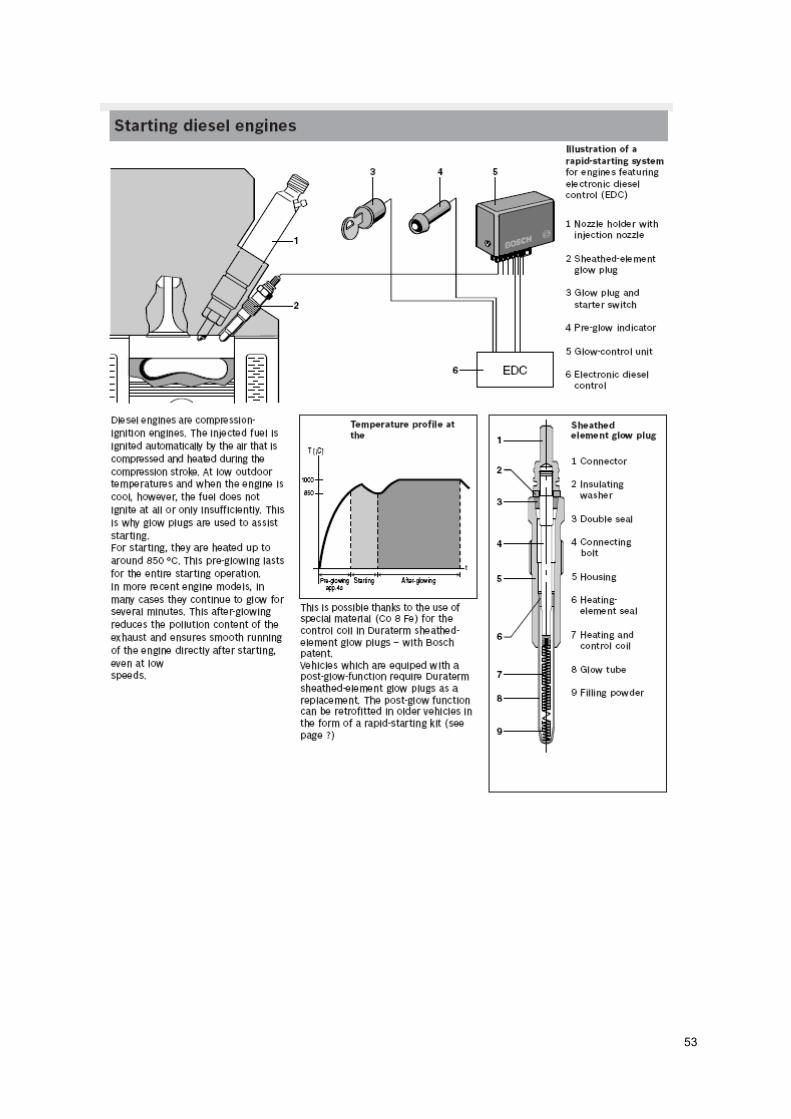
53
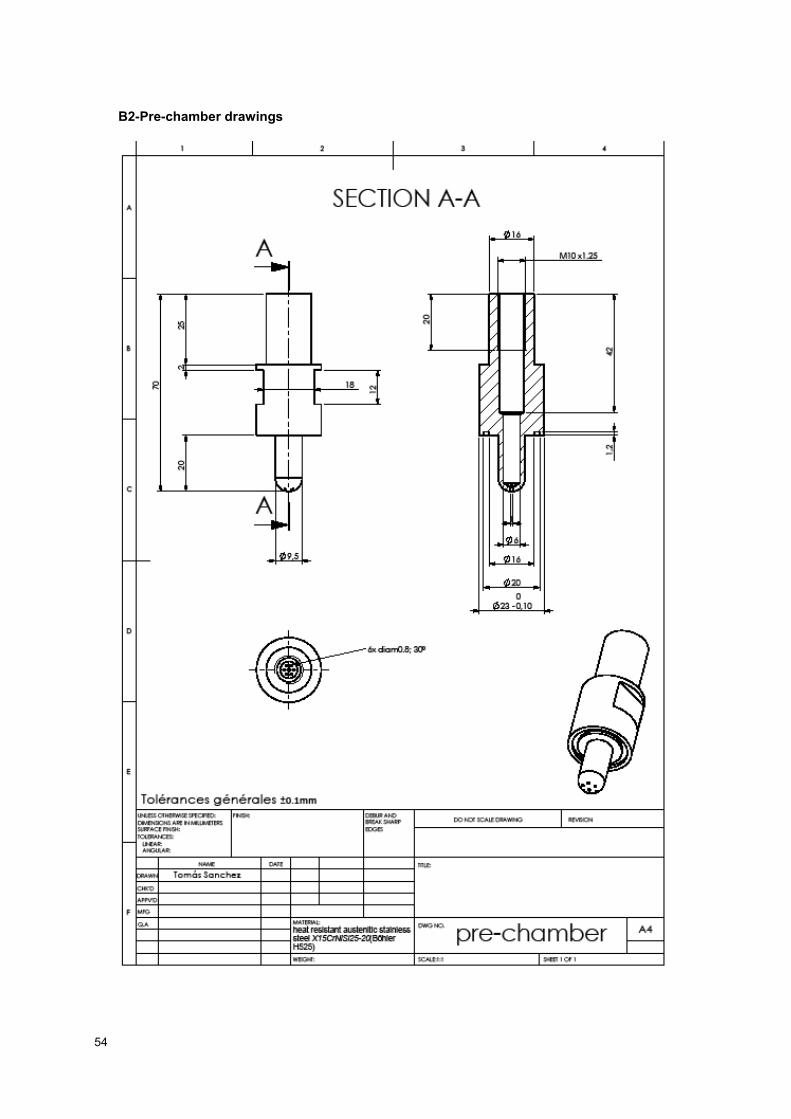
54
B2-Pre-chamber drawings

55

56
0
10
20
30
40
50
60
0 100 200 300 400 500 600 700 800 900 1000
Volume [cm^3]
Pre
ssure
[bar]
T=42ºC
0
10
20
30
40
50
60
0 100 200 300 400 500 600 700 800 900 1000
Volume [cm^3]
Pre
ssure
[bar]
T=50ºC
0
10
20
30
40
50
60
0 100 200 300 400 500 600 700 800 900 1000
Volume [cm^3]
Pre
ssure
[bar]
T=60ºC
0
10
20
30
40
50
60
0 100 200 300 400 500 600 700 800 900 1000
Volume [cm^3]
Pre
ssure
[bar]
T=70ºC
0
10
20
30
40
50
60
0 100 200 300 400 500 600 700 800 900 1000
Volume [cm^3]
Pre
ssure
[bar]
T=80ºC
Appendix C
Results: Plots and Tabulated Results
As all the plotted figures shown in Chapter 5 are obtained through the P-V diagram, for all the
experiments, the P-V diagram is the only figure shown.
C1-Fuel tank temperature variation

57
Speed
Gamma
CR
Fuel T
ank Temperature
COVTHR
<Q5%>
<Q50%>
<Q90%>
∆comb
Pmax
QMEP
FuelMEP
IMEPgross
IMEPnet
ηi
ηth
ηcomb
ηgas
[RPM]
[---]
[---]
[ºC]
[---]
[ºθ]
[ºθ]
[ºθ]
[ºθ]
[bar]
[bar]
[bar]
[bar]
[bar]
[%]
[%]
[%]
[%]
1500
1.323
13
42
39.74
0.5
7.1
44.9
44.4
49.261
8.949
36.335
5.757
5.192
0.1429
0.643
0.246
0.902
1500
1.313
13
50
39.38
-0.1
5.6
4040.1
52.089
9.122
36.335
5.853
5.282
0.1454
0.642
0.251
0.902
1500
1.321
13
60
38.11
-1.2
4.5
44.2
45.4
53.241
9.025
36.335
5.861
5.293
0.1457
0.649
0.248
0.903
1500
1.331
13
70
38.07
-1.5
3.9
35.5
37
54.277
8.940
36.335
5.890
5.323
0.1465
0.659
0.246
0.904
1500
1.319
13
80
39.06
-0.8
4.9
35.2
36
53.446
9.205
36.335
5.945
5.380
0.1481
0.646
0.253
0.905
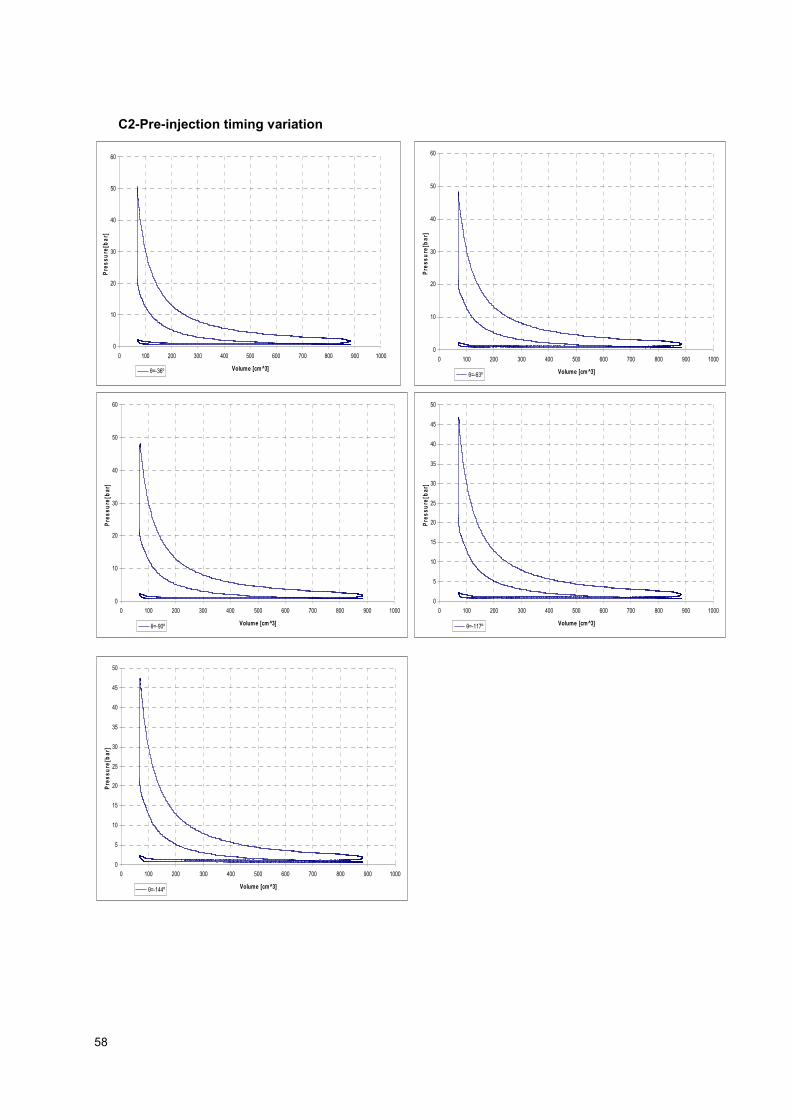
58
0
10
20
30
40
50
60
0 100 200 300 400 500 600 700 800 900 1000
Volume [cm^3]
Pre
ssure
[bar]
θ=-36º
0
10
20
30
40
50
60
0 100 200 300 400 500 600 700 800 900 1000
Volume [cm^3]
Pre
ssure
[bar]
θ=-63º
0
5
10
15
20
25
30
35
40
45
50
0 100 200 300 400 500 600 700 800 900 1000
Volume [cm^3]
Pre
ssure
[bar]
θ=-117º
0
10
20
30
40
50
60
0 100 200 300 400 500 600 700 800 900 1000
Volume [cm^3]
Pre
ssure
[bar]
θ=-90º
0
5
10
15
20
25
30
35
40
45
50
0 100 200 300 400 500 600 700 800 900 1000
Volume [cm^3]
Pre
ssure
[bar]
θ=-144º
C2-Pre-injection timing variation

59
Speed
Gamma
CR
φ1
λCOVTHR
<Q5%>
<Q50%>
<Q90%>
∆comb
Pmax
QMEP
FuelMEP
IMEPgross
IMEPnet
ηi
ηth
ηcomb
ηgas
[RPM]
[---]
[---]
[ºCA]
[---]
[---]
[ºθ]
[ºθ]
[ºθ]
[ºθ]
[bar]
[bar]
[bar]
[bar]
[bar]
[%]
[%]
[%]
[%]
1500
1.338
13
-36
0.960
33.86
-0.8
1.5
56.5
57.3
50.539
8.923
40.289
5.042
4.594
0.1140
0.565
0.221
0.911
1500
1.292
13
-63
0.97
35.70
-0.6
2.7
52.2
52.8
48.324
9.657
40.289
5.009
4.563
0.1133
0.519
0.240
0.911
1500
1.275
13
-90
1.00
36.61
-0.1
2.9
49.5
49.6
48.246
9.925
40.289
4.984
4.540
0.1127
0.502
0.246
0.911
1500
1.291
13
-117
1.01
36.23
0.3
3.1
52.3
52
46.760
9.305
40.289
4.848
4.409
0.1094
0.521
0.231
0.909
1500
1.301
13
-144
1.03
36.11
0.2
2.9
50.3
50.1
47.424
9.283
40.289
4.889
4.449
0.1104
0.527
0.230
0.910
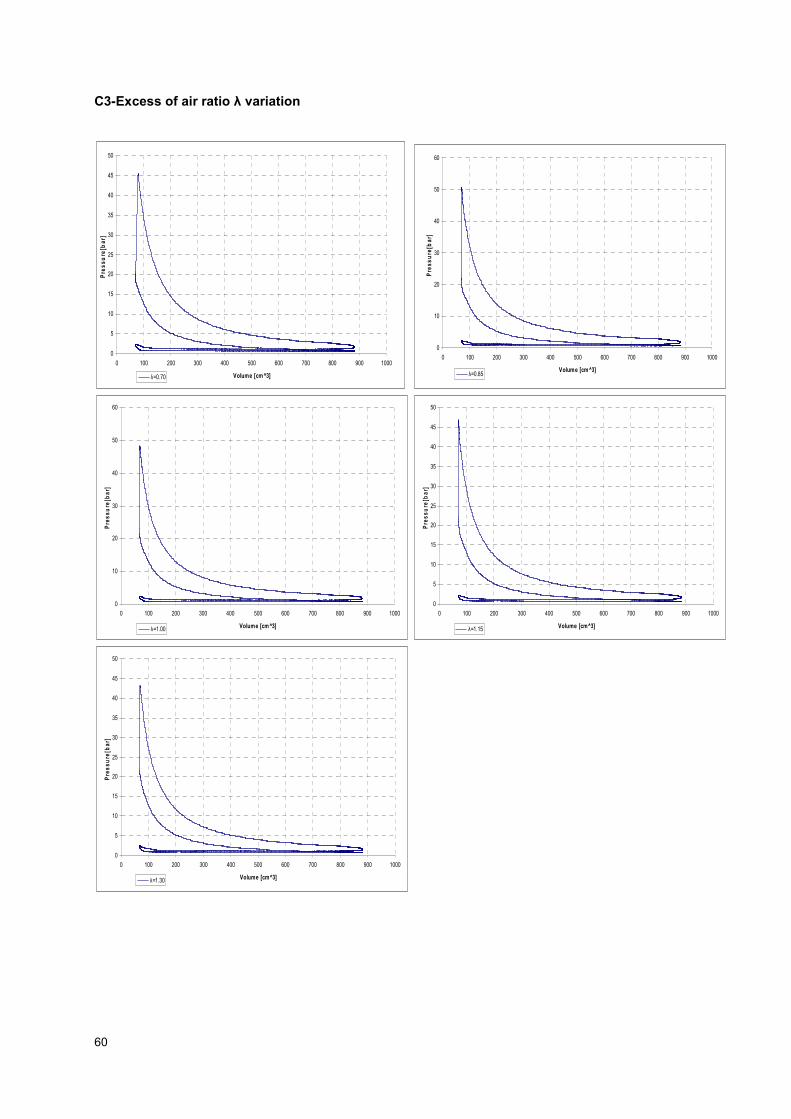
60
0
5
10
15
20
25
30
35
40
45
50
0 100 200 300 400 500 600 700 800 900 1000
Volume [cm^3]
Pre
ssure
[bar]
λ=0.70
0
10
20
30
40
50
60
0 100 200 300 400 500 600 700 800 900 1000
Volume [cm^3]
Pre
ssure
[bar]
λ=0.85
0
10
20
30
40
50
60
0 100 200 300 400 500 600 700 800 900 1000
Volume [cm^3]
Pre
ssure
[bar]
λ=1.00
0
5
10
15
20
25
30
35
40
45
50
0 100 200 300 400 500 600 700 800 900 1000
Volume [cm^3]
Pre
ssure
[bar]
λ=1.15
0
5
10
15
20
25
30
35
40
45
50
0 100 200 300 400 500 600 700 800 900 1000
Volume [cm^3]
Pre
ssure
[bar]
λ=1.30
C3-Excess of air ratio λ variation

61
File name
Speed
Gamma
CR
λCOVTHR
<Q5%>
<Q50%>
<Q90%>
∆comb
Pmax
QMEP
FuelMEP
IMEPgross
IMEPnet
ηi
ηth
ηcomb
ηgas
[---]
[RPM]
[---]
[---]
[---]
[---]
[ºθ]
[ºθ]
[ºθ]
[ºθ]
[bar]
[bar]
[bar]
[bar]
[bar]
[%]
[%]
[%]
[%]
CR13_039
1500
1.314
13
0.7
42.93
3.6
9.2
31.6
28
45.52
10.78
67.69
5.47
5.03
0.0743
0.5074
0.1593
0.9194
CR13_040
1500
1.296
13
0.85
36.58
03.1
47.5
47.5
50.73
10.50
50.28
5.37
4.93
0.0980
0.5113
0.2088
0.9175
CR13_041
1500
1.293
13
134.85
-0.5
2.2
54.7
55.2
48.36
9.53
40.29
4.88
4.44
0.1103
0.5123
0.2366
0.9098
CR13_042
1500
1.292
13
1.15
35.14
-0.5
1.9
53.2
53.7
46.95
8.70
33.52
4.58
4.14
0.1236
0.5261
0.2596
0.9053
CR13_043
1500
1.289
13
1.3
35.92
-0.6
2.4
49.1
49.7
43.20
7.91
30.62
4.13
3.70
0.1207
0.5215
0.2584
0.8956
SI

62
0
5
10
15
20
25
30
35
40
0 100 200 300 400 500 600 700 800 900 1000
Volume [cm^3]
Pre
ssure
[bar]
λ=0.65
0
5
10
15
20
25
30
35
40
0 100 200 300 400 500 600 700 800 900 1000
Volume [cm^3]
Pre
ssure
[bar]
λ=0.70
0
5
10
15
20
25
30
35
40
45
50
0 100 200 300 400 500 600 700 800 900 1000
Volume [cm^3]
Pre
ssure
[bar]
λ=0.85
0
5
10
15
20
25
30
35
40
45
50
0 100 200 300 400 500 600 700 800 900 1000
Volume [cm^3]
Pre
ssure
[bar]
λ=1.00
0
5
10
15
20
25
30
35
40
45
0 100 200 300 400 500 600 700 800 900 1000
Volume [cm^3]
Pre
ssure
[bar]
λ=1.15
0
5
10
15
20
25
30
35
40
45
0 100 200 300 400 500 600 700 800 900 1000
Volume [cm^3]
Pre
ssure
[bar]
λ=1.30
C4-Excess of air ratio λ variation (Pre-chamber)
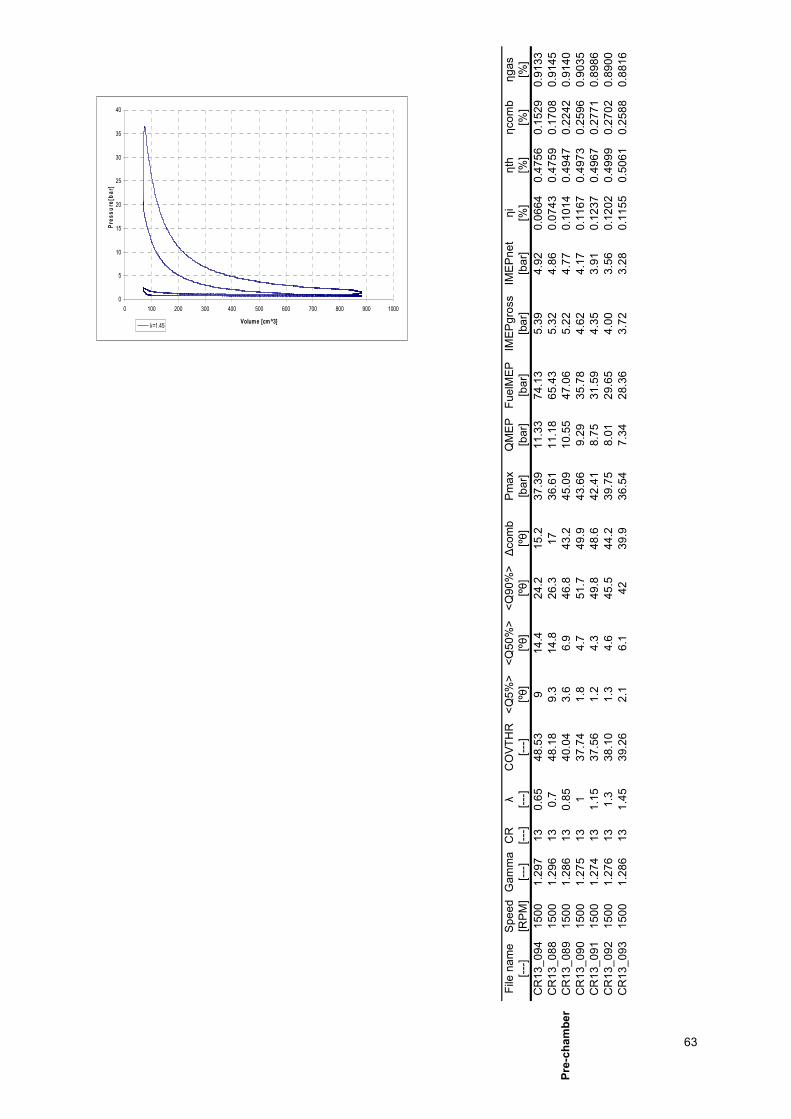
63
0
5
10
15
20
25
30
35
40
0 100 200 300 400 500 600 700 800 900 1000
Volume [cm^3]
Pre
ssure
[bar]
λ=1.45
File name
Speed
Gamma
CR
λCOVTHR
<Q5%>
<Q50%>
<Q90%>
∆comb
Pmax
QMEP
FuelMEP
IMEPgross
IMEPnet
ηi
ηth
ηcomb
ηgas
[---]
[RPM]
[---]
[---]
[---]
[---]
[ºθ]
[ºθ]
[ºθ]
[ºθ]
[bar]
[bar]
[bar]
[bar]
[bar]
[%]
[%]
[%]
[%]
CR13_094
1500
1.297
13
0.65
48.53
914.4
24.2
15.2
37.39
11.33
74.13
5.39
4.92
0.0664
0.4756
0.1529
0.9133
CR13_088
1500
1.296
13
0.7
48.18
9.3
14.8
26.3
17
36.61
11.18
65.43
5.32
4.86
0.0743
0.4759
0.1708
0.9145
CR13_089
1500
1.286
13
0.85
40.04
3.6
6.9
46.8
43.2
45.09
10.55
47.06
5.22
4.77
0.1014
0.4947
0.2242
0.9140
CR13_090
1500
1.275
13
137.74
1.8
4.7
51.7
49.9
43.66
9.29
35.78
4.62
4.17
0.1167
0.4973
0.2596
0.9035
CR13_091
1500
1.274
13
1.15
37.56
1.2
4.3
49.8
48.6
42.41
8.75
31.59
4.35
3.91
0.1237
0.4967
0.2771
0.8986
CR13_092
1500
1.276
13
1.3
38.10
1.3
4.6
45.5
44.2
39.75
8.01
29.65
4.00
3.56
0.1202
0.4999
0.2702
0.8900
CR13_093
1500
1.286
13
1.45
39.26
2.1
6.1
42
39.9
36.54
7.34
28.36
3.72
3.28
0.1155
0.5061
0.2588
0.8816
Pre-chamber