Experimental Design Presentation for Web -...
50
Experimental Design Presentation Presented by Jim Patrie MS Department of Health Evaluation Sciences Division of Biostatistics and Epidemiology University of Virginia Charlottesville, VA email [email protected]
Transcript of Experimental Design Presentation for Web -...
Experimental DesignPresentation
Presented byJim Patrie MS
Department of Health Evaluation SciencesDivision of Biostatistics and Epidemiology
University of VirginiaCharlottesville, VA
email [email protected]
Presentation Outline
I ) Background Information.
• randomized experiments. • randomized comparative experiments. • observational comparative experiments.
II) Experimental Design Terminology.
• Experimental Unit. • Replications. • Treatments. • Factors • Factor Levels. • Fix Factors • Random Factors.
III) The Three Major Components of Experimental Design.
• Treatment Structure. • Design Structure. • Randomization.
IV) Examples of Commonly Utilized Experimental Designs
• Single Factor Design • Factorial Design. • Randomized Complete Block Design. • Latin Square Design. • Split Plot Design
+Treatment and Design Structure Layout, Statistical Model, ANOVA Table, and a Typically Analysis Summary.
V) Sample Size Estimation. • Information required to determine samples size. • Sample size formula for a two sample comparison of means. VI) Multiple Comparison Adjustment.
• Controlling Type I error rate. VII) Experimental Design Check List.
VIII) Listing of Useful Introductory and Intermediate Text Books on Experimental Design.
Introduction
The goal of any randomized experiment is to arrive at a clear answer to the question(s) of interest while expending a minimumamount of resources.
The goal of experimental design is to attain maximum information,precision, and accuracy in the results by efficiently utilizing existingresources.
When selecting an experimental design, first and foremost base yourchoice of design on those designs that will allow you to address yourresearch questions of interest. Having clearly defined objectives isof paramount importance to appropriate design selection.
Randomized Experiments (I)
A randomized experiment is typically conducted for one or more of the following reasons:
• to compare the response achieved at different settings of the controllable variables*.
• to determine the principle cause of variation in a measured response.
• to find the conditions that give rise to maximum or minimum response.
• to obtain a mathematical model in order to predict future response.
Randomized Comparative Experiment
The distinguishing features of a randomized comparative experiment include the following:
• conditions are controlled and manipulated by the investigator.
• treatments are assigned at random to the experimental units.
• confounding by non-experimental factors is controlled by the randomization process.
• inferential cause and effect relationships can be inferred.
Observational Comparative Study
The distinguishing features of an observational comparative study include the following:
• conditions influencing the response are not under the control of the investigator.
• exposure or treatment is not assigned at random to the observational units.
• associations between exposure and outcome may result from confounding by factors associated with exposure and outcome. • inferential cause and effect relationships cannot be inferred.
Experimental Design Terminology (II)
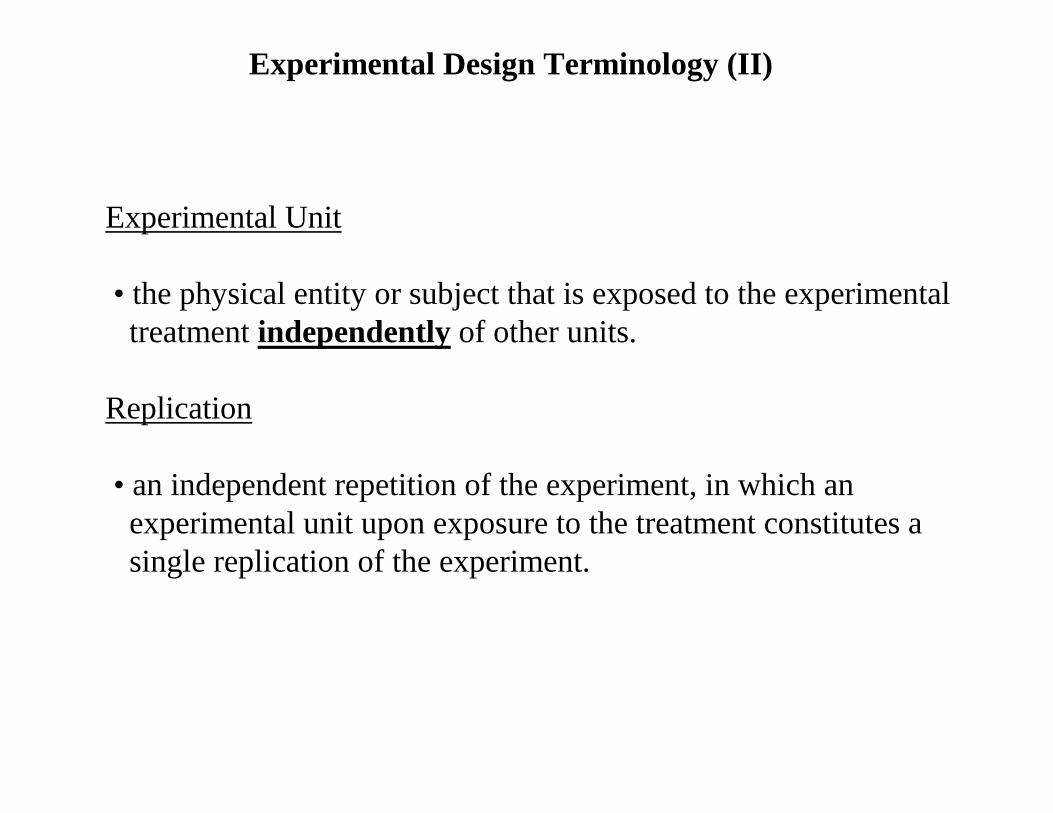
Experimental Unit
• the physical entity or subject that is exposed to the experimental treatment independently of other units.
Replication
• an independent repetition of the experiment, in which an experimental unit upon exposure to the treatment constitutes a single replication of the experiment.
Treatment
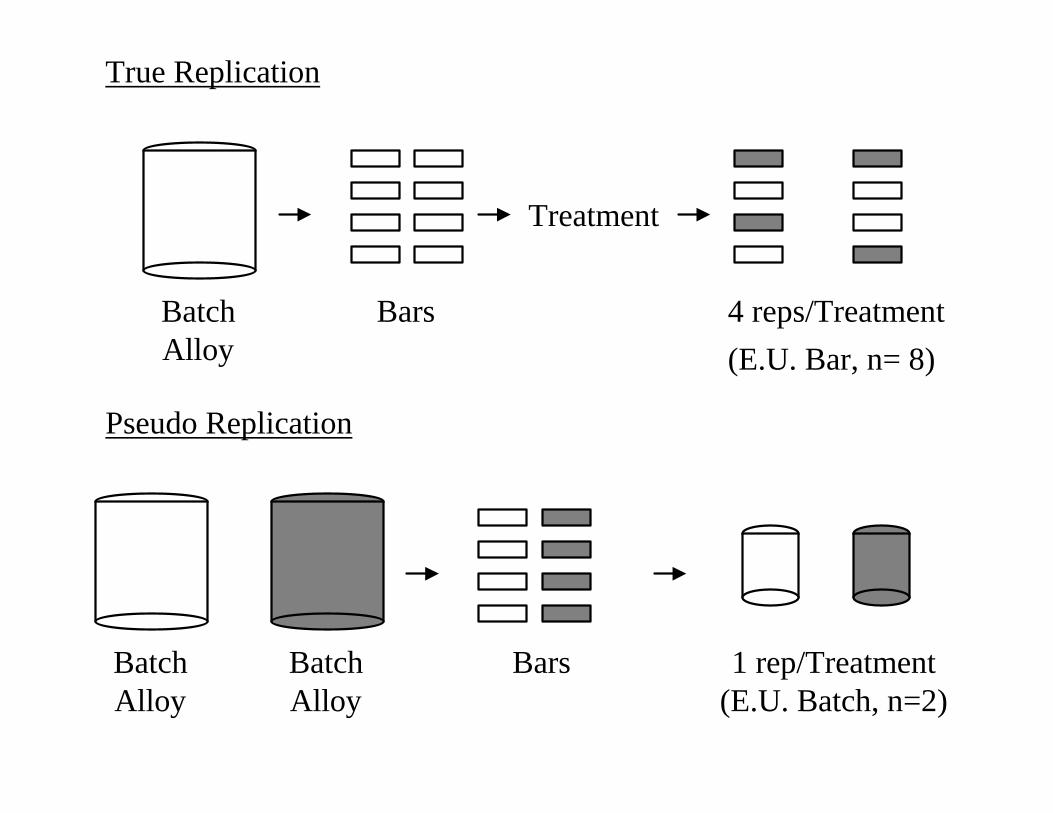
BatchAlloy
Bars
BatchAlloy
True Replication
Pseudo Replication
Bars 1 rep/Treatment(E.U. Batch, n=2)
4 reps/Treatment(E.U. Bar, n= 8)
BatchAlloy
Treatment
• the set of circumstances created for the experiment in response to the research hypotheses.
Factor
• a particular group of treatments (e.g. passenger restrain).
Factor Levels
• the categories of the treatment factor (e.g. seat belt, air bag, seat belt plus air bag).
Fixed Factor
• the levels of the factor are assumed to be fixed (reproducible).
• inference is restricted to those levels of the factor that were included in the studied.
• the parameters of interest are the treatment effects.
Random Factor
• the levels of the factor are assumed to represent a random sample of the potential levels within a well defined population.
• inference is directed to the population.
• the parameters of interest are the variance components.
TreatmentStructure
DesignStructure
Treatment Structure
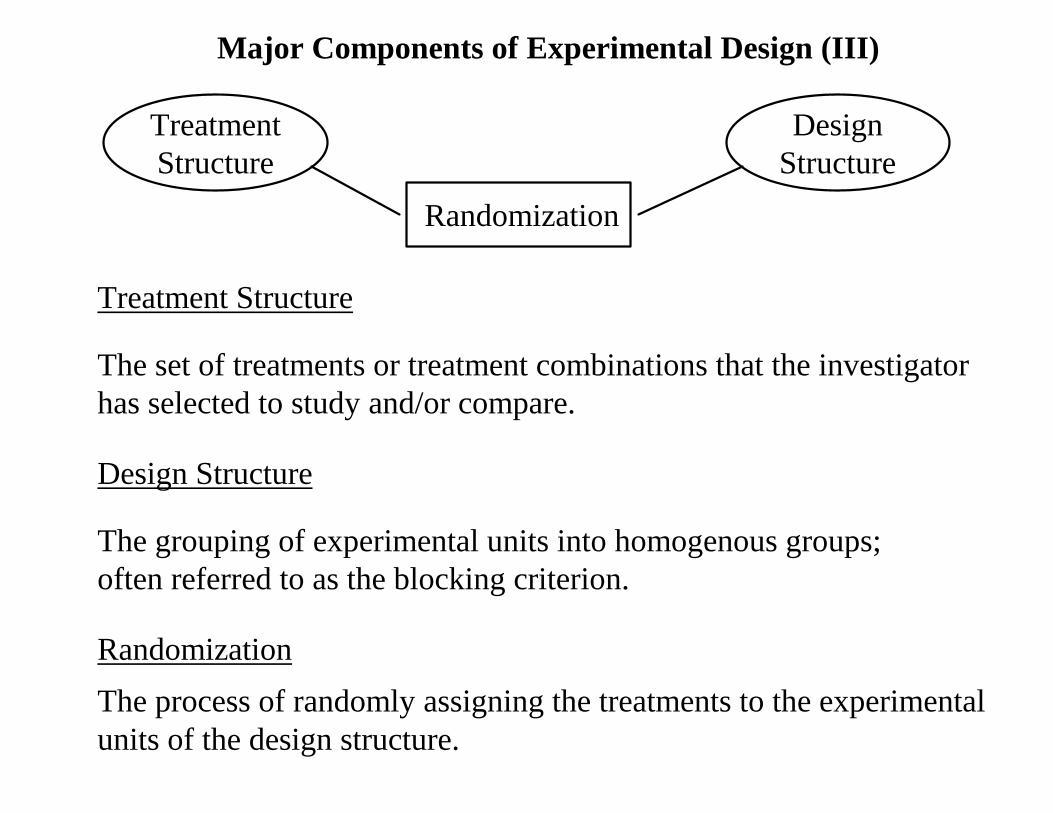
The set of treatments or treatment combinations that the investigator has selected to study and/or compare.
Design Structure
The grouping of experimental units into homogenous groups; often referred to as the blocking criterion.
Randomization
The process of randomly assigning the treatments to the experimentalunits of the design structure.
Major Components of Experimental Design (III)
Randomization
Treatment Structure
• The treatment structure should be dictated by the research hypotheses, and constructed based on those factors to be compared as measured by their effect on the given response variable.
• The treatment structure can be a set of individual treatments, referred to as a one-way treatment structure, or a set of treatment combinations, referred to as a factorial treatment structure.
• The treatment structure can also be a hierarchical arrangement involving multiple size experiment units, in which the treatment levels of one or more factors occur within the levels of one or more of the remaining factors.
Design Structure
• The design structure of an experiment involves the grouping of experimental units such that the variability of the units within the groups is less than that among all units prior to grouping. The goal is to group the experimental units in such a way that the conditions under which the treatments are observed are as uniformed as possible.
• The design structure can range from a completely randomized design structure with no blocking criterion, to design structure which include multiple blocking criteria.
Randomization
• Randomization is the link between the treatment structure and the design structure.
• Randomization is the process of randomly assigning the treatments of the treatment structure to the experimental units of the design structure.
• Randomization functions to prevent systematic and personal biases from being introduced into the experiment.
• Randomization also functions to provide a valid estimate of error variance for justifiable statistical inference.
Experimental Designs Commonly Utilized In the Engineering Sciences (IV)
• Single Factor Designs • Factorial and Fractional Factorial Designs
• Randomized Block and Incomplete Block Designs
• Latin Square Designs
• Split Plot Designs
• Response Surface Designs
• Single Factor Design.
• Two Factor Factorial Design.
• Randomized Complete Block Design.
• Latin Square Design.
• Split-Plot Design.
• a description of the study protocol.• a description of the design and treatment structure layout.• a description of the cell means model.• a description of the model assumptions.• presentation of the ANOVA table.• presentation of a typical analysis summary.
II) Design Outline
I ) Designs
Specific Examples
Single-Factor Design
A production development engineer is interested in maximizinga new synthetic fiber that will be used in men’s clothing. The engineer knows from previous experience that the fiber’s strength is affected by the percentage of cotton (c) in the fiber. Furthermore, he suspects that increasing the cotton content will increase the strength, at least initially. The engineer decides to test specimensat 5 levels of cotton percentage: 15 percent, 20 percent, 25 percent, 30 percent, and 35 percent. He also decides to test 5 specimens ateach level. Twenty five machines were randomly selected to be used to produce fiber specimens at the 5 levels of percent cotton. Five machines were randomly assigned to each level. A specimenfrom each machine was selected at random to be evaluated for strength. Example taken from “Design and Analysis of Experiments”. Montgomery, 1991. (Modified for this presentation)
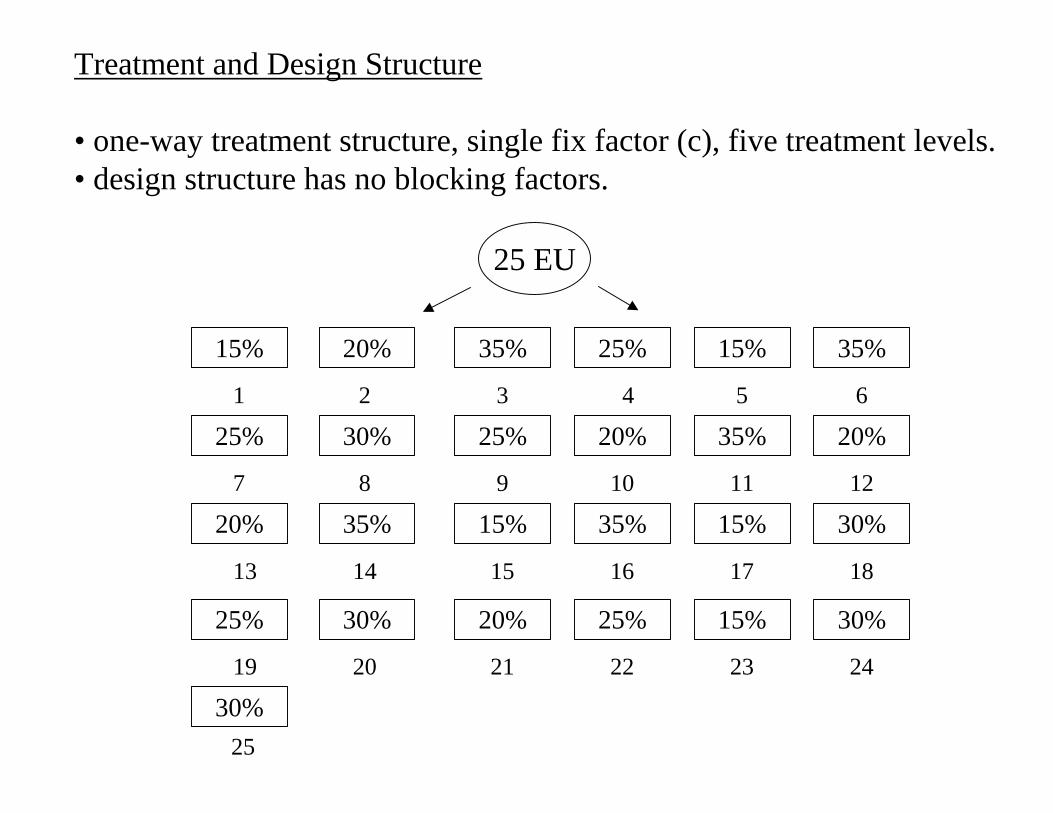
Treatment and Design Structure
• one-way treatment structure, single fix factor (c), five treatment levels.• design structure has no blocking factors.
20% 35%
25%
25%15%
30% 20%
15%
35%
35%
25% 20%
1 2 3 4 5 6
7 8 9 10 11 12
15%35% 35% 15%20% 30%
13 14 15 16 17 18
20%30% 25% 15%25%
19 20 21 22 23 24
30% 25
30%
25 EU
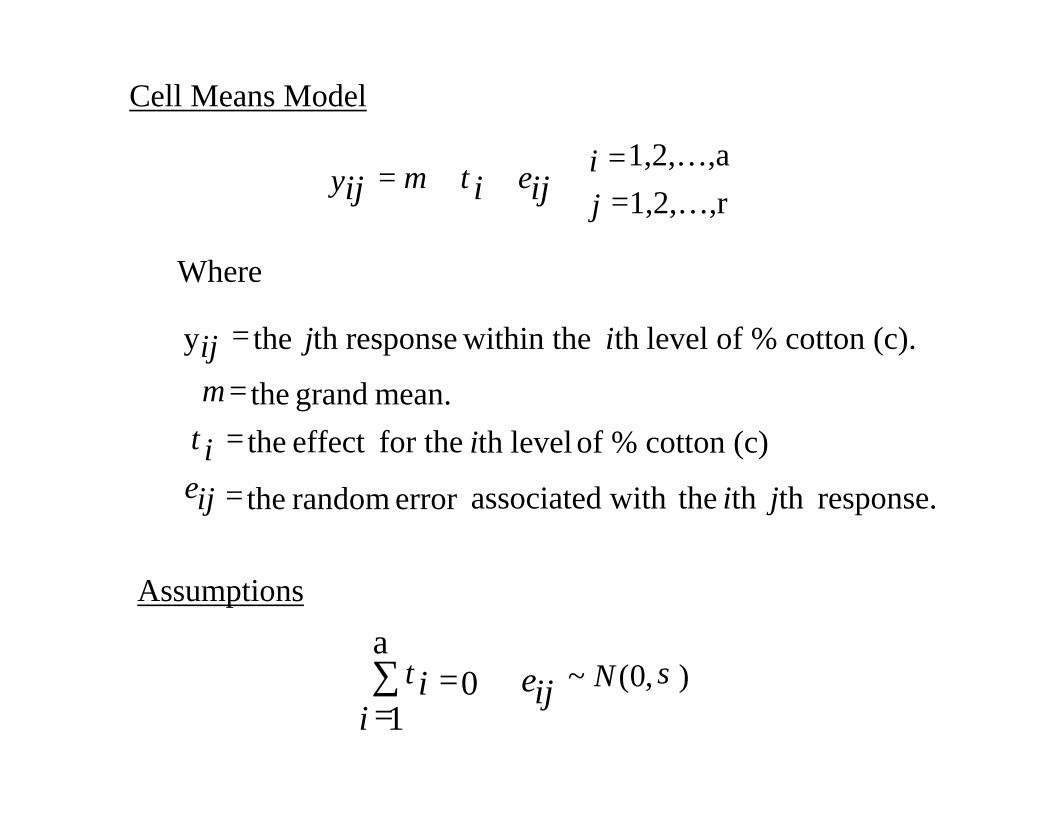
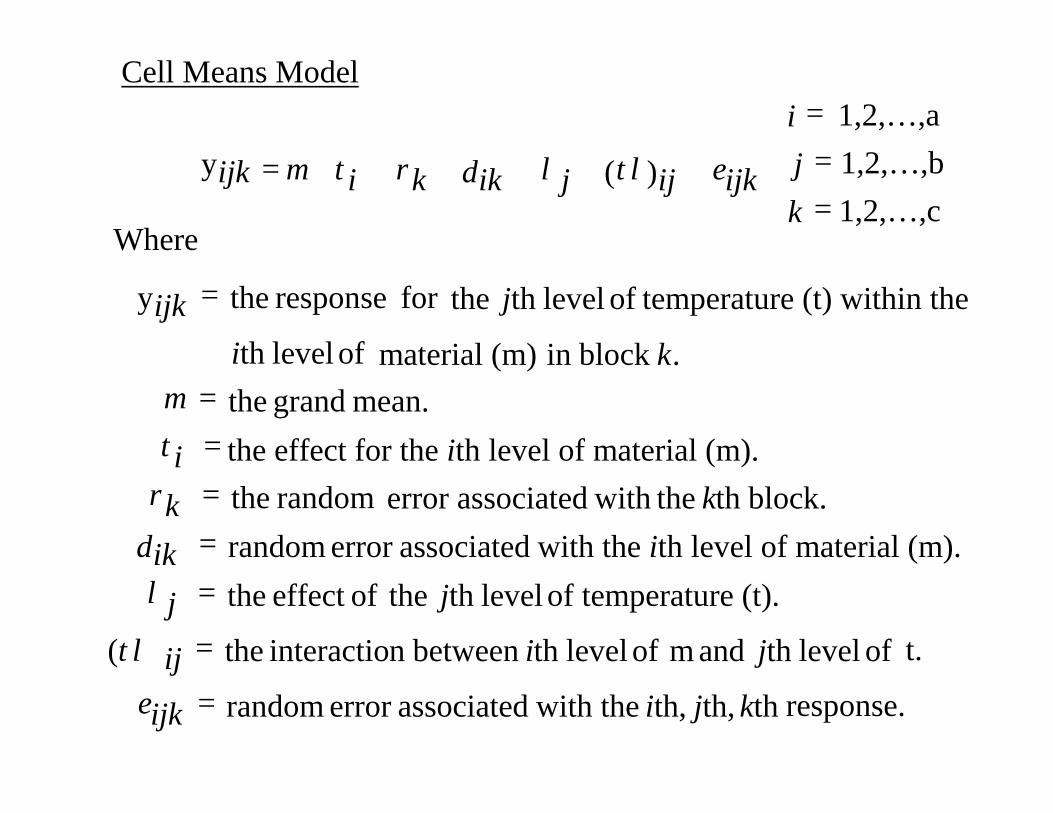
Cell Means Model
==++=
1,2,… ,r 1,2,… ,a
jiy ijiij ετµ
Where
Assumptions
∑=
=a
iiji N
1 0 ),0( ~ στ ε
response.th th theassociated witherror random the
of % cotton (c) levelth for the effect the mean. grand the
level of % cotton (c). th within the responseth the y
jiij
ii
ijij
====
ετµ

ANOVA Table
MSE
MSA
MS
-----
MSA/MSE
F-test
24
20
4
DF Ex
N-1Total
a(r-1)Error
a-1%Cotton
DFSources
••
•
•
•
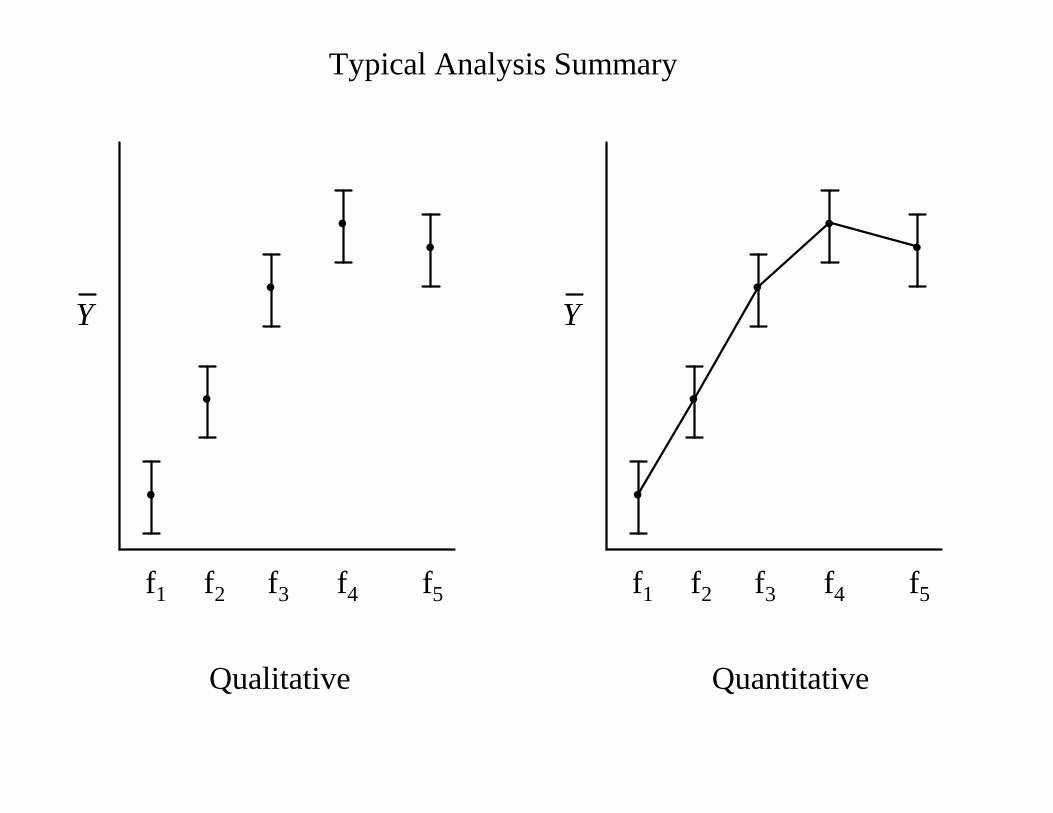
t1 t2 t3 t4 t5
••
•
•
•
t1 t2 t3 t4 t5
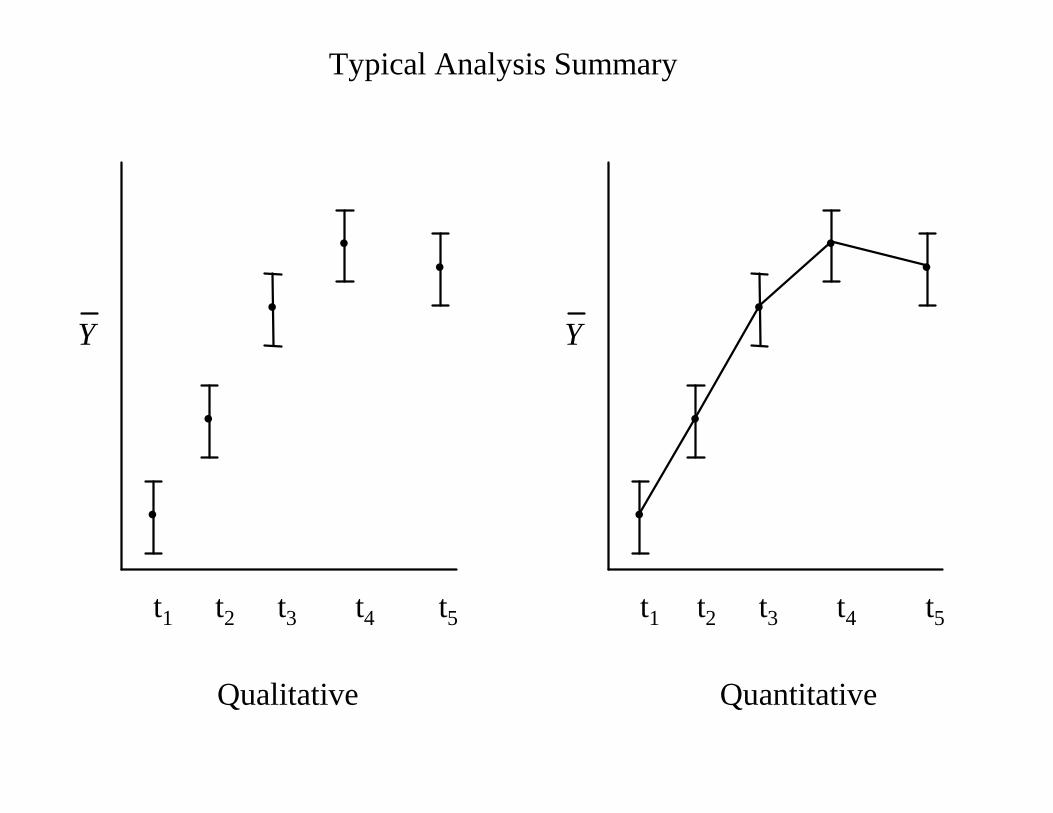
Qualitative Quantitative
Typical Analysis Summary
Y Y
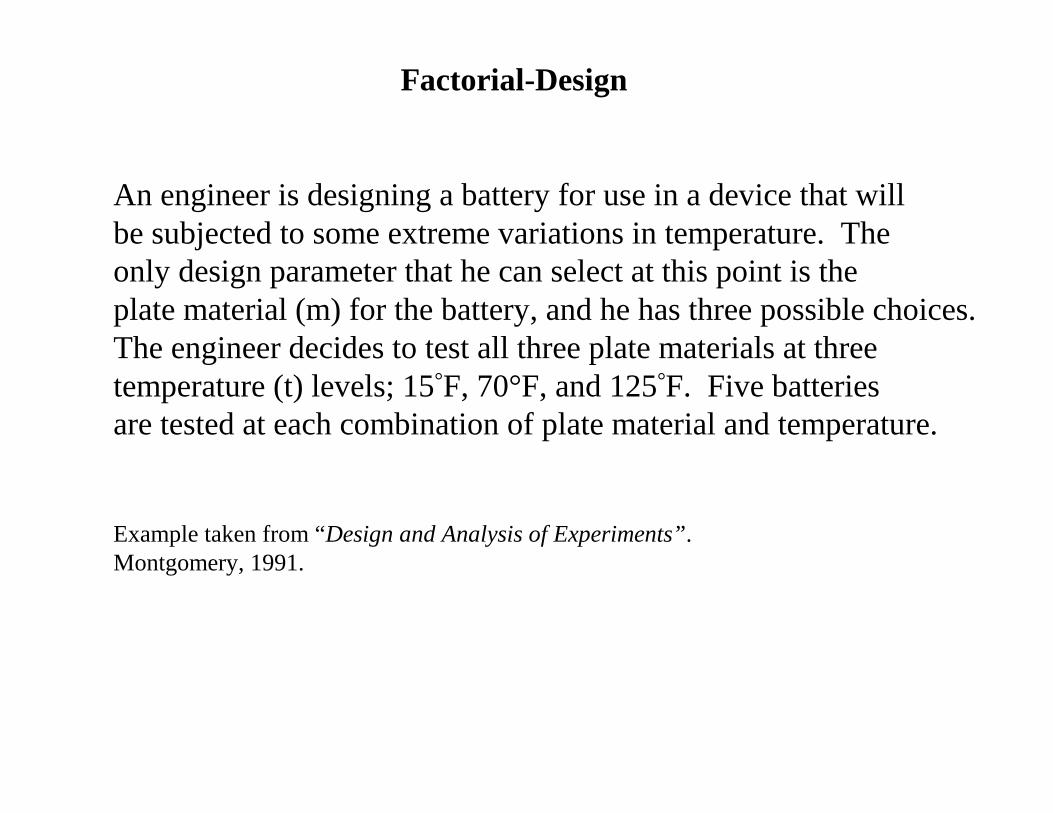
Factorial-Design
An engineer is designing a battery for use in a device that willbe subjected to some extreme variations in temperature. The only design parameter that he can select at this point is the plate material (m) for the battery, and he has three possible choices.The engineer decides to test all three plate materials at three temperature (t) levels; 15°F, 70°F, and 125°F. Five batteries are tested at each combination of plate material and temperature.
Example taken from “Design and Analysis of Experiments”.Montgomery, 1991.
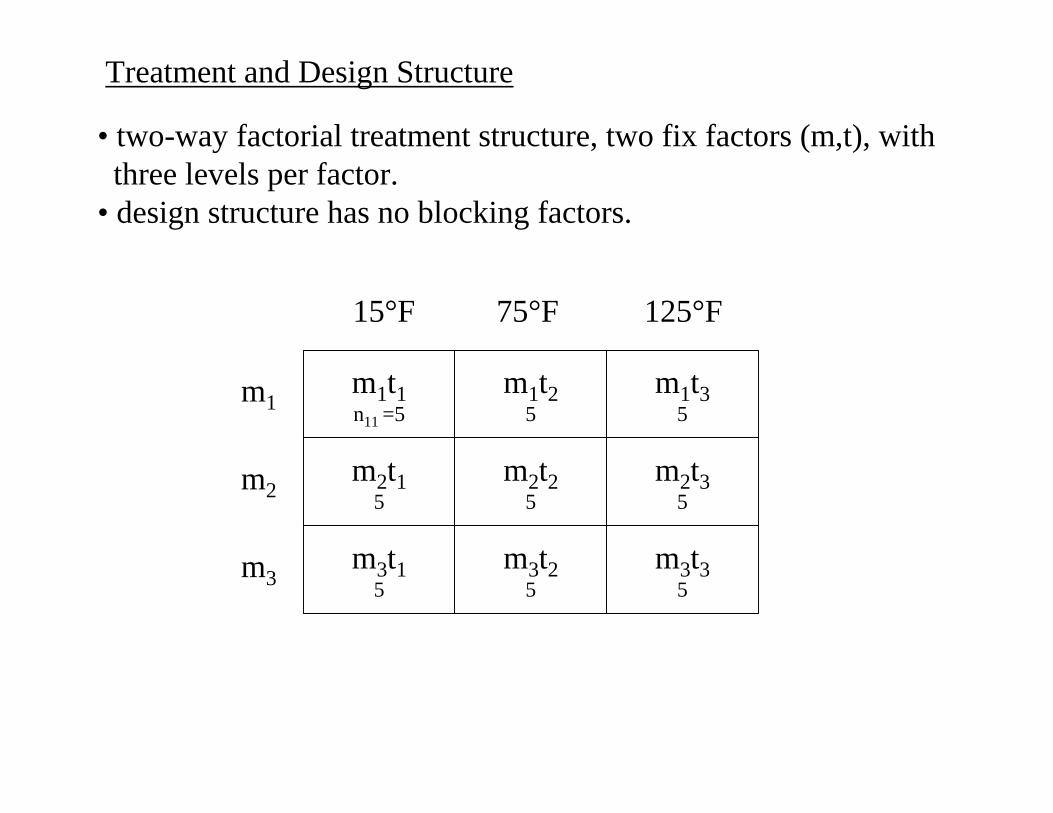
• two-way factorial treatment structure, two fix factors (m,t), with three levels per factor.• design structure has no blocking factors.
m1
m2
m3
15°F
Treatment and Design Structure
m1t1n11 =5
m1t25
m1t35
m2t15
m3t15
m2t25
m3t25
m2t35
m3t35
75°F 125°F
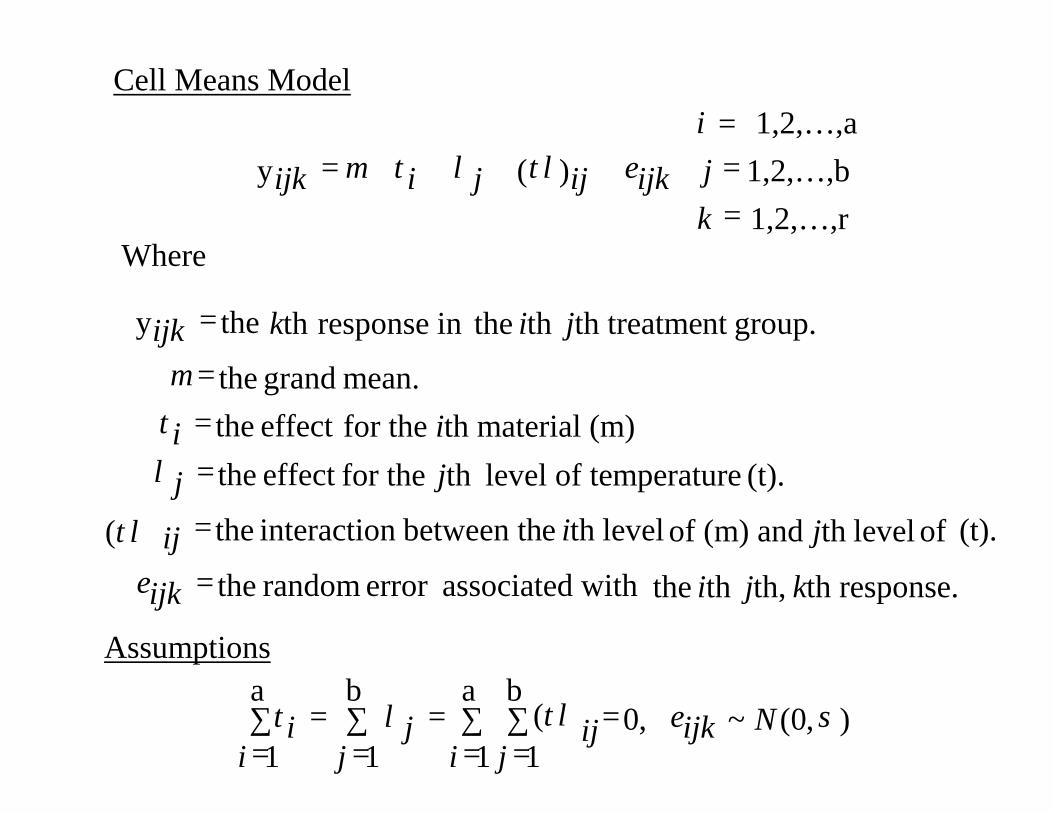
Cell Means Model
===
++++=kji
ijkijji1,2,… ,r 1,2,… ,b 1,2,… ,a
)( ijky ετλλτµ
Where
th response. th,th the associated witherror random the
(t). of levelth of (m) and levelth ebetween thn interactio the
(t). level of temperatureth for theeffect the for the ith material (m) effect the
mean. grand the
group.nt th treatmeth thein responseth the y
kjiijk
jiij
jji
jikijk
======
ε(τλ)
λτµ
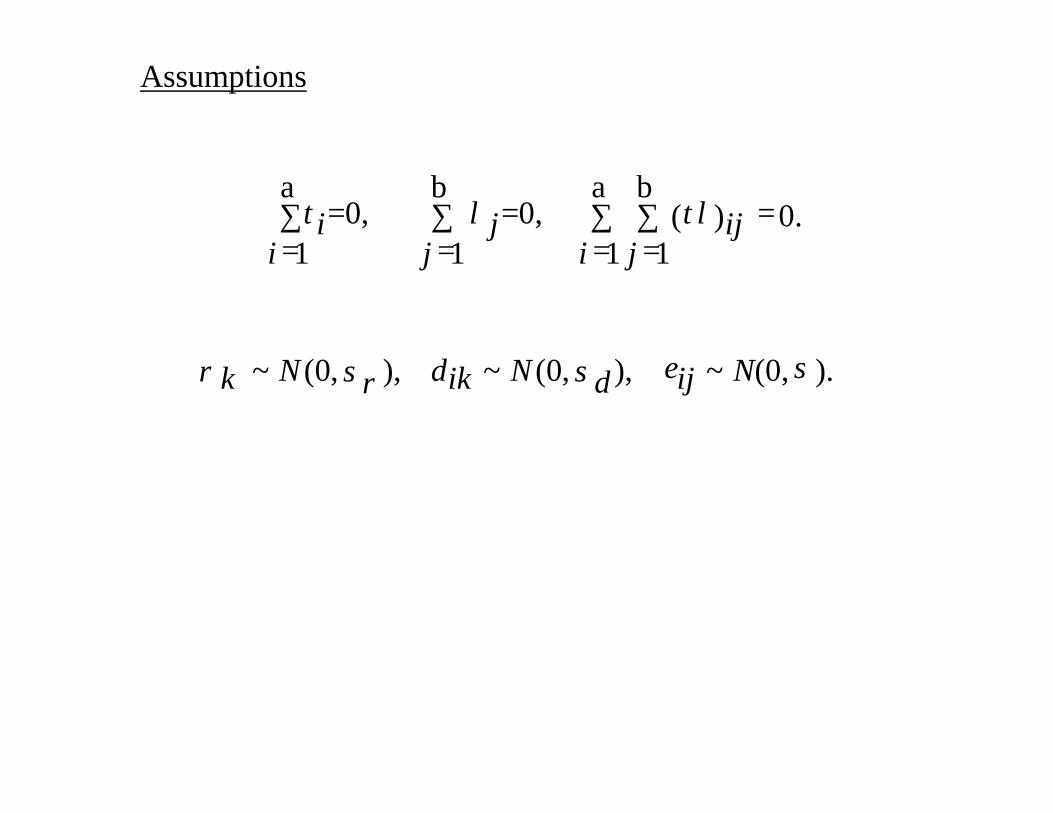
Assumptions
),0(~1 1
,011
σε(τλ)λτ Na
i
b
jijkij
b
jj
a
ii ∑
=∑=
==∑=
=∑=
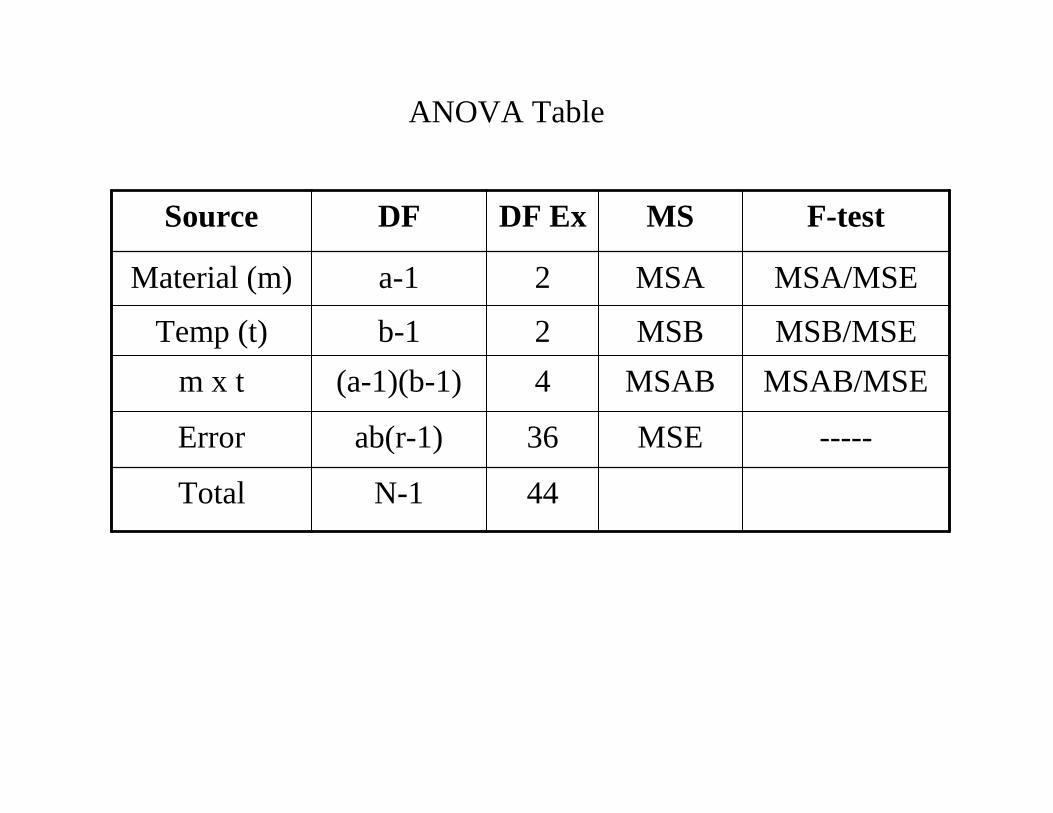
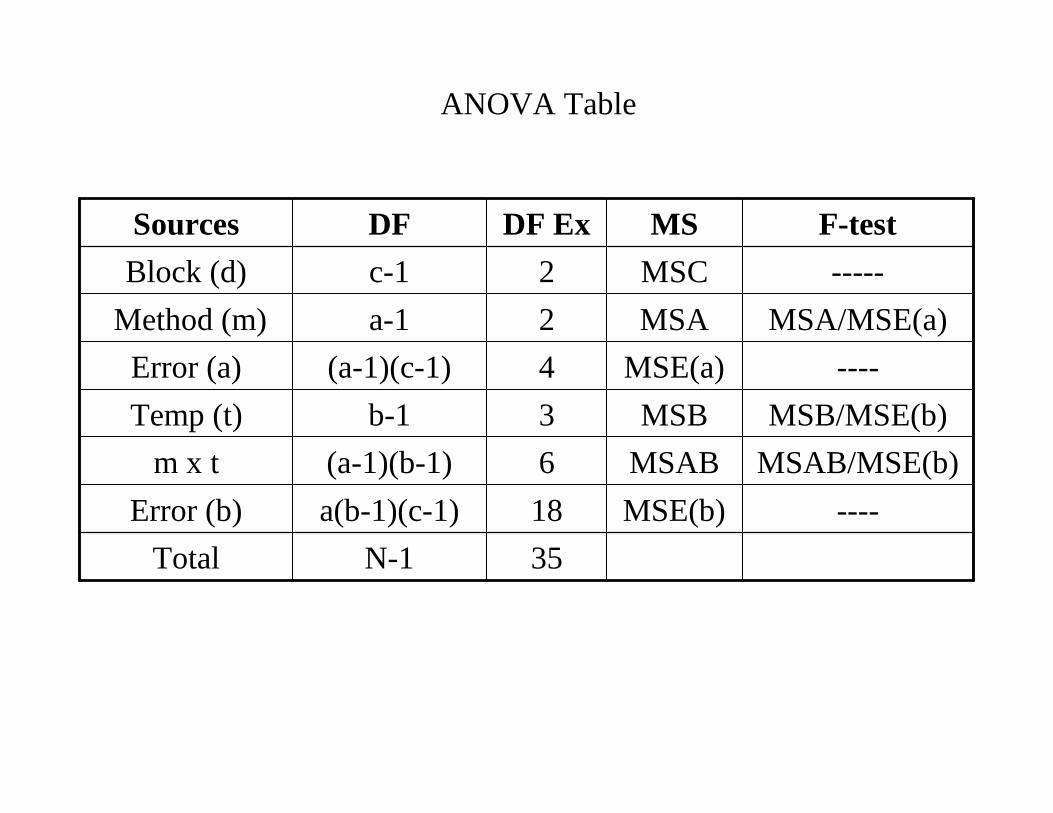
ANOVA Table
44
36
42
2
DF Ex
MSE
MSABMSB
MSA
MS
N-1Total
-----ab(r-1)Error
MSAB/MSE(a-1)(b-1)m x tMSB/MSEb-1Temp (t)
MSA/MSEa-1Material (m)
F-testDFSource
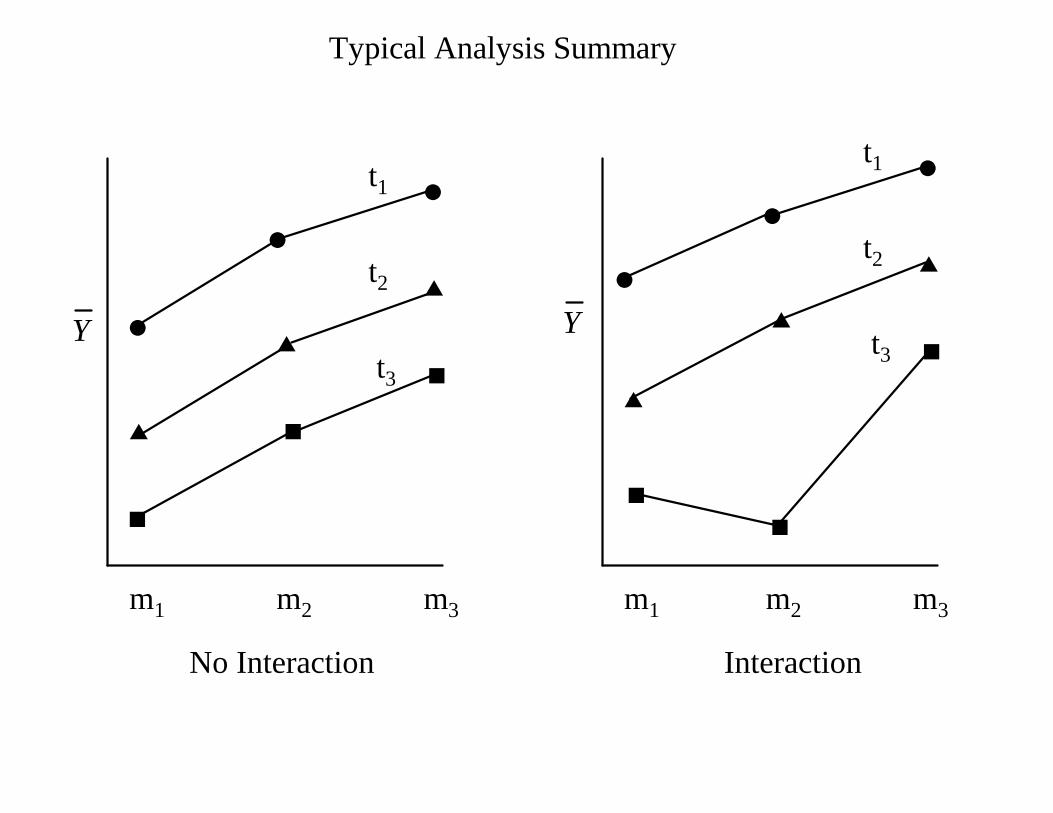
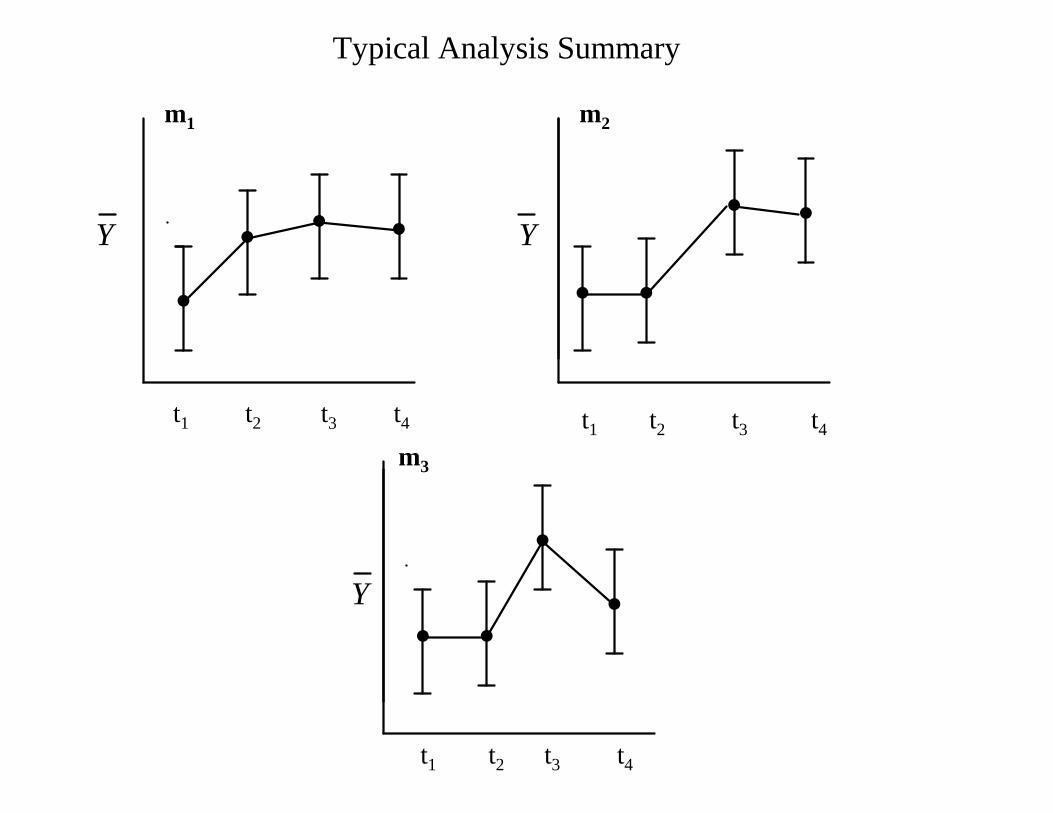
No Interaction Interaction
m1 m2 m3
t1
t2
t3
m1 m2 m3
s
s
s
l
l
l
n
n
n
Typical Analysis Summary
t1
t2
t3
s
s
s
l
l
l
n
nn
Y Y
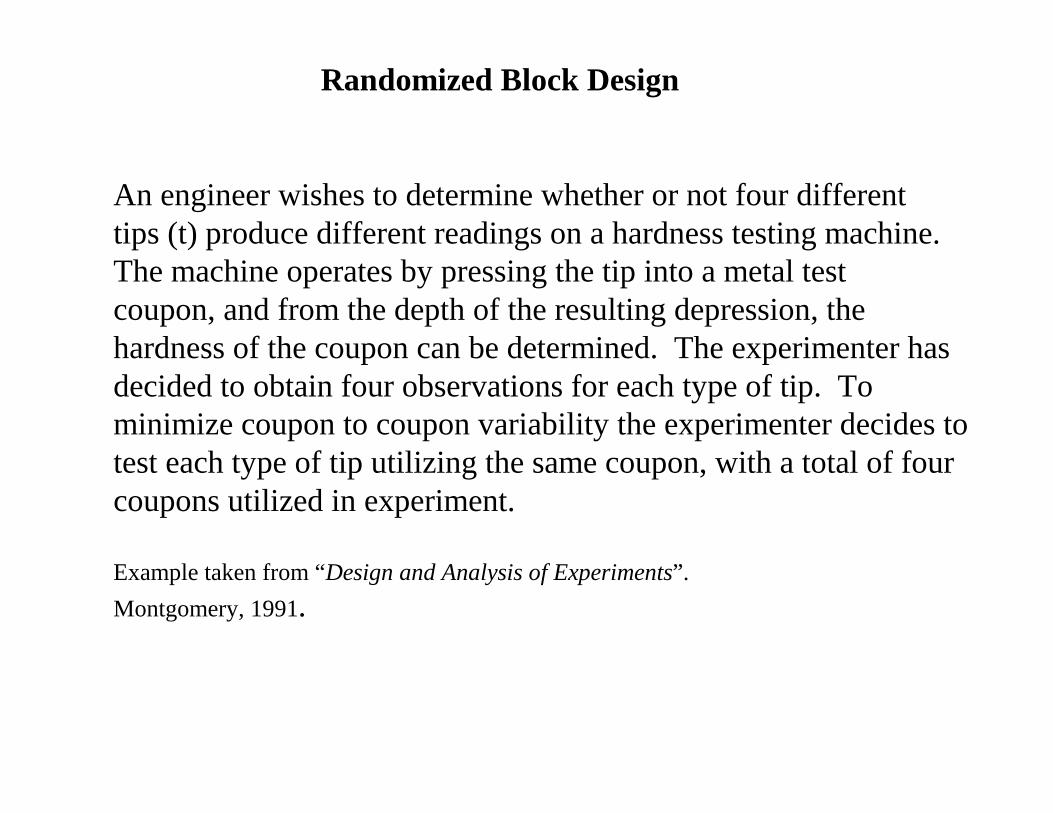
Randomized Block Design
An engineer wishes to determine whether or not four differenttips (t) produce different readings on a hardness testing machine.The machine operates by pressing the tip into a metal test coupon, and from the depth of the resulting depression, the hardness of the coupon can be determined. The experimenter has decided to obtain four observations for each type of tip. To minimize coupon to coupon variability the experimenter decides totest each type of tip utilizing the same coupon, with a total of four coupons utilized in experiment.
Example taken from “Design and Analysis of Experiments”.Montgomery, 1991.
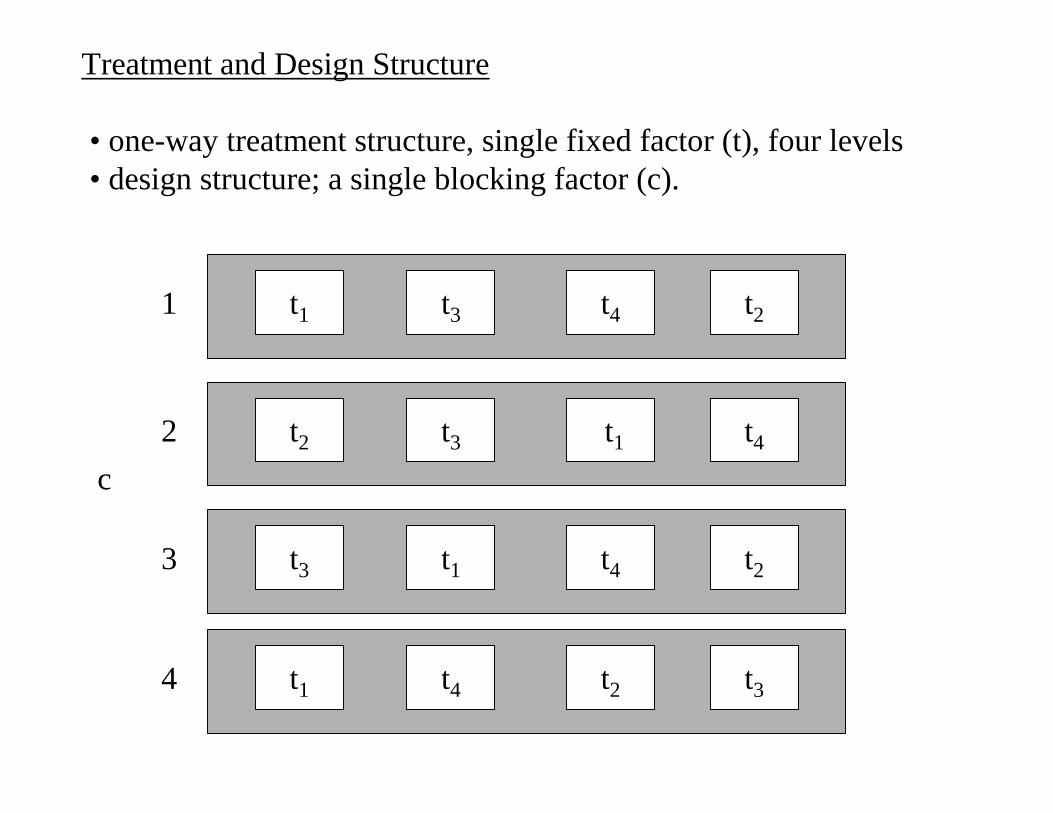
Treatment and Design Structure
• one-way treatment structure, single fixed factor (t), four levels • design structure; a single blocking factor (c).
c
1 t3 t4 t2t1
2 t3 t1 t4t2
3 t1 t4 t2t3
4 t4 t2 t3t1
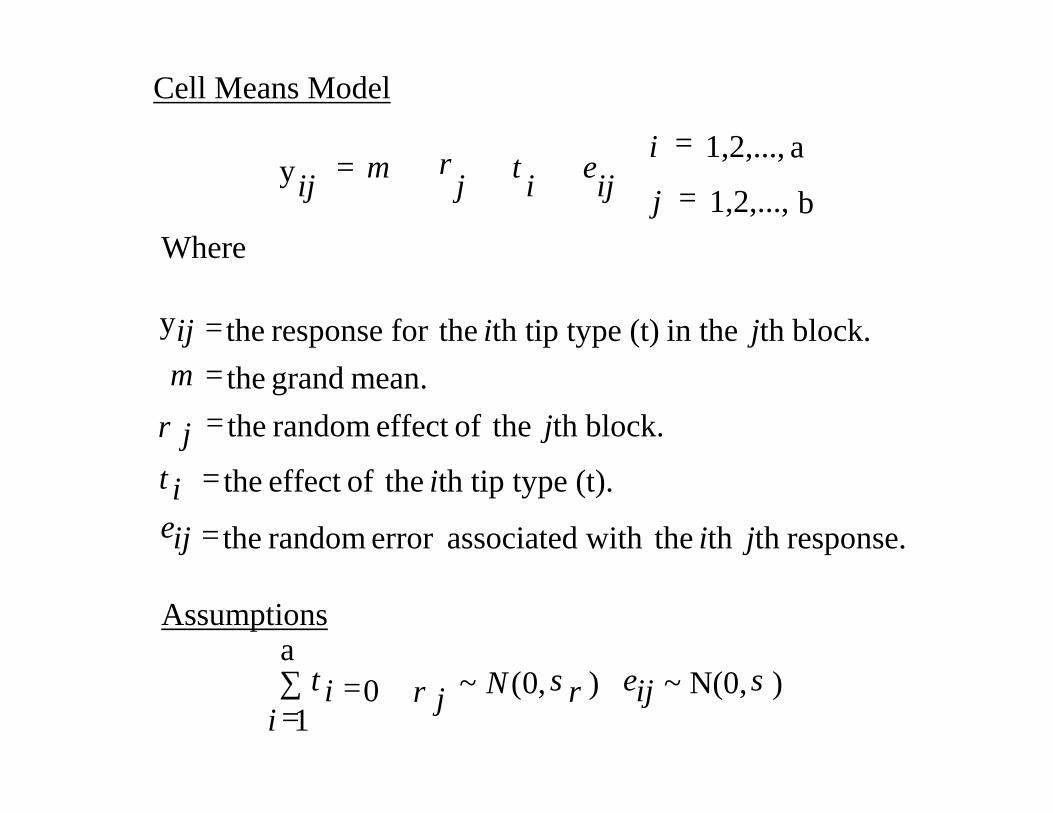
Cell Means Model
Where
==
+++=b1,2,...,
a1,2,..., ρyj
iijijij ετµ
Assumptions
)N(0, ~ ),0(~1
ρ 0 σεστ ijρNa
iji∑
==
response.th th the associated witherror random the
ith tip type (t). theofeffect the
block.th theofeffect random themean. grand the
block.th in the th tip type (t) thefor response the y
jiiji
jjρ
jiij
=====
ετ
µ
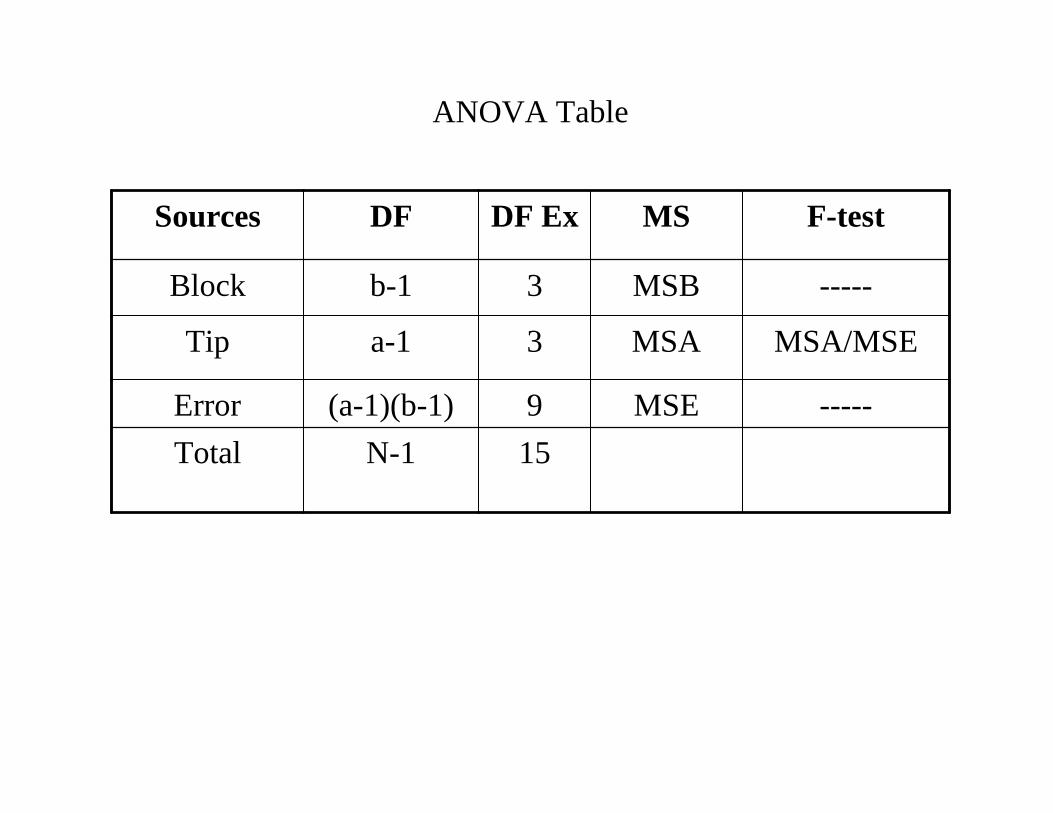
ANOVA Table
159
3
3
DF Ex
MSE
MSA
MSB
MS
N-1Total-----(a-1)(b-1)Error
MSA/MSEa-1Tip
-----b-1Block
F-testDFSources
••
•
•
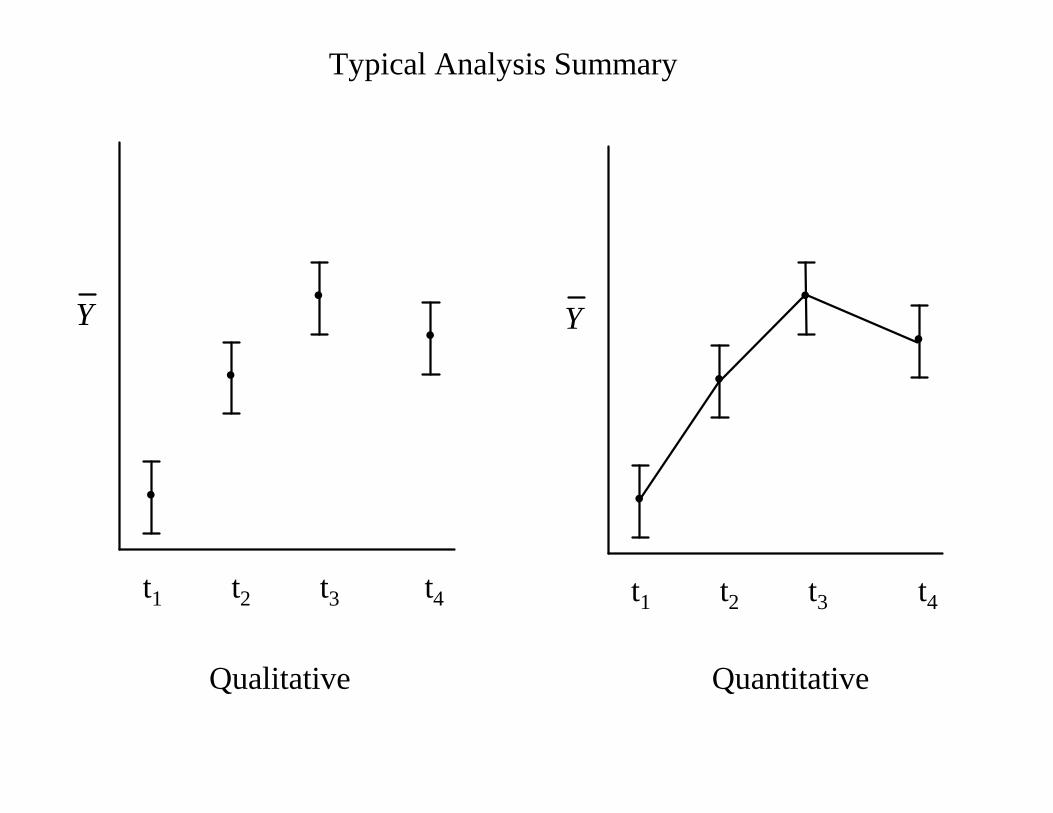
t1 t2 t3 t4
Qualitative Quantitative
Typical Analysis Summary
Y•
•
•
•
t1 t2 t3 t4
Y
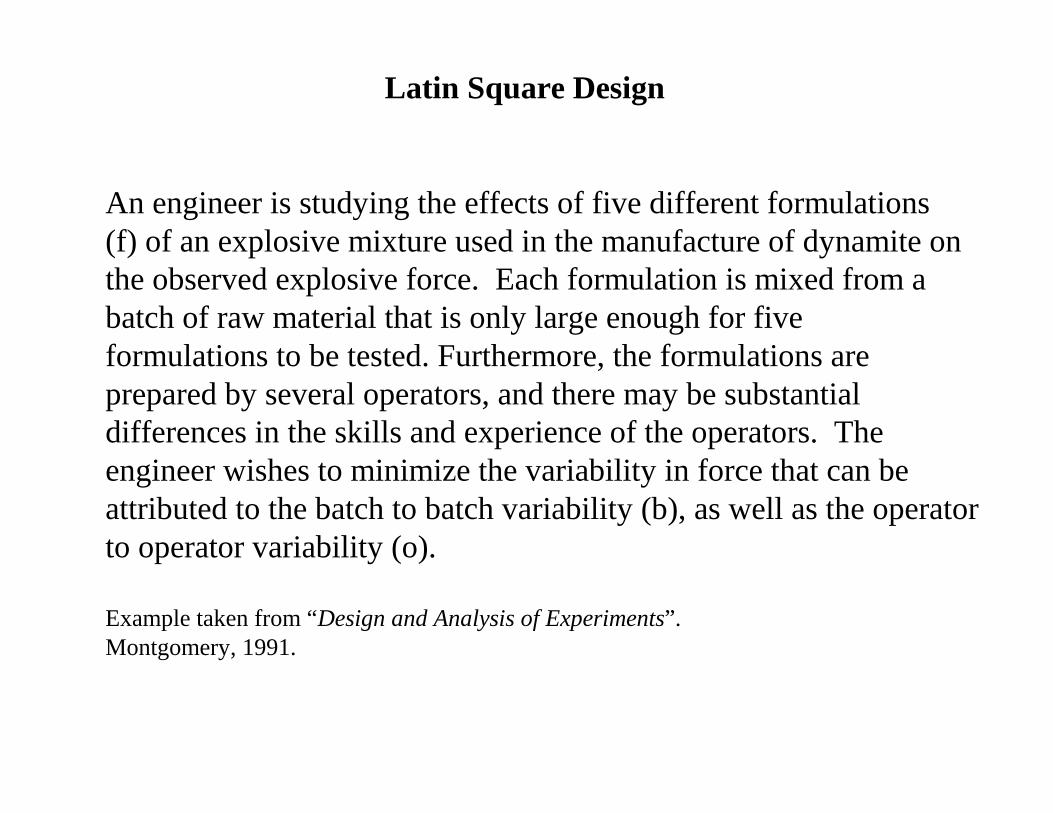
Latin Square Design
An engineer is studying the effects of five different formulations(f) of an explosive mixture used in the manufacture of dynamite on the observed explosive force. Each formulation is mixed from a batch of raw material that is only large enough for five formulations to be tested. Furthermore, the formulations are prepared by several operators, and there may be substantial differences in the skills and experience of the operators. The engineer wishes to minimize the variability in force that can be attributed to the batch to batch variability (b), as well as the operator to operator variability (o).
Example taken from “Design and Analysis of Experiments”. Montgomery, 1991.
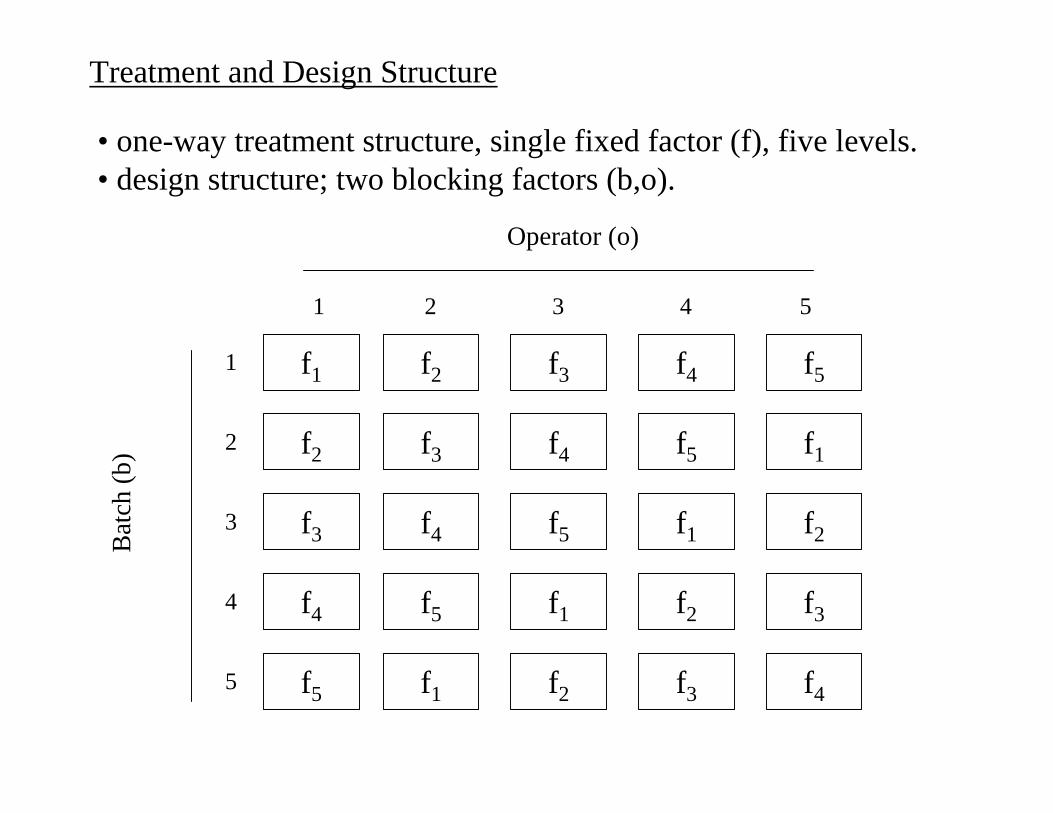
Treatment and Design Structure
• one-way treatment structure, single fixed factor (f), five levels. • design structure; two blocking factors (b,o).
f1
f2
f3
f4
f2 f3 f4
f3 f4 f5
f4 f5 f1
f5 f1 f2
Operator (o)
Bat
ch (b
)
1 2 3 4
1
2
3
4
f5
f1
f2
f3
f5 f1 f2 f3 f45
5
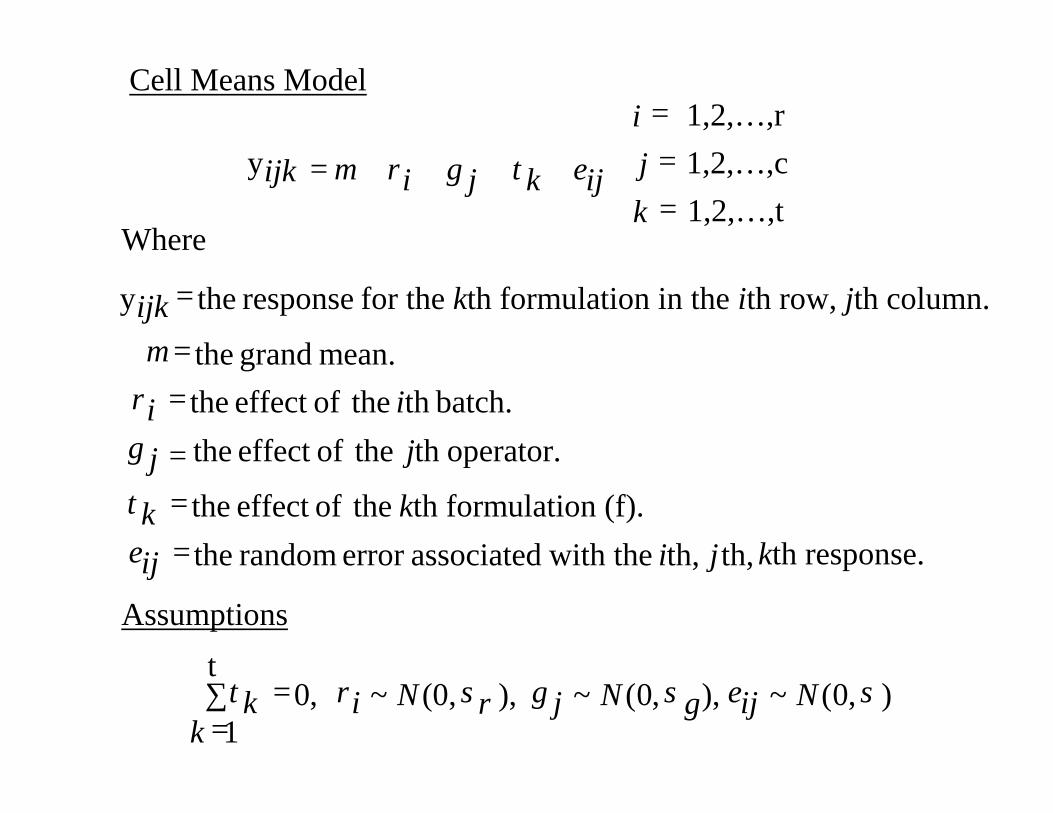
Cell Means Model
Where
Assumptions
),0(~ ),,0(~ ,)(0,~ ,01
σεσγσρτ NijγNjρNit
kk =∑
=
===
++++=1,2,… ,t 1,2,… ,c 1,2,… ,r
k ykji
ijkjiij ετγρµ
kth response. th, th, with theassociatederror random the kth formulation (f). theofeffect the
operator.th theofeffect the
batch.th theofeffect the mean. grand the
for the kth formulation in the ith row, jth column.response the y
jiijk
jj
ii
ijk
======
ετγρµ
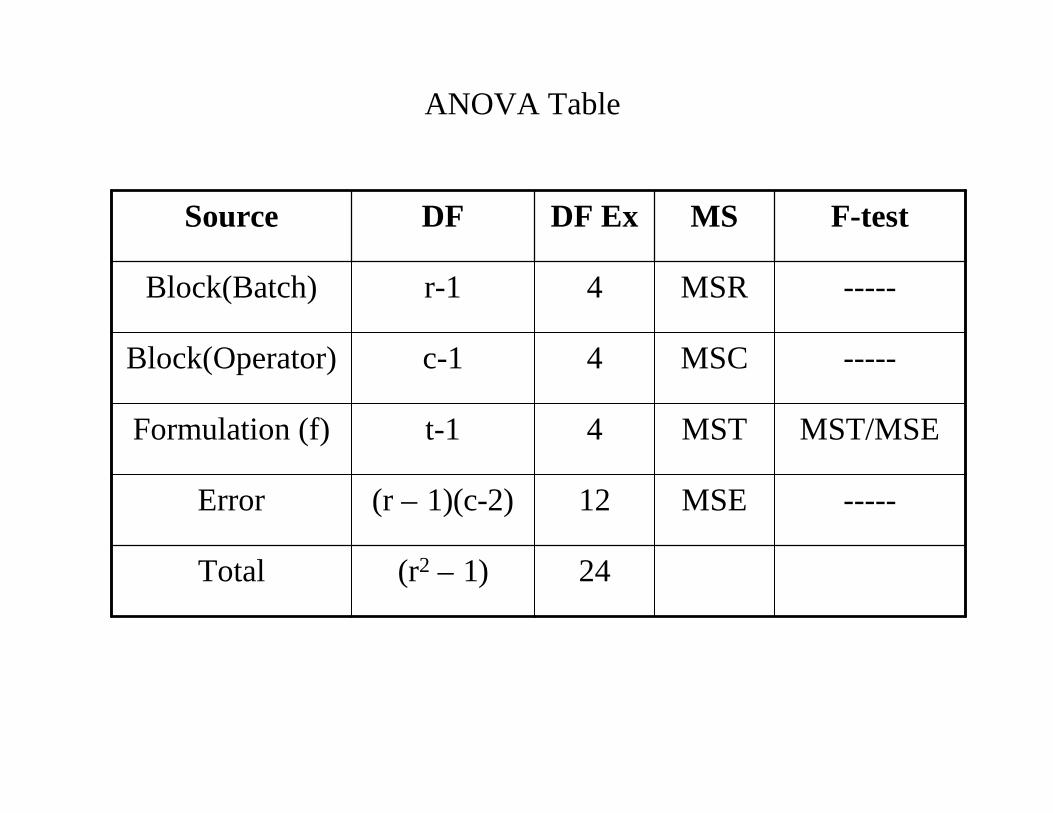
ANOVA Table
24
12
4
4
4
DF Ex
MSE
MST
MSC
MSR
MS
(r2 – 1)Total
-----(r – 1)(c-2)Error
MST/MSEt-1Formulation (f)
-----c-1Block(Operator)
-----r-1Block(Batch)
F-testDFSource
••
•
•
•
f1 f2 f3 f4 f5
••
•
•
•
f1 f2 f3 f4 f5
Qualitative Quantitative
Typical Analysis Summary
Y Y
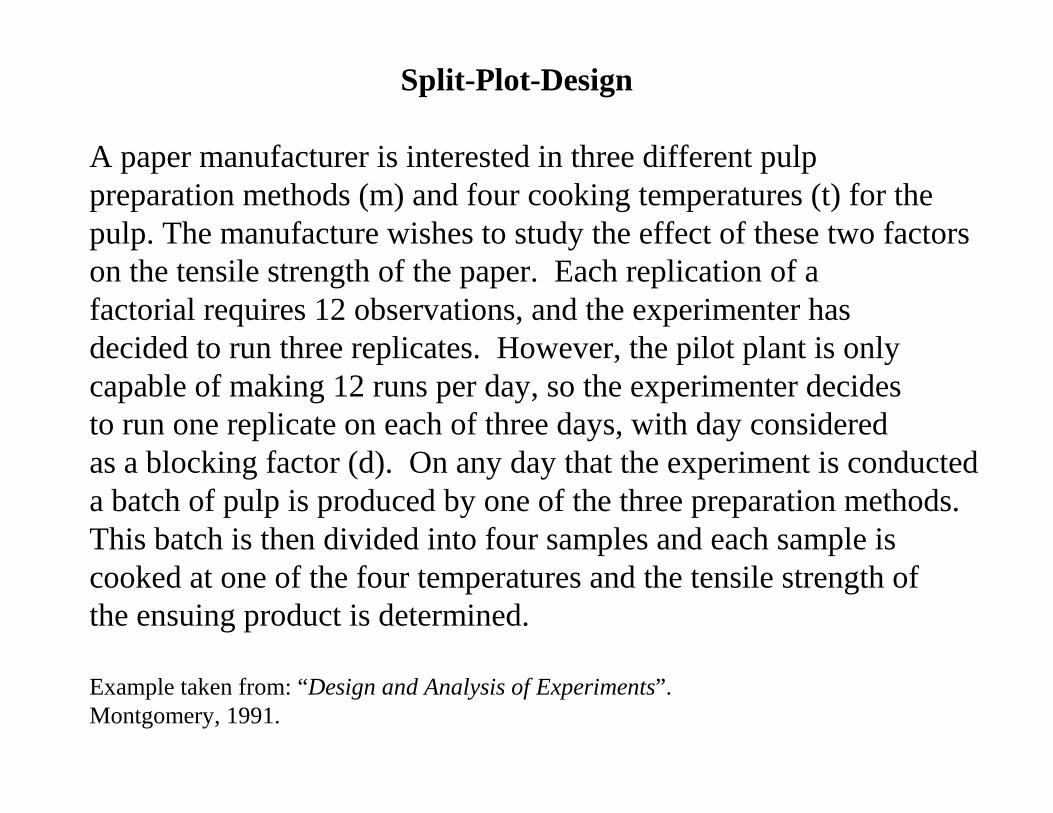
Split-Plot-Design
A paper manufacturer is interested in three different pulppreparation methods (m) and four cooking temperatures (t) for thepulp. The manufacture wishes to study the effect of these two factors on the tensile strength of the paper. Each replication of a factorial requires 12 observations, and the experimenter has decided to run three replicates. However, the pilot plant is onlycapable of making 12 runs per day, so the experimenter decidesto run one replicate on each of three days, with day considered as a blocking factor (d). On any day that the experiment is conducted a batch of pulp is produced by one of the three preparation methods. This batch is then divided into four samples and each sample is cooked at one of the four temperatures and the tensile strength of the ensuing product is determined.
Example taken from: “Design and Analysis of Experiments”.Montgomery, 1991.
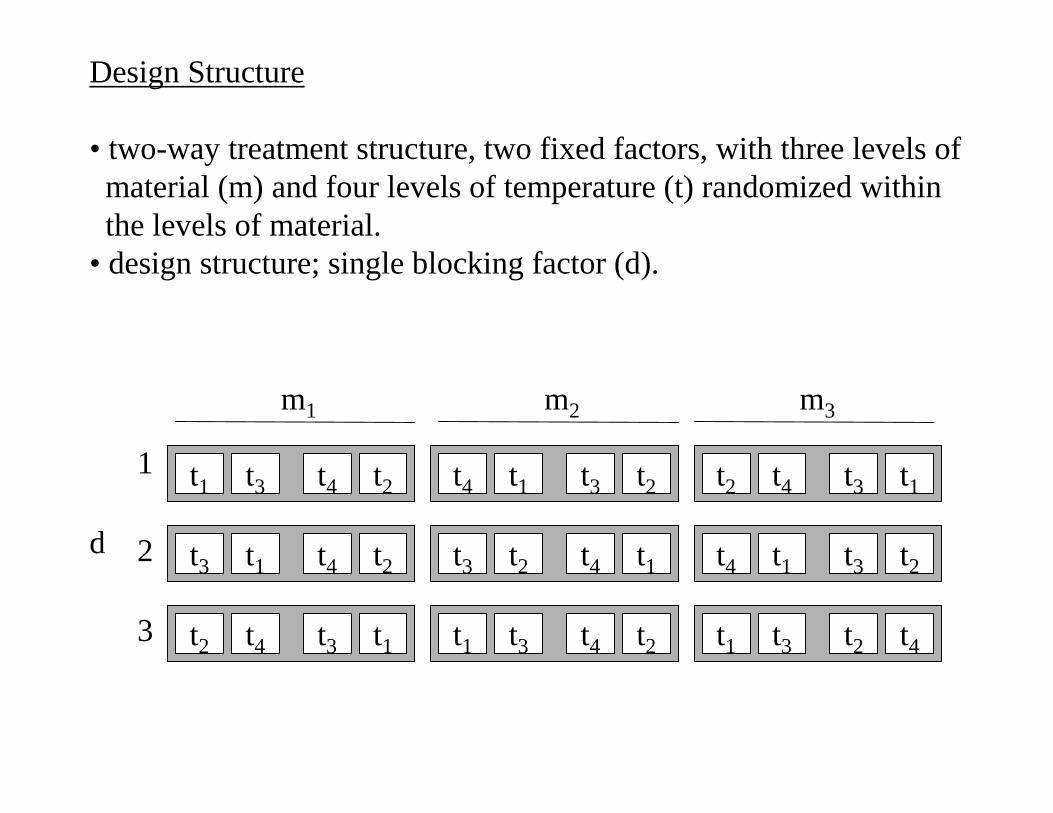
Design Structure
• two-way treatment structure, two fixed factors, with three levels of material (m) and four levels of temperature (t) randomized within the levels of material.• design structure; single blocking factor (d).
d
1
2
3
m1 m2 m3
t1 t3 t4 t2
t3 t1 t4 t2
t2 t4 t3 t1
t4 t1 t3 t2
t3 t2 t4 t1
t1 t3 t4 t2
t2 t4 t3 t1
t4 t1 t3 t2
t1 t3 t2 t4
Cell Means Model
1,2,… ,c 1,2,… ,b 1,2,… ,a
)( y
===
++++++=kji
ijkijjikdkiijk ετλλρτµ
Where
response.kth jth,ith, with theassociatederror random
t. of levelth and m of levelth between n interactio the
of temperature (t). levelth theofeffect the with the ith level of material (m). associatederror random
block.th thewitherror associated random the the effect for the ith level of material (m).
mean. grand the .block in material (m) of levelth
temperature (t) within theof levelth thefor response the y
=======
=
ijk
jiij
jjikd
kki
ki
jijk
ε(τλ)
λ
ρτµ
Assumptions
11
λτb
jj
a
ii ∑
==0,=0,∑
=
).N(0,~ ),,0(~ σεijNikd),,0(~ σρNkρ
∑=
∑=
=a
i
b
jij
1 1 0.)(τλ
σd
ANOVA Table
351863422
DF Ex
MSE(b)MSABMSB
MSE(a)MSAMSCMS
N-1Total----a(b-1)(c-1)Error (b)
MSAB/MSE(b)(a-1)(b-1)m x tMSB/MSE(b)b-1Temp (t)
----(a-1)(c-1)Error (a)MSA/MSE(a)a-1 Method (m)
-----c-1Block (d)F-testDFSources
m1 m2
m3
t1 t2 t3 t4 t1 t2 t3 t4
t1 t2 t3 t4
ll
l
l
l l
l l
l l
l
l
Typical Analysis Summary
Y Y
Y
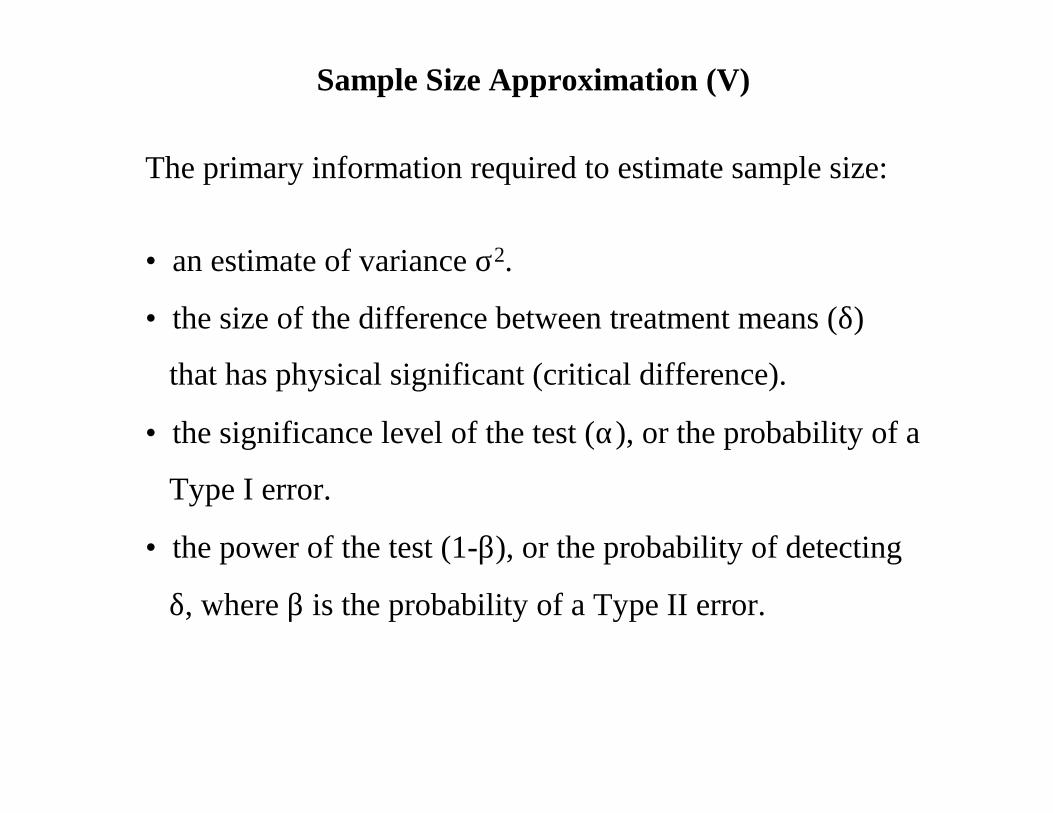
Sample Size Approximation (V)
The primary information required to estimate sample size:
• an estimate of variance σ2.
• the size of the difference between treatment means (δ)
that has physical significant (critical difference).
• the significance level of the test (α), or the probability of a
Type I error.
• the power of the test (1-β), or the probability of detecting
δ, where β is the probability of a Type II error.
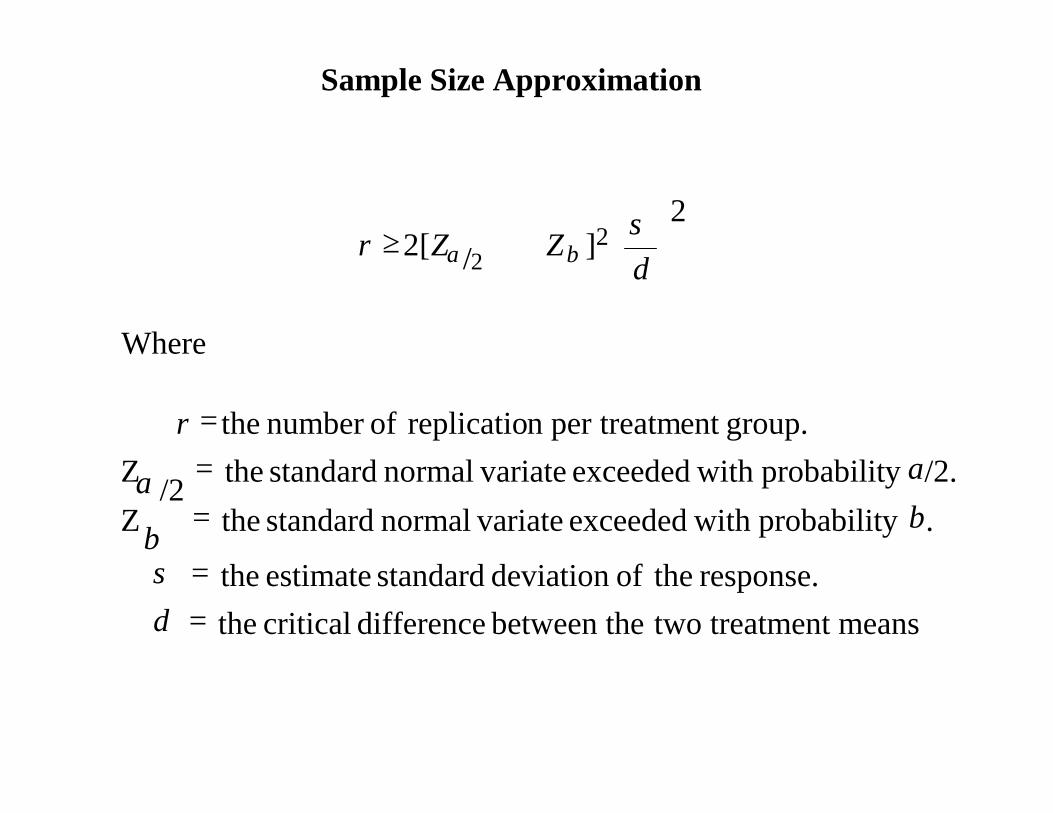
Sample Size Approximation
2]2 2/2[
+≥δσ
βα ZZr
Where
two treatment means ebetween th difference critical the response. theofdeviation standard estimate the
.y probabilit with exceeded variatenormal standard the Z/2.y probabilit with exceeded variatenormal standard the /2Z
group.ent per treatmn replicatio ofnumber the
=====
δσ
ββ
αα
r

Multiple Comparison Adjustment (VI)
• Adjustment procedure to control the type I error rate for multiple hypotheses tests; where the type I error is defined as the probability of rejecting the null hypothesis when the null hypothesis is true.
Probability of at least k type I errors:
Where n = the number of comparisons. αc = the comparison type I error rate.
n)c-(1 P(0) α=
kn)c1(kc
k
0t k)!-(nk!n! k)P(t −−∑
==≤ αα
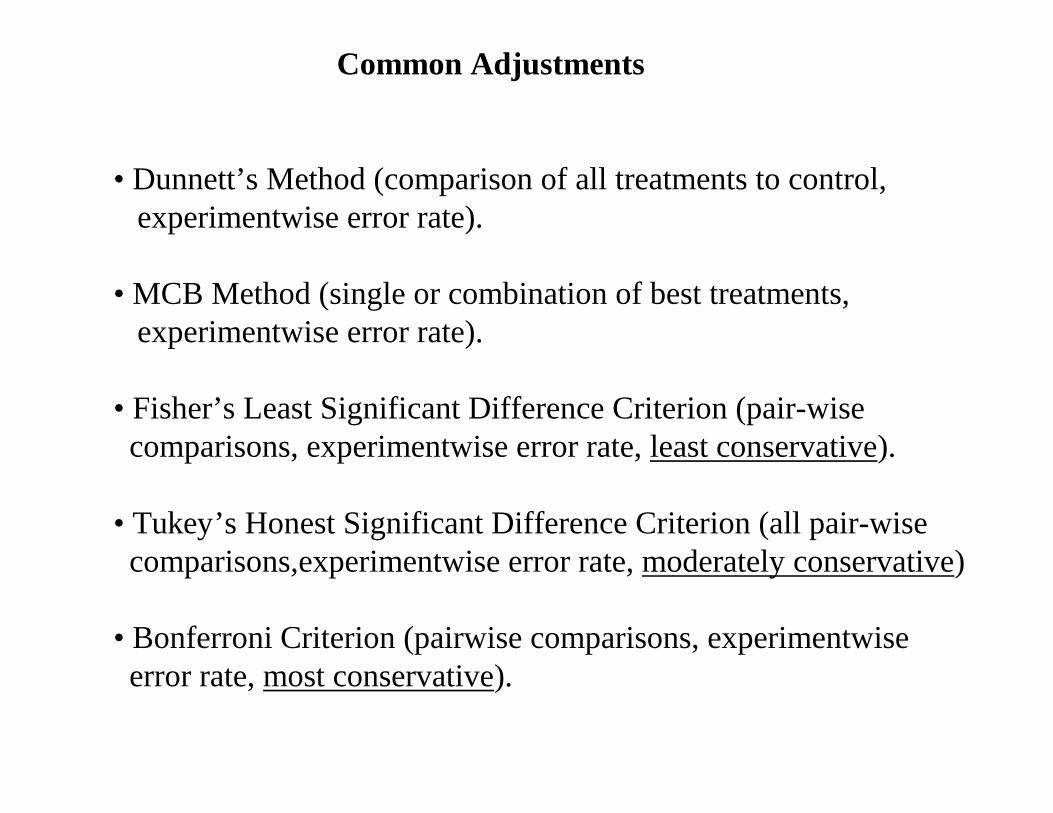
Common Adjustments
• Dunnett’s Method (comparison of all treatments to control, experimentwise error rate).
• MCB Method (single or combination of best treatments, experimentwise error rate).
• Fisher’s Least Significant Difference Criterion (pair-wise comparisons, experimentwise error rate, least conservative).
• Tukey’s Honest Significant Difference Criterion (all pair-wise comparisons,experimentwise error rate, moderately conservative)
• Bonferroni Criterion (pairwise comparisons, experimentwise error rate, most conservative).
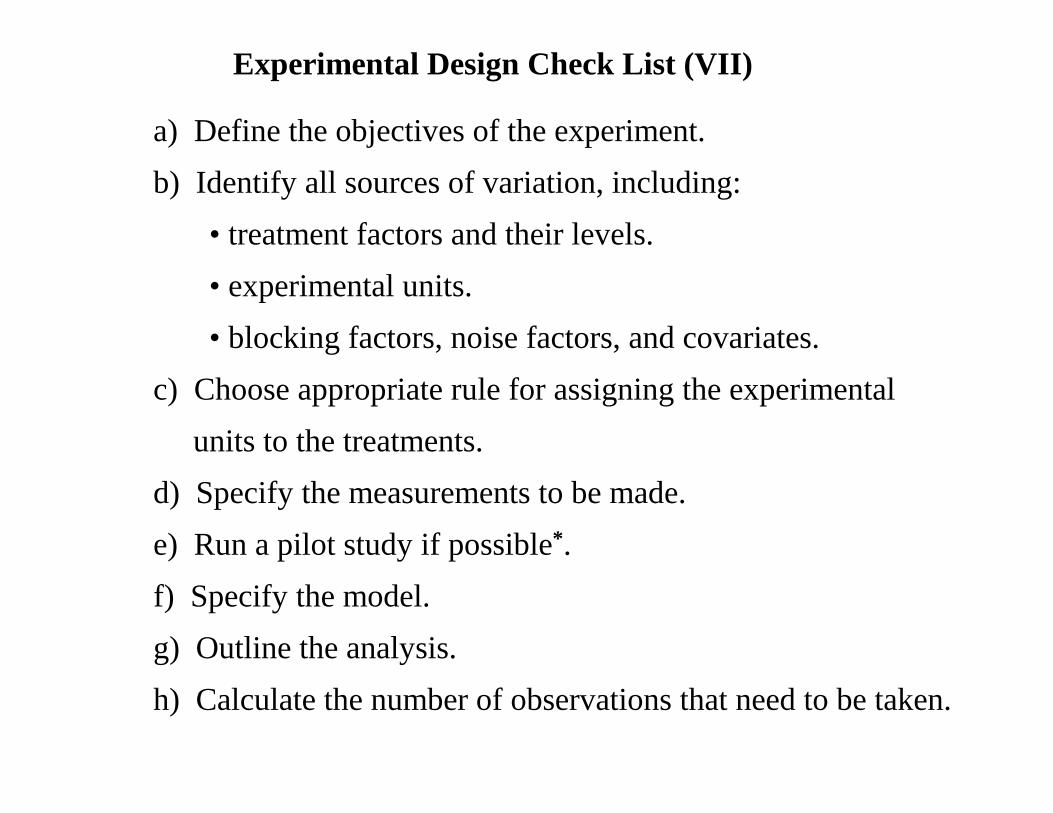
Experimental Design Check List (VII)
a) Define the objectives of the experiment.
b) Identify all sources of variation, including:
• treatment factors and their levels.
• experimental units.
• blocking factors, noise factors, and covariates.
c) Choose appropriate rule for assigning the experimental
units to the treatments.
d) Specify the measurements to be made.
e) Run a pilot study if possible*.
f) Specify the model.
g) Outline the analysis.
h) Calculate the number of observations that need to be taken.
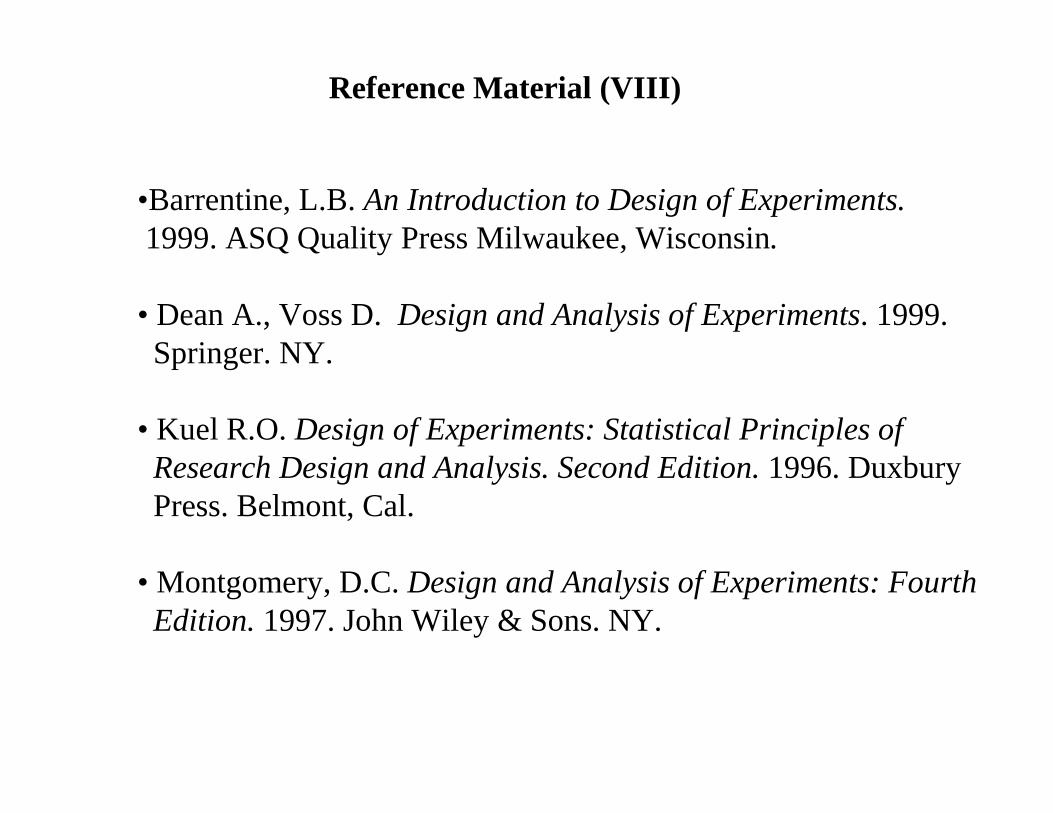
Reference Material (VIII)
•Barrentine, L.B. An Introduction to Design of Experiments. 1999. ASQ Quality Press Milwaukee, Wisconsin.
• Dean A., Voss D. Design and Analysis of Experiments. 1999. Springer. NY.
• Kuel R.O. Design of Experiments: Statistical Principles of Research Design and Analysis. Second Edition. 1996. Duxbury Press. Belmont, Cal.
• Montgomery, D.C. Design and Analysis of Experiments: Fourth Edition. 1997. John Wiley & Sons. NY.