OMICS Publishing Group I OMICS-Publishing-Group-Journals| Omics Group

Experimental Design and MS Workflows for Omics Applications
David A. Weil, Ph.D.
Senior Application Scientist
Schaumburg, IL
1
Omics Road Show Oct 2014

Acknowledgements: Support Team
AFO Metabolomics Team
Mark Sartain, Sumit Shah, Anne Blackwell, Dan Cuthbertson
Yuqin Dai Santa Clara, CA
Steve Madden Software Product Manager
Rick Reinsdorf National Jewish, Denver, CO
MPP Support Team Global
2
Omics Road Show Oct 2014

Outline
Basics of Experimental Design and Statistics
in “Omics” Research
Agilent’s LCMS Omics Data Analysis Workflow
Targeted, Untargeted, Pathway Directed
Update What’s New in MPP and Profinder
Sample Correlation, Pathways, Metadata, etc
3
Omics Road Show Oct 2014

Statistics
• There are three kinds of lies: lies, damned lies and
statistics- Benjamin Disraeli
• 98% of all statistics are made up – Unknowns
• Statistics is the mathematics of impressions
Ref: David Wishart, Informatics and Statistics for Metabolmoics July 8-9, 2013 at the Canadian
Bioinformatics Workshops
Omics Road Show Oct 2014
4

Applications.. From Food, Fuel, Metabolism
Page 5
Omics Road Show Oct 2014

Experimental design is critical for Omics experiments as..
All steps are critical from sample preparation to identification
Variance in a step can lead to false positive conclusions
Page 6
Omics Road Show Oct 2014

Why Are Statistics So Important For “Omics”
• Your hypothesis will drive your
experimental design.
• Your statistical design is critical to
answering the question.
• Have a statistical plan before starting.
• Your statistical plan will drive all other
aspects of your experimental design.
Omics Road Show Oct 2014
7

Why Do Statistics in MPP? Statistics in MPP help us:
• Avoid jumping to
conclusions.
• Avoid finding patterns in
random data
• Understand multiple
comparisons
• Consider alternative
explanations.
Omics Road Show Oct 2014
8
What Will Statistics Do and Not Do?
Will not:
• Give you absolute answers. Statistical conclusions give only
probabilities.
• Give you scientific or clinical conclusions. It is your job to
interpret the statistics and draw conclusions in context of the
hypothesis.
Will:
• Help you assess variability.
• Help you extrapolate from a sample to a population.
• Help you uncover relationships between variables.
Omics Road Show Oct 2014
9

Core Definitions For Statistics:
Mean: The center of a population or probability distribution
• Arithmetic Mean: The sum of values divided by N µ=Ʃxi/N
• Geometric Mean: All values multiplied together then raised the to 1/Nth
power. Equivalent to arithmetic mean of log values, what MPP uses.
Confidence Interval: Interval in which the mean is expected to lie with X%
(often 95%) confidence.
Median: The middle value in the dataset. More robust than mean when
outliers are present. The median value is useful to baseline to in
MPP.
Omics Road Show Oct 2014
10

Measures of Variability
Standard Deviation (σ) :
A measure of data dispersion around the mean.
Variance (σ2):
Standard deviation squared. Often partitioned in various sources.
Coefficient of Variation (CV):
A ratio measure of the standard deviation in relation to the mean. Useful for comparing scatter between variables.
Three measurements with the same mean but different standard deviations
Omics Road Show Oct 2014
11

Variables
Experimental Parameters
• Examples:
- Control vs. treated groups
- Lots or batches of raw materials
- Clinical phenotypes
- Drug dose response and time course
- Forced degradation time points
0
50
100
150
200
250
300
350
0 hr 4 hr 8hr 12 hr 24 hr
A
b
u
n
d
a
n
c
e
Time
Time Course and Dose Response
10 nanomolar
100 nanomolar
1000 nanomolar
A B C Phenotype
Nor
mal
ized
Abu
ndan
ce
Omics Road Show Oct 2014
12

Variables Non-Experimental Parameters
• Examples:
- Column changes during experiment
- Significant changes in sample prep
• Change in person doing the preparation
• Storage issues – alteration of temperature, freeze/thaw cycle, etc.
High complexity data is subject to seemingly minor changes in
methods, protocols, sample handling, etc.
Anything that could reasonably affect data should be considered
carefully.
Omics Road Show Oct 2014
13

What Should You Consider When Determining Number of Replicates
• Type of replicate:
- Technical Replicates: Instrument and/or Sample Prep ONLY tell you about the variability in the mean
measurement of a single sample
- Condition Replicates: Biological, Raw Material Lots,etc. Must be independently sampled from population Will tell you about variability in the population
• Statistical Power - Asks how many replicates you need to see the desired effect?
- You must have a hypothesis: You must estimate the effect size or group means
and their variability
Omics Road Show Oct 2014
14

What is Statistical Power?
A measure of confidence in statistical results
Key Terms to know
α : Error in finding something statistically significant when
the null hypothesis is true (set typically to desired p-value
ie. 0.05) -False Positive rate
β: Error in finding something not statistically significant
when the null hypothesis is false – False Negative rate
Power = 1- β
• If your experiment is underpowered you
cannot be confident in the differences you
see (or don’t see)
Omics Road Show Oct 2014
15

Sampling and Sample Preparation
• Sample Preparation is the primary source of non-experimental variance in differential analysis
Starting sample amount
Inconsistent pipetting
Operator/ chemist
Sample degradation and freeze thaw cycles
Mixing and fractionation
• Reduce impact of non-experimental variance
Careful method validation will help estimate variability
Use controls and QCs to account for variability
Normalization will only get you so far
Omics Road Show Oct 2014
16

No universal separation method exits to profile all
the classes of metabolites in a single LC-MS run
Metabolome Small Molecule Extract
Nucleo(s/t)ides Amino Acids Sugars Lipids
Polar/Hydrophilic
Aqueous Normal Phase
HILIC
Mixed Mode
Reverse Phase (with Ion Pairing)
NonPolar/Hydrophobic Reverse Phase
GC-MS
Page 17
Omics Road Show Oct 2014
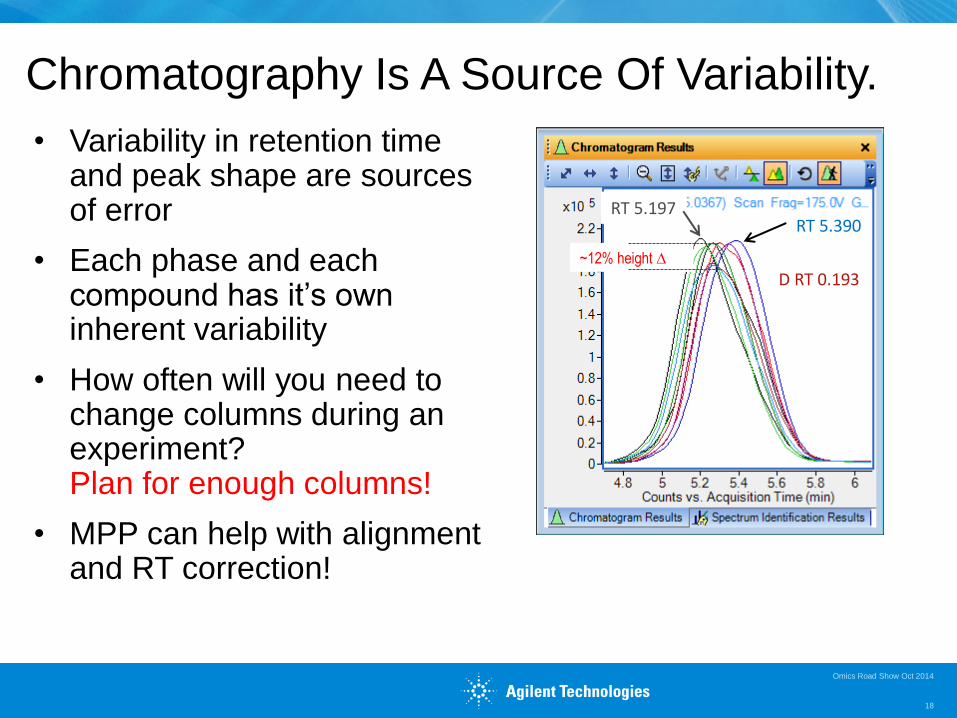
Chromatography Is A Source Of Variability.
• Variability in retention time and peak shape are sources of error
• Each phase and each compound has it’s own inherent variability
• How often will you need to change columns during an experiment? Plan for enough columns!
• MPP can help with alignment and RT correction!
RT 5.197 RT 5.390
D RT 0.193 ~12% height D
Omics Road Show Oct 2014
18

How to avoid technical variability
Use
• Randomization within Sample Plates
• Normalization
• Internal Standards in Sample Prep and Samples
• QA/QC Pooled Samples
• Model Studies to determine measurement variance
• Robust LCMS system key!
19
Omics Road Show Oct 2014

Accounting for Variability – Normalization in MPP
Key Point: Each normalization makes different assumptions about the sample. Violating these assumptions can introduce more error than you hope to correct.
Key Point: Normalizations can be very sensitive to zero values
Key Point: Normalization is not always necessary
Normalization:
External Scalars Osmolality, Protein Content, Cell Count, Etc.
Algorithmic
- Total “Useful” Current and Percentile Shift: Assumes that the sum concentration of all analytes is the same
in every sample.
- Quantile: Assumes that the distribution of intensities in the samples is the same
Omics Road Show Oct 2014
20

Just a brief overview…. Lots of books and online learning..
Omics Road Show Oct 2014
21

Data Acquisition & Analysis --- start with Mass Hunter Targeted Data Acquisition – QQQ
• Known metabolites only
• Higher sensitivity than profiling approach
• Absolute quantitation
• Typically develop methods for tens/hundreds of metabolites
• Project results onto biological pathways for interpretation
Untargeted Data Acquisition – TOF / Q-TOF
• Acquire data and detect all compounds; relative quantitation.
• Targeted data mining: Pathway Directed
− Analyze data with a database of known compounds
− Project results onto pathways
• Untargeted data mining:
− Find all compounds
− Naïve data mining: Discovery based approach
− Track metabolites using mass, or mass spectra and retention time
22
Omics Road Show Oct 2014

LC-QQQ Targeted Metabolomics Workflow
23
1
2
3
4
5
• Optimize LC/MRMs for metabolite standards using LC/QQQ
and Optimizer
• Acquire MRM data using LC/QQQ and Study Manager
• Quantitation of metabolites using MassHunter Quantitative
Analysis exporting project into MPP
• Statistical analysis using Mass Profiler Professional
• Choose pathway database and species
• Analyze differential data and visualize the results on pathways
Omics Road Show Oct 2014

Targeted Metabolomics Quant Software
24
• Batch processing of samples
• Easy construction of calibration
curves
• Automate quant analysis and
reporting
• Compound centric review for
manual editing
• Import results into MPP
• Compound identifier included with
results for pathway analysis
MassHunter Quantitative Analysis
Omics Road Show Oct 2014

Untargeted/Pathway Directed
25
Unta
rge
ted
P
ath
wa
y T
arg
ete
d
Feature
Finding
Profinder
Profinder
Identify
ID Browser
Separate &
Detect
LC-TOF/QTOF
LC-TOF/QTOF
Alignment &
Statistics
Mass Profiler
Professional
Mass Profiler
Professional
Pathways
Pathway Architect
Pathway Architect
Omics Road Show Oct 2014

MassHunter Profinder Software MassHunter Profinder is a productivity
tool for processing multiple samples in
metabolomics, proteomics, intact protein
analyses
• Fast Compound Finding • Untargeted using MFE
• Targeted using Find by Formula
• Visualize, review, and edit results
by compound across many
samples
• Higher quality results based on
cross-sample processing
• Minimizes false positive and
negative results
• Batch Processing
Omics Road Show Oct 2014
26
Group 1
Group 2
Group 3
Group 4
Compound group
level information
Details for a
single compound
Stacked/ove
rlaid EICs
MS
spectra

Pathway Directed – Pathways to PCDL
27
Convert pathway metabolite information into Agilent personal compound
database
• Pathway database source - WikiPathways, BioCyc and KEGG
• Select one to many pathways
• Removes redundant metabolites
• Adds compound information – Formula, Compound ID(s), Name, Structure
Can link to METLIN PCDL to add compound information
• Retention time or MS/MS spectra
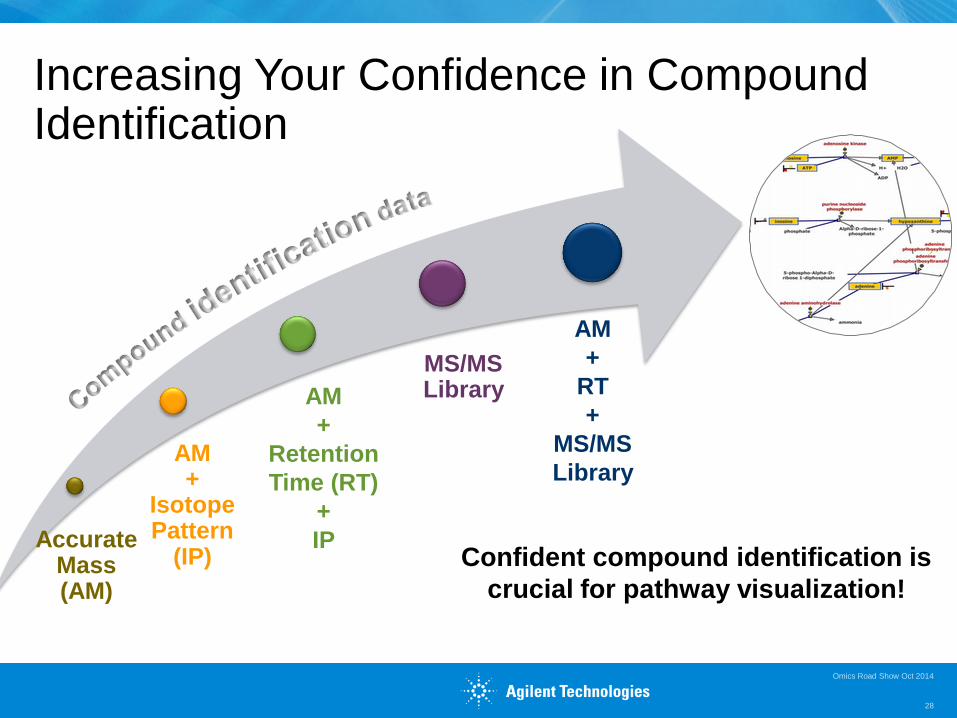
Increasing Your Confidence in Compound Identification
28
Accurate Mass (AM)
AM +
Isotope Pattern
(IP)
AM
+
Retention
Time (RT)
+
IP
MS/MS Library
AM
+
RT
+
MS/MS
Library
Confident compound identification is
crucial for pathway visualization!
Omics Road Show Oct 2014

Identification With An MS/MS Library Match METLIN Personal Compound Database & Library
29
The Only Commercially Available Database and MS/MS Library for Metabolomics
Q-TOF based LC-MS/MS library
Compounds in database - 64092
Compounds with MS/MS - 8040
• Collected in ESI +/- modes
• Selected monoisotopic ion
• Collected at three collision energies
• Spectra reviewed for quality
Omics Road Show Oct 2014

Identification Without An MS/MS Library Match Molecular Structure Correlator (MSC)
30
Confirm proposed structures in
minutes
• Uses accurate mass MS/MS data
• Facilitates compound identification
− Search compounds in a database, i.e.
PCDL or ChemSpider
− Assigns fragment ions to substructures
of a proposed parent structure
− Provides a score to estimate goodness
of match to MS/MS data
Molecular Structure Correlator (MSC)
Omics Road Show Oct 2014

Mass Profiler Professional (MPP) 13: Statistical Analysis and Visualization Software
Designed for Mass Spectrometry data from multiple platforms
Can Import, Store, and Visualize
Agilent LC/MS Q(TOF), and QQQ Agilent GC/MS Quad, QQQ, and QTOF Agilent ICP/MS and NMR (Craft) Generic file format import
Extensive statistical analyses tools
ANOVA, Clustering, PCA, Fold-change, Volcano plots
Correlation Analysis, including multi-”omic” correlation!
ID Browser for compound identification
Integrated Biology “Omics”
Pathway Architect for biological contextualization
NEW! KEGG Pathways
New Meta Data
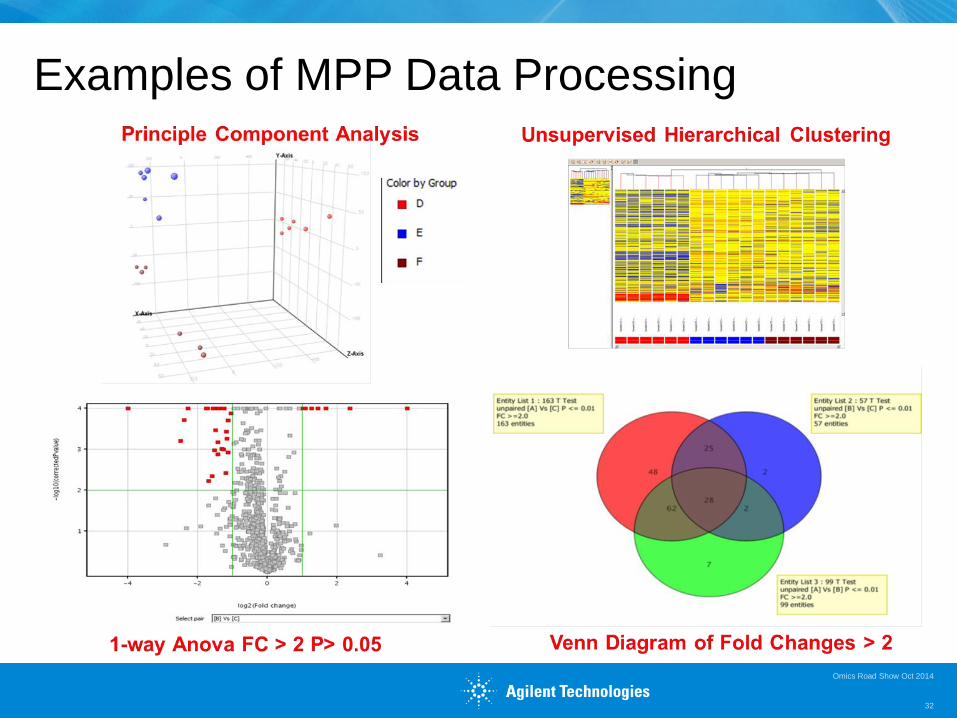
Examples of MPP Data Processing
32
Omics Road Show Oct 2014

Pathway Architect: Changing Data Into A Pathway Visualization
Start here Finish here

Pathway Architect 13: Canonical Pathway Data Mapping and Visualization
Browse, filter, and search
Analyze one or two types of omic data
Supports biological pathways from publicly available databases
• WikiPathways
• BioCyc
• KEGG
Supported formats • BioPAX3 –Pathway Commons, Reactome
NCI Nature Pathway
• GPML – PathVisio –custom drawing
Export compound list from pathways
Easy Mining of Complex Pathways for Biological Understanding
Central Carbon Metabolism

New in Pathway Architect 13: KEGG Pathways
• Curated biological
information
available from
KEGG
• Download from
Agilent server
• Integrated directly
in Pathway
Architect
• KEGG license
required

Integrating Genomics and Metabolomics Data Amino Acid Metabolism
37
Omics Road Show Oct 2014

What’s New in MPP 13.0 and Profinder
38
Omics Road Show Oct 2014

MPP 13 Supports Meta Data Analytical Results to Meta Data
Omics Road Show Oct 2014
39
Metadata can be displayed as
• Heat maps
• Colored strips
• Graphical plots
• Discrete plots
• Text
Visualize the significant relationships!
• Maps observable sample information to analytical results
• Provides flexible visualization of metadata (e.g. time points, growth
conditions, patient data etc.) to facilitate interpretation

Correlation Analysis
MPP 13 adds support for
Correlation Analysis.
Researchers can view
relationships between
entities (compounds or
proteins) or samples.
Clicking on a cell of a heat
map, they can quickly view
the specific parameters of
the correlation
Omics Road Show Oct 2014
40
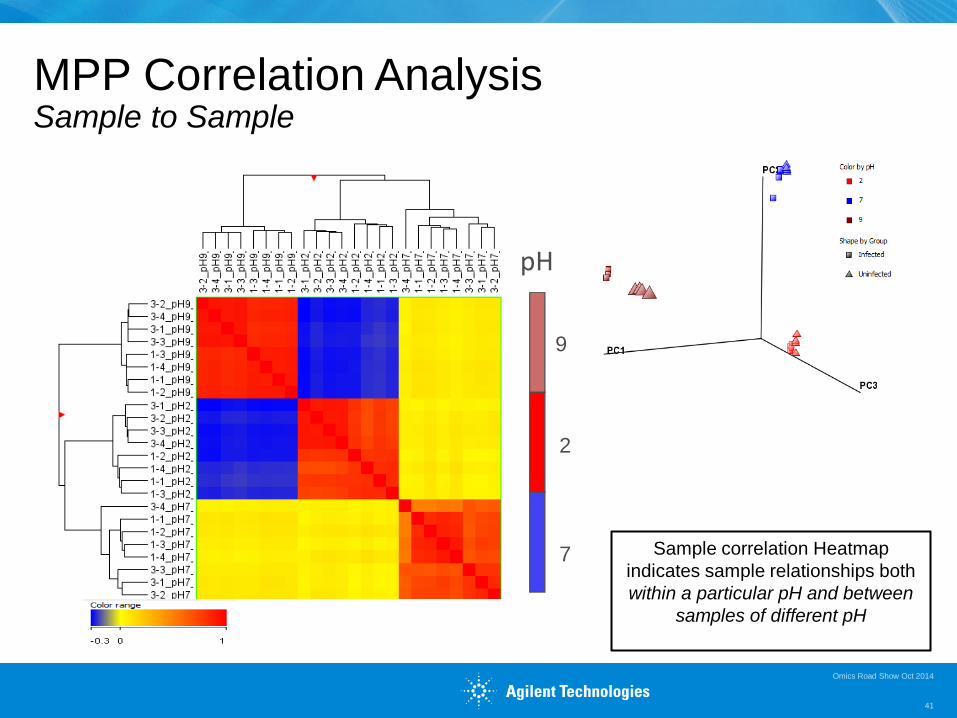
MPP Correlation Analysis Sample to Sample
Omics Road Show Oct 2014
41
pH
9
2
7 Sample correlation Heatmap
indicates sample relationships both
within a particular pH and between
samples of different pH

MPP Correlation Analysis Entity to Entity
Omics Road Show Oct 2014
42
Supported comparisons:
• Within an experiment
• Between experiments
(genes and proteins,
proteins and metabolites
etc.)
Clicking on any square brings
up the regression analysis

What’s New in Profinder B.06.00 SP1 Support for Intact Proteins
Profinder B.06.00 SP1 has
added the Large Molecular
Feature Extraction (LMFE)
algorithm, which enables
profiling of intact proteins using
multiply charged mass spec
data. Now small molecule,
peptide, and intact proteins can
be processed in the same
program!
Omics Road Show Oct 2014
43
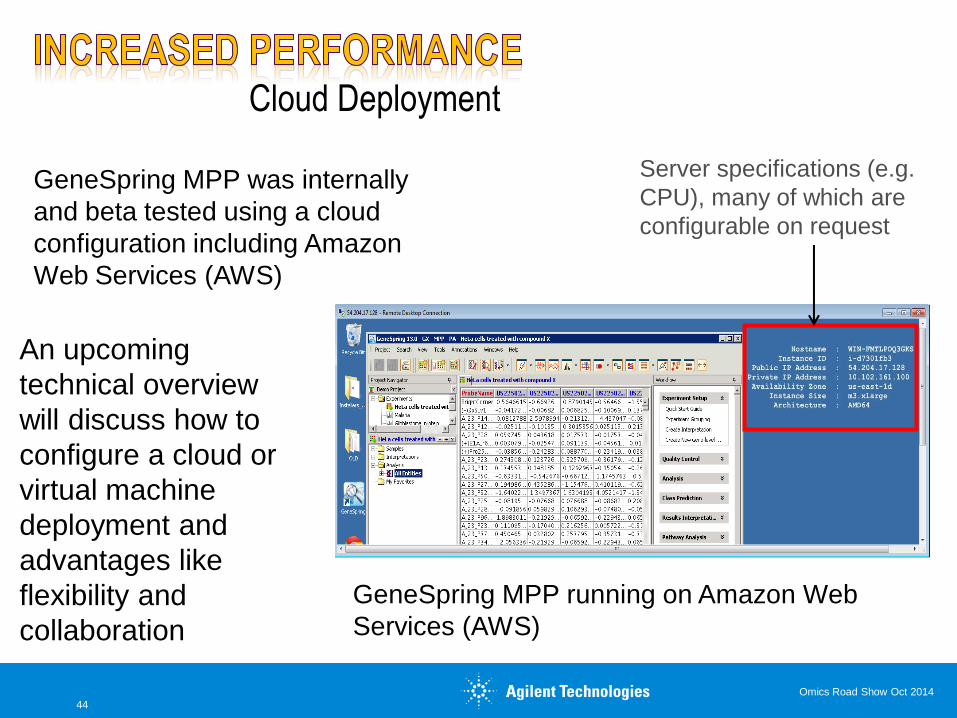
Cloud Deployment
GeneSpring MPP was internally
and beta tested using a cloud
configuration including Amazon
Web Services (AWS)
GeneSpring MPP running on Amazon Web
Services (AWS)
Server specifications (e.g.
CPU), many of which are
configurable on request
An upcoming
technical overview
will discuss how to
configure a cloud or
virtual machine
deployment and
advantages like
flexibility and
collaboration
Omics Road Show Oct 2014
44
Customer training courses are bundled with new licenses and
upgrades:
• R2260A Mass Profiler Professional (MPP) Workshop
• R3904A Pathway Architect Workshop
The MPP Supplemental DVD contains:
• Workflow Guides on Metabolomics, Lipidomics, Integrated
Biology and Class Prediction ( )
• Video Tutorials on using MPP including Advanced
Operations and Class Prediction (
Omics Road Show Oct 2014
45

Agilent Solutions for Metabolomics
46
– A broad family of products (LC/MS, GC/MS and NMR) to meet your needs
– Agilent TOF technology is most-suited for untargeted metabolomics
• High mass accuracy and mass stability
• Wide dynamic range with good resolution and high isotope ratio fidelity
• Highest sensitivity for low level metabolite detection
– Profinder is the most advanced software for high quality feature finding
– METLIN is the only commercially available MS/MS library for metabolites
– MSC assists ID of MS/MS spectra without library matches
– Software designed to analyze metabolomics data
– Pathway compound ID mapping using automated Agilent BridgeDB
– Ability to visualize metabolomics data in pathways
Omics Road Show Oct 2014

Omics Road Show Oct 2014
47

Omics Road Show Oct 2014
48