Experimental design and analysis Experimental design Gerry Quinn & Mick Keough, 1998 Do not copy or...
66
Experimental design and analysis Experimental design Gerry Quinn & Mick Keough, 1998 Do not copy or distribute without permission of authors.
-
date post
20-Dec-2015 -
Category
Documents
-
view
219 -
download
0
Transcript of Experimental design and analysis Experimental design Gerry Quinn & Mick Keough, 1998 Do not copy or...

Experimental design and analysis
Experimental design
Gerry Quinn & Mick Keough, 1998Do not copy or distribute without permission of authors.

What is an experiment?
• Test of hypothesis (prediction)
• Create conditions under which various predictions (hypotheses) should occur
• Compare observations under these conditions to observations under original (unaltered) conditions
Principles of experimental design
• Replication
• Controls
• Randomisation
• Reducing unexplained variation
• Power analysis

Replication
• Biological systems inherently variable– particularly ecological systems
• Measuring that variation requires replicate experimental or sampling units
• Avoids confounding:– effect of different factors (variables) cannot
be distinguished
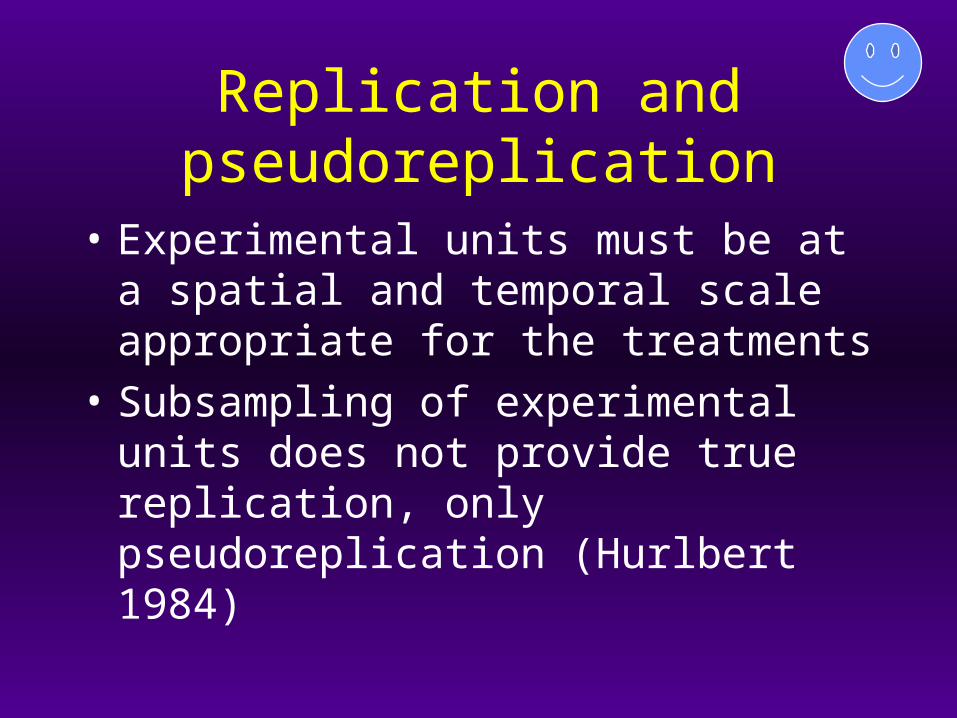
Replication and pseudoreplication
• Experimental units must be at a spatial and temporal scale appropriate for the treatments
• Subsampling of experimental units does not provide true replication, only pseudoreplication (Hurlbert 1984)
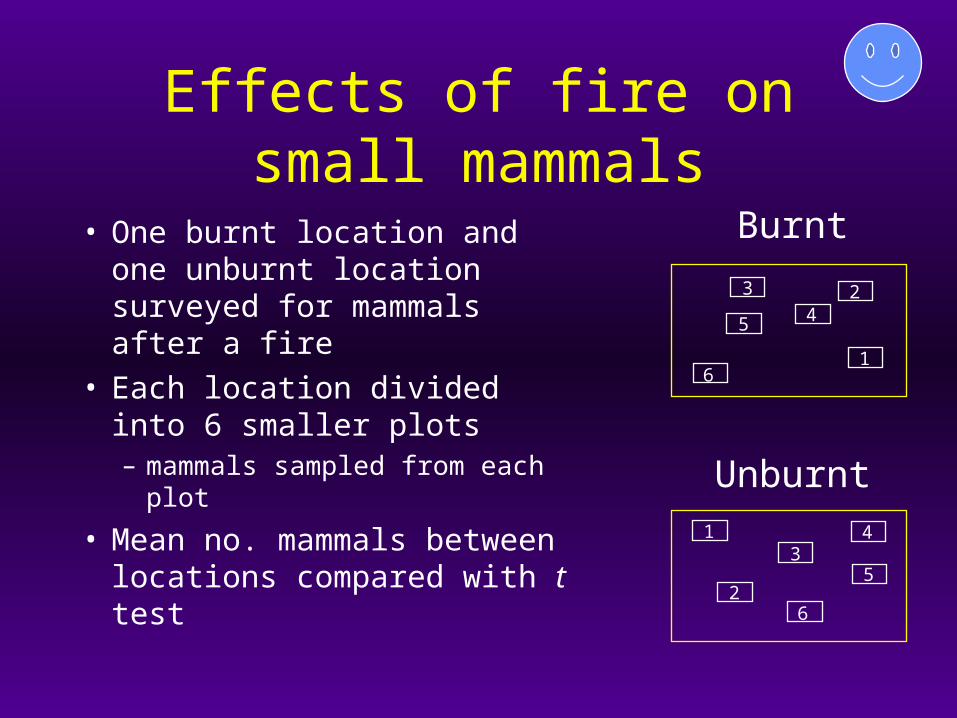
Effects of fire on small mammals
1
2
34
5
6
1
23
45
6
Burnt
Unburnt
• One burnt location and one unburnt location surveyed for mammals after a fire
• Each location divided into 6 smaller plots– mammals sampled from each
plot
• Mean no. mammals between locations compared with t test

• Burning treatment applied to location, not to small plots
• Plots are only pseudoreplicates– not true replicates
• True replicates are locations– only 1 replicate per treatment
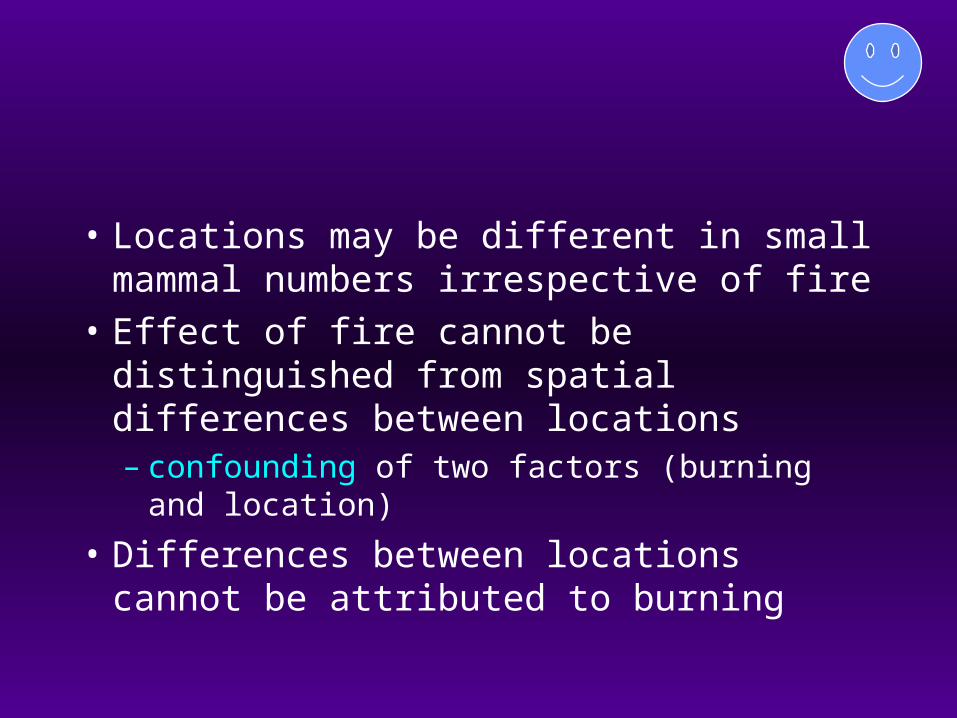
• Locations may be different in small mammal numbers irrespective of fire
• Effect of fire cannot be distinguished from spatial differences between locations– confounding of two factors (burning and
location)
• Differences between locations cannot be attributed to burning

• No conclusions possible about effect of fire
• Experiment requires replicate burnt and unburnt areas
Burnt
Burnt
Burnt
Unburnt
Unburnt
Unburnt

Constant temperature rooms
• The effects of increased temperature on growth rate of Acacia terminalis seedlings
• Two constant temperature rooms set up:– one at 15oC and one at 30oC– 20 “replicate” seedlings in each CT room

• Temperature treatment applied to whole CT rooms, not to individual plants
• Plants are only pseudoreplicates– not true replicates
• True replicates are CT rooms– only 1 replicate per temperature treatment
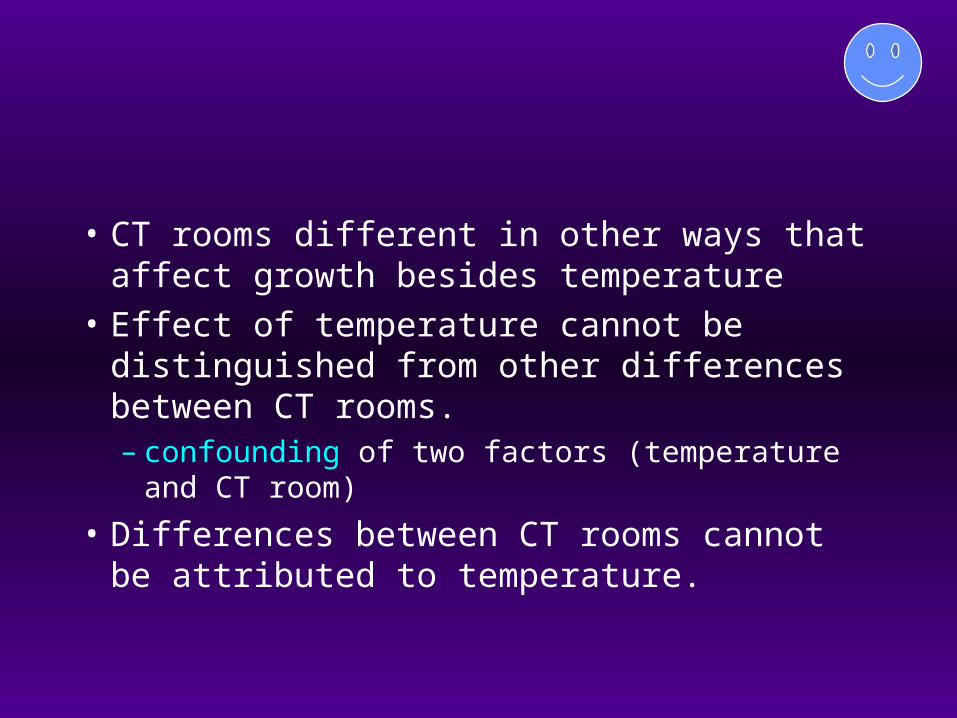
• CT rooms different in other ways that affect growth besides temperature
• Effect of temperature cannot be distinguished from other differences between CT rooms.– confounding of two factors (temperature and CT
room)
• Differences between CT rooms cannot be attributed to temperature.

Other solutions
• Replicate CT rooms required for each temperature
• What if only two CT rooms are available?– CT rooms usually expensive and heavily
used
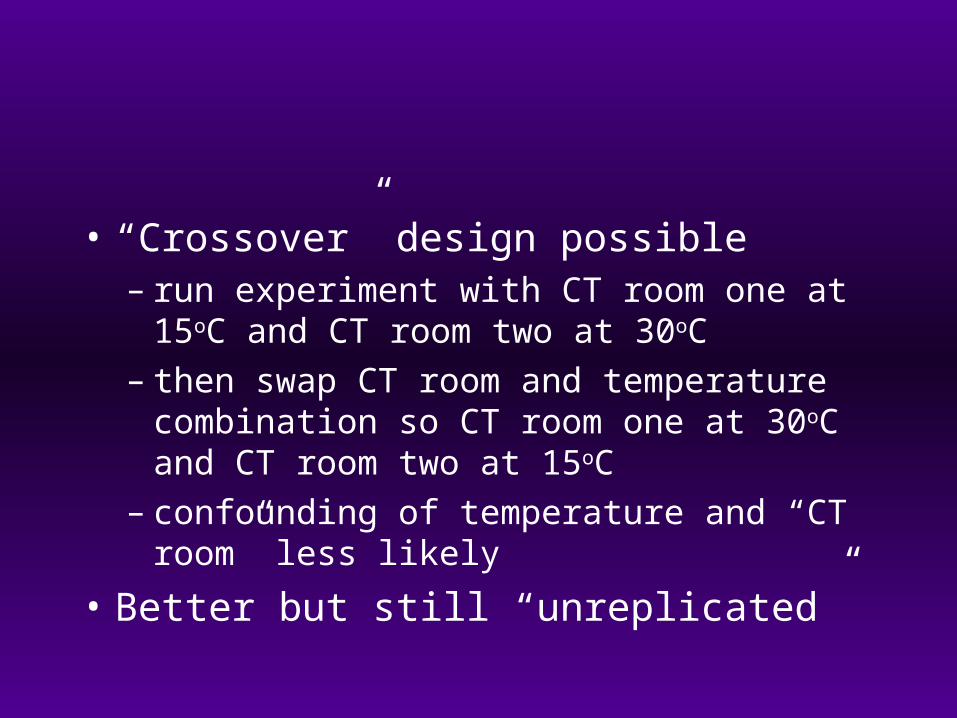
• “Crossover” design possible– run experiment with CT room one at 15oC
and CT room two at 30oC– then swap CT room and temperature
combination so CT room one at 30oC and CT room two at 15oC
– confounding of temperature and “CT room” less likely
• Better but still “unreplicated”

Point-source pollution study
• Effects of sewage outfall on species richness of benthic invertebrates on sandy beach– ten cores taken randomly from beach near
outfall– another ten cores taken from unaffected
beach away from outfall• Effect of sewage outfall tested with t-
test on mean species richness
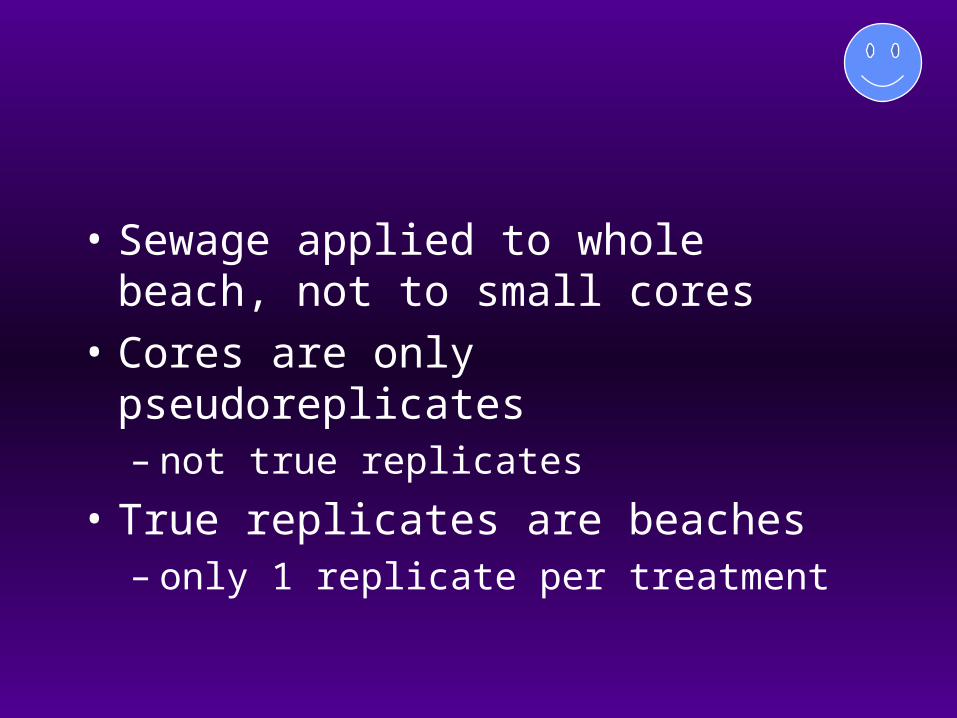
• Sewage applied to whole beach, not to small cores
• Cores are only pseudoreplicates– not true replicates
• True replicates are beaches– only 1 replicate per treatment

• Beaches different in invertebrate diversity irrespective of sewage
• Effect of sewage cannot be distinguished from spatial differences between beaches– confounding of two factors (sewage and
beach)
• Differences between beaches cannot be attributed to sewage
Solutions?
• Multiple sewage beaches not usually possible (or desirable) - multiple unaffected beaches required!– Is impact beach outside range of natural
variation of unaffected beaches?• Before-After-Control-Impact (BACI)
design?
Controls
• Many factors that could influence the outcome of experiment are not under our control– allowed to vary naturally
• What would happen if the experimental manipulation had not been performed?– controls
Salamander competition
• Hairston (1989)• Hypothesis
– 2 species of salamanders (Plethodon jordani and P. glutinosus) in the Great Smoky Mountains compete
• Experiment:– Treatment = P. glutinosus removed from plots– Control = P. glutinosus not removed
• Treatment:– population of P. jordani increased following
P. glutinosus removal
• Control:– population of P. jordani on control plots
(with P. glutinosus not removed) showed similar increase
• Without controls:– increase in P. jordani might have been
incorrectly attributed to P. glutinosus removal
– some other factor affecting P. jordani abundance besides P. glutinosus

Physiological experiments
• Effects of a drug on physiology of animal (e.g. lab rat)– compare response of animals injected with
drug to response of control animals not injected
• Differences between control and injected animals may be due to injection procedure– handling effects, injury from needle etc.
• Suitable control is to inject animals with inert substance– handling effects, injury etc. same for
control and treatment animals
• Any difference between treatment and control animals more likely due to effect of drug

Ecological experiments
• The effect of predatory fish on marine benthic communities (eg. mudflats)– compare areas of mud with fish exclusion
cages to areas of mud with no cages.
• Differences between 2 types of areas may be due to cage effects– shading, reduced water movement,
presence of hard structure etc.
• Must use cage controls– cages with small gaps to allow in fish– shading, water movement etc. same for
cages and cage controls
• Any difference between exclusion and control areas more likely due to effect of fish

Randomisation I
• Experimental units within each treatment must be random sample from population of possible experimental units
• Haphazard (faster but still unbiased) sampling often used

• Drugged rats must be random sample of all possible drugged rats about which we wish to draw conclusions– same for control rats
• Caged plots on mudflat must be random sample of all possible caged plots on mudflat– similarly for control plots
• Random sampling ensures:– estimates of population parameters
(means, treatment effects, variances) are unbiased
– statistical inference (conclusions from statistical test) are reliable
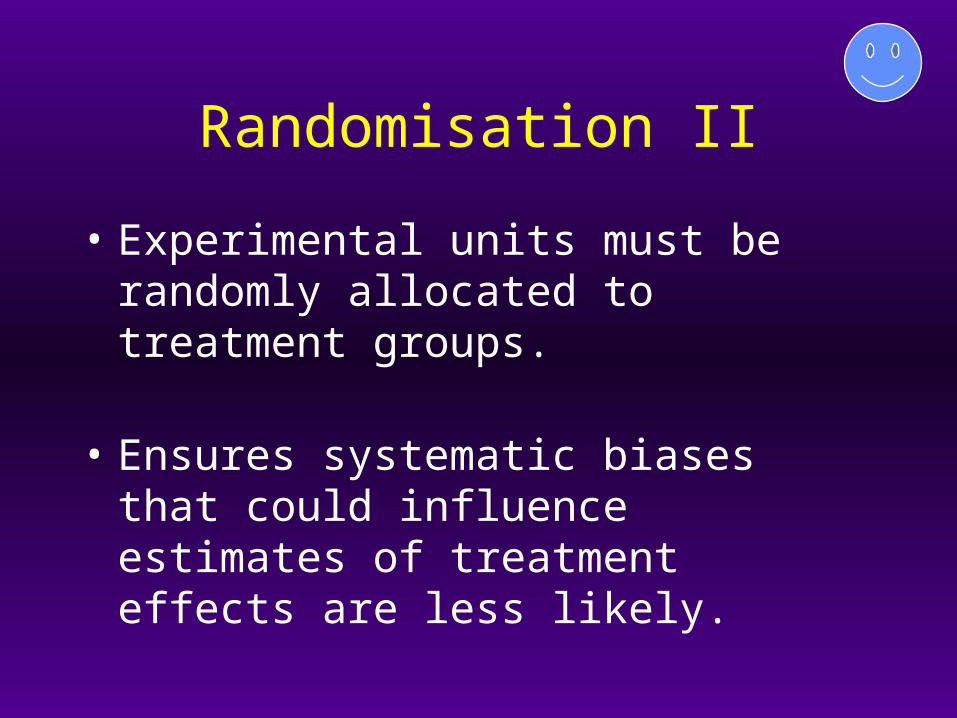
Randomisation II
• Experimental units must be randomly allocated to treatment groups.
• Ensures systematic biases that could influence estimates of treatment effects are less likely.

Allocation of replicates to treatments
• Effect of exercise on [Hb] in blood of flathead• Fish sampled from population of fish in
aquarium• First six fish caught:
– used for treatment group– forced to swim rapidly before [Hb] is measured
• Next six fish:– used as the controls– left undisturbed before [Hb] is measured
• BUT first 6 fish caught are probably slower or more stupid or less healthy, and hence easier to catch
• Bias/confound our estimates of the effects of exercise

E
E
E
E
EC
CC
C
C
Randomisation vs interspersion
• Experiment on effects of fish predation on mudflats.– randomly choose 10 plots– randomly allocate 5 as fish exclusion (E)
plots and 5 as cage-control (C) plots
• Possible random arrangement:
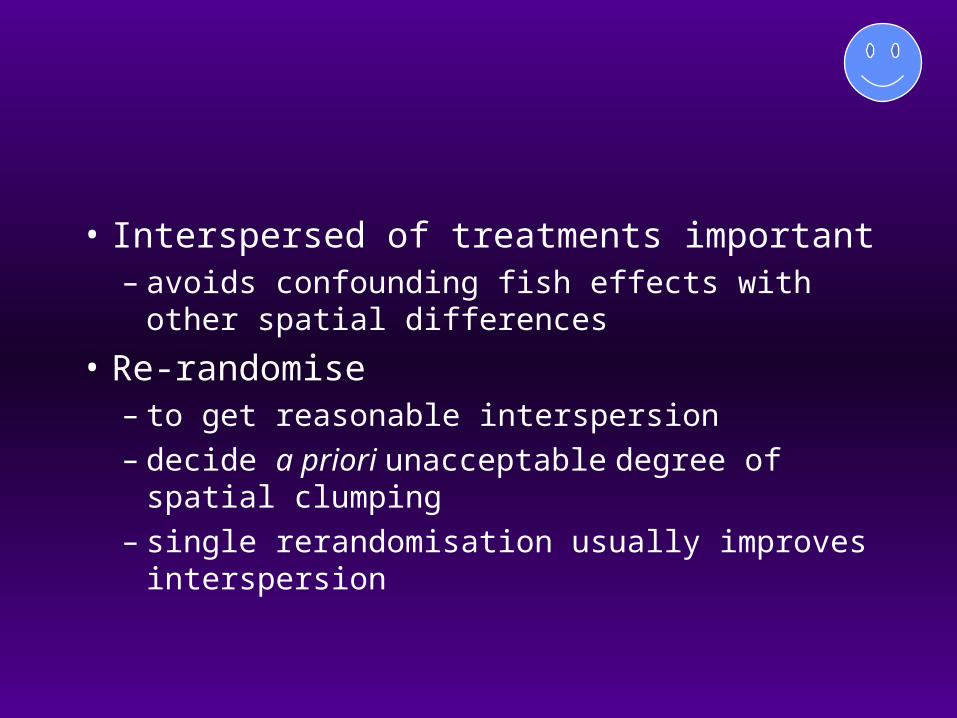
• Interspersed of treatments important– avoids confounding fish effects with other
spatial differences
• Re-randomise– to get reasonable interspersion– decide a priori unacceptable degree of spatial
clumping– single rerandomisation usually improves
interspersion
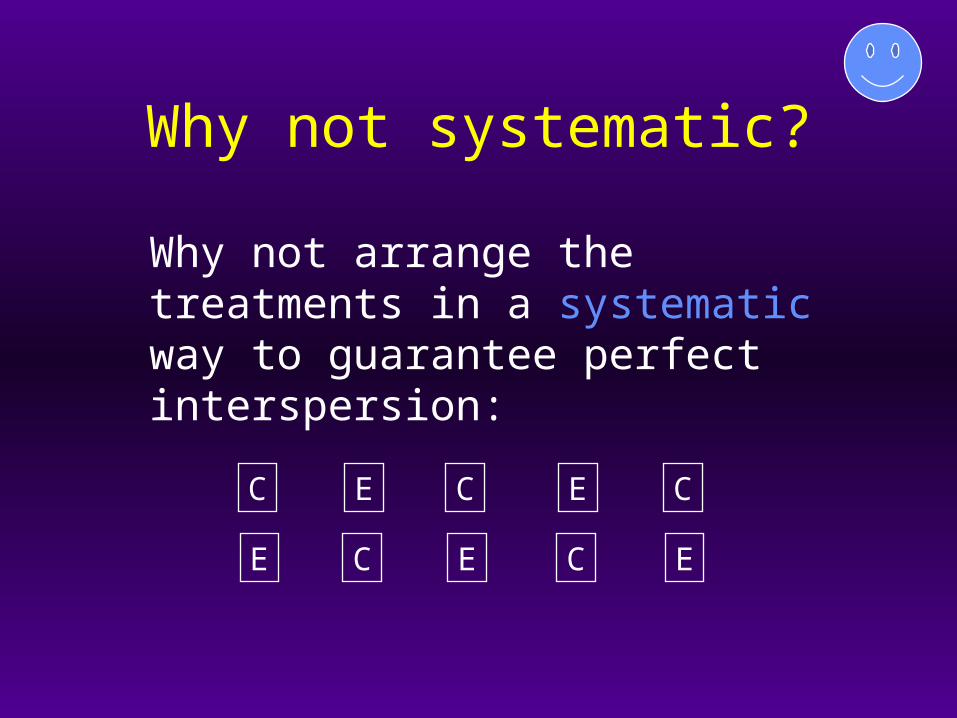
Why not systematic?
Why not arrange the treatments in a systematic way to guarantee perfect interspersion:
E
E
E
E
E
CC C
CC

Problems with systematic arrangement
• Positions of plots not random:– not random sample of any population?
• Non-random spacing interval between neighbouring treatments:– may coincide with unknown environmental
fluctuation– confound treatment effects

Experimental design and analysis
Statistical decisions and power analysis
Gerry Quinn & Mick Keough, 1998Do not copy or distribute without permission of authors.
Statistical decisions
• Conclusions of statistical hypothesis test– Reject null hypothesis– Do not reject null hypothesis

Statistical conclusion
Biologicalsituation
Reject Ho(Effect)
Retain Ho(No effect)
EffectHO false
Correct decisionEffect detected
No effectHO true
Correct decisionNo effect detected
None exists
Type I errorFalse rejection
Type II error Failure to detect an
effect
Decision errors

Decision errors
• Type I error ()– probability of false rejection of HO
– significance level (usually 0.05)
• Type II error ()– probability of false retention of HO
• Power of test
Power of test
• Probability of detecting an effect if it exists
• Probability of rejecting incorrect HO
• 1 -
Statistical power depends on
• Effect size (ES)– size of difference between treatments– large effects easier to detect than small
effects
• Background variation:– variation between experimental units (2
estimated by s2)– greater background variability, less likely to
detect effects
• Sample size (n) for each treatment group:– increasing sample size makes effects
easier to detect
• Significance level ():– Type I error rate– as decreases, increases, power
decreases

ESnPower (1-)
s2
If is fixed (usually at 0.05), then
ESnPower (1-)
s2
Power analysis
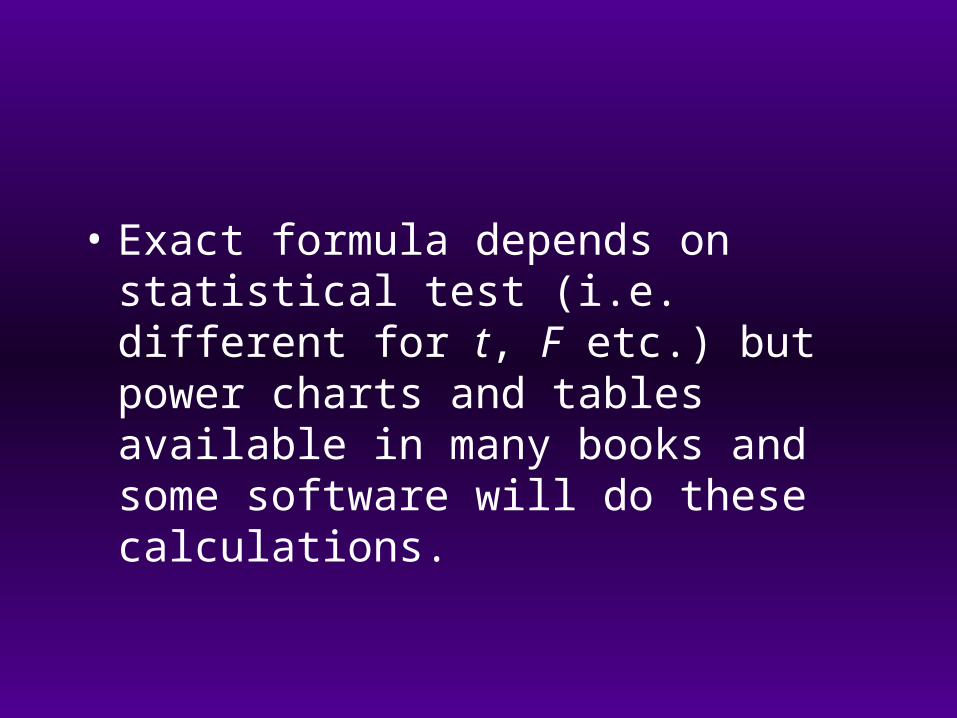
• Exact formula depends on statistical test (i.e. different for t, F etc.) but power charts and tables available in many books and some software will do these calculations.
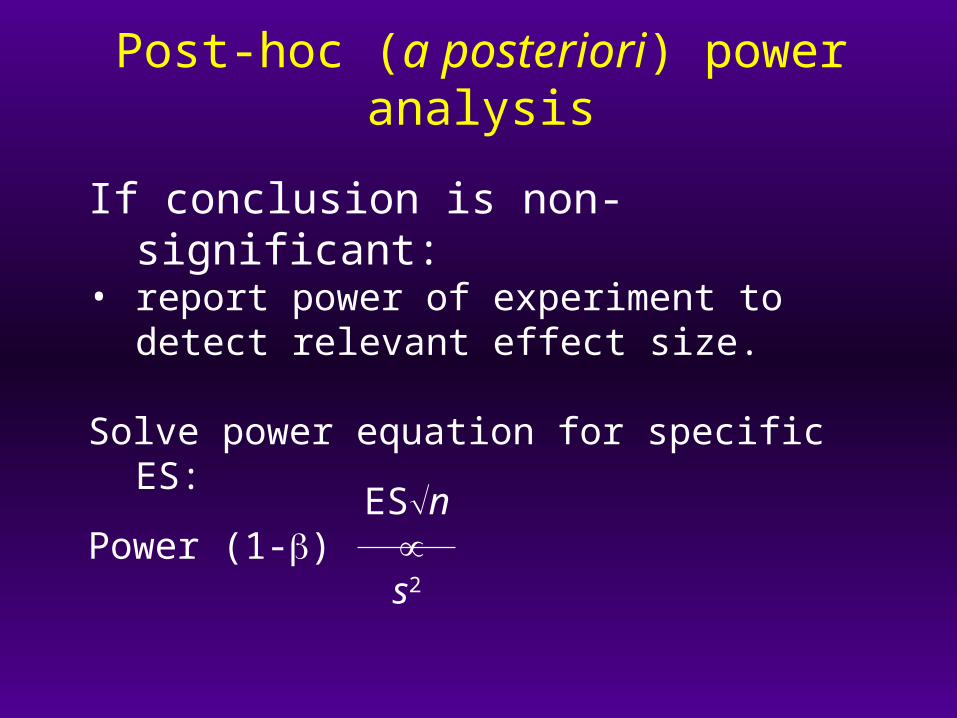
If conclusion is non-significant:• report power of experiment to detect relevant
effect size.
Solve power equation for specific ES:
Post-hoc (a posteriori) power analysis
ESnPower (1-)
s2

Karban (1993) Ecology 74:1-8
• Plant growth and reproduction in response to reduced herbivores.
• Two treatments:– normal herbivore damage– reduced herbivore damage– n = 31 plants in each treatment
• For plant growth: F1,60 = 0.51, P = 0.48 ns

Karban (1993) Ecology 74:1-8
Power to detect effects:
Small effect (ES = 0.1) 0.11Medium effect (ES = 0.25) 0.50Large effect (ES = 0.40) 0.88
Effect size (ES) = MSGroups / MSResidual
ie. SD Groups / SD Reps - see Cohen (1992)

A priori power analysis - sample size determination
To determine appropriate sample size a priori, we need to know:
• what power we want
• background variation (from pilot study or previous literature)
• what ES we wish to be able to detect if it occurs

Solve power equation for n
Power * s2
n ES

Example of a priori power analysis
• Effects of fish predation on mudflat crabs• Two treatments:
– cage vs cage control
• Pilot study:– number of crabs in 3 plots– variance was 19 (so s2 = 19)– mean was 20
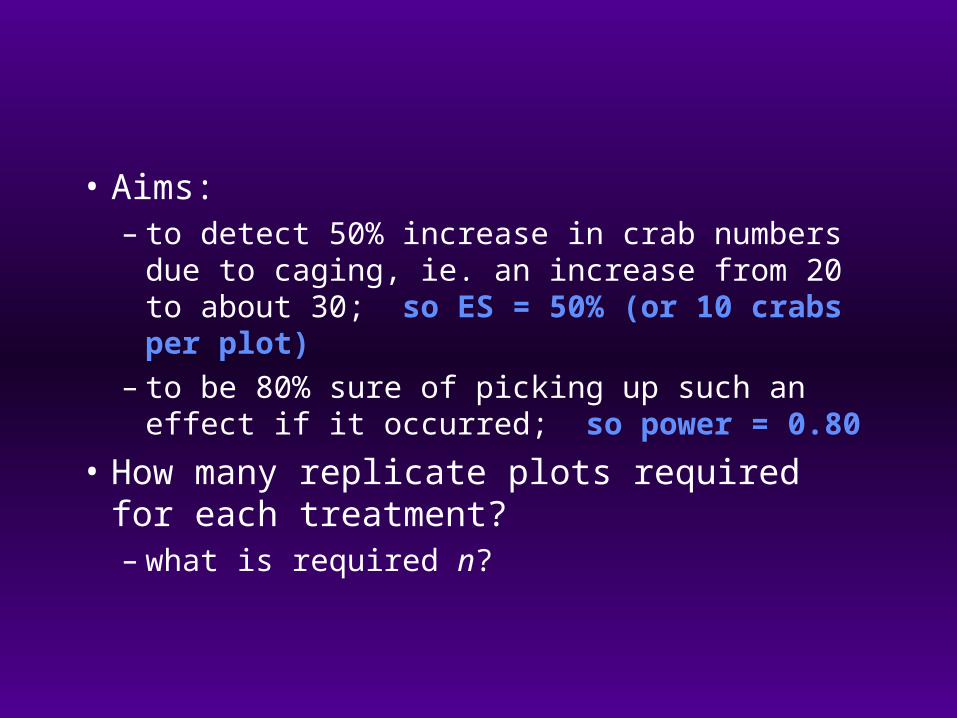
• Aims:– to detect 50% increase in crab numbers due to
caging, ie. an increase from 20 to about 30; so ES = 50% (or 10 crabs per plot)
– to be 80% sure of picking up such an effect if it occurred; so power = 0.80
• How many replicate plots required for each treatment? – what is required n?

Use version of power relationship for 1 factor ANOVAs:
Sample size Power2 0.2693 0.5754 0.7815 0.893
50% increase (mean 20 to mean 30)
We need 5 replicate plots per treatment to be 80% sure of detecting a 50% change in crab numbers if it occurs.

25% increase (mean 20 to mean 25)
Sample size Power2 0.1108 0.579
10 0.68912 0.77514 0.822
We need about 14 replicate plots per treatment to be 80% sure of detecting a 25% change in crab numbers if it occurs.

Effect size
• How big:– what size of effect is biologically important?– how big an effect do we want to detect if it
occurs?
• Where from?– biological knowledge– previous work/literature– compliance requirements (e.g. water quality)

Specification of effect size
• Easy for 2 groups:– difference between 2 means
• Harder for more than 2 groups:• Consider 3 groups:
– 50% difference from smallest to largest– 1 = 2 < 3?– 1 < 2 < 3?– 1 < 2 = 3?

Spare stuff

Principles of experimental design
• Replication– using more than one experimental or
sampling unit per treatment group
• Controls– what would have happened without
the experimental treatment

• Randomisation– populations must be randomly
sampled– treatments must be randomly allocated to
experimental units

• Reducing unexplained (residual) variation– recording additional independent
(explanatory or predictor) variables– multiple regression, multi-factor ANOVAs,
analysis of covariance, blocking
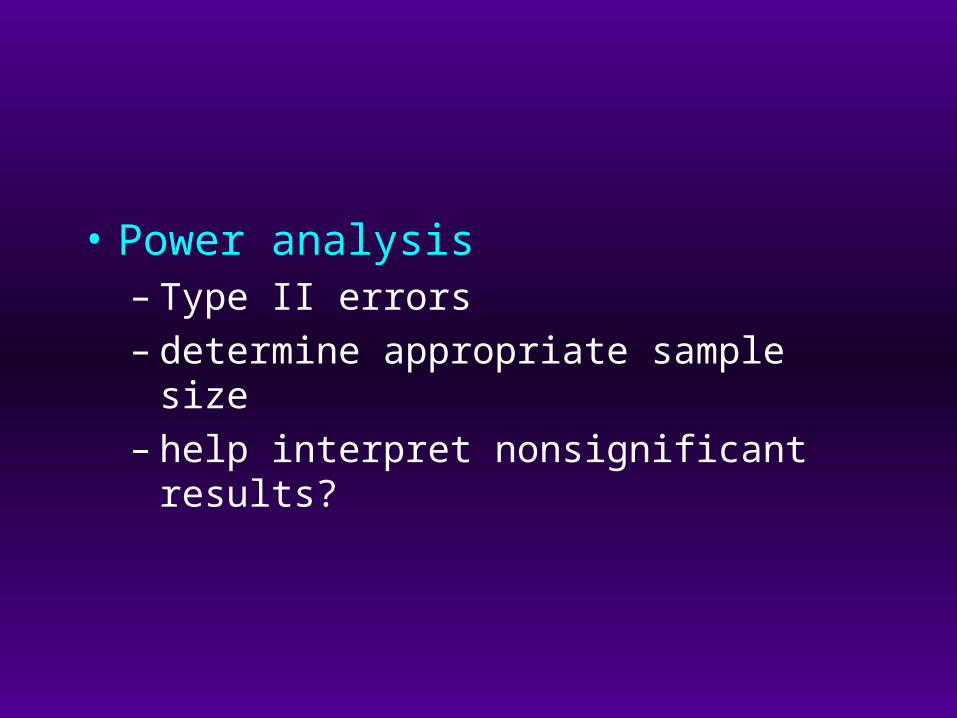
• Power analysis– Type II errors– determine appropriate sample size– help interpret nonsignificant results?
Temporal confounding• Effects of floods in streams on drifting
insects• Six artificial stream channels with drift
nets• Two treatments:
– high flow– normal flow
• Six replicates per treatment required

• Experiment at two times– six replicates of high flow at time 1– six replicates of normal flow at time 2
• Effects of flow are completely confounded with differences between the two times.
• Solution:– three replicates of each treatment at each
time– two factor experiment (treatment & time)
Ecological experiments II
• The effect of height on shore on gastropods– compare gastropods translocated to lower
levels with those left where they were.
• Differences between 2 groups of gastropods may be due to translocation effects– time off the rock, unfamiliar surroundings etc.

• Must use better controls:– control gastropods picked up and handled
in same way as transplocated animals– replaced at original height but in new place
• Additional control:– gastropods at original height that are not
moved– test for the effects of handling