Experimental and numerical simulation of the flow over a ... · A. Serafeimet al.254 Laboratory of...
8
European Water 57: 253-260, 2017. © 2017 E.W. Publications Experimental and numerical simulation of the flow over a spillway A. Serafeim * , L. Avgeris, V. Hrissanthou and K. Bellos Department of Civil Engineering, Democritus University of Thrace, Kimmeria Campus, 67100 Xanthi, Greece * e-mail: [email protected] Abstract: This paper presents the results of modeling the flow over a side-mounted Ogee type spillway using experimental and CFD (Computational Fluid Dynamics) methods, specifically Ansys - CFX. This research aims to use CFD model to validate the simulation of the flow over an Ogee type spillway which is installed in the Hydraulics Laboratory of Democritus University of Thrace. To achieve this pressure-based, transient simulation of the flow which involves an interaction between liquid water and air, the Volume of Fluid (VoF) and the standard “κ-ε” turbulence numerical models, with standard wall functions, were used, which simulate the free surface of two-phase flow and the flow turbulence, respectively. Three individual meshes with different density in computational cells were created (coarse, medium and dense) using prismatic and tetrahedral elements. Numerical results of the volume fractions, velocity and water depths were plotted for various positions across the spillway and were discussed through a validation process by comparing the CFD model results with the results obtained from physical model. Even though some slight differences between numerical and experimental results were revealed, the graphical trends of the numerical results remain reasonably similar for all experimental tests, and had a close correlation to those achieved in the physical model. Key words: Ogee type spillway, experimental simulation, numerical simulation, CFD, Ansys Fluent, VoF 1. INTRODUCTION There are plenty methods to determine the water flow conditions at hydraulic structures. One way of achieving this determination is to conduct field measurements. However, this method is time consuming and sets as a premise the existence of the structure. An alternative method is the use of experimental simulations which require large buildings to be installed, and the installation and the maintenance of the model might be proved expensive. Finally, the most inexpensive and least time consuming method for determining the water flow conditions is the numerical simulation by using Computational Fluid Dynamics (CFD) (Kanyabujinja, 2015 and Kumcu, 2017). This method, besides the need of a powerful computer, has not any specific constraints, and is one of the most promising methods to validate the flow conditions observed either during field measurements or during laboratory experiments. The general purpose of this paper is the investigation of water flow conditions over a side- mounted Ogee type spillway by using experimental and CFD methods. The experimental model, built in the Hydraulics Laboratory, Department of Civil Engineering, Democritus University of Thrace, and the CFD Ansys Fluent software were used to determine the flow conditions over the spillway at the dam of Berkeche stream, in Ain Temouchent province, Algeria. The project was tested for three water flow rates, corresponding to different recurrence intervals. The physical model was constructed using the similarity law of Froude – Manning, and the results from the numerical simulation arose by using the multiphase model Volume of Fluid (VoF) in combination with the κ-ε turbulence model. 2. EXPERIMENTAL METHOD 2.1 Experimental set-up and similarity functions Experiments were carried out by Avgeris et al. (2015) in a built-in model, in Hydraulics
Transcript of Experimental and numerical simulation of the flow over a ... · A. Serafeimet al.254 Laboratory of...

European Water 57: 253-260, 2017. © 2017 E.W. Publications
Experimental and numerical simulation of the flow over a spillway
A. Serafeim*, L. Avgeris, V. Hrissanthou and K. Bellos Department of Civil Engineering, Democritus University of Thrace, Kimmeria Campus, 67100 Xanthi, Greece * e-mail: [email protected]
Abstract: This paper presents the results of modeling the flow over a side-mounted Ogee type spillway using experimental and CFD (Computational Fluid Dynamics) methods, specifically Ansys - CFX. This research aims to use CFD model to validate the simulation of the flow over an Ogee type spillway which is installed in the Hydraulics Laboratory of Democritus University of Thrace. To achieve this pressure-based, transient simulation of the flow which involves an interaction between liquid water and air, the Volume of Fluid (VoF) and the standard “κ-ε” turbulence numerical models, with standard wall functions, were used, which simulate the free surface of two-phase flow and the flow turbulence, respectively. Three individual meshes with different density in computational cells were created (coarse, medium and dense) using prismatic and tetrahedral elements. Numerical results of the volume fractions, velocity and water depths were plotted for various positions across the spillway and were discussed through a validation process by comparing the CFD model results with the results obtained from physical model. Even though some slight differences between numerical and experimental results were revealed, the graphical trends of the numerical results remain reasonably similar for all experimental tests, and had a close correlation to those achieved in the physical model.
Key words: Ogee type spillway, experimental simulation, numerical simulation, CFD, Ansys Fluent, VoF
1. INTRODUCTION
There are plenty methods to determine the water flow conditions at hydraulic structures. One way of achieving this determination is to conduct field measurements. However, this method is time consuming and sets as a premise the existence of the structure. An alternative method is the use of experimental simulations which require large buildings to be installed, and the installation and the maintenance of the model might be proved expensive. Finally, the most inexpensive and least time consuming method for determining the water flow conditions is the numerical simulation by using Computational Fluid Dynamics (CFD) (Kanyabujinja, 2015 and Kumcu, 2017). This method, besides the need of a powerful computer, has not any specific constraints, and is one of the most promising methods to validate the flow conditions observed either during field measurements or during laboratory experiments.
The general purpose of this paper is the investigation of water flow conditions over a side-mounted Ogee type spillway by using experimental and CFD methods. The experimental model, built in the Hydraulics Laboratory, Department of Civil Engineering, Democritus University of Thrace, and the CFD Ansys Fluent software were used to determine the flow conditions over the spillway at the dam of Berkeche stream, in Ain Temouchent province, Algeria.
The project was tested for three water flow rates, corresponding to different recurrence intervals. The physical model was constructed using the similarity law of Froude – Manning, and the results from the numerical simulation arose by using the multiphase model Volume of Fluid (VoF) in combination with the κ-ε turbulence model.
2. EXPERIMENTAL METHOD
2.1 Experimental set-up and similarity functions
Experiments were carried out by Avgeris et al. (2015) in a built-in model, in Hydraulics

A. Serafeim et al. 254
Laboratory of Civil Engineering Department, Democritus University of Thrace. This project consists of the reservoir, the spillway, the side collection canal, the transfer canal, the stilling basin and the tailrace. The experimental model was tested for three flow rates; 245 m3/s, 500 m3/s and 670 m3/s corresponding to recurrence intervals of 100, 1000 and 5000 years, respectively (Table 1).
The construction of the model and the laboratory tests were performed with a 1:50 scale between the model and the prototype and in accordance with the similarity law of Froude – Manning. A full geometric and dynamic similarity between prototype and model can only be achieved when the Froude and Reynolds numbers are equal. However, for free surface flows, the inertial and gravitational similarities could be achieved if the equality of Froude number is maintained and Reynolds number is greater than 2000. Therefore, by choosing the equality of Froude number as a criterion of dynamic similarity, a satisfactory representation of the water depths, the hydrostatic pressures and the flow conditions can be achieved (Bellos, 2010). To achieve this similarity, the following Equations (1) – (4) were used:
2.5r rQ L= (1)
12
r rV L= (2)
12
r rt L= (3)
16
r rn L= (4)
where Qm and Qp are the water flow rates in the model and the prototype, respectively, Qr is the flow rate scale (Qm/Qp), Lr is the length scale, Vr is the velocity scale, tr is the time scale, and nr is the Manning coefficient scale.
By applying the scale 1:50, the ratio of model lengths to prototype lengths is:
1 50rL = (5)
Consequently, based on the above equations, the scales Qr, Vr and tr obtain the following values:
1 17700rQ ≈ (6)
1 7rV ≈ (7)
1 7rt ≈ (8)
In Table 1, the model values Qm are also given.
2.2 Experimental measurements
Measurements of water flow rate, water depth and pressure were made at several sections along the experimental set-up, including the reservoir, the spillway and the stilling basin. However, this paper deals only with the spillway and water flow conditions over it. Specifically, instantaneous measurements of the water flow depth in the downstream side collection canal were performed.
European Water 57 (2017) 255
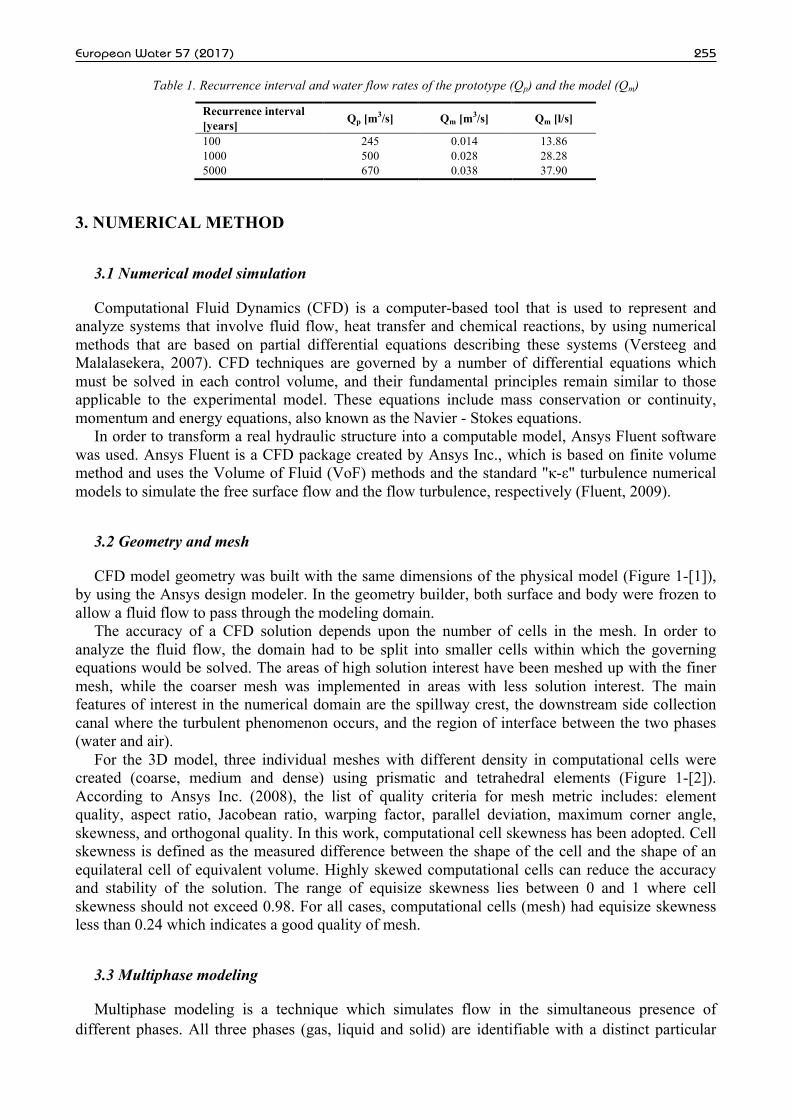
Table 1. Recurrence interval and water flow rates of the prototype (Qp) and the model (Qm)
Recurrence interval [years] Qp [m3/s] Qm [m3/s] Qm [l/s]
100 245 0.014 13.86 1000 500 0.028 28.28 5000 670 0.038 37.90
3. NUMERICAL METHOD
3.1 Numerical model simulation
Computational Fluid Dynamics (CFD) is a computer-based tool that is used to represent and analyze systems that involve fluid flow, heat transfer and chemical reactions, by using numerical methods that are based on partial differential equations describing these systems (Versteeg and Malalasekera, 2007). CFD techniques are governed by a number of differential equations which must be solved in each control volume, and their fundamental principles remain similar to those applicable to the experimental model. These equations include mass conservation or continuity, momentum and energy equations, also known as the Navier - Stokes equations.
In order to transform a real hydraulic structure into a computable model, Ansys Fluent software was used. Ansys Fluent is a CFD package created by Ansys Inc., which is based on finite volume method and uses the Volume of Fluid (VoF) methods and the standard "κ-ε" turbulence numerical models to simulate the free surface flow and the flow turbulence, respectively (Fluent, 2009).
3.2 Geometry and mesh
CFD model geometry was built with the same dimensions of the physical model (Figure 1-[1]), by using the Ansys design modeler. In the geometry builder, both surface and body were frozen to allow a fluid flow to pass through the modeling domain.
The accuracy of a CFD solution depends upon the number of cells in the mesh. In order to analyze the fluid flow, the domain had to be split into smaller cells within which the governing equations would be solved. The areas of high solution interest have been meshed up with the finer mesh, while the coarser mesh was implemented in areas with less solution interest. The main features of interest in the numerical domain are the spillway crest, the downstream side collection canal where the turbulent phenomenon occurs, and the region of interface between the two phases (water and air).
For the 3D model, three individual meshes with different density in computational cells were created (coarse, medium and dense) using prismatic and tetrahedral elements (Figure 1-[2]). According to Ansys Inc. (2008), the list of quality criteria for mesh metric includes: element quality, aspect ratio, Jacobean ratio, warping factor, parallel deviation, maximum corner angle, skewness, and orthogonal quality. In this work, computational cell skewness has been adopted. Cell skewness is defined as the measured difference between the shape of the cell and the shape of an equilateral cell of equivalent volume. Highly skewed computational cells can reduce the accuracy and stability of the solution. The range of equisize skewness lies between 0 and 1 where cell skewness should not exceed 0.98. For all cases, computational cells (mesh) had equisize skewness less than 0.24 which indicates a good quality of mesh.
3.3 Multiphase modeling
Multiphase modeling is a technique which simulates flow in the simultaneous presence of different phases. All three phases (gas, liquid and solid) are identifiable with a distinct particular

A. Serafeim et al. 256
inertial response to an interaction with the flow and the potential field. There are four main categories of multiphase flows; gas-liquid, gas-solid, liquid-solid and three-phase flows (Murrone and Villedieu, 2011). Such complex systems have been made possible with the availability of two broad approaches for the numerical calculation, namely Euler-Euler (Volume of Fluid model or VoF model) and Euler-Lagrange (Discrete Phase Model) approaches. The Volume of Fluid model (VoF) was chosen to simulate the multiphase flow. Two Eulerian phases, air and water, were defined as primary and secondary phase, respectively.
Figure 1. [1]: Three - dimensional CFD model geometry, SW and SE view. [2]: Three - dimensional CFD model mesh, SW and SE view.
4. RESULTS
The investigations conducted in the physical and numerical modeling were focused on the validation of the flow conditions over an Ogee type spillway from the physical modeling through a comparison of results obtained for equivalent flow rates of CFD modeling.
In the spillway model, water surface profiles of each flow rate were investigated along the spillway chute from upstream to downstream of the spillway. It should be noted that the water surface profiles obtained along the spillway refer to the flow depth measured in the downstream side collection canal. The water profiles are presented in Figures 2-[1], 2-[2] and 2-[3] and the constant line represents the readings obtained through physical modeling, while the solid fills of the charts demonstrate the results obtained through CFD modeling.
Three individual surface planes where created for the detailed display of the numerical results. The exact locations are 0.1, 0.6 and 1.1 meters from the upper side of the spillway.
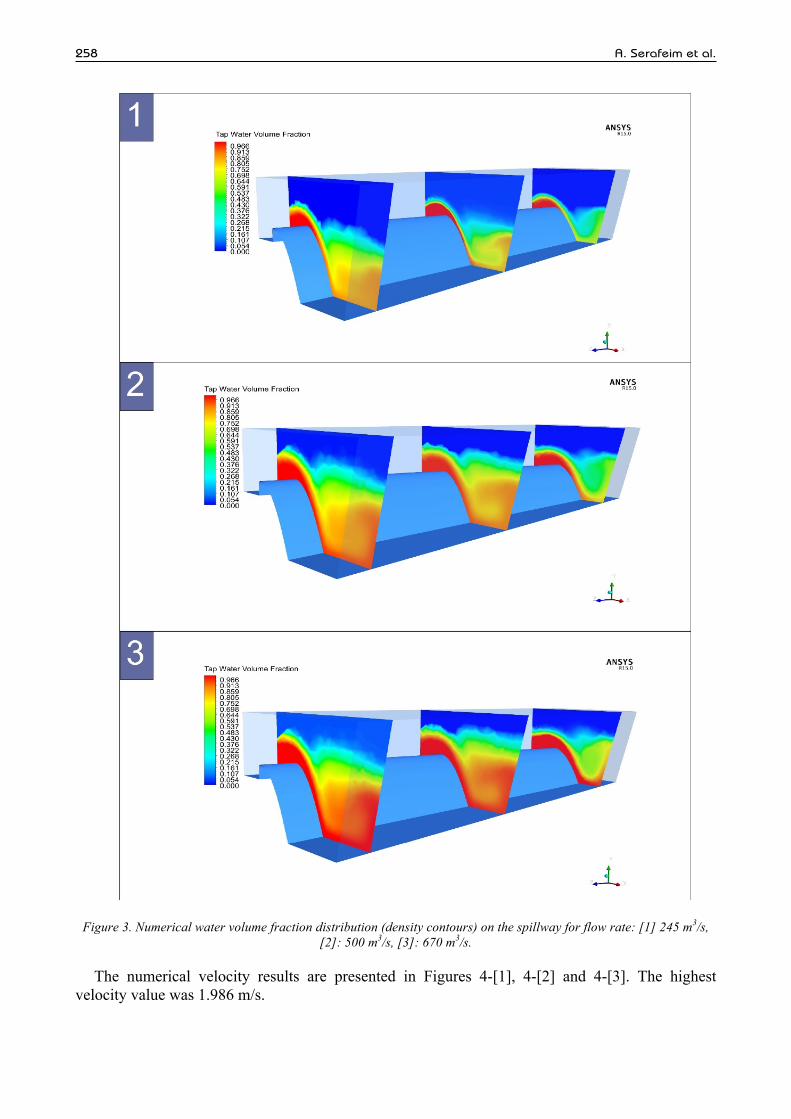
In the spillway numerical analysis, volume fractions cases for both primary and secondary Eulerian phases were examined. The secondary phase (fluid tap water) volume fraction results are presented in Figures 3-[1], 3-[2] and 3-[3].

European Water 57 (2017) 257
Figure 2. A comparison of water profiles downstream of the spillway which were formed through the experimental and numerical simulation for flow rate: [1] 245 m3/s, [2]: 500 m3/s, [3]: 670 m3/s.
A. Serafeim et al. 258
Figure 3. Numerical water volume fraction distribution (density contours) on the spillway for flow rate: [1] 245 m3/s, [2]: 500 m3/s, [3]: 670 m3/s.
The numerical velocity results are presented in Figures 4-[1], 4-[2] and 4-[3]. The highest velocity value was 1.986 m/s.

European Water 57 (2017) 259
Figure 4. Numerical velocity distribution (density contours) on the spillway for flow rate: [1] 245 m3/s, [2]: 500 m3/s, [3]: 670 m3/s.
5. CONCLUSIONS
A study of flow interaction with scaled model of a side-mounted Ogee shape spillway was presented. A fully three-dimensional CFD model was set up and the numerical model was validated against experimental information. Most of the simulation results are found to be in reasonable agreement with the experimental ones. The outcomes of the simulations permitted the evaluation of the designed structures.
The study of the flow surcharge at different flow rates indicated that the water surface profiles obtained from CFD modeling are similar to the physical model.
Numerical results of water volume fraction and velocity are reasonable and interrelated both with water profiles downstream of the spillway.
A. Serafeim et al. 260
Based on the numerical results, the design of the Ogee shape spillway was found to be appropriate for all simulation conditions. Although physical model studies may be more expensive and time consuming than computational modeling, they are still crucial for providing data for numerical model calibration and validation studies. The unique combination of computational expertise with physical flow modeling can be applied in order to provide cost effective, practical solutions to spillway flow problems. Thus, CFD modeling can be used as a complementary tool along with physical modeling to solve complex flow problems of spillways.
REFERENCES
Avgeris, L., Bellos, V., Xiloudis, N., Papalexopoulos, V., Bensasson, A. and Bellos, K., 2015. Experimental simulation of spillway at Berkeche dam. Proceedings of the 3rd Joint Conference, 13th Conference of the Greek Hydrotechnical Association, 9th Conference of the Greek Committee for Water Resources Management and 1st Conference of the Hellenic Water Association, Athens, Greece, 10-12/12/2015, pp. 403-410 (in Greek).
Bellos, K., 2010. Open-Channel Hydraulics. Department of Civil Engineering, Democritus University of Thrace, Xanthi, Greece (in Greek).
Fluent, 2008. Ansys Fluent 6.3 User's guide. Ansys Inc., USA. Fluent, 2009. Ansys Fluent 12.0 Theory Guide, S.1. Ansys Inc., USA. Kanyabujinja, P. N., 2015. CFD Modelling of Ogee Spillway Hydraulics and Comparison with Physical Model Tests. Master of
Engineering Thesis, Stellenbosch University, Stellenbosch, Western Cape, South Africa. Kumcu, S. Y., 2017. Investigation of Flow Over Spillway Modeling and Comparison between Experimental Data and CFD Analysis.
KSCE Journal of Civil Engineering, 21(3), 994–1003. Murrone, A. and Villedieu, P., 2011. Numerical Modeling of Dispersed Two-Phase Flows. Aerospace Lab. Versteeg, H. and Malalasekera, W., 2007. An introduction to Computational Fluid Dynamics: The finite volume method. Prentice
Hall, Harlow, England.