ESTIMATION AND COMPARISON OF POTENTIAL … · Democritus University of Thrace Pantazidou str. 192,...
14
Global NEST Journal, Vol 16, No 2, pp 204-217, 2014 Copyright© 2014 Global NEST Printed in Greece. All rights reserved ESTIMATION AND COMPARISON OF POTENTIAL EVAPOTRANSPIRATION BASED ON DAILY AND MONTHLY DATA FROM SPERCHIOS VALLEY IN CENTRAL GREECE PAPARRIZOS S. 1,* 1 Albert-Ludwigs University MARIS F. 2 Werthmannstr 10, D-79085, Freiburg, Germany MATZARAKIS A. 1 2 Department of Forestry and Management of the Environment and Natural Resources Democritus University of Thrace Pantazidou str. 192, GR-68 200, Orestiada, Greece Received: 17/09/13 *to whom all correspondence should be addressed: Accepted: 23/12/13 e-mail: [email protected] ABSTRACT There is no golden rule concerning the optimal equations to estimate reference potential evapotranspiration (PET ref ) under various climates because even in the same climatic type, different studies have produced mixed results in relation to the performance of the empirical PET ref equations. Knowledge of reference potential evapotranspiration (PET ref ) conditions is important for a number of vegetation and hydrological related applications. Direct estimations of PET ref are difficult and require sophisticated instrumentation and methods. The equations of estimating potential evapotranspiration require several meteorological variables (e.g. solar radiation, wind speed), which most of the times are rarely available in daily values for the Greek meteorological stations. In the current research there is an attempt to estimate the potential evapotranspiration with EmPEst software which includes 13 different approaches, using daily and monthly data of the meteorological station of Lamia which is located within Sperchios river valley in central Greece. Finally, by the use of the statistical indicators that occur as an output from the software, there is a comparison and analysis of the exported results. The differentiations of the results showed which PET methods and series data (daily - monthly) were more suitable for the estimation of PET in the area of research. KEYWORDS: PET, EmPEst, meteorological data, Sperchios, Greece. 1. INTRODUCTION Evaporation is a major component of the hydrologic cycle and its estimate is widely used in hydrologic and irrigation engineering applications. Its accurate estimation is required for many studies, such as hydrologic water balance, water resources planning and management, and irrigation scheduling. Evaporation direct measurement techniques are not recommended for routine hydrological engineering applications because they imply a time consuming procedure requiring expensive equipment in order to obtain precise and carefully designed experiments (Valiantzas, 2006). Land surface evapotranspiration (ET) transfers large volumes of water from soil (evaporation) and vegetation (transpiration) to the atmosphere. Quantifying the consumption of water over large areas and within irrigated projects is important for water rights management, water resources planning, hydrologic water balances and water regulation (Allen et al., 2007). Potential evapotranspiration (PET) is defined as the amount of water that can potentially evaporate and transpire from a vegetated surface with no restrictions other than the atmospheric demand (Lu et al., 2005). PET provides a good representation of the maximum possible water loss to the atmosphere. Knowledge of PET rates is essential for a variety of applications, including hydrological modeling, irrigation planning, geo-botanical studies, and estimation of sensitive-to-climatic change
Transcript of ESTIMATION AND COMPARISON OF POTENTIAL … · Democritus University of Thrace Pantazidou str. 192,...

Global NEST Journal, Vol 16, No 2, pp 204-217, 2014 Copyright© 2014 Global NEST
Printed in Greece. All rights reserved
ESTIMATION AND COMPARISON OF POTENTIAL EVAPOTRANSPIRATION BASED ON DAILY AND MONTHLY DATA FROM SPERCHIOS VALLEY IN
CENTRAL GREECE
PAPARRIZOS S.1,* 1Albert-Ludwigs University
MARIS F.2 Werthmannstr 10, D-79085, Freiburg, Germany
MATZARAKIS A.1 2Department of Forestry and Management of
the Environment and Natural Resources
Democritus University of Thrace
Pantazidou str. 192, GR-68 200, Orestiada, Greece
Received: 17/09/13 *to whom all correspondence should be addressed:
Accepted: 23/12/13 e-mail: [email protected]
ABSTRACT There is no golden rule concerning the optimal equations to estimate reference potential evapotranspiration (PETref) under various climates because even in the same climatic type, different studies have produced mixed results in relation to the performance of the empirical PETref equations. Knowledge of reference potential evapotranspiration (PETref) conditions is important for a number of vegetation and hydrological related applications. Direct estimations of PETref are difficult and require sophisticated instrumentation and methods. The equations of estimating potential evapotranspiration require several meteorological variables (e.g. solar radiation, wind speed), which most of the times are rarely available in daily values for the Greek meteorological stations. In the current research there is an attempt to estimate the potential evapotranspiration with EmPEst software which includes 13 different approaches, using daily and monthly data of the meteorological station of Lamia which is located within Sperchios river valley in central Greece. Finally, by the use of the statistical indicators that occur as an output from the software, there is a comparison and analysis of the exported results. The differentiations of the results showed which PET methods and series data (daily - monthly) were more suitable for the estimation of PET in the area of research.
KEYWORDS: PET, EmPEst, meteorological data, Sperchios, Greece. 1. INTRODUCTION Evaporation is a major component of the hydrologic cycle and its estimate is widely used in hydrologic and irrigation engineering applications. Its accurate estimation is required for many studies, such as hydrologic water balance, water resources planning and management, and irrigation scheduling. Evaporation direct measurement techniques are not recommended for routine hydrological engineering applications because they imply a time consuming procedure requiring expensive equipment in order to obtain precise and carefully designed experiments (Valiantzas, 2006).
Land surface evapotranspiration (ET) transfers large volumes of water from soil (evaporation) and vegetation (transpiration) to the atmosphere. Quantifying the consumption of water over large areas and within irrigated projects is important for water rights management, water resources planning, hydrologic water balances and water regulation (Allen et al., 2007).
Potential evapotranspiration (PET) is defined as the amount of water that can potentially evaporate and transpire from a vegetated surface with no restrictions other than the atmospheric demand (Lu et al., 2005). PET provides a good representation of the maximum possible water loss to the atmosphere. Knowledge of PET rates is essential for a variety of applications, including hydrological modeling, irrigation planning, geo-botanical studies, and estimation of sensitive-to-climatic change

ESTIMATION AND COMPARISON OF POTENTIAL EVAPOTRANSPIRATION 205
aridity indexes. Although the PET concept is applied in a wide spectrum of applications, the term is considered a source of confusion because of the vague definition of “vegetated surface”. To overcome this problem, the term PET has gradually been replaced by “reference potential evapotranspiration” (PETref), for which the characteristics of the vegetated surface have been standardized. The Food and Agriculture Organization (FAO) Expert Consultation of Revision of FAO Methodologies of Crop Water Requirements accepted the following definition of the reference surface: “A hypothetical reference crop with an assumed crop height of 0.12 m, a fixed surface resistance of 70 s m
-1 and an albedo of 0.23” (Allen et al.,1998). Consequently, PETref is defined as
the amount of water that can potentially evaporate and transpire from a reference crop with no restrictions other than the atmospheric demand.
Papazafiriou (1984) reported that the modified FAO Penman-Monteith method can satisfactorily estimate the reference evapotranspiration over the most regions in Greece. However, even this method tends to generate overestimations of PETref during summer months, and underestimations during the winter months (Dalezios et al., 2002).
Regarding to Penman-Monteith method, extensive research was done in Greece while the latest studies (Valiantzas (2013a, 2013b, 2013c) have managed to simplify at a great scale this estimation, even when the available data are very limited.
Valiantzas (2012) and Exner-Kittridge (2010) concluded that if the addition of RH measurements to the air temperature data, T, improve the accuracy of the ET0 estimation, then the cost effectiveness of a RH - T method could increase dramatically compared to other alternatives of limited set of data methods (requiring additional u and/or Rs instrument sensors), due to the extremely low additional cost of the RH sensor. Therefore, further simplifications on the FAO-56 Penman–Monteith formula were made leading to a temperature–humidity based formula not requiring u and RS data measurements. The performance of the derived formulas for estimating reference crop evapotranspiration is also tested (Valiantzas, 2013d).
Reference potential evapotranspiration (PETref) estimates are important input variables for various hydrological, agricultural, and vegetation science applications. Actual measurement of PETref is a difficult and expensive process and requires well-trained research personnel (Allen et al., 1998).
Related to the modeling of the impacts of a changing climate, attainment about evapotranspiration is of arbitrative interest for an adequate appraisement of changes within ecosystems over the time and here from deducible risks. In areas where irrigation is a major component of agriculture due to low precipitation, it is also of economic importance to ascertain PET as accurately as possible; in fact that PET is in these regions the most significant component of the hydrological budget together with precipitation (Alexandris et al., 2008).
Regarding agriculture, which is the major activity of the local population in Sperchios river valley, PET plays a very important role in their processes and activities. The crop type, variety and development stage should be considered when assessing the evapotranspiration from crops grown in large, well-managed fields. Differences in resistance to transpiration, crop height, crop roughness, reflection, ground cover and crop rooting characteristics result in different ET levels in different types of crops under identical environmental conditions. Crop evapotranspiration under standard conditions (ETc) refers to the evaporating demand from crops that are grown in large fields under optimum soil water, excellent management and environmental conditions, and achieve full production under the given climatic conditions (Allen et al., 1998).
Due to the high complexity, which is necessary to measure humidification we have to resort to mathematical functions for the determination of PET. These functions are often the only possibility to accomplish detailed analysis and modeling (Gebhart et al., 2012).
This work is focused on the estimation and analysis of 13 different PETref equations for one meteorological station in the region of Sperchios river valley, in central Greece. It is the first attempt for the estimation of the potential evapotranspiration in this area and it estimates and compares the PET, based on daily and monthly data in order to spot its differences and limitations in their results. For the calculation of the equation the software EmPEst was used (Kostinakis et al., 2011). Statistical analysis was made by EmPEst for PETref equations output data. Moreover a comparison of some statistical indicators is performed for daily and monthly values.
206 PAPARIZOS et al.
2. RESEARCH AREA AND METHODOLOGY
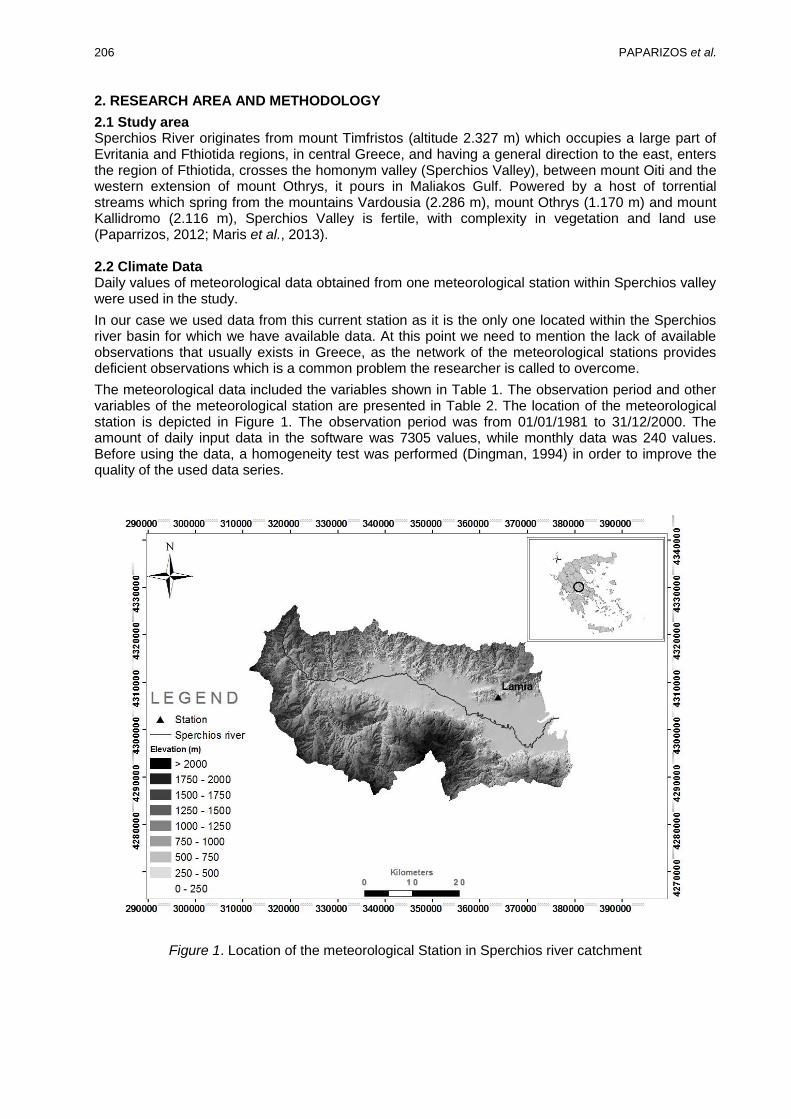
2.1 Study area Sperchios River originates from mount Timfristos (altitude 2.327 m) which occupies a large part of Evritania and Fthiotida regions, in central Greece, and having a general direction to the east, enters the region of Fthiotida, crosses the homonym valley (Sperchios Valley), between mount Oiti and the western extension of mount Othrys, it pours in Maliakos Gulf. Powered by a host of torrential streams which spring from the mountains Vardousia (2.286 m), mount Othrys (1.170 m) and mount Kallidromo (2.116 m), Sperchios Valley is fertile, with complexity in vegetation and land use (Paparrizos, 2012; Maris et al., 2013). 2.2 Climate Data Daily values of meteorological data obtained from one meteorological station within Sperchios valley were used in the study.
In our case we used data from this current station as it is the only one located within the Sperchios river basin for which we have available data. At this point we need to mention the lack of available observations that usually exists in Greece, as the network of the meteorological stations provides deficient observations which is a common problem the researcher is called to overcome.
The meteorological data included the variables shown in Table 1. The observation period and other variables of the meteorological station are presented in Table 2. The location of the meteorological station is depicted in Figure 1. The observation period was from 01/01/1981 to 31/12/2000. The amount of daily input data in the software was 7305 values, while monthly data was 240 values. Before using the data, a homogeneity test was performed (Dingman, 1994) in order to improve the quality of the used data series.
Figure 1. Location of the meteorological Station in Sperchios river catchment
ESTIMATION AND COMPARISON OF POTENTIAL EVAPOTRANSPIRATION 207
Table 1. Meteorological variables (daily data) collected by Lamia station in study area
Variable Description
Tmean Daily mean air temperature at 2 m above ground (°C)
Tmin Minimum air temperature (°C)
Tmax Maximum air temperature (°C)
Td Dew-point temperature (°C)
RH Relative humidity (%)
U2 Wind velocity at 2 m above ground (m s-1
)
Table 2. Location and Observation Period of Lamia station; Geographic Coordinates are in Decimal
Degrees; Projection System: WGS84
Station Lamia
Elevation 144 m
Latitude 38o 51'
Longtitude 22o 24'
Observation Period 1981 - 2000
2.3 EmPEst software The EmPEst (empirical potential evapotranspiration estimation) (Xystrakis and Kostinakis, 2010) is a simple software that can estimate daily PETref by means of 13 different empirical equations, and if user wishes and depending on data availability, can calculate daily values of five different statistical measures for the evaluation of the empirical equations regarding the estimates obtained by the PETASCE equation (ASCE Task Committee, 2005). The user can choose the type of crop (short or tall) so that the software will use the appropriate parameters in the PETASCE equation. The empirical PETref equations included in the software cover a wide spectrum of input data requirements. Equations that require only daily air temperature and equations that require daily air temperature, radiation, and relative humidity as input variables are provided. The number of equations that will finally produce PETref estimates depends on data availability. 2.4 Statistical indicators The performance of the empirical equations was assessed by using calculations from several goodness-of-fit statistics (StatSoft, 2007). The measures applied to evaluate the performance of the empirical equations were: Mean square error (MSE)
∑ ( i i)2
i 1
1
(1)
Mean absolute error (MAE)
∑ i i
i 1
1
(2)
Relative mean square error (RMSE)
∑ ( i i
i)2
i 1
1
(3)
208 PAPARIZOS et al.
Relative mean absolute error (RMAE)
∑ i i
i
i 1
1
(4)
Mean bias error (MBE)
∑ ( i i
i 1
1
(5)
where: N = number of observations
Ei = values from empirical equations
Oi = respective values from PETFAO equation.
These (or similar) statistical procedures have been widely discussed in the relevant literature (Jacovides, 1998; Jacovides and Kontoyiannis 1995; Knotters and Voshaar 1998; Willmott, 1982; Willmott, 1984; Willmott et al., 1985) and have proven to be important for the evaluation of the performance of empirical PETref equations. 2.5 Methodology Thirteen reference potential evapotranspiration models including the approaches of Hargreaves (Allen et al., 1998; Oudin et al., 2005), McGuiness (Oudin et al., 2005), Jensen (Jensen and Haise, 1963; Rosenberry et al., 2004), Hansen (Xu and Singh, 2002), Caprio (Caprio, 1974), Romanenko (Oudin et al., 2005), Turc (Lu et al., 2005), Makkink (Rosenberry et al., 2004), de Bruin (Rosenberry et al., 2004), McCloud (Jacobs and Satti, 2001; Irmak et al., 2003) and three versions of Hamons approach where calculated under the use of EmPEst (Kostinakis et al., 2011; Xystrakis and Matzarakis, 2011). For statistical evaluation of the model performance mean absolute error (MAE), mean relative square error (MRSE), mean relative absolute error (MRAE), mean bias error (MBE) and root mean square error (RMSE) where used, as mentioned above. It is evident that all the used methods of the uncertainty analysis cannot make any statement about the significance of model performance. In other words, the methods mentioned above exist in order to check the correlation between a set of numbers from a particular sample and find possible ambiguities, not to test the reliability of model performance. To take account of this fact, PETref was estimated using daily and monthly data and it was used to determine further information on model performance and in order to evaluate which time data series (daily - monthly) will respond better, regarding to the results of EmPEst software.
Additionally, the RayMan model (Matzarakis et al., 2007) was used, in order to calculate some of the inputs of the software that are needed in order to accomplish its procedures. RayMan model simulates the short- and long-wave radiation flux densities from the three-dimensional surroundings in simple and complex environments. RayMan has the character of a freely available radiation and human-bioclimate model. The aim of the RayMan model is to calculate radiation flux densities, sunshine duration, shadow spaces and thermo-physiologically relevant assessment indices using only a limited number of meteorological and other input data. A comparison between measured and simulated values for global radiation and mean radiant temperature shows that the simulated data closely resemble measured data (Matzarakis and Katsoulis, 2006; Matzarakis et al., 2010).
3. RESULTS 3.1 Evaluation of the empirical PETref equations on a daily basis The results of the analysis of the daily PETref values are shown in Table 3. Some equations perform relatively well, whereas others reveal a MSE and MRSE in the estimation of PETref. Generally, formulas perform well, using daily data from the meteorological station of Lamia. In Table 4, PETref
is calculated for all 13 equations and an average PET is given with daily data that were restructured in a monthly step, while Figure 3 gives a seasonal analysis of average & total PETref (mm) per month, also with the use of daily data.

ESTIMATION AND COMPARISON OF POTENTIAL EVAPOTRANSPIRATION 209
Table 3. Outputs of the mean values of the statistical indicators (Eqs. (1)–(5)) between each of the empirical equations over the entire observation period, using daily data as inputs
Comparison-measures MSE MAE MRSE MRAE MBE
PETHar 1.41 1.05 0.82 0.57 -1.04
PETMcG 0.78 0.71 0.29 0.31 -0.15
PETRom 1.86 1.1 0.05 0.21 1.08
PETHan 2.56 1.41 0.95 0.7 -1.41
PETHam1 0.85 0.72 0.09 0.24 -0.63
PETHam2 1.57 0.99 0.29 0.4 -0.26
PETHam3 2.56 1.45 0.75 0.75 -1.44
PETCap 1.5 1.09 4.82 1.05 -1.03
PETJen 1.2 0.96 2.39 0.83 -0.87
PETMcC 3.77 1.59 2.53 1.17 -1
PETMak 4.25 1.87 2.57 1.15 -1.87
PETTur 2.44 1.42 2.04 0.74 -1.42
PETdeB 2.54 1.42 1.2 0.83 -1.42
Table 4. Estimation of Mean Values of PETref (mm) using daily data redacted in a monthly step,
using EmPEst software
PET/Month Jan Feb Mar Apr May Jun Jul Aug Sep Oct Nov Dec
PETHar 1.0 1.4 2.1 3.3 4.3 5.4 5.3 4.8 3.6 2.3 1.4 0.9
PETMcG 1.2 1.6 2.5 4.1 5.7 7.1 7.3 6.5 4.8 3.0 1.7 1.1
PETRom 2.5 2.4 3.2 4.5 6.0 8.6 8.5 8.0 6.5 4.8 3.6 2.6
PETHan 1.0 1.3 2.0 3.0 3.8 4.5 4.3 4.0 3.1 2.1 1.3 0.9
PETHam1 1.5 1.6 2.2 3.1 4.3 5.5 5.8 5.5 4.3 3.2 2.2 1.6
PETHam2 1.1 1.3 2.0 3.3 5.1 7.6 8.2 6.8 4.5 2.6 1.5 1.1
PETHam3 0.9 1.0 1.5 2.4 3.6 4.8 4.9 4.4 3.1 2.1 1.3 0.9
PETCap 0.6 0.9 1.6 3.0 4.4 6.1 6.0 5.4 3.8 2.2 1.1 0.6
PETJen 0.8 1.0 1.8 3.2 4.7 6.3 6.2 5.6 4.0 2.3 1.3 0.7
PETMcC 0.7 0.7 1.0 1.8 3.3 6.1 7.4 6.6 4.3 2.3 1.2 0.8
PETMak 0.8 1.0 1.7 2.5 3.2 3.8 3.6 3.3 2.5 1.7 1.0 0.7
PETTur 0.9 1.1 1.8 2.9 3.8 4.6 4.5 4.0 3.2 2.2 1.4 0.9
PETdeB 0.7 1.2 2.1 3.2 4.1 4.8 4.6 4.1 3.0 1.9 1.0 0.6
PETASCEsc 1.9 2.0 2.9 4.1 5.4 6.8 6.4 5.9 4.7 3.5 2.7 1.9
PETASCEtc 3.0 2.9 4.3 5.9 7.7 9.8 9.1 8.4 6.9 5.2 4.2 3.1
PETaverage 1.2 1.4 2.2 3.4 4.6 6.1 6.1 5.6 4.1 2.7 1.8 1.2

210 PAPARIZOS et al.
Figure 2. Seasonal Analysis between average & total PETref (mm) per month using daily data
3.2 Evaluation of the Empirical PETref Equations on a Monthly Basis The results of the integrated monthly PETref values are presented in Table 5.
Table 5. Outputs of the mean values of the statistical indicators (Eqs. (1)–(5)) between each of the empirical equations over the entire observation period, using monthly data as inputs
Comparison-measures MSE MAE MRSE MRAE MBE
PETHar 1.11 0.94 0.28 0.42 -0.94
PETMcG 0.52 0.6 0.14 0.25 -0.09
PETRom 1.74 1.09 0.05 0.21 1.08
PETHan 2.29 1.35 0.43 0.59 -1.35
PETHam1 0.77 0.69 0.09 0.24 -0.62
PETHam2 1.24 0.96 0.27 0.4 -0.23
PETHam3 2.34 1.41 0.77 0.76 -1.41
PETCap 1.3 1.03 1.52 0.83 -1.01
PETJen 1 0.89 0.76 0.61 -0.85
PETMcC 2.45 1.39 1.94 1.08 -1.16
PETMak 3.91 1.81 1.16 0.98 -1.81
PETTur 2.15 1.34 0.52 0.62 -1.34
PETdeB 2.27 1.36 1.03 0.78 -1.36
Figure 3. Seasonal Analysis between average & total PETref (mm) per month using monthly data
38,1 39,8 68,2
100,6
143,4
183,8 190,6 172,1
124,4
84,9 53,9
38,2
1,2 1,4
2,2
3,4
4,6
6,1 6,1
5,6
4,1
2,7
1,8
1,2
0
50
100
150
200
250
0
1
2
3
4
5
6
7
Jan Feb Mar Apr May Jun Jul Aug Sep Oct Nov Dec
Total PET/Month(mm)
PETaverage/Month(mm)
37,0 35,9 54,1 80,4
120,2 158,2
188,7 181,5 146,2
105,6 67,4
46,1
1,2 1,3 1,7
2,7
3,9
5,3
6,1 5,9
4,9
3,4
2,2
1,5
0
50
100
150
200
250
0
1
2
3
4
5
6
7
Jan Feb Mar Apr May Jun Jul Aug Sep Oct Nov Dec
Total PET/Month(mm)PETaverage/Month(mm)

ESTIMATION AND COMPARISON OF POTENTIAL EVAPOTRANSPIRATION 211
It can be seen that some equations clearly stood out for their consistently good fit with the average, whereas others clearly showed a very poor fit. In Table 6, as above, PETref is calculated for all 13 equations and an average PET that it is given from monthly data, while Figure 4 gives a seasonal analysis of average & total PETref (mm) per month by averaging the input monthly data.
Table 6. Estimation of Mean Values of PETref (mm) using data with monthly step, with EmPEst software
PET/Month Jan Feb Mar Apr May Jun Jul Aug Sep Oct Nov Dec
PETHar 1.1 1.4 2.2 3.3 4.4 5.5 5.3 4.8 3.6 2.3 1.4 1.0
PETMcG 1.2 1.6 2.5 4.1 5.7 7.1 7.3 6.5 4.8 2.9 1.7 1.1
PETRom 2.4 2.3 3.2 4.4 6.0 8.5 8.5 7.9 6.5 4.7 3.5 2.5
PETHan 1.0 1.3 2.0 3.0 3.8 4.5 4.3 3.9 3.1 2.0 1.3 0.9
PETHam1 1.4 1.5 2.0 2.9 4.0 5.4 5.8 5.6 4.4 3.2 2.2 1.5
PETHam2 1.0 1.2 1.7 2.9 4.6 7.3 8.3 7.2 4.9 2.8 1.6 1.1
PETHam3 0.8 0.9 1.3 2.1 3.3 4.6 5.1 4.7 3.4 2.2 1.4 0.9
PETCap 0.6 0.8 1.5 2.9 4.4 6.1 6.0 5.4 3.8 2.1 1.1 0.6
PETJen 0.7 1.0 1.8 3.1 4.6 6.2 6.2 5.5 3.9 2.3 1.2 0.7
PETMcC 0.6 0.7 0.9 1.6 2.9 5.7 6.9 6.3 4.1 2.1 1.1 0.7
PETMak 0.8 1.0 1.6 2.5 3.2 3.8 3.6 3.3 2.5 1.6 1.0 0.7
PETTur 0.9 1.2 1.9 2.9 3.8 4.6 4.5 4.0 3.2 2.2 1.4 0.9
PETdeB 0.7 1.2 2.1 3.2 4.1 4.8 4.6 4.1 3.0 1.9 1.0 0.6
PETaverage 1.2 1.3 1.7 2.7 3.9 5.3 6.1 5.9 4.9 3.4 2.2 1.5
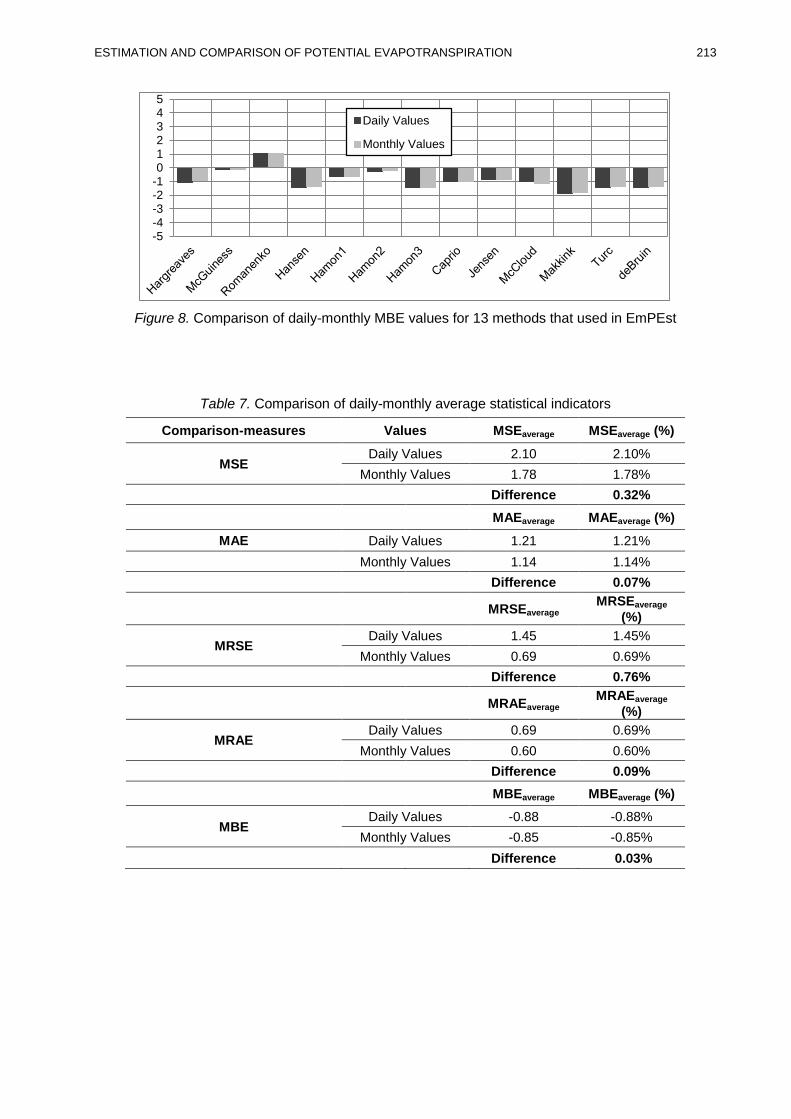
3.3 Comparison of daily and monthly data After the evaluation of the potential evapotranspiration an analysis is presented in the Figures and the Tables below with output data from EmPEst software, based on the statistical indicators mentioned above.
From the Tables it is clear that differences between daily data and monthly data that were created by daily data are very small. The largest difference can be found in MRSE and it is 0,76%, with the daily values to be overestimated that the monthly used values. Overestimation of daily data compared with monthly data can be observed for all the statistical indicators. In the following figures, the differences for all the statistic indicators for every used method are given in an effort to understand which method(s) bring these differences.
Figure 4. Comparison of daily-monthly MSE values for 13 methods that used in EmPEst
0
1
2
3
4
5
Daily Values
Monthly Values

212 PAPARIZOS et al.
Figure 5. Comparison of daily-monthly MAE values for 13 methods that used in EmPEst
Figure 6. Comparison of daily-monthly MRSE values for 13 methods that used in EmPEst
Figure 7. Comparison of daily-monthly MRAE values for 13 methods that used in EmPEst
0
1
2
3
4
5
Daily Values
Monthly Values
0
1
2
3
4
5
Daily Values
Monthly Values
0
1
2
3
4
5
Daily Values
Monthly Values
ESTIMATION AND COMPARISON OF POTENTIAL EVAPOTRANSPIRATION 213
Figure 8. Comparison of daily-monthly MBE values for 13 methods that used in EmPEst
Table 7. Comparison of daily-monthly average statistical indicators
Comparison-measures Values MSEaverage MSEaverage (%)
MSE Daily Values 2.10 2.10%
Monthly Values 1.78 1.78%
Difference 0.32%
MAEaverage MAEaverage (%)
MAE Daily Values 1.21 1.21%
Monthly Values 1.14 1.14%
Difference 0.07%
MRSEaverage MRSEaverage
(%)
MRSE Daily Values 1.45 1.45%
Monthly Values 0.69 0.69%
Difference 0.76%
MRAEaverage MRAEaverage
(%)
MRAE Daily Values 0.69 0.69%
Monthly Values 0.60 0.60%
Difference 0.09%
MBEaverage MBEaverage (%)
MBE Daily Values -0.88 -0.88%
Monthly Values -0.85 -0.85%
Difference 0.03%
-5-4-3-2-1012345
Daily Values
Monthly Values
214 PAPARIZOS et al.
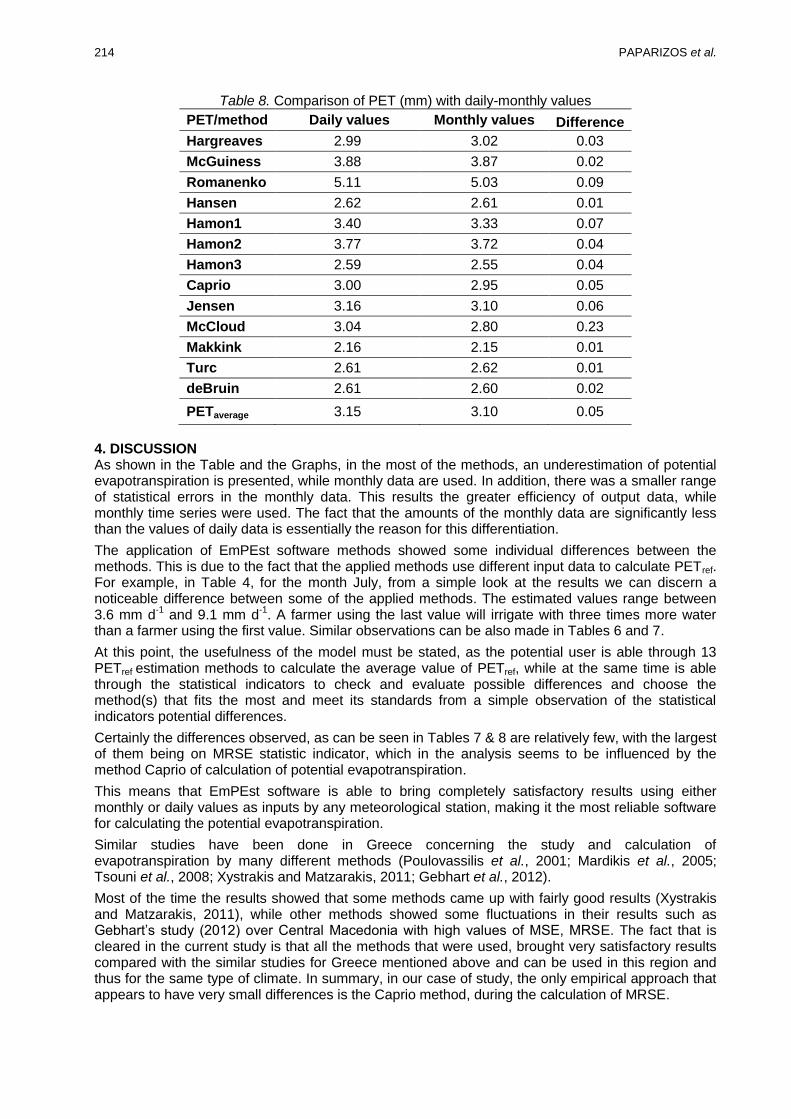
Table 8. Comparison of PET (mm) with daily-monthly values
PET/method Daily values Monthly values Difference
Hargreaves 2.99 3.02 0.03
McGuiness 3.88 3.87 0.02
Romanenko 5.11 5.03 0.09
Hansen 2.62 2.61 0.01
Hamon1 3.40 3.33 0.07
Hamon2 3.77 3.72 0.04
Hamon3 2.59 2.55 0.04
Caprio 3.00 2.95 0.05
Jensen 3.16 3.10 0.06
McCloud 3.04 2.80 0.23
Makkink 2.16 2.15 0.01
Turc 2.61 2.62 0.01
deBruin 2.61 2.60 0.02
PETaverage 3.15 3.10 0.05
4. DISCUSSION As shown in the Table and the Graphs, in the most of the methods, an underestimation of potential evapotranspiration is presented, while monthly data are used. In addition, there was a smaller range of statistical errors in the monthly data. This results the greater efficiency of output data, while monthly time series were used. The fact that the amounts of the monthly data are significantly less than the values of daily data is essentially the reason for this differentiation.
The application of EmPEst software methods showed some individual differences between the methods. This is due to the fact that the applied methods use different input data to calculate PETref. For example, in Table 4, for the month July, from a simple look at the results we can discern a noticeable difference between some of the applied methods. The estimated values range between 3.6 mm d
-1 and 9.1 mm d
-1. A farmer using the last value will irrigate with three times more water
than a farmer using the first value. Similar observations can be also made in Tables 6 and 7.
At this point, the usefulness of the model must be stated, as the potential user is able through 13 PETref estimation methods to calculate the average value of PETref, while at the same time is able through the statistical indicators to check and evaluate possible differences and choose the method(s) that fits the most and meet its standards from a simple observation of the statistical indicators potential differences.
Certainly the differences observed, as can be seen in Tables 7 & 8 are relatively few, with the largest of them being on MRSE statistic indicator, which in the analysis seems to be influenced by the method Caprio of calculation of potential evapotranspiration.
This means that EmPEst software is able to bring completely satisfactory results using either monthly or daily values as inputs by any meteorological station, making it the most reliable software for calculating the potential evapotranspiration.
Similar studies have been done in Greece concerning the study and calculation of evapotranspiration by many different methods (Poulovassilis et al., 2001; Mardikis et al., 2005; Tsouni et al., 2008; Xystrakis and Matzarakis, 2011; Gebhart et al., 2012).
Most of the time the results showed that some methods came up with fairly good results (Xystrakis and Matzarakis, 2011), while other methods showed some fluctuations in their results such as Gebhart’s study (2012) over Central Macedonia with high values of MS , MRSE. The fact that is cleared in the current study is that all the methods that were used, brought very satisfactory results compared with the similar studies for Greece mentioned above and can be used in this region and thus for the same type of climate. In summary, in our case of study, the only empirical approach that appears to have very small differences is the Caprio method, during the calculation of MRSE.
ESTIMATION AND COMPARISON OF POTENTIAL EVAPOTRANSPIRATION 215
Regarding to the overall calculation of PETref, latest studies, in order to come up against the problem of limited data that is mentioned above and we experienced it as well in the current study for the meteorological station of Lamia, tend to simplify some methods towards the necessary input data in order to meet up with most of the Greek meteorological stations that appear the same lack of data (Valiantzas, 2013d).
Regarding use of daily and monthly data, although both times series worked pretty satisfactorily during EmPEst calculations, we need to note that we must be very careful when we use smaller amounts of values because, for example, while monthly values were used, the PETref estimations were lower during the summer months and this is supported by the fact that the difference is more evident because actually in this season of the year there is reduced rainfall in the region. This is a factor that must be kept in mind while making our results and statements.
5. CONCLUSIONS
In the current paper, the calculation of the potential evapotranspiration was done, with the help of EmPEst software which comprises 13 equations for calculating the potential evapotranspiration and the use of meteorological observations from Lamia station which is located in the fertile region of Sperchios river valley.
The results of the application are generally considered satisfactory. The comparison in this paper of daily with monthly data observations of a meteorological station within the Greek territory wasn’t random. Generally in Greece, a major problem that occurs is the lack of adequate meteorological observations, thing that often leads to a malfunction of the network of meteorological stations in Greece. Consequence of this is the availability mainly of observations with monthly step, at least for the years that we examined in this paper. Additionally, the small number of input data can often be the cause of overestimation or underestimation of the results.
Another factor that must kept in mind in our research for the calculation of evapotranspiration in Greece is rainfall, which primarily falls in cold period, compared to other European countries, while during the summer months tends to appear even more decreasing values. Rainfall, linked with PET, combined with the fact that agricultural section in the main activity in the area can provide useful answers to the stakeholders regarding their crops, give the opportunity for further research of the meteorological processes in Sperchios river valley and thus contribute to a sustainable development.
Summed up, we can say that most of the equations for calculating the potential evapotranspiration can be used to give accurate results in the Sperchios river valley. For even better results, before each use of EmPEst software, a careful examination of the possible faults in results through the statistical indications is necessary in order to avoid overestimated or underestimated results.
Finally, because of the large agricultural production which is the main occupation of the local population, it is believed that the results from this study could provide useful inferences to farmers and the various stakeholders with the area.
REFERENCES
Alexandris S., Stricevic R. and Petcovic S. (2008), Comparative analysis of reference evapotranspiration
from the surface of rainfed grass in central Serbia, calculated by six empirical methods against the
Penman-Monteith formula, European Water, 21(22),17–28.
Allen R., Pereira, L., Raes, D. and Smith M. (1998), Crop evapotranspiration—Guidelines for computing
crop water requirements, Journal of Irrigation and Drainage Engineering, Paper 56, Food and
Agriculture Organization (FAO), Rome, 300.
Allen R., Tasumi M. and Trezza R. (2007), Satellite-Based Energy Balance for Mapping
Evapotranspiration with Internalized Calibration (METRIC)-Model, Journal of Irrigation and Drainage
Engineering, 133(4), 380-394.
ASCE Task Committee on Standardization of Reference Evapotranspiration of the Environmental and
Water Resources Institute (2005), In: The ASCE standardized reference evapotranspiration
equation. Allen R., Walter I.A., Elliot R.L., Howell T.A., Itenfisu D., Jensen M.E. and Snyder R.L.
(eds.), ASCE, Reston, VA, 172.

216 PAPARIZOS et al.
Caprio J. (1974), The solar thermal unit concept in problems related to plant development ant potential
evapotranspiration, Phenology and seasonality modeling, Lieth H. (ed.), Springer, New York, 353–
364.
Dalezios N.R., Loukas A. and Bampzelis D. (2002), Spatial variability of reference evapotranspiration in
Greece, Physics and Chemistry of the Earth, 27(23–24), 1031–1038.
Dingman S.L. (1994), Physical Hydrology, Macmillan Publishing Co., New York, NY.
Exner-Kittridge M.G. and Rains M.C. (2010), Case study on the accuracy and cost/ effectiveness in
simulating reference evapotranspiration in west-central Florida, Journal of Irrigation and Drainage
Engineering, 15(9), 696–703.
Gebhart S., Radoglou K., Chalivopoulos G. and Matzarakis A. (2012), Evaluation of potential
evapotranspiration in central Macedonia by EmPEst. In: Helmis C.G., Nastos P. (Eds) Advances in
Meteorology, Climatology and Atmospheric Physics, Springer Atmospheric Sciences, Springer.
Volume 1, 451-456.
Irmak S., Allen R.G. and Whitty E.B. (2003), Daily grass and alfalfareference evapotranspiration
estimates and alfalfa-to-grass evapotranspiration ratios in Florida, Journal of Irrigation and Drainage
Engineering, 129(5), 360–370.
Jacobs J.M., and Satti S.R. (2001), Evaluation of reference evapotranspiration methodologies and
AFSIRS crop water use simulation model, Final Rep., St. Johns River Water Management District,
Palatka, FL.
Jacovides C.P. (1998), Reply to comment on statistical procedures for the evaluation of
evapotranspiration computing models, Agricultural Water Management, 37(1), 95–97.
Jacovides C.P. and Kontoyiannis H. (1995), Statistical procedures for the evaluation of evapotranspiration
computing models, Agricultural Water Management, 27(3-4), 365–371.
Jensen M.E. and Haise H.R. (1963), Estimating evapotranspiration from solar radiation, Journal of
Irrigation and Drainage Engineering, 89, 15–41.
Knotters M. and Voshaar J.H.O. (1998), Comment on statistical procedures for the evaluation of
evapotranspiration computing models by Jacovides C.P. and Kontoyiannis H., Agricultural Water
Management, 27 (1995), pp. 365-371, Agricultural water management, 37(1), 93-94.
Kostinakis K., Xystrakis F., Theodoropoulos K., Stathis D., Eleftheriadou E. and Matzarakis A. (2011),
Estimation of reference potential evapotranspiration with focus on vegetation science – the EmPEst
software, Journal of Irrigation and Drainage Engineering, 137, 616–619.
Lu J.B., Sun G., McNulty S.G. and Amatya D.M. (2005), A comparison of six potential evapotranspiration
methods for regional use in the southeastern United States, American Water Resources Association,
41(3), 621–633.
Mardikis M.G., Kalivas D.P. and Kollias V.J. (2005), Comparison of Interpolation Methods for the
Prediction of Reference Evapotranspiration-An Application in Greece, Water Resources
Management, 19(3), 251-278.
Maris F., Paparrizos S., Angelidis P., Potouridis S. and Mousoulis E. (2013), Application of MIKE SHE
model at Sperchios basin to simulate different IPCC climate change scenarios, Bulgarian Journal of
Meteorology & Hydrology (ISSN: 0861-0762), (in press)
Matzarakis A. and Katsoulis V. (2006), Sunshine duration hours over the Greek region, Theoretical and
Applied Climatology, 83, 107-120.
Matzarakis A., Rutz F. and Mayer H. (2007), Modeling radiation fluxes in simple and complex
environments—Application of the RayMan model, International Journal of Biometeorology, 51(4),
323–334.
Matzarakis A., Rutz F. and Mayer H. (2010), Modelling radiation fluxes in simple and complex
environments: basics of the RayMan model, International Journal of Biometeorology, 54(2), 131-139.
udin L., Hervieu F., Michel C., Perrin C., Andréassian V., Anctil F. and Loumagne C. (2005), Which
potential evapotranspiration input for a lumped rainfall-runoff model? Part 2 - Towards a simple and
efficient potential evapotranspiration model for rainfall-runoff modeling, Journal of Hydrology,
303(01-avr), 290-306.

ESTIMATION AND COMPARISON OF POTENTIAL EVAPOTRANSPIRATION 217
Paparrizos S. (2012), Study of the torrential Environment of Sperchios River with the intergrated,
hydrological, physically-based MIKE-SHE model, using GIS, M.Sc. Thesis, Department of Forestry
and Management of the Environment and Natural Resources, Democritus University of Thrace,
Greece (in Greek).
Papazafiriou Z.G. (1984), Principles and Practices of Irrigations, Ziti Publications, Thessaloniki, Greece
(in Greek).
Poulovassilis A., Anadranistakis M., Liakatas A., Alexandris S. and Kerkides P. (2001), Semi-empirical
approach for estimating actual evapotranspiration in Greece, Agricultural Water Management,
51(2), 143-152.
Rosenberry D.O., Stannard D.I., Winter T.C. and Martinez M.L. (2004), Comparison of 13 equations for
determining evapotranspiration from a prairie wetland, Cottonwood Lake Area, North Dakota, USA,
Wetlands Ecology and Management, 24(3), 483–497.
StatSoft I. (2007), STATISTICA data analysis software system. [Computer software], Tulsa, OK.
Tsouni A., Kontoes C., Koutsoyiannis D., Elias P. and Mamassis N. (2008), Estimation of Actual
Evapotranspiration by Remote Sensing: Application in Thessaly Plain, Greece, Sensors,
8(6),3586-3600.
Valiantzas J.D. (2006), Simplified versions for the Penman evaporation equation using routine weather
data, Journal of Hydrology, 331, 690-702.
Valiantzas J.D. (2012), Discussion of ‘‘Case Study on the Accuracy and Cost/ ffectiveness in Simulating
Reference Evapotranspiration in West- Central Florida’’ by xner-Kittridge M.G, Rains. M.C., Journal
of Irrigation and Drainage Engineering, 17(1), 224–225.
Valiantzas J.D. (2013a), Simplified reference evapotranspiration formula using an empirical impact factor
for penman’s aerodynamic term, Journal of Irrigation and Drainage Engineering 18(1), 108–114.
Valiantzas J.D. (2013b), Simple ET0 forms of Penman’s equation without wind and/ or humidity data: I:
Theoretical development ’’, Journal of Irrigation and Drainage Engineering, 139(1), 1–8.
Valiantzas J.D. (2013c), Simple ET0 forms of penman’s equation without wind and/or humidity data: II:
comparisons with reduced set-FAO and other methodologies, Journal of Irrigation and Drainage
Engineering, 139(1), 9–19.
Valiantzas J.D. (2013d), Simplified forms for the standardized FAO-56 Penman-Monteith reference
evapotranspiration using limited weather data, Journal of Hydrology, 505, 13-23.
Willmott C.J. (1982), Some comments on the evaluation of model performance, Bulletin of the American
Meteorological Society, 63(11), 1309–1313.
Willmott C.J. (1984), On the evaluation of model performance in physical geography, In: Spatial statistics
and models, Gaile G.L. and Willmott C.J. (Eds.), Reidel, Boston, 443–460.
Willmott C.J., Ackleson S.G., Davis R.E., Feddema J.J., Klink K.M., Legates, D.R., ’ Donell J. and Rowe
C.M. (1985), Statistics for the evaluation and comparison of models, Journal of Geophysical
Research, 90, 8995-9005.
Xu C.Y. and Singh V.P. (2002), Cross comparison of empirical equations for calculating potential
evapotranspiration with data from Switzerland, Water Resources Management, 16(3), 197–219.
Xystrakis F. and Kostinakis K. (2010), EmPEst – empirical reference potential evaporation estimation:
user’s guide. Available at http://empest.wordpress.com/
Xystrakis F. and Matzarakis A. (2011), Evaluation of 13 empirical reference potential evapotranspiration
equations on the island of Crete in southern Greece, Journal of Irrigation and Drainage Engineering,
137, 211–222.