Central Valley/West Valley Care Coordination Coalitions ...
35
Central Valley/West Valley Care Coordination Coalitions Quarterly Community Meeting Health Services Advisory Group March 9, 2017 –1– Central Valley/West Valley Care Coordination Coalitions Quarterly Community Meeting Ettie Lande, MS, RN Associate Director, Care Coordination Health Services Advisory Group (HSAG) March 9, 2017 WVCCC CVCCC We Have “Gone Green” 2 Benefits: • Slides are sent in advance of the meeting by email. • You can print a copy in advance if you prefer having a hard copy. • Allows you to follow along electronically.
Transcript of Central Valley/West Valley Care Coordination Coalitions ...
Central Valley/West Valley Care Coordination Coalitions Quarterly Community Meeting
Health Services Advisory GroupMarch 9, 2017
–1–
Central Valley/West Valley Care Coordination Coalitions
Quarterly Community Meeting
Ettie Lande, MS, RN Associate Director, Care Coordination
Health Services Advisory Group (HSAG) March 9, 2017
WVCCCCVCCC
We Have “Gone Green”
2
Benefits:
• Slides are sent in advance of the meeting by email.
• You can print a copy in advance if you prefer having a hard copy.
• Allows you to follow along electronically.

Central Valley/West Valley Care Coordination Coalitions Quarterly Community Meeting
Health Services Advisory GroupMarch 9, 2017
–2–
WVCCCCVCCC
Thank you!
Today’s breakfast sponsored by
ComForCare Senior Services
Thank you to Mark Redmond!
3
If you would like to sponsor the breakfast for the September 26 meeting, please contact Cheryl Angotti at [email protected]
or call602.801.6916
WVCCCCVCCC
Introducing the HSAG Team
4
Barb Averyt, Executive DirectorCheryl Angotti, Project Coordinator
Care Coordination and Adverse DrugEvents (ADEs)Ettie Lande—CV/WVCCCAssociate DirectorJenna Burke—EVCCCQuality Improvement Specialist
Behavioral HealthDennette Janus—Arizona and CaliforniaQuality Improvement Specialist
Nursing Home Quality Improvement and C. diffKeith ChartierAssociate DirectorElaine NelsonClinical Project ManagerBuffy LloydQuality Improvement Specialist—HAI
Antibiotic StewardshipKeith ChartierAssociate Director

Central Valley/West Valley Care Coordination Coalitions Quarterly Community Meeting
Health Services Advisory GroupMarch 9, 2017
–3–
WVCCCCVCCC
Your Meeting Feedback Is Important!
Please help us exceed the 85% target!
5
79%
90%
73%
88%
50%55%60%65%70%75%80%85%90%95%
100%
March,2016
June, 2016 Sept, 2016 December,2016
2016 Evaluation Completion Rates
WVCCCCVCCC
Today’s Agenda
• Welcome and Introduction
• Readmission Rates, Targets, and Call to Action
• The Center for Transitional Care Clinic
• Adverse Drug Event Rates and Call to Action
• Anticoagulation Therapy in Acute Rehab
• Meeting Feedback and Evaluations
6

Central Valley/West Valley Care Coordination Coalitions Quarterly Community Meeting
Health Services Advisory GroupMarch 9, 2017
–4–
Community Readmission Rates, Targets, and Call to Action
WVCCCCVCCC
WVCCC: Readmission Rates Q4 2013–Q2 2016
Oct 2013–Sep 2014
Jan 2014–Dec 2014
Apr 2014–Mar 2015
Jul 2014–Jun 2015
Oct 2014–Sep 2015
Jan 2015–Dec 2015
Apr 2015–Mar 2016
Jul 2015–Jun 2016
Target 15.6% 15.6% 15.6% 15.6% 15.6% 15.6% 15.6% 15.6%
Readmit Rate 17.00% 16.93% 16.93% 16.84% 16.85% 16.62% 16.32% 15.91%
17.00% 16.93% 16.93% 16.84% 16.85%16.62%
16.32%
15.91%
14.5%
15.0%
15.5%
16.0%
16.5%
17.0%
17.5%
Target Readmit Rate Desired Direction:Target: 20% RIR* by Q3 2018
Source: Medicare Fee for Service Claims Data. *RIR is Relative Improvement Rate, the percentage of improvement from baseline. The formula for Relative Improvement Rate (RIR) is (Baseline-Current)/Baseline.
8

Central Valley/West Valley Care Coordination Coalitions Quarterly Community Meeting
Health Services Advisory GroupMarch 9, 2017
–5–
WVCCCCVCCC
WVCCC: Readmission Relative Improvement Rates (RIR) Q4 2013–Q3 2016
Oct 2013–Sep 2014
Jan 2014–Dec 2014
Apr 2014–Mar 2015
Jul 2014–Jun 2015
Oct 2014–Sep 2015
Jan 2015–Dec 2015
Apr 2015–Mar 2016
Jul 2015–Jun 2016
Oct 2015–Sep 2016
Target 20.0% 20.0% 20.0% 20.0% 20.0% 20.0% 20.0% 20.0% 20.0%
Actual RIR 2.01% 3.62% 4.17% 5.78% 6.76% 9.25% 12.18% 17.22% 19.45%
2.01%3.62% 4.17%
5.78%6.76%
9.25%
12.18%
17.22%19.45%
0.0%
5.0%
10.0%
15.0%
20.0%
25.0%
Target Actual RIR Desired Direction:Target: 20% RIR* by Q3 2018
Source: Medicare Fee for Service Claims Data*The formula for Relative Improvement Rate (RIR) is (Baseline-Current)/Baseline. 9
WVCCCCVCCC
CVCCC: Readmission Rates Q2 2014–Q2 2016
Desired Direction:
Apr 2014-Mar 2015 Jul 2014-Jun 2015 Oct 2014-Sept 2015 Jan 2015-Dec 2015 Apr 2015-Mar 2016 Jul 2015-Jun 2016
Readmit Rate 17.42% 17.42% 17.44% 17.55% 17.68% 17.29%
17.42% 17.42% 17.44%17.55%
17.68%
17.29%
16.00%
16.50%
17.00%
17.50%
18.00%
18.50%
Source: Medicare Fee for Service Claims Data*The formula for Relative Improvement Rate (RIR) is (Baseline-Current)/Baseline. 10

Central Valley/West Valley Care Coordination Coalitions Quarterly Community Meeting
Health Services Advisory GroupMarch 9, 2017
–6–
WVCCCCVCCC
CVCCC: Readmission RIR Q2 2014–Q3 2016
Apr 2014–Mar 2015
Jul 2014–Jun 2015
Oct 2014–Sep 2015
Jan 2015–Dec 2015
Apr 2015–Mar 2016
Jul 2015–Jun 2016
Oct 2015–Sep 2016
Target RIR 12.0% 12.0% 12.0% 12.0% 12.0% 12.0% 12.0%
Actual RIR 0.01% -0.26% -0.12% -1.47% -2.12% 1.48% 3.33%
0.01% -0.26% -0.12%-1.47% -2.12%
1.48%
3.33%
-4.0%
-2.0%
0.0%
2.0%
4.0%
6.0%
8.0%
10.0%
12.0%
14.0%
Target RIR Actual RIR Desired Direction RIR:Target: 12% RIR by Q3 2018
Source: Medicare Fee for Service Claims Data*The formula for Relative Improvement Rate (RIR) is (Baseline-Current)/Baseline. 11
WVCCCCVCCC
CVCCC: 18-Month Challenge to Improve the Readmission RIR by 12% by Q3 2018
Q1 2017* Q2 2017 Q3 2017 Q4 2017 Q1 2018 Q2 2018 Q3 2018
Readm/1,000* 36.9 36.4 35.8 35.3 34.7 34.2 33.6
Goal RIR 3.3% 4.8% 6.2% 7.7% 9.1% 10.6% 12.0%
36.9 36.435.8 35.3
34.7 34.233.6
3.3%4.8%
6.2%7.7%
9.1%10.6% 12.0%
0.0%
5.0%
10.0%
15.0%
20.0%
25.0%
23.0
25.0
27.0
29.0
31.0
33.0
35.0
37.0
39.0
PER
1,0
00 B
ENEF
ICIA
RIE
S
Readm/1,000* Goal RIR
Desired Direction RIR:Readmit Count/1,000*:
*Readmission rates are based on the actual count of readmissions per 1,000 beneficiaries.**Q1 2017 data is actually Q3 2016 data that is being used as a proxy and projecting forward. The formula for Relative Improvement Rate (RIR) is (Baseline-Current)/Baseline. 12

Central Valley/West Valley Care Coordination Coalitions Quarterly Community Meeting
Health Services Advisory GroupMarch 9, 2017
–7–
WVCCCCVCCC
What Actions Can You Take Now?
• Convene an interdisciplinary readmission reduction team.
• Perform a gap analysis to identify areas of strengths and opportunity.
• Select an initial improvement project and clearly communicate the goals.
• Leverage partnerships, networks, and relationships.
• What else can you think of?
13
Bruce Bethancourt, MD, FACP
CMO DIGNITY HEALTH MEDICAL GROUP
Central Valley/West Valley Care Coordination Coalitions Quarterly Community Meeting
Health Services Advisory GroupMarch 9, 2017
–8–
urgent State of Health Care
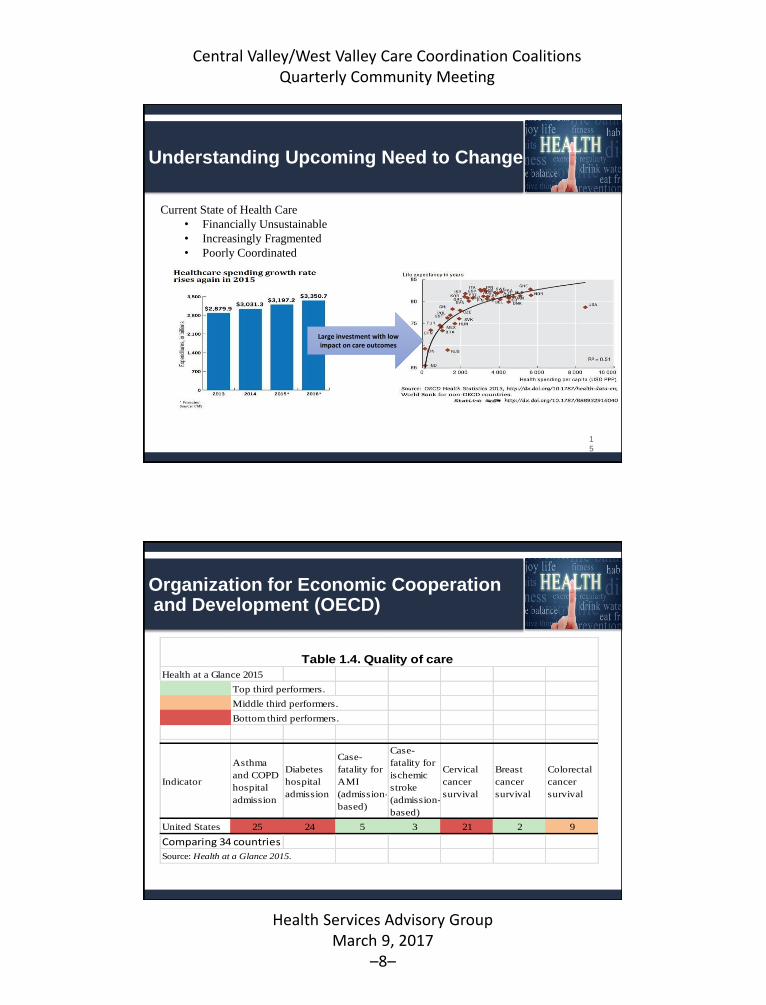
Current State of Health Care
Understanding Upcoming Need to Change
1
5
Large investment with low impact on care outcomes
Current State of Health Care
• Financially Unsustainable
• Increasingly Fragmented
• Poorly Coordinated
Organization for Economic Cooperationand Development (OECD)
Health at a Glance 2015
Top third performers.
Middle third performers.
Bottom third performers.
Indicator
Asthma
and COPD
hospital
admission
Diabetes
hospital
admission
Case-
fatality for
AMI
(admission-
based)
Case-
fatality for
ischemic
stroke
(admission-
based)
Cervical
cancer
survival
Breast
cancer
survival
Colorectal
cancer
survival
United States 25 24 5 3 21 2 9
Comparing 34 countries
Source: Health at a Glance 2015.
Table 1.4. Quality of care

Central Valley/West Valley Care Coordination Coalitions Quarterly Community Meeting
Health Services Advisory GroupMarch 9, 2017
–9–
Why Population Health Now ?
17
AGING POPULATION
18

Central Valley/West Valley Care Coordination Coalitions Quarterly Community Meeting
Health Services Advisory GroupMarch 9, 2017
–10–
MEDICARE EFFORTS AT COST CONTAINMENT
• MEDICARE HOSPITAL READMISSION REDUCTION PROGRAM
• AFFORDABLE CARE ACT
• CMS ACO PROGRAMS
• RAC AUDITS
• OBSERVATION vs ADMISSION (TWO MIDNIGHT RULE)
• “VALUE BASED PAYMENT MODIFIER PROGRAM”
• Medicare Access and CHIP Reauthorization Act of 2015 (MACRA)
Merit-Based Incentive Payment System (MIPS)
Alternative Payment Model (APM).
MEDICARE ACCESS & CHIP REAUTHORIZATION ACT
MACRA
(CREATES TWO TRACKS FOR PROVIDERS)
20
Merit-Based Incentive Payment System Alternative Payment Model
• Not in Advanced APM• In Advanced APM < 25%
associated With APM
• Shared Savings Program (Tracks 2 and 3)
• Next Generation ACO Model• Comprehensive ESRD Care
(CEC)• Comprehensive Primary Care
Plus (CPC+)• Oncology Care Model (OCM)
Central Valley/West Valley Care Coordination Coalitions Quarterly Community Meeting
Health Services Advisory GroupMarch 9, 2017
–11–
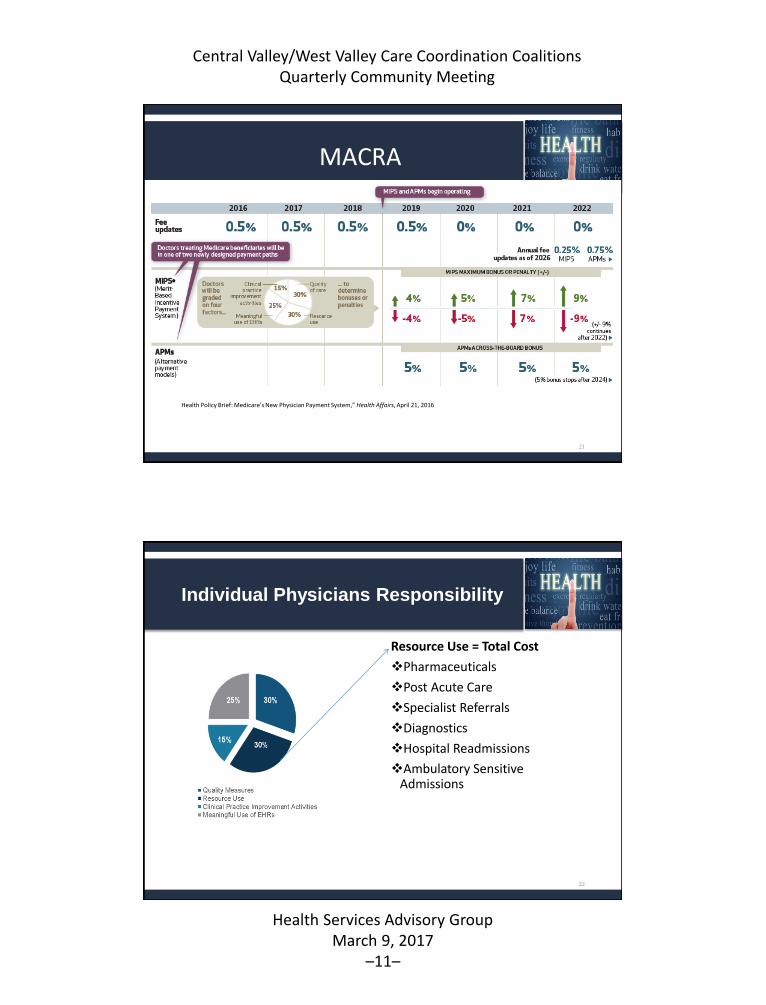
MACRA
21
Health Policy Brief: Medicare’s New Physician Payment System,” Health Affairs, April 21, 2016
Individual Physicians Responsibility
Resource Use = Total Cost
Pharmaceuticals
Post Acute Care
Specialist Referrals
Diagnostics
Hospital Readmissions
Ambulatory Sensitive Admissions
22

Central Valley/West Valley Care Coordination Coalitions Quarterly Community Meeting
Health Services Advisory GroupMarch 9, 2017
–12–
MEDICARE HOSPITAL READMISSIONREDUCTION PROGRAM3% penalty for hospitals with “excess readmissions”
• Acute Myocardial Infarction (AMI)
• Heart Failure
• Pneumonia
• Chronic Obstructive Pulmonary Disease (COPD)
• Total Hip and/or Knee Arthroplasty
www.PresentationPro.com
Acute to Ambulatory Transition Failure Causes
Lack of Sufficient Follow Up
Medication issue
Health Care Literacy
Cognitive Dysfunction in the Elderly
Lack of Functionality
Lack of Family or Community Support

Central Valley/West Valley Care Coordination Coalitions Quarterly Community Meeting
Health Services Advisory GroupMarch 9, 2017
–13–
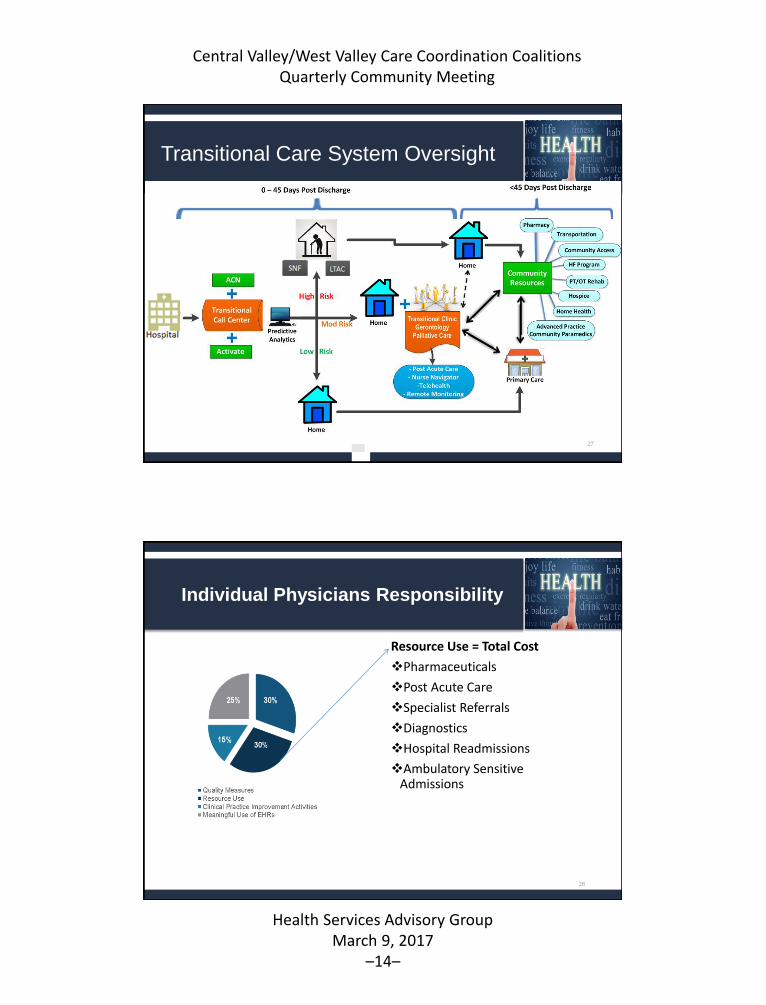
How to Improve Care Transitions
F/U in 3 to 7 days shown to decrease readmissions
• Exceptions:
• Even with the best communication channels, chronically ill patients with multisystem
disease are oftentimes so vulnerable immediately following hospitalization that they
do not fare well in regular primary care office
• Most traditional primary care offices lack the care management resources needed by
high-risk patients, such as time, self-care education, and connections to community
resources
Transitions of Care Clinic
HospitalistTC sets up 1st F/U visit within 24-72
hours
1st TC visit & PRN X 30 days
Transition to Ambulatory Care
Readmission Index DX:• ≥ 7 Medications• ≥ 1 Readmit Past 12
Months• LOS > Predicted• No Primary Care• Multiple Co-Morbid
Conditions
• TC NP visits patient
in hospital to offer
program
• TC NP discuss case
with CM & SW
• Review chart
• Identify barriers to
care
• Physician calls PCP
to offer service
• Provider reviews
case with NP &
Patient
• Records Reviewed
• Medication
Reconciliation &
Educated by
Pharm D
• Needs Assessment
• Remote Care
Monitoring
• Summary of care
provided
• Medication
Reconciliation
• Phone call to
PCP
• Referral to new
PCP if needed
Central Valley/West Valley Care Coordination Coalitions Quarterly Community Meeting
Health Services Advisory GroupMarch 9, 2017
–14–
Transitional Care System Oversight
27
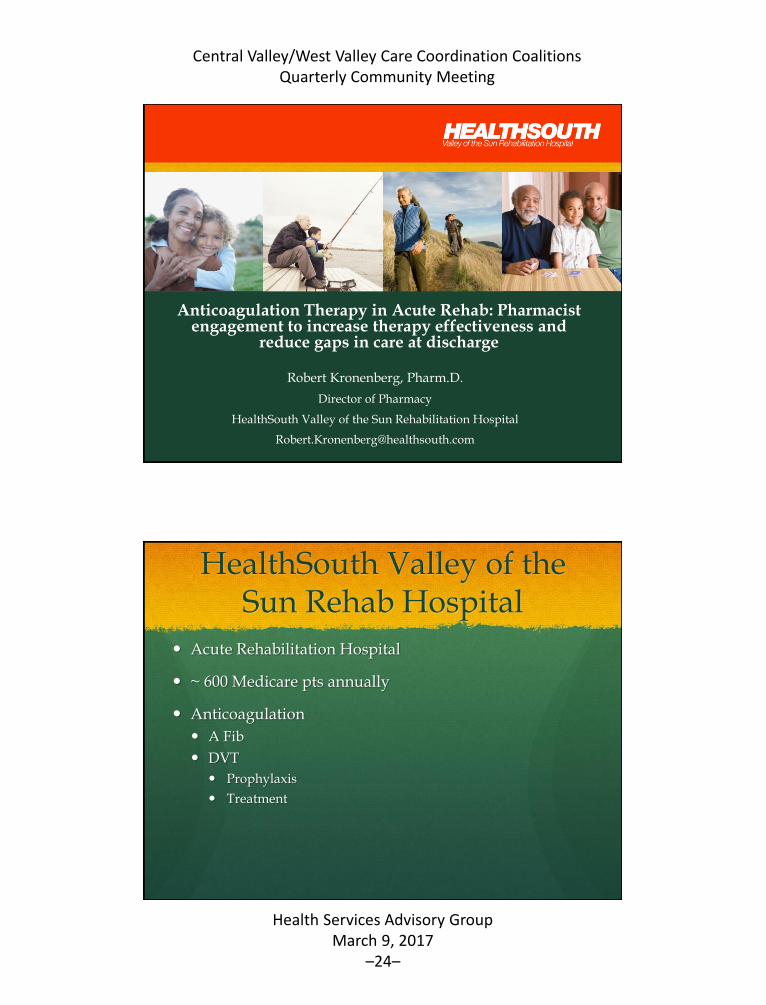
Individual Physicians Responsibility
Resource Use = Total Cost
Pharmaceuticals
Post Acute Care
Specialist Referrals
Diagnostics
Hospital Readmissions
Ambulatory Sensitive Admissions
28

Central Valley/West Valley Care Coordination Coalitions Quarterly Community Meeting
Health Services Advisory GroupMarch 9, 2017
–15–
DHMG COMPENSATION MODEL 2016
•PRODUTIVITY (wRVUs) 80 %
•VALUE BASED 20%
29
Patient Satisfaction
Stewardship
Quality Metrics
Access to Care
Ambulatory Sensitive Admissions
Readmissions
THANK YOU
"Everybody has accepted by now that change is unavoidable. But that
still implies that change is like death and taxes it should be postponed as
long as possible and no change would be vastly preferable. But in a
period of upheaval, such as the one we are living in, change is the
norm." --Peter F. Drucker
www.PresentationPro.com

Central Valley/West Valley Care Coordination Coalitions Quarterly Community Meeting
Health Services Advisory GroupMarch 9, 2017
–16–
Reducing Adverse Drug Events (ADEs)
Ettie Lande, MS, RN
HSAG
WVCCCCVCCC
Readmissions and Medication Safety
• HSAG works with hospitals to reduce ADEs.
• ADEs contribute to readmissions and are the leading cause of preventable patient harm.1
• High priority medication targets for the National Action Plan for Adverse Drug Event Prevention2
(common, preventable, and measurable ADEs) are:
– Anticoagulants
– Diabetic agents
– Opioids
321. Gurwitz JH, Field TS, Harrold LR, et al. Incidence and preventability of adverse drug events among older persons in the ambulatory setting. JAMA. 2003;289(9):1107–16.2. U.S. Department of Health and Human Services, Office of Disease Prevention and Health Promotion. (2014). National Action Plan for Adverse Drug Event Prevention.Washington, DC: Author.

Central Valley/West Valley Care Coordination Coalitions Quarterly Community Meeting
Health Services Advisory GroupMarch 9, 2017
–17–
WVCCCCVCCC
ADEs Contribute to Increased Costs and Negatively Impact Patient Care
33
ADEs
WVCCCCVCCC
$3.5BILLION
Add an additional $3.5 billion in healthcare costs; of this, up to $5.6 million per U.S. hospital.3
Prolong hospital stays by 1.7 to 4.6 days.2
Account for 1/3 of adverse events encountered in hospitals.4
2. U.S. Department of Health and Human Services, Office of Disease Prevention and Health Promotion. (2014). National Action Plan for Adverse Drug Event Prevention. Washington, DC: Author.3. Institute of Medicine. Committee on Identifying and Preventing Medication Errors. Preventing Medication Errors, Washington, DC: The National Academies Press 2006.4. U.S. Department of Health and Human Services Office of Inspector General (OIG). Adverse Events in Hospitals: National Incidence Among Medicare Beneficiaries. Washington, DC. 2010 November. Report No.: OEI-06-09-00090.
National Rates: Emergency Department (ED) Visits for ADEs
34
Associated with anticoagulants
17.6% of the visits, with
48.8% of cases resulting in hospitalization.5
Associated with diabetic agents
13.3% of the visits, with
38.5% resulting in hospitalization.5
Associated with opioids
6.8% of the visits, with
24.6% resulting in hospitalization.5
5. Shehab N, Lovegrove MC, Geller AI, Rose KO, Weidle NJ, Budnitz DS. US Emergency Department Visits for Outpatient Adverse Drug Events, 2013-2014. JAMA. 2016;316(20):2115-2125. doi: 10.1001/jama.2016.16201.

Central Valley/West Valley Care Coordination Coalitions Quarterly Community Meeting
Health Services Advisory GroupMarch 9, 2017
–18–
WVCCCCVCCC
Engaging With Hospitals to Create and Implement ADE Interventions
• Data reveal that many facilities rank above the state average for high-risk readmission rates related to one or more of the three high-risk medication (HRM) classes:
35
anticoagulants diabetic agents opioids
WVCCCCVCCC
• A hospital’s ADE rate is measured by counting the number of hospital admissions and ED visits related to an ADE from one of the three HRMs.
Arizona Medicare Readmissions Within 7 and 30 Days—2015
36
25,176 Readmissions Within 30 Days
9,234 Readmissions Within 7 Days
1,735 7-Day Readmissions
Were on HRMs

Central Valley/West Valley Care Coordination Coalitions Quarterly Community Meeting
Health Services Advisory GroupMarch 9, 2017
–19–
WVCCCCVCCC
Arizona Medicare Readmissions Within 7 Days—2015
37
Of the 9,234 Readmissions Within 7 Days,1,735 (18.7%) Readmissions Were for
Beneficiaries Who Were on HRMs
That is almost 1 out of every 5 readmissions!
WVCCCCVCCC
Medicare Fee-For-Service (FFS) Beneficiaries on HRMs in Arizona—2015
38
Opioids are the most common drug type used, closely followed by diabetic agents. Fewer beneficiaries use anticoagulants.
Anticoagulants 4.49%
Diabetic Agents 6.02%
Opioids 7.14%Represents beneficiaries with at least 30-days supply of drug type. Patients may be included in more than one drug type category.

Central Valley/West Valley Care Coordination Coalitions Quarterly Community Meeting
Health Services Advisory GroupMarch 9, 2017
–20–
WVCCCCVCCC
ADE Rates Among Medicare FFS Beneficiaries Discharged on HRMs in Arizona—2015 (ADEs per 1,000 Discharges)
39
Anticoagulant ADEs 54.39
Diabetic Agent ADEs 28.46
Opioid ADEs 6.01
Despite lower frequency of use, patients taking anticoagulants have the highest rate of ADEs per 1,000 discharges among Medicare beneficiaries on HRMs, followed by diabetic agents. Opioids have much lower ADE rates based on claims data.
WVCCCCVCCC
30-Day Readmissions Among Medicare FFS Beneficiaries on HRMs in Arizona—2015
40
30-Day All-Cause Readmission Rate 16.0%
30-Day HRM Readmission Rate
19.4%
• Readmissions among beneficiaries on HRMs are much more frequent than the general population, suggesting ample opportunity for improvement.
• Percent of 30-day readmits with an anticoagulant or diabetes agent ADE are much higher than the percent of readmits with an opioid ADE.

Central Valley/West Valley Care Coordination Coalitions Quarterly Community Meeting
Health Services Advisory GroupMarch 9, 2017
–21–
WVCCCCVCCC
What Do ADEs Add Up to in Just 20 Minutes?
Remember, I said that ADEs add an additional $3.5 billion in healthcare costs.
• That’s $9.5M per day
• Almost $400K per hour, or $6,659 per minute
• Or, $133,181 healthcare costs added during this 20 minute presentation!
41
WVCCCCVCCC
It’s Not Just a Hospital Problem
• Most of a patient’s care occurs outside of the hospital in the community!
– Provider office and clinics
– Home health agencies—skilled and non-medical
– Nursing homes and long term care centers
– Acute rehab and acute long term care
– Community transitions of care providers
– Community paramedicine
– Hospice and palliative care providers
– Patients and caregivers (and their self-care practices)
42

Central Valley/West Valley Care Coordination Coalitions Quarterly Community Meeting
Health Services Advisory GroupMarch 9, 2017
–22–
WVCCCCVCCC
Factors That Contribute to ADEs
• Sub-optimal medication reconciliation
• Failure to confirm patient’s understanding of their medication regimen
• Inappropriate medication use by the patient and inappropriate prescribing
• Failure to monitor patient’s therapeutic lab values, drug treatment outcomes, and patient’s adherence
• Poor multidisciplinary communication and polypharmacy
43
WVCCCCVCCC
What Can You Do to Reduce ADEs?
Evaluate Processes
• Conduct staff competency checks
• Evaluate each step of your medication reconciliation
• Review the discharge process and instructions provided to patients regarding medications
• Assess the post-discharge follow-up calls (did you fill your prescriptions, do you have questions about your medications?)
Conduct Gap Analysis
• Observe staff
• Audit at least 30 charts
• Interview staff performing the task
• Interview patients
• Interview caregivers
44

Central Valley/West Valley Care Coordination Coalitions Quarterly Community Meeting
Health Services Advisory GroupMarch 9, 2017
–23–
WVCCCCVCCC
Best Practices to Reduce the Risk of ADEs
45
Best Practice Description
Pharmacist-led medication reconciliation and medication therapy review
Compares active medication orders to all of the current medications that the patient has been taking, identifies and addresses medication related problems (i.e., duplication of therapy, unnecessary medications, inappropriate dosing, drug-drug interactions)
Bedside delivery of medications prior to discharge
Prevents delay or interruption in medication therapy following discharge, verifies insurance coverage, manages prior authorizations or drug substitutions (i.e., therapeutic equivalent substitutions based on cost, availability, formulary, insurance)
Pharmacist-led discharge medication counseling
Provides information on proper medication administration, side effects, disease state education
Post-discharge follow up Reinforces the discharge plan, assesses patient retention of information, addresses patient questions and concerns, assesses medication therapy adherence
Medication Therapy Management (MTM)
Improves medication use, enhances health care professionals collaboration, enhances communication between patients and their health care team, encourages patient involvement
Comprehensive medication history
Assists with obtaining high quality, complete, and accurate medication history
WVCCCCVCCC
What Best Practices Have you Implemented?
Central Valley/West Valley Care Coordination Coalitions Quarterly Community Meeting
Health Services Advisory GroupMarch 9, 2017
–24–
Anticoagulation Therapy in Acute Rehab: Pharmacist engagement to increase therapy effectiveness and
reduce gaps in care at discharge
Robert Kronenberg, Pharm.D.
Director of Pharmacy
HealthSouth Valley of the Sun Rehabilitation Hospital
HealthSouth Valley of the Sun Rehab Hospital
Acute Rehabilitation Hospital
~ 600 Medicare pts annually
Anticoagulation
A Fib
DVT
Prophylaxis
Treatment

Central Valley/West Valley Care Coordination Coalitions Quarterly Community Meeting
Health Services Advisory GroupMarch 9, 2017
–25–
Warfarin
INR monitoring
Warfarin dosing
Patient education
Share information
Warfarin
H/H: 12/28/2016 9.3/27.5
INR Goal: 2-3
Ordering Physician: Dr. __________
Reason: A Fib Patient transferred with order for 4.5 mg and bridging w/Lovenox until INR > 2. Spoke with acute care pharmacist - pt fairly stable on 5 mg dose until treated with metronidazole. Since metronidazole completed they have been cautiously increasing the dose to return patient to therapeutic range. After 6 mg dose last night, INR 1.8 today
Plan: Give 6 mg dose tonight, monitor INR daily
Date Dec 29 Dec 30 Dec 31 Jan 1 Jan 2 Jan 3 Jan 4
INR --------- 1.7 1.8
Dose (mg) 4.5 6 6

Central Valley/West Valley Care Coordination Coalitions Quarterly Community Meeting
Health Services Advisory GroupMarch 9, 2017
–26–
Parenteral
Enoxaparin (Lovenox®)
Fondaparinux (Arixtra®)
Heparin
Novel Oral Anticoagulants
Free 1st month (manufracturer)/Coupons
Rivaroxaban (Xarelto®)
Apixaban (Eliquis®)
Dabigatran (Pradaxa®)
Insurance coverage

Central Valley/West Valley Care Coordination Coalitions Quarterly Community Meeting
Health Services Advisory GroupMarch 9, 2017
–27–
Bedside Delivery
Improve discharge safety
Improve patient satisfaction
Provide opportunity to communicate effectively
Concentrate on high-risk
Incorporate into admission reconciliation
Bedside Delivery

Central Valley/West Valley Care Coordination Coalitions Quarterly Community Meeting
Health Services Advisory GroupMarch 9, 2017
–28–
QUESTIONS???
WVCCCCVCCC
CVCCC /WVCCC Monthly Community News
What is happening in the community between our quarterly meetings?
• Sharing
– Trainings
– Webinars
– Toolkits
– Program updates
56

Central Valley/West Valley Care Coordination Coalitions Quarterly Community Meeting
Health Services Advisory GroupMarch 9, 2017
–29–
WVCCCCVCCC
Obtain the Best Medication History Possible
57
• Available at hsag.com
• View online or download
• No charge
• Community driven
• Reduce medication errors and adverse drug events
• Evidence-based and Innovative
• Reduce variability and Increase reliability
• Integrate into training
• Checklists and resources
WVCCCCVCCC
The Medication History Toolkit is Online
Two ways to get to the Medication History Toolkit online:
• 1. Medication History Toolkit shortcut: http://www.hsag.com/medication-history-toolkit
• 2. Follow clicks to www.hsag.com > For Medicare Providers > Arizona > No Place Like Home/Care Coordination > No Place Like Home Tools & Resources (right-hand nav) > Medication Management
Choose from the download in the top descriptor, or scroll down and choose “View Resource”
To learn more, contact Ettie Lande at [email protected]
58

Central Valley/West Valley Care Coordination Coalitions Quarterly Community Meeting
Health Services Advisory GroupMarch 9, 2017
–30–
WVCCCCVCCC
Using Teach-Back Takes Training and Practice
• Research shows that patients remember and understand only half of what clinicians explain to them.
• Teach-back is a way to confirm that you have explained to the patient what they need to know in a manner that the patient understands.
• HSAG staff members can provide no charge on-site training for your staff.
59
WVCCCCVCCC
Teach-Back Training
60
Want to share this training with your staff? Schedule a training now! Contact Jenna Burke at:
[email protected] or 602.801.6652

Central Valley/West Valley Care Coordination Coalitions Quarterly Community Meeting
Health Services Advisory GroupMarch 9, 2017
–31–
WVCCCCVCCC
Finding Resources Can Be Overwhelming
61
• Providers unaware of existing community resources
• Patients who struggle with socio-economic challenges often readmit when these needs remain unmet
• A community workgroup developed the—
“Community Resource Guide of Guides”
WVCCCCVCCC
Community Resource Guide Training
62
Want to share this training with your staff? Schedule a training now! Contact Jenna Burke at:
[email protected] or 602.801.6652

Central Valley/West Valley Care Coordination Coalitions Quarterly Community Meeting
Health Services Advisory GroupMarch 9, 2017
–32–
WVCCCCVCCC
Behavioral Health Webinar Series
Past sessions are recorded and available at:
hsag.com/events
Go to the calendar date to find the recorded link
Session 1: Behavioral Health BasicsFriday, January 13, 2017
Session 2: Understanding Common DisordersFriday, March 3, 2017
63
WVCCCCVCCC
Behavioral Health Webinar Series
64
SESSION 3: De-escalation Techniques Friday, May 5, 2017 • 9–10 a.m.SESSION 4: Community and Behavioral Health Resources Friday, July 14, 2017 • 9–10 a.m.SESSION 5: Voluntary vs. Involuntary TreatmentFriday, September 8, 2017 • 9–10 a.m.SESSION 6: Medication and Medical Issues
Friday, November 3, 2017 • 9–10 a.m.
Save the Dates
For more information, Contact Dennette Janus at [email protected]

Central Valley/West Valley Care Coordination Coalitions Quarterly Community Meeting
Health Services Advisory GroupMarch 9, 2017
–33–
WVCCCCVCCC
Quick Recap of Other HSAG Initiatives
• Arizona Nursing Home Quality Care Collaborative Learning Sessions
– May 2: Camp Verde
• Outpatient Antibiotic Stewardship Initiative
– Get no-cost assistance implementing the Centers for Disease Control and Prevention (CDC) Core Elements
– https://www.youtube.com/watch?v=dkhu2gOY_gI
65
For more information, Contact Keith Chartier at [email protected]
WVCCCCVCCC
CVCCC / WVCCC Quarterly Community2017 Meeting Schedule
66
Meeting Date and Time Where Registration Required
ThursdayMarch 9, 2017
8:30-11:45 a.m.
Health Services Advisory Group3133 East Camelback Road
Phoenix, AZ 85016
ThursdayJune 13, 2017
8:30–11:45 a.m.
Mayo Clinic Hospital Waugh Auditorium
5777 East Mayo Blvd.Phoenix, AZ 85054
http://www.cvent.com/d/cvqthx
ThursdaySeptember 26, 2017
8:30–11:45 a.m.Location to be Determined http://www.cvent.com/d/pvqh7g
TuesdayNovember 7, 2017
8:30–11:45 a.m.
Mayo Clinic Hospital Waugh Auditorium
5777 East Mayo Blvd.Phoenix, AZ 85054
Registration Coming Soon!

Central Valley/West Valley Care Coordination Coalitions Quarterly Community Meeting
Health Services Advisory GroupMarch 9, 2017
–34–
Your Meeting Evaluation Feedback Is Needed
• Target: At least 85% of you will complete a meeting evaluation form.
• Please complete the evaluation before you leave today. (Fold in half and leave on the table).
• Your feedback is very important and highly valued.
67
Thank you!Ettie Lande, MS, [email protected]

Central Valley/West Valley Care Coordination Coalitions Quarterly Community Meeting
Health Services Advisory GroupMarch 9, 2017
–35–
This material was prepared by Health Services Advisory Group, the Medicare Quality Improvement Organization for Arizona, under contract with the Centers for Medicare & Medicaid Services (CMS),
an agency of the U.S. Department of Health and Human Services. The contents presented do not necessarily reflect CMS policy. Publication No. AZ-11SOW-C.3-03012017-01