EXPERIMENTAL AND ANALYTICAL INVESTIGATION OF THE SHEAR … · · 2018-02-07Figure 1-3...
154
EXPERIMENTAL AND ANALYTICAL INVESTIGATION OF THE SHEAR STRENGTH OF UNSTIFFENED TAPERED STEEL MEMBERS By: Nicholas A. Redmond Thesis submitted to the faculty of the Virginia Polytechnic Institute and State University in partial fulfillment of the requirements for the degree of MASTER OF SCIENCE In CIVIL ENGINEERING APPROVED: Dr. Thomas M. Murray, Chairman Dr. Finley A. Charney Dr. W. Samuel Easterling November 28, 2007 Blacksburg, Virginia
Transcript of EXPERIMENTAL AND ANALYTICAL INVESTIGATION OF THE SHEAR … · · 2018-02-07Figure 1-3...

EXPERIMENTAL AND ANALYTICAL INVESTIGATION OF THE SHEAR
STRENGTH OF UNSTIFFENED TAPERED STEEL MEMBERS
By:
Nicholas A. Redmond
Thesis submitted to the faculty of the
Virginia Polytechnic Institute and State University
in partial fulfillment of the requirements for the degree of
MASTER OF SCIENCE
In
CIVIL ENGINEERING
APPROVED:
Dr. Thomas M. Murray, Chairman
Dr. Finley A. Charney Dr. W. Samuel Easterling
November 28, 2007
Blacksburg, Virginia

EXPERIMENTAL AND ANALYTICAL INVESTIGATION OF THE SHEAR
STRENGTH OF UNSTIFFENED TAPERED STEEL MEMBERS
By Nicholas A. Redmond
Thomas M. Murray, Chairman
Civil and Environmental Engineering
ABSTRACT
Tapered beams and columns are often used in single story gable framed steel buildings
for reasons of economy. By varying the resistance to bending in similar proportion to the
bending moments, more economical structures can be obtained. The beam and column
connection, or knee area, is generally subject to the greatest bending moments. It is therefore
comprised of the deepest sections of the tapered members, which also possess the least resistance
to shear buckling.
The web element’s stress distribution in this region of relatively complicated geometry is
unknown. For this reason, web stiffening plates are commonly used to brace the slender web
elements against elastic shear buckling. The design and proper installation of these relatively
small elements, while proven to be effective, is also costly. Because it is desirable to remove the
stiffeners, the shear behavior of unstiffened tapered members near the moment connection was
the primary focus of this study. Four knee area specimens were tested to failure under simulated
gravity load conditions.
The specimens were analyzed according to the AISC shear provisions for prismatic
members. The appropriateness of a modified shear force, which accounts for the influence of
inclined flanges, and the role of initial web imperfections were examined as well. Finally an
analysis method which most consistently produces conservative results is proposed.

iii
ACKNOWLEDGEMENTS
I would like to express my sincere thanks to Dr. Thomas M. Murray for his influence and
patience throughout the course of this project. His insight and guidance in the experimental and
analytical phases of this study and finally the writing of this thesis were invaluable. I would also
like to thank Dr. Finley A. Charney and Dr. W. Samuel Easterling for their thoughtful review of
this work while serving on my advisory committee.
I would like to thank American Buildings Company for sponsoring this investigation, and
thereby financing a portion of my studies. I am also grateful to Mrs. Marion Via, for her
generous support of the Charles E. Via, Jr. Department of Civil Engineering, and to the Via
Endowment Program administrators for their expressed confidence in me through the Via
Research Fellowship. I am grateful to have been given the opportunity to study and work at
Virginia Tech.
I have benefited form the advice and experience of Mr. Brett Farmer, Mr. Dennis
Huffman and Mr. Clark Brown, and their practical contributions to the experimental phase of this
project are gratefully acknowledged. Working along side so many industrious and talented
people at the Structures and Materials Lab has been a pleasure, and I sincerely appreciate their
assistance during the experimental portion of this study. I would like to thank Jon Bagwell, Josh
Boggs, Adam Bowland, Eric Crispino, Brad Davis, Ben Dymond, Hunter Hodges, Bryan Loflin,
Chris McGill, Jim Ordija, Andres Sanchez, Mike Seek and Pratik Shah for their help and good
company.
I am grateful to all of my family for their support throughout my studies, and most
especially my wife Leah. Her confidence and friendship are my most valuable possessions.
Finally I am grateful to the Creator of the natural laws, the material resources, and the inquisitive
human minds that have made this study possible.

iv
TABLE OF CONTENTS _________________________________________________
Section Page
ABSTRACT.................................................................................................................................... ii
ACKNOWLEDGEMENTS........................................................................................................... iii
TABLE OF CONTENTS............................................................................................................... iv
LIST OF FIGURES ....................................................................................................................... vi
LIST OF TABLES........................................................................................................................ vii
CHAPTER 1 BACKGROUND ...................................................................................................... 1
1.1 General............................................................................................................................ 1 1.2 Literature Review............................................................................................................ 2
1.2.1 Tapered Members ....................................................................................................... 2 1.2.2 Theoretical Shear Buckling......................................................................................... 4 1.2.3 Experimental Shear Strength of Plate Girders ............................................................ 5 1.2.4 Determination of Shear Forces ................................................................................... 6 1.2.5 Experimental and Analytical Studies of Tapered Plate Girders ............................... 12
1.3 Scope and Purpose of Research .................................................................................... 13
CHAPTER 2 EXPERIMENTAL INVESTIGATION.................................................................. 15
2.1 Scope of Testing ........................................................................................................... 15 2.2 Test Specimens ............................................................................................................. 16 2.3 Test Setup...................................................................................................................... 18 2.4 Instrumentation ............................................................................................................. 18 2.5 Testing Procedures........................................................................................................ 22 2.6 Test Results................................................................................................................... 23
2.6.1 Test SH-1-1............................................................................................................... 24 2.6.2 Test SH-1-2............................................................................................................... 25 2.6.3 Test SH-1-3............................................................................................................... 26 2.6.4 Test SH-1-4............................................................................................................... 27 2.6.5 Test SH-2-1............................................................................................................... 27 2.6.6 Test MH-1-1.............................................................................................................. 28 2.6.7 Test MH-1-2.............................................................................................................. 29 2.6.8 Test LH-1-1............................................................................................................... 29
2.7 Material Properties........................................................................................................ 30 2.8 Initial Imperfections...................................................................................................... 33 2.9 Web Shear Strains......................................................................................................... 38

v
CHAPTER 3 ANALYTICAL INVESTIGATION....................................................................... 42
3.1 General.......................................................................................................................... 42 3.2 Geometry....................................................................................................................... 42 3.3 Analysis Details ............................................................................................................ 45
3.3.1 Determination of Web Shear Forces......................................................................... 45 3.3.2 AISC Shear Provisions for Prismatic Members........................................................ 47
3.4 Analysis Results............................................................................................................ 49 3.4.1 Shear Forces at Failure.............................................................................................. 49 3.4.2 Predicted Shear Strength........................................................................................... 50
CHAPTER 4 COMPARISON OF ANALYTICAL AND EXPERIMENTAL RESULTS.......... 52
4.1 General.......................................................................................................................... 52 4.2 Measured Web Strain.................................................................................................... 53 4.3 Discussion..................................................................................................................... 55
CHAPTER 5 CONCLUSIONS AND RECOMMENDATIONS................................................. 57
5.1 Summary and Conclusions ........................................................................................... 57 5.2 Recommendations for Future Research ........................................................................ 58
REFERENCES ............................................................................................................................. 59
APPENDIX A. TEST SH-1-1 RESULTS.............................................................................. 62
APPENDIX B. TEST SH-1-2 RESULTS.............................................................................. 74
APPENDIX C. TEST SH-1-3 RESULTS.............................................................................. 82
APPENDIX D. TEST SH-1-4 RESULTS.............................................................................. 90
APPENDIX E. TEST SH-2-1 RESULTS.............................................................................. 98
APPENDIX F. TEST MH-1-1 RESULTS........................................................................... 106
APPENDIX G. TEST MH-1-2 RESULTS........................................................................... 118
APPENDIX H. TEST LH-1-1 RESULTS............................................................................ 126
APPENDIX I. SAMPLE CALCULATIONS ......................................................................... 138
Vita.............................................................................................................................................. 147

vi
LIST OF FIGURES _________________________________________________
Figure Page
Figure 1-1 Flange Stresses Due to Bending.................................................................................... 7 Figure 1-2 Bresler et al. Modified Shear ........................................................................................ 8 Figure 1-3 Blodgett’s Modified Shear (Reduced Web Shear)...................................................... 10 Figure 1-4 Blodgett’s Modified Shear (Increased Web Shear) .................................................... 11 Figure 2-1 Typical Rigid Frame and Knee Connection Detail ..................................................... 15 Figure 2-2 General Test Setup ...................................................................................................... 16 Figure 2-3 Test Specimen Nomenclature ..................................................................................... 18 Figure 2-4 Typical Test Setup....................................................................................................... 19 Figure 2-5 SH-1 LVDT’s and Web Strain Gages as viewed from the North ............................... 20 Figure 2-6 SH-1 Flange and Web Strain Gages as viewed from the South.................................. 21 Figure 2-7 SH-1 and SH-2 Web Plane Measurement................................................................... 33 Figure 2-8 Transverse Out of Plane Tolerance ............................................................................. 34 Figure 2-9 Longitudinal Out of Plane Tolerance.......................................................................... 35 Figure 2-10 SH-1 Rafter Web Surface.......................................................................................... 36 Figure 2-11 SH-2 Column Web Surface....................................................................................... 37 Figure 2-12 LH-1 Rafter Web Surface ......................................................................................... 37 Figure 2-13 MH-1-1 Rafter Shear Stresses at 5% to 25% of Failure Load .................................. 38 Figure 2-14 Location of Shear Stress Elements from Strain Data................................................ 39 Figure 2-15 SH-1-1 Rafter Stresses at 5% to 25% of Failure Load.............................................. 41 Figure 2-16 LH-1-1 Rafter Web Stresses at 5% to 25% of Failure Load..................................... 41 Figure 3-1 Typical Analysis Geometry......................................................................................... 43 Figure 3-2 Flange Contributions to Modified Web Shear ............................................................ 46

vii
LIST OF TABLES _________________________________________________
Table Page
Table 2-1 Knee Connection Details.............................................................................................. 17 Table 2-2 Nominal Specimen Dimensions ................................................................................... 17 Table 2-3 Test Results .................................................................................................................. 23 Table 2-4 Coupon Results............................................................................................................. 32 Table 2-5 Web Plane Measurements ............................................................................................ 35 Table 2-6 Comparison of Web Deviations to Tolerance .............................................................. 36 Table 2-7 Web Shear Forces from Shear Strain Data................................................................... 40 Table 3-1 Analysis Geometry ....................................................................................................... 44 Table 3-2 Analysis Geometry for Sumner et al. Specimens......................................................... 44 Table 3-3 Unmodified and Modified Shear .................................................................................. 49 Table 3-4 Sumner et al. Specimens Unmodified and Modified Shear ......................................... 50 Table 3-5 Predicted Shear Strength .............................................................................................. 51 Table 3-6 Sumner et al. Specimens Predicted Shear Strength...................................................... 51 Table 4-1 Comparison of Experimental and Predicted Shear Strength ........................................ 52 Table 4-2 Sumner et al. Experimental and Predicted Shear Strength........................................... 53 Table 4-3 Shear Forces from Strain Data ..................................................................................... 53

1
CHAPTER 1
BACKGROUND
1.1 General
Tapered beams and columns are often used in single story gable framed steel buildings
for reasons of economy. By increasing the resistance to bending in similar proportion to the
increased bending moments, more economical structures can be obtained. The presence of
varying bending moment is always accompanied by shearing stresses. While the design of
members with variable cross-section for the resistance of flexural stresses has been thoroughly
investigated, the design of tapered members for resistance to shear has not. The current design
practice for sizing such structural elements for shear loads is to treat them as non tapered
elements and employ established methods for prismatic beams.
While the resistance of an I-shaped member to flexural stresses is generally increased as
the web height increases, the opposite is true of a slender web’s resistance to shear buckling.
The connection details of such structures typically account for full moment continuity at the
deeper end, and the narrow ends are in the locations of lowest moment. The beam and column
connection, or knee joint, is made through the use of bolted moment end-plates, allowing for
individually built-up welded beams and columns to be shop fabricated, with only bolt
connections required during construction, which is also economical. This knee area of the frame
is subject to the greatest bending moment, and therefore comprised of the deepest sections of the
tapered members, which also possess the least resistance to shear buckling.
The actual shear capacity of the web elements in this region of relatively complicated
geometry is unknown. For this reason, web stiffening plate elements are commonly used to
brace the web against shear buckling. The design and proper installation of these relatively small
elements, while proven to be effective, can be costly.
The elastic shear buckling strength of the webs of tapered members near the moment
connection was the primary focus of this study. Four gable frame knee area sub-assemblies were
tested to failure under simulated gravity loads. The shear forces in the webs were determined in
two different ways. The first is simply the applied shear force at the cross-section of interest,
and is called the unmodified shear force. A modified shear force was also determined which
2
assumes that the inclined flanges reduce the shear force carried by the web. These results were
compared to the current AISC design provisions for prismatic member shear design.
This study addresses the appropriateness of a modified shear force and the possible
influence of initial web imperfections on the shear performance of slender unstiffened tapered
steel members. The predicted strengths are compared to the modified and unmodified
experimental shear forces, and an analysis method which most consistently produces
conservative results is proposed.
1.2 Literature Review
1.2.1 Tapered Members
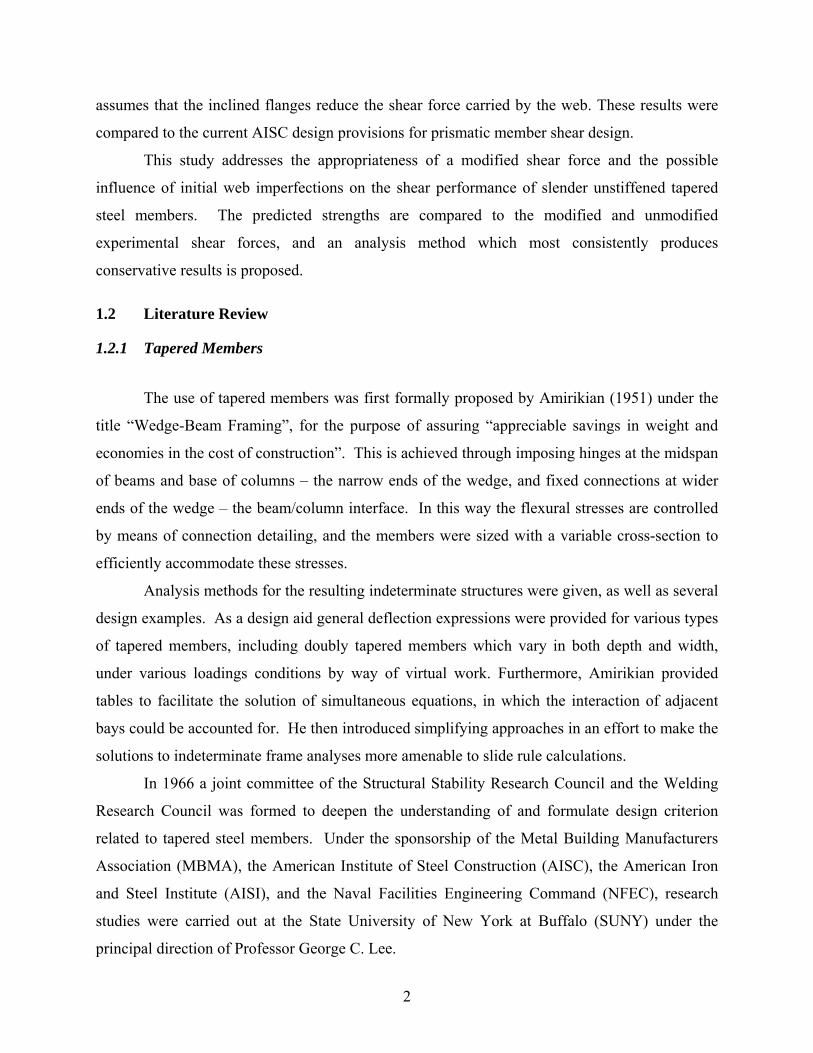
The use of tapered members was first formally proposed by Amirikian (1951) under the
title “Wedge-Beam Framing”, for the purpose of assuring “appreciable savings in weight and
economies in the cost of construction”. This is achieved through imposing hinges at the midspan
of beams and base of columns – the narrow ends of the wedge, and fixed connections at wider
ends of the wedge – the beam/column interface. In this way the flexural stresses are controlled
by means of connection detailing, and the members were sized with a variable cross-section to
efficiently accommodate these stresses.
Analysis methods for the resulting indeterminate structures were given, as well as several
design examples. As a design aid general deflection expressions were provided for various types
of tapered members, including doubly tapered members which vary in both depth and width,
under various loadings conditions by way of virtual work. Furthermore, Amirikian provided
tables to facilitate the solution of simultaneous equations, in which the interaction of adjacent
bays could be accounted for. He then introduced simplifying approaches in an effort to make the
solutions to indeterminate frame analyses more amenable to slide rule calculations.
In 1966 a joint committee of the Structural Stability Research Council and the Welding
Research Council was formed to deepen the understanding of and formulate design criterion
related to tapered steel members. Under the sponsorship of the Metal Building Manufacturers
Association (MBMA), the American Institute of Steel Construction (AISC), the American Iron
and Steel Institute (AISI), and the Naval Facilities Engineering Command (NFEC), research
studies were carried out at the State University of New York at Buffalo (SUNY) under the
principal direction of Professor George C. Lee.

3
Design of Single Story Rigid Frames (Lee et al. 1981) is a published summary of more
than a decade of research work undertaken at SUNY, and offers a discussion on indeterminate
frame analysis, descriptions of tapered member behavior under various loading conditions, as
well as extensive design examples. It is claimed that tapered members are used in construction
both to provide an aesthetically pleasing frame outline, and also to achieve comparatively large
reductions in weight. It also stated that tapered members are best designed according to elastic
rather than plastic analysis, due to the fact that plastic design assumes that inelastic yielding and
plastic rotation occur locally, after which bending stresses are redistributed. The design of
tapered members is motivated by a desire to develop elastic yield stresses in a more uniform
manner, by closely matching the member’s flexural resistance to the demand. Thus areas of low
bending stress do not exist to safely allow the redistribution of stress associated with a plastic
hinge mechanism.
Several Welding Research Council (WRC) Bulletins were published from the work
conducted at SUNY, which addressed the analytical and experimental results of investigations
into various stress conditions of web tapered, welded steel I-shaped members. The first and
foremost of these papers dealt with the theoretical axial and bending stress analyses of tapered
members, and then proposed design formulas for adequate proportioning of I-shaped tapered
members. The design formulas were extensions of the then governing AISC-ASD provisions for
prismatic members, algebraically modified to account for the tapering geometry (Lee et al.
1972). Other WRC Bulletins concerned various aspects of tapered member design. The
essential approach taken throughout the SUNY body of work was to use prismatic member
provisions, applied with an adjusted tapered beam length and section properties associated with
the critical cross-section for the load type under consideration.
These adapted provisions, first codified as a supplement (AISC 1974) to the Specification
for the Design, Fabrication and Erection of Structural Steel Buildings (1969), endured relatively
little revision until finally being removed entirely from the 2005 AISC Specification for
Structural Steel Buildings (AISC 2005a). Throughout the tapered member provisions’ tenure in
the AISC Specifications, treatment of both shear design and concentrated forces were referenced
to the applicable provisions for prismatic members.
4
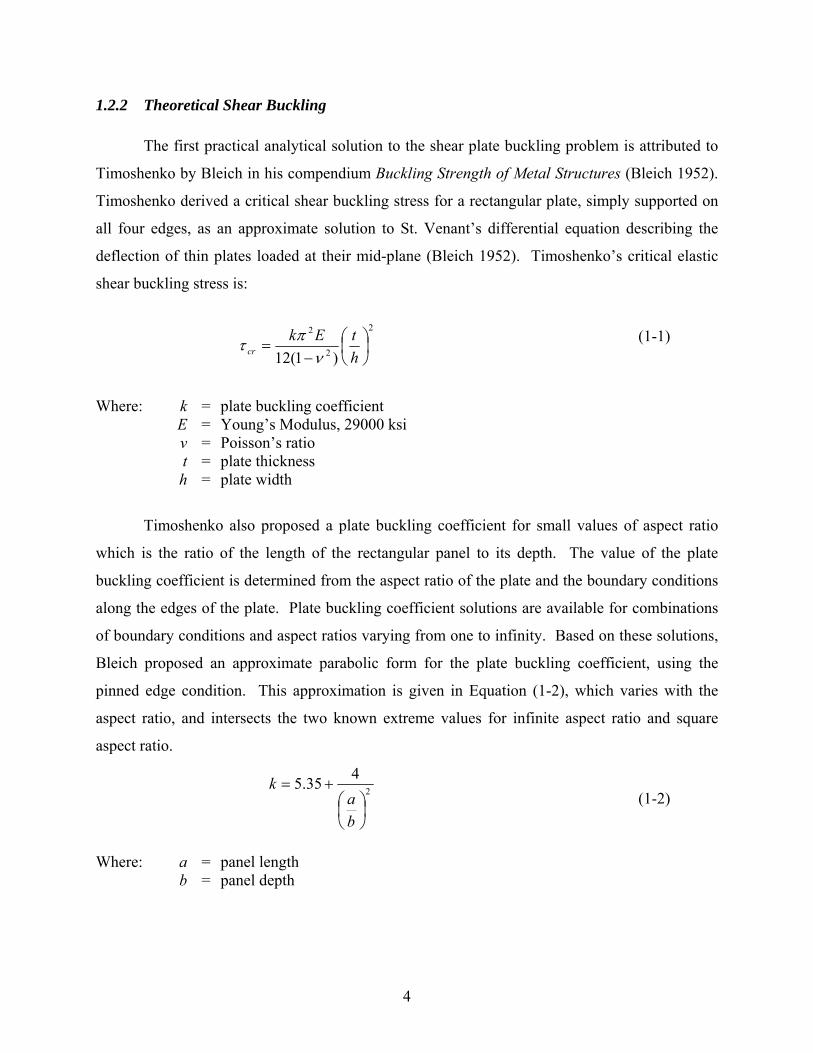
1.2.2 Theoretical Shear Buckling
The first practical analytical solution to the shear plate buckling problem is attributed to
Timoshenko by Bleich in his compendium Buckling Strength of Metal Structures (Bleich 1952).
Timoshenko derived a critical shear buckling stress for a rectangular plate, simply supported on
all four edges, as an approximate solution to St. Venant’s differential equation describing the
deflection of thin plates loaded at their mid-plane (Bleich 1952). Timoshenko’s critical elastic
shear buckling stress is:
2
2
2
)1(12⎟⎠⎞
⎜⎝⎛
−=
htEk
cr νπτ (1-1)
Timoshenko also proposed a plate buckling coefficient for small values of aspect ratio
which is the ratio of the length of the rectangular panel to its depth. The value of the plate
buckling coefficient is determined from the aspect ratio of the plate and the boundary conditions
along the edges of the plate. Plate buckling coefficient solutions are available for combinations
of boundary conditions and aspect ratios varying from one to infinity. Based on these solutions,
Bleich proposed an approximate parabolic form for the plate buckling coefficient, using the
pinned edge condition. This approximation is given in Equation (1-2), which varies with the
aspect ratio, and intersects the two known extreme values for infinite aspect ratio and square
aspect ratio.
2
435.5
⎟⎠⎞
⎜⎝⎛
+=
ba
k(1-2)
Where: k = plate buckling coefficient E = Young’s Modulus, 29000 ksi
ν = Poisson’s ratio t = plate thickness h = plate width
Where: a = panel length b = panel depth

5
By this formulation, it is assumed that the longer plate dimension is always “a”. However in
plate girder design it is convenient to let “h” represent the girder depth, and “a” the length of the
panel. In this case Equation (1-1) is rewritten in the form:
( )2
2
2
112 ⎟⎟⎠
⎞⎜⎜⎝
⎛−
=
w
cr
th
Ek
ν
πτ(1-3)
With this form the aspect ratio can take values less than unity, and as such Equation (1-2)
requires a new formulation. The plate buckling coefficients for plate girders are:
2
34.500.4
⎟⎠⎞
⎜⎝⎛
+=
ha
k
2
0.434.5
⎟⎠⎞
⎜⎝⎛
+=
ha
k
for 1≤⎟⎠⎞
⎜⎝⎛
ha
for 1≥⎟⎠⎞
⎜⎝⎛
ha
(1-4a)
(1-4b)
These plate buckling coefficients were derived for a web plate that is simply supported at
all four edges. Though not true for built up plate girder webs, this formulation has been
generally accepted as sufficient for design purposes, and the treatment of the web as simply
supported at the flanges is a conservative estimate. While the use of this conservative
simplification is a matter of some contention, the codified standards for steel design still make
this assumption (AISC 2005a). It is also generally assumed that for relatively slight tapering
angles, the rectangular plate shear buckling relationships are adequate.
1.2.3 Experimental Shear Strength of Plate Girders
The current codified design of plate girders for shear effects has its empirical base in
work conducted at Lehigh University from 1957 to 1960 by Konrad Basler and Bruno
Where: h = girder web height tw = web panel thickness
Where: h = girder web height a = panel length between transverse stiffeners

6
Thurlimann. The purpose of the investigation was to more quantitatively determine the influence
of post-buckling strength observed in stiffened plate girders, for which plate buckling theory had
been unable to account. Experimental results were published in a Welding Research Council
Bulletin, and analytical results were published as three separate papers concerning independently
the strength of plate girders in bending (Basler and Thurlimann 1961), shear (Basler 1961a), and
the combined effects thereof (Basler 1961b). Although the studies were primarily directed at
stiffened plate girders, the design for shear forces in unstiffened members has been influenced by
results of Basler (1961a).
The interaction between shear and flexure is certainly of interest in the study of shear
force effects in tapered members, due to the fact that a member may not be loaded in shear
without the presence of flexural load effects. Also the compressive web stresses due to flexure
may act to destabilize the web, while tensile stresses might have a stabilizing effect with regard
to shear buckling. These interactions are however not supported by any analytical evidence, and
the interaction of flexure and shear as defined by Basler (1961b) is an empirical relationship
based on stiffened web panel tests which include the effects of a post buckling tension field. As
such, the flexure and shear interactions in tapered unstiffened members cannot be explicitly
denied, nor can they be applied ad hoc to the current study without further investigation.
1.2.4 Determination of Shear Forces
The determination of shear forces which a tapered member must be designed to resist is
still a matter of some controversy. Clearly the most basic and conservative approach would
assume that all of the internal shear forces, required by equilibrium to balance the externally
applied shear loads, be supplied by the web which is the case with prismatic members. Several
rational methods for the unique treatment of web shear forces in members of variable cross-
section have been proposed in the literature. All of these recommendations offer effectively the
same advice, with varying degrees of simplification, and will be generally referred to as modified
shear.
Williams and Harris (1957) offered possibly the first discussion of the influence of
inclined flanges on the web shear forces. Figure 1-1 shows the authors’ description of flange
forces due to flexural stresses. The motivation for the proposed orientation of flange forces was
that the principal stresses at the extreme fibers of the cross-section are parallel to the edge of the

7
flange. By this argument, the normal force due to bending stresses is a component of the flange
force.
Ptf,n
PtfPtf,t
M
V
α
R
yf
Pcf,n
PcfPcf,t
yf
Figure 1-1 Flange Stresses Due to Bending
They proposed that under an elastic flexural stress distribution, the compression flange
axial force, Pcf could be closely approximated by the following:
)cos(αIMyA
P ffcf = (1-5)
This is an approximate solution because the moment of inertia has been simplified. This
moment of inertia is computed using the flange plate area, Af rather than the more precise flange
area normal to the cross-section, Af/cos(α) where α is the angle that defines the taper of the
flange. The authors claimed that the calculation of transverse flange stresses can be accurately
Where: Pcf = axial compression flange force Af = area of the flange plate, (bf x tf)
yf = distance from section neutral axis to flange center of gravity I = moment of inertia of the cross-section computed with flange plate area

8
based on a simplified moment of inertia when a large concentration of the cross-section is
contained in the flanges. The transverse component of this force, parallel to the cross-section, is:
)sin(, αcftcf PP = (1-6)
The transverse force component of the tension flange force, Ptf,t is found similarly. Finally, the
modified shear force resisted by the web is:
ttftcfw PPVV ,, −−= (1-7)
Another of the first attempts to describe the stresses in tapered members was given by
Bresler et al. (1968) which was first published in 1960. The authors suggested that for any
element in a cross-section, radial stresses could be resolved into normal and shearing stress
components. It is suggested that the integration of these shear stresses on the cross-sectional
area, added to the tangential shear stresses, are equal to the external shear force acting on the
cross-section. This concept is shown graphically in Figure 1-2.
σn=My/Iσr=σn/cos(β)σv=σntan(β)
M
V
R
y
α
β
Figure 1-2 Bresler et al. Modified Shear

9
In this case, the sum of the shear force components resulting from the radial stresses
acting on the cross-section is:
∫= dAV vr σ (1-8)
Where: σv = shear component of radial stress, σv = σr (sin(β)) = σn (tan(β) σn = normal flexural stress, My/I σr = radial stress, σn /(cos(β)) β = angle to area element; varies from 0 at neutral axis to α at extreme fibers
The remainder of the shear force required for equilibrium is made up of what the authors call
tangential shearing stresses acting on the cross-section. It is recommended that the effect of
these tangential stresses be approximated by:
ItQVt=τ (1-9)
Equilibrium is then satisfied by:
tr VVV += (1-10)
In this way the shear force that a prismatic beam would be required to resist, Vt is reduced by the
transverse components of forces from radial flexural stresses. Identical recommendations were
presented by Tall (1974).
Blodgett (1966) proposed a determination of web shear forces very similar to that of
Williams and Harris (1957), with the simplifying assumption that all of the bending stresses are
concentrated in the flanges. These stresses are then resolved into components normal and
Where: τ = tangential shear stress Vt = force that produces τ, Vt = V - Vr
V = total shear force on the cross-section I = cross-section moment of inertia t = cross-section element thickness Q = first area moment

10
parallel to the transverse cross-section. Figure 1-3 provides reference for the following
compression flange transverse force:
)tan(, αdMP tcf = (1-11)
Ptf,n
PtfPtf,t
M
V
α
R
d
Pcf,n
PcfPcf,t
Figure 1-3 Blodgett’s Modified Shear (Reduced Web Shear)
For this case of loading, the following equilibrium of vertical forces must be satisfied,
which reduces the shear resistance required of the web:
tfttfcweb PPVV ,, ++= (1-12)
Blodgett warns that care must be taken when applying this modified shear approach
because the influence of the flanges does not reduce the shear force in the web in all cases. The
Where: V = applied shear force at cross-section Vweb = shear resistance provided by web Pfc,t = compression flange contribution = (M/d)tan(α) Pft,t = tension flange contribution = (M/d)tan(α)

11
orientation of the member and the correct sense of the internal forces must be properly identified.
An example in which the flange contributes a force that increases the demand on the web beyond
that which should be required for equilibrium is shown in Figure 1-4. In this case the effect of
the negative bending moment in the flanges increases the web shear force required to satisfy
equilibrium.
Ptf,nPtf
Ptf,t
M
V
α
R
d
Pcf,nPcf
Pcf,t Figure 1-4 Blodgett’s Modified Shear (Increased Web Shear)
The vertical equilibrium for the orientation shown in Figure 1-4 is given by:
tfttfcweb PPVV ,, −−= (1-13)
It is noted that since the modified shear force proposed by Blodgett assumes the bending
moment is resisted only by the flanges, a larger transverse flange component and lower web
shear force results than if an elastic stress distribution is used.
Where: V = applied shear force at cross-section Vweb = shear resistance provided by web Pfc,t = compression flange contribution = (M/d)tan(α) Pft,t = tension flange contribution = (M/d)tan(α)
12
1.2.5 Experimental and Analytical Studies of Tapered Plate Girders
Little has been done to verify that the provisions for prismatic girder shear design also
apply to plate girders of variable cross-section. An experimental study of eight tapered member
knee area specimens by Sumner (1995) found that while the AISC provisions for flexure in
tapered steel members were quite accurate, the predicted shear strength of tapered plate girders
fell short of the experimental values obtained, in some cases by as much as 50 percent. It was
proposed that the conservative estimates were attributable to a tension field developed over the
full length of the tapered member, providing a post buckling reserve of strength.
By applying the tension field action provisions for prismatic girders provided in AISC
(1994), neglecting the upper limits on aspect ratios, and using the average panel depth to
determine the aspect ratio, less conservative values were obtained. This analysis was then
combined with a shear/flexure interaction provision for prismatic members. These results were
however somewhat inconclusive because only one of the specimens failed in shear, making
direct comparisons of predicted ultimate strength to actual shear capacity impossible. The lack
of evidence that shear buckling occurred also makes the assumption of post buckling strength
somewhat tenuous. The possible reduction in web shear forces due to the influence of inclined
flanges, or modified shear, was not investigated.
Mirambell and Zarate (2004) presented recommendations for the treatment of tension
field action as well as a shear and flexure interaction based on FEM analytical modeling. Prior
to this work, Mirambell and Zarate (2000) presented a shear buckling coefficient and critical
shear stress expression for web tapered members. A finite element model was created and
parametric studies conducted to determine the relative influence of flange slenderness, angle of
taper, and the ratio of flange width-greatest web depth, on the plate buckling coefficient.
One value of critical shear stress results from the proposed analysis, which is then applied
to the analysis of the web at the narrow end of the member. Presumably in design the web
thickness and aspect ratio would be determined such that the critical stress is not exceeded at the
narrow end of the specimen, as this was considered the critical cross-section in the development
of the plate buckling coefficients. This is somewhat counterintuitive, and one would expect the
critical buckling section to be at the cross-section of greatest slenderness. The analysis does not
include flanges of unequal thickness however, it might be reasonable to assume both flange

13
thicknesses equal to that of the thinner flange, as the effective restraint provided by the flange to
web rotation would be conservative.
The authors note that the boundary conditions are appropriate for a panel located near
the midspan of a stiffened member, and both ends of the panel are restrained against translation
in the longitudinal direction. The narrow end flanges are allowed to rotate about an axis normal
to the plane of the web, however the restraint against translation in the longitudinal direction
essentially fixes the narrow end rotationally. This allows a moment to be resisted at the narrow
end and is therefore inappropriate for end panels lacking the rotational restraint provided by
adjacent panels. Analysis of the specimens used in the current study according to these
provisions is inappropriate. However, the proposals by Mirambell and Zaraté show promise for
intermediate panels of stiffened tapered specimens, and warrant a comparison with experimental
data which cannot be offered here.
Prior to this study, a preliminary analytical investigation was conducted at Virginia Tech
by Sullivan and Charney (2006), to assess the feasibility of removing transverse stiffeners from
the knee area connection of gable and portal frames. The finite element model employed both
material and geometric nonlinearity to determine the relative influence of transverse web
stiffeners at the knee area of the frames. The study showed that removing the transverse
stiffeners reduced the buckling strength by approximately 16 percent, and therefore their
exclusion from the knee area was considered feasible.
Another Finite Element Method study of web tapered members was conducted by Shah
(2007), in conjunction with the current investigation. Both material and geometric nonlinearities
were accounted for in the models, and it was found that the predictions for ultimate loads were
higher than experimentally observed failure loads by about 40 percent. This difference was
attributed to idealized material response in the inelastic range, as well as to large measured initial
web imperfections which were not completely captured by the computer models.
1.3 Scope and Purpose of Research
The purpose of this study was to determine the shear capacity of unstiffened, linearly
tapered steel members with slender webs, and to recommend an efficient design method. These
objectives are addressed in the following way. In Chapter 2 the experimental study is described
in detail. The test assemblies and instrumentations used are described and a description and

14
interpretation of the results is given. Chapter 2 also contains a description of measurements
made of the initial imperfections present in the webs. Finally the distributions of shear stresses
determined form measured web shear strains are also presented. Chapter 3 contains a description
of the analysis methods used. A modified shear force similar to that proposed by Williams and
Harris (1957) and an unmodified shear force are used to describe the shear forces on the web.
The web shear strengths were predicted according to AISC provisions for prismatic members. A
comparison of the Experimental and Analytical results is presented in Chapter 4. Chapter 4 also
contains a presentation of six additional knee specimens which were previously tested at the
Virginia Tech Structures and Materials Laboratory, and were reevaluated with modified shear
forces for this study. Final conclusions are made in Chapter 5, and recommendations are
presented for future studies that might support and clarify the observations made in the current
study. Full details of the experimental tests as well as sample calculations follow in appendices.

15
CHAPTER 2
EXPERIMENTAL INVESTIGATION
2.1 Scope of Testing
Four specimens with a diagonal knee connection area, typical of rigid gable frame metal
buildings, were tested to study the significance of shear web buckling under negative moment
bending. Negative moment bending is defined as the moment direction causing compressive
stresses at the reentrant corner of the knee area, and is the condition which occurs under gravity
loads acting on the roof. The tests were conducted at the Virginia Tech Structures and Materials
Research Laboratory and were sponsored by American Buildings Company (ABC). Each test
specimen consisted of a column and a portion of a rafter, the design of which was conducted by
ABC. As shown in Figure 2-1, the column and rafter were bolt connected on a diagonal, with
the flush moment end plates on both the rafter and the column oriented at an acute angle to their
respective outside flange. This connection typically includes transverse web stiffeners also
shown in Figure 2-1.
Figure 2-1 Typical Rigid Frame and Knee Connection Detail

16
The elastic shear buckling strength of the webs, in the absence of transverse stiffeners,
was the focus of this investigation.
2.2 Test Specimens
Each test specimen was a sub-assemblage consisting of one column and a portion of the
rafter of a particular rigid frame bent, with the rafter portion extending approximately to the first
inflection point. The inflection point is the point of zero bending moment under the Allowable
Stress Design (ASD) gravity load combination of 15.3 psf live load and 2.5 psf dead load. The
column and rafter sections were tested in the orientation shown in Figure 2-2. The line of action
of the applied load passed through the column base and the inflection point on the rafter section.
In this way the axial, shear and moment in the knee area were representative of the internal
forces present in the actual rigid frame, but the orientation and size of the test was more
conducive to laboratory testing than a full scale specimen.
RollerSupport
PinnedSupport
HydraulicActuator
Lateral BracePoints
Load Cell Direction ofLoading
Figure 2-2 General Test Setup
Column and Rafter depths at the reentrant corners, along with connection details are
found in Table 2-1. Further details and specimen dimensions are given in Appendices A through
H. The test designations SH, MH and LH refer to the three sizes of tested specimens (Haunches)
small, medium and large. The column and rafter built up sections were fabricated from steel
plate and sheet material having nominal yield stresses of 50-55 ksi. The ASTM material
specifications were ASTM A572 GR 55, with two exceptions: ASTM A529 GR 50/55 for the
17
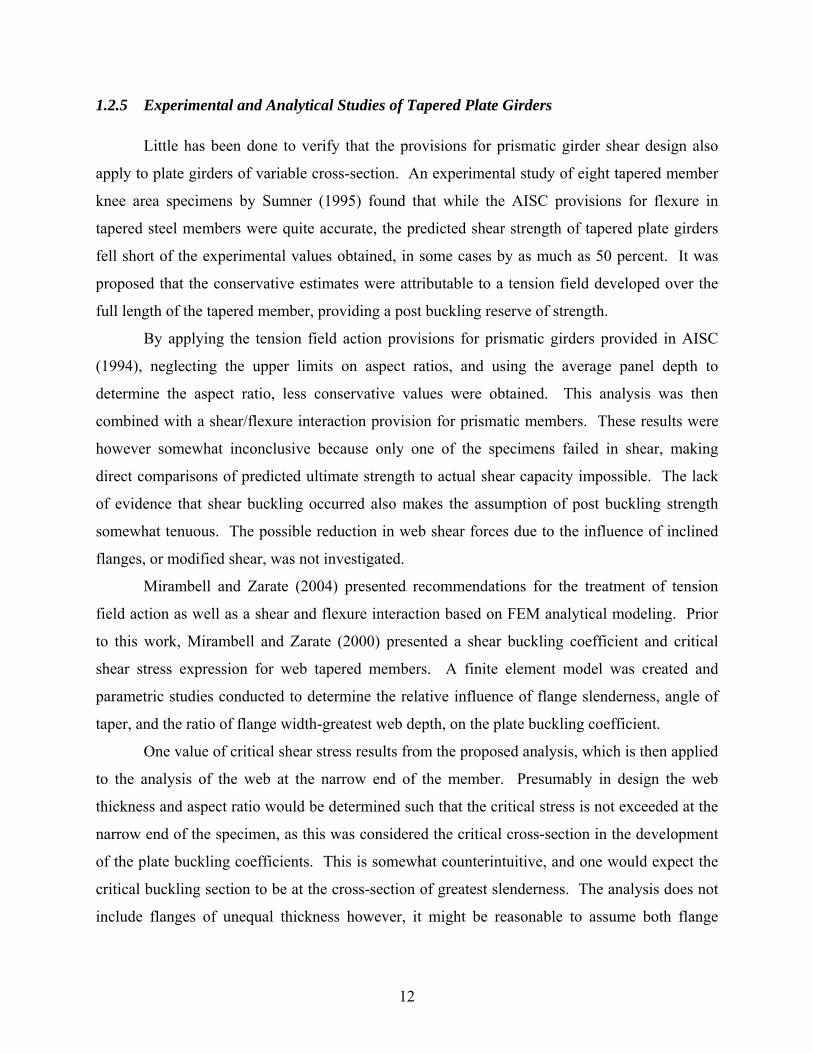
small specimen flanges and end plates (SH-1 and SH-2), and ASTM A1011 GR 55 for the small
specimen webs. These designations are from Material Test Reports furnished by ABC from
independent testing agencies.
Table 2-1 Knee Connection Details
SH-1 22.00 22.13 6/10 3/4 A490 0.5SH-2 22.81 22.13 6/10 3/4 A490 0.5MH-1 35.94 35.63 12/18 3/4 A490 0.75
LH-1 59.50 59.75 10/18 3/4 A490 0.75 column 0.625 rafter
* Measured dimensions, otherwise nominal. Note: Column and Rafter depth is measured perpendicular to outside flange, at reentrant corner
Bolt Diameter (in.) Bolt Type End Plate
Thickness (in.)Specimen *Depth of Column (in.)
*Depth of Rafter (in.)
No. of Bolts at Outside
Flange/Total No.
The flush moment end-plates were designed using snug tightened A325 bolts. However
in an effort to insure that bolt failure would not inhibit the full development of the web shear
capacity, A490 bolts were used. The target pretension was 50% of the specified minimum
pretension for A325 bolts. Nominal dimensions for each specimen are in Table 2-2, with
definitions given in Figure 2-3.
Table 2-2 Nominal Specimen Dimensions
SH-1 6 0.375 0.131 6 0.375 0.131SH-2 6 0.375 0.131 6 0.375 0.131
0.5 outside 0.5 outside 0.75 inside 0.75 inside
LH-1 12 0.625 0.3125 12 0.625 0.3125
8 0.25MH-1 8 0.25
Specimen Column Flange Width (in.)
Column Flange Thickness (in.)
Column Web Thickness (in.)
Rafter Flange Width (in.)
Rafter Flange Thickness (in.)
Rafter Web Thickness (in.)
Details of each tested specimen, including measured dimensions and test data, can be
found in Appendices A through H. The specimen designations include two fields. The first
contains the haunch size of small (SH), medium (MH) or large (LH). The second is the
specimen number, as there were two small haunches. A number of separate tests were conducted
on several of the specimens and these are described in more detail in Section 2.6. In this section
there is a third field in the specimen designation which represents the test number.

18
Column Depth at Reentrant CornerRafter Depth at Reentrant Corner
Column Outside Flange Rafter Outside Flange
Column Inside Flange
Rafter Inside Flange
Figure 2-3 Test Specimen Nomenclature
2.3 Test Setup
All test setups were constructed by laboratory personnel. A pin connection was provided
at the column end of the specimen and a pinned roller assembly at the rafter section end, as
depicted in Figure 2-2. The load was applied using a 200 ton capacity, double acting hydraulic
actuator (Enerpac RR200-13). The connection region of each specimen was whitewashed prior
to loading so that the flaking of mill scale could be used as an indicator of local yielding during
the test.
Lateral brace mechanisms were attached to the column and rafter section at locations
specified by ABC. The lateral brace mechanisms were anchored to laboratory reaction frames,
and prevented translation out of the plane of the webs, but permitted movement within this plane.
Figure 2-4 is a representative photograph of the test setups.
2.4 Instrumentation
Instrumentation consisted of a load cell, displacement transducers, bolt strain gages, uni-
directional strain gages and rectangular rosette strain gages. All instrumentation output was
processed and collected using a PC based data acquisition system. The applied load was

19
measured using a 200 kip capacity load cell, which was calibrated prior to testing with a
universal testing machine.
Figure 2-4 Typical Test Setup
Wire type displacement transducers were used to measure the displacement at both ends
of the specimen, along the line of action of the force application. The difference between these
measurements provided a deflection measurement of the roller end with respect to the pinned
end, and is referred to as “chord displacement”. LVDT type displacement transducers were used
to measure out of plane displacement of both column and rafter webs adjacent to the moment end
plates. These LVDT’s were attached to fixtures which were supported by the flanges and end
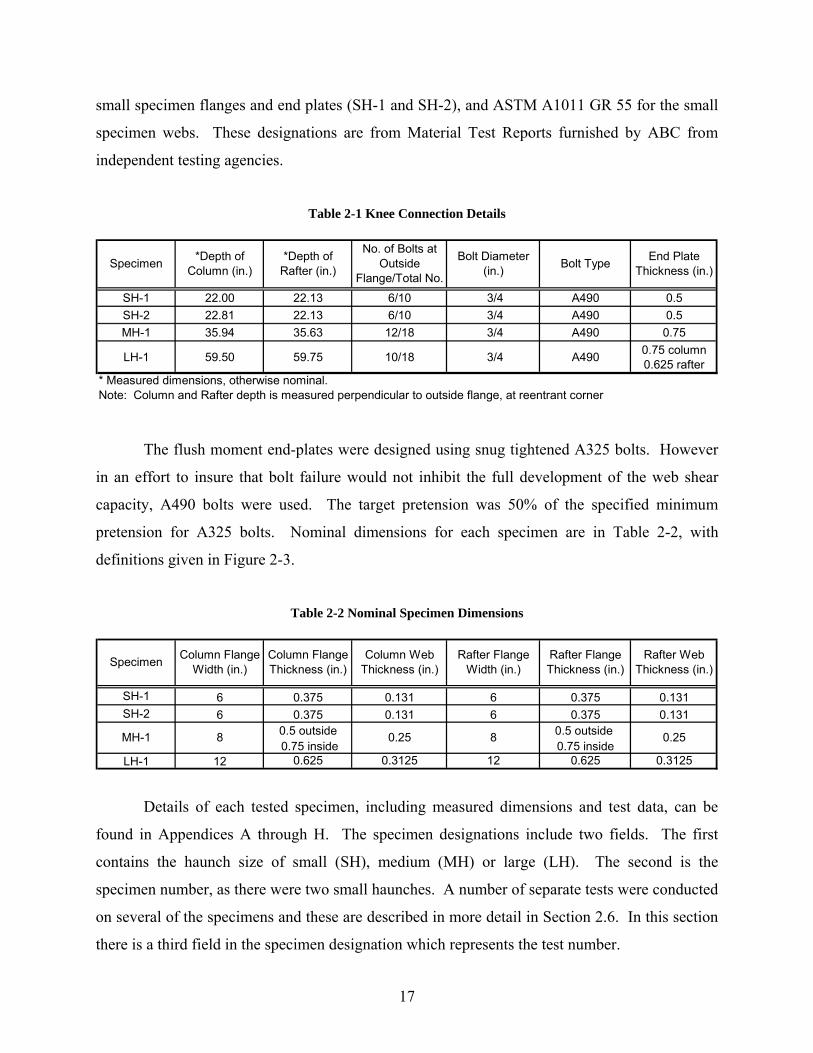
plates of the column and rafter. Three LVDT’s were mounted over the web of both the rafter
and the column, 2 in. from the cross-section containing the strain gages (gage line), as shown in
Figure 2-5. There are three fields in the LVDT designations xPy where “x” represented rafter
20
(R) and column (C), P indicates a plunger type instrument, and “y” corresponds to the location
along the gage line with A being nearest the outside flange, B at the middle of the web, and C
nearest the inside flange. The web LVDT’s were located on the north face of the specimens. The
layout for the specimen SH-1 is shown in Figure 2-5, which represents the general arrangement
for all test specimens except SH-2, which did not have strain gages on the webs or the inside
flanges.
L/6
L/3
L/3
L/62" typ.
Rafter Column
12
3
12
3
CPA
CPB
CPC
RPA
RPB
RPC
RWA
RWB
RWC
CWC
CWB
CWA
Figure 2-5 SH-1 LVDT’s and Web Strain Gages as viewed from the North
Strain gage instrumented bolts were used in an alternating sequence in the tension side of
the connection, as is shown in Appendices A through H. Bolt strain gages were installed in 2
mm diameter holes drilled through the bolt head into the unthreaded portion of the bolt shank.
The bolts were calibrated up to the RCSC Specification AISC (2005b) minimum bolt pretension
given for ¾ in. A325 bolts. This was done prior to testing using a universal testing machine, by
establishing a factor by which the measured strain could be directly related to bolt force, so that
21
the proper specified pretension could be obtained. While the connections were designed using
A325 bolts, A490 bolts were used in an effort to insure that premature bolt failure would not
inhibit the full development of the web shear capacity. These bolts were treated as A325 bolts
with regard to pretension procedures.
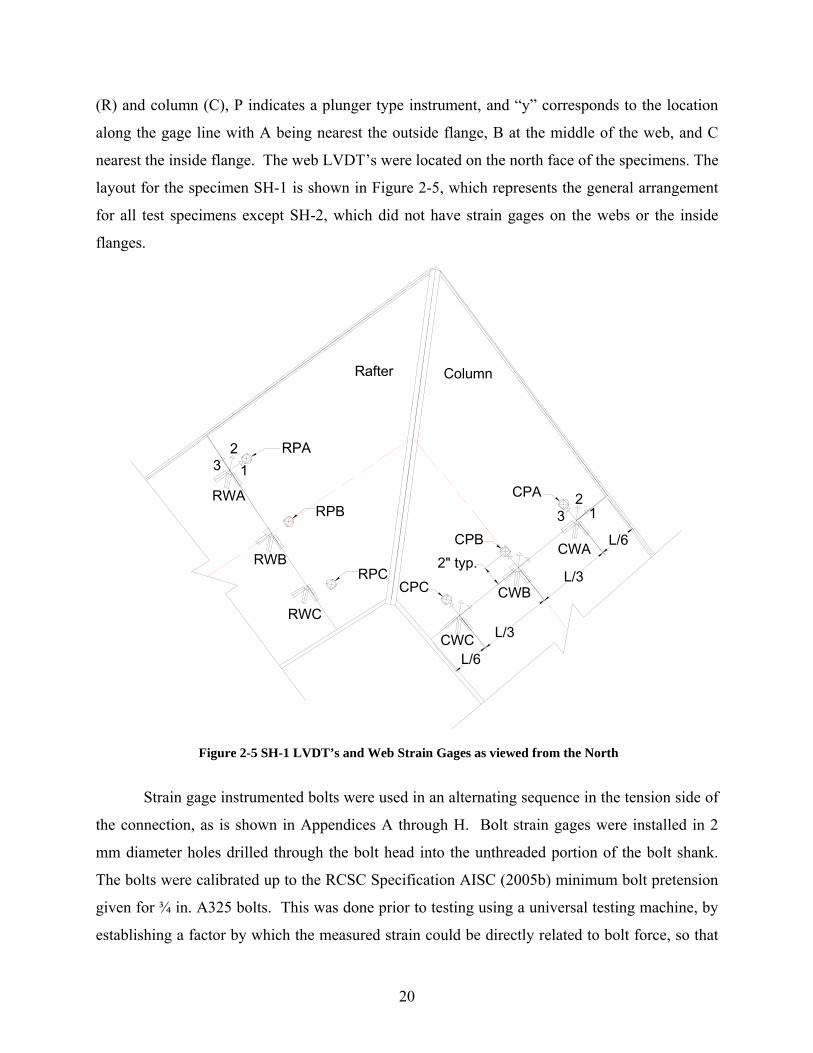
Uni-axial strain gages were installed on the flanges, and rectangular rosette strain gages
were installed on the webs. The chosen cross-sections of interest, on which these gages and the
web displacement transducers were installed, were determined from FEA buckling analyses
(Shah 2007). The gages were placed at L/6, L/2 and 5L/6 from the inside flange, measured
perpendicular to the geometric centerline with L being the web depth along the gage line. The
general locations and orientation of all strain gages and displacement transducers are shown in
Figure 2-6, with only the placement of the gage line relative to the connection varying among the
specimens. The flange strain gages were labeled xFyz, where “x” designated column (C) or
rafter (R); the second letter F was for flange; “y” designates the particular flange as indicated in
Figure 2-6, and “z” represents the outside (1) or inside (2) face.
L/6
L/3
L/3
L/6 CWX
CWY
CWZ
RWX
RWY
RWZCFA1
CFB1
CFA2
CFB2
CFC2
CFD2
CFC1
CFD1
RFB1RFA1
RFB2RFA2
RFD2RFC2
RFD1RFC1
RafterColumn
B
B
Section B-BA
A
Section A-A
12
3
12
3
Figure 2-6 SH-1 Flange and Web Strain Gages as viewed from the South
22
The rosette strain gages were installed such that one grid was parallel to the geometric
centerline and were labeled xWy with “x” representing rafter (R) or column (C), W indicating
web gages, and the field “y” being a, b, or c for the North face, and correspondingly x, y and z on
the South face. For example the gages “a” and “x” were installed directly mirrored to each other
across the web so that bending stresses could be observed and related to web buckling. For
further illustration, gage CWY in Figure 2-6 indicates a column web rosette at the L/2 or
centerline location on the South face of the web. The determination of buckling behavior under
transverse forces at this location would be obtained by comparing CWY grid 3 with CWB grid 1.
2.5 Testing Procedures
After the lateral bracing and loading mechanisms were put in place, the moment end-
plate bolts were snug tightened to the pretension recommendation in AISC Design Guide 16,
Flush and Extended Multiple Row Moment End Plate Connections (Murray and Shoemaker
2003). A pretension of 14 kips is recommended for ¾ in. A325 bolts. The instrumented bolts
were monitored during the erection of the specimen so that the desired bolt tension could be
obtained. Non-instrumented bolts were tightened by “feel” to approximately the same pretension
as the instrumented bolts. Once the bolts were tightened, a load equal to approximately 20% of
the predicted failure load for the specimen was applied in 0.5 kip increments to seat the specimen
and check the instrumentation. The specimen was then unloaded incrementally.
The specimens were loaded in force increments until a yield plateau was developed, and
then displacement control was initiated. At each load increment all instrumentation was
recorded and the specimen was visually inspected periodically for signs of yielding. Ultimate
loading was defined as significant loss of stiffness, marked by the leveling of the load vs.
displacement curve. Several more data points were taken beyond this load, as well as during the
incremental unloading of the specimen. As loss of stiffness first became evident, a displacement
control was initiated, in which the hydraulic ram was used to impose an incremental
displacement rather than an incremental measured force.
For several of the tests, the specimen was unloaded and reloaded in both positive and
negative moment. Negative moment is defined as loading which produces compressive forces at
the reentrant corner of the knee connection and positive moment is defined as loading which

23
produces tension at the reentrant corner of the knee connection. Specimen SH-1 was loaded four
separate times, first in negative moment, second in positive moment, third in negative moment
again, and fourth in negative moment with short transverse web stiffeners installed at the
reentrant corner of the knee. MH-1 was loaded twice in negative moment loading, due to the
slipping and realignment of a lateral bracing mechanism during the first test. All other
specimens were loaded once only in negative moment.
2.6 Test Results
Results from the tests are summarized in Table 2-3. The following sections describe each
test with supporting data found in Appendices A through H. Each Appendix includes the
following: a test summary sheet; drawings of design dimensions and lateral brace locations
produced by ABC; drawings of strain gage layout, designations and additional instrumentation
(unless otherwise indicated in the following section); plots of applied load versus chord
displacement, bolt strain versus applied load, applied load versus web deformation, and applied
load versus strains at various gage locations; a picture of the test specimen connection area after
yielding.
The applied load versus chord displacement plots include a theoretical stiffness based on
linear elastic computer models created in Sap 2000 (CSI 2006), with cross-section geometry and
nodal locations corresponding to those used in ABC’s analyses. The stiffness models assume a
structure discretized into short segments of prismatic elements, and the area within the knee
connection was artificially stiffened by doubling the flange thicknesses to effectively double the
moment of inertia in this region. This area is defined as the portion of the column and rafter
beyond the reentrant corner. Table 2-3 Test Results
SH-1-1 26.48SH-1-2 20.15SH-1-3 25.04SH-1-4 22.96SH-2-1 26.08MH-1-1 86.47MH-1-2 77.48LH-1-1 162.3
column web bucklingcolumn web buckling
Failure Load (kips)Test Designation Failure Mode
rafter web bucklingN/A
rafter web buckling
column web buckling
rafter/column web bucklingcolumn web buckling

24
2.6.1 Test SH-1-1
Complete results for test SH-1-1 are found in Appendix A. The specimen was loaded to
5 kips to test instruments and then unloaded. Testing began in 0.5 kip increments and continued
in a linear trend up to approximately 12.4 kips, at which time the specimen was unloaded to
verify linear elastic behavior. No noticeable permanent set was observed. Testing was resumed
and initial yielding behavior was observed in the Load vs. Deflection plot at approximately 18
kips (see Figure A-7). At approximately 23 kips the specimen was unloaded to check proper
alignment of the rafter web displacement transducer RPB. A permanent set of 0.22 in. was
observed at zero load. Testing was again resumed with significant leveling of the Load vs.
Displacement curve at 25 kips, at which time displacement control was begun in 0.05 in.
increments. No yield lines or whitewash flaking was observed, likely due to inadequate
whitewashing. The specimen was finally unloaded when a slight loss of load was observed at
approximately 3 in. chord deflection; however there was no visibly apparent failure or yielding.
After the load was incrementally removed, there was a permanent chord deflection of 0.94 in.
The data points corresponding to the unloading phases of the test were removed from all
plots except Figure A-7 for clarity. The maximum applied load was 26.48 kips and the
controlling limit state was shear buckling in the rafter web. There was a snap through buckling
shape observed in the Applied Load vs. Rafter Web Displacement plot (Figure A-9) which
occurred at approximately 20 kips. This was closely followed by shear yielding behavior in the
Applied Load vs. Rafter Web Transverse Strain plot (Figure A-15), at approximately 23 kips in
gages RWY, RWA, and RWC. These gages exhibit compression yielding transverse to the
specimen longitudinal axis.
The initial web buckling appears to propagate from the compression flange, evident in the
fact that the shear strain gages RWC/RWZ, and CWC/CWZ are alternately positive and negative
(see Figure A-15 and Figure A-16). These are the transverse web gages nearest to the
compression flange for the rafter and column, respectively, and the opposite strain direction
defines bending behavior, or buckling, which is propagated near the application of the
component compressive force from the adjacent rafter or column flange. If not for the large out
of plane movement of the center of the webs, this could possibly be considered web crippling.

25
2.6.2 Test SH-1-2
The SH-1 specimen was then loaded in positive moment; the complete results are found
in Appendix B. The loading direction for this test was opposite that of all the other tests, and
simulates positive moment on the connection, with tension at the inside flange, such as would
result from wind loads on the windward wall. Loads and deflections were measured positive in
the direction of imposed displacement, and so the sign convention has been reversed for this test.
The specimen was loaded to 5 kips to check instrumentation and seat the specimen, and was then
unloaded. Testing was begun in 0.5 kips increments to 10 kips. The stiffness observed in the
Applied Load vs. Chord Deflection curve was significantly less than what was observed under
negative moment loading (See Figure B-2). The end-plates at the inside flanges (tension flanges)
showed significant separation. For this reason the specimen was unloaded through zero load to -
10 kips, which corresponds to a negative moment loading, to verify that the differing stiffness
was due to the loading condition. A permanent set of 0.27 in. was observed at zero load. At -5
kips the stiffness of the specimen began to follow the predicted stiffness more closely, likely
corresponding to the re-closing of the end-plates. This difference in stiffness was attributed to
the differing bolt patterns at the end-plate connection, with fewer bolts at the inside flanges or
tension side during the positive moment test.
The specimen was again unloaded and reloaded in positive moment. No visible yield
lines were observed during the test. The test was terminated when the gaged bolt nearest the
tension flange reached its design strength. After the load was incrementally removed, there was a
permanent chord deflection of 1.69 in.
The data points corresponding to the unloading phases of the test were removed from all
plots except Figure B-2 for clarity. The maximum applied load was 20.15 kips and no failure
mode was associated with this test, however there appears to be column web buckling as
evidenced by the direction change in the web plungers (see Figure B-5). This behavior is
supported by the differential strain across the web of the column in transverse web strain gages
CWC/CWZ at the inside flange and CWA/CWX at the outside flange (see Figure B-11).
26
2.6.3 Test SH-1-3
The SH-1 specimen was then reloaded in negative moment; the complete results are
found in Appendix C. The specimen was loaded in 0.5 kip increments to 17.75 kips. The
structure exhibited less stiffness than was previously observed in negative moment up to
approximately 10 kips. This was attributed to the closing of the end-plates at the inside flanges.
The specimen was then unloaded incrementally and a permanent set of 1.04 in. was observed at
zero load. The specimen was then reloaded and at 24 kips yielding became apparent in the
Applied Load vs. Chord Deflection curve (see Figure C-2), and displacement control was
initiated. The specimen was finally unloaded at a chord deflection of 4.55 in. as load loss
occurred and web crippling became evident at the reentrant corner. The specimen was unloaded
through zero in an effort to relieve the web crippling and facilitate installation of short web
stiffeners. The permanent when passing through zero load was 2.1 in.
The data points corresponding to the unloading phases of the test were removed from all
plots except Figure C-2 for clarity. The maximum applied load was 25.04 kips and the
controlling limit state appears to be column web buckling near the connection. There is also a
significant response in the column web at 10 kips (see Figure C-5) the load at which the end-
plates came into contact. The plot of Applied Load vs. Column Web Transverse Normal Strain
also indicates a web buckling which occurs at 10 kips. This is evident in the opposing values of
gages CWB, and CWX which are the center strain gages on the web of the column (see Figure
C-11). This response represents a bending strain distribution, which can be reasonably
associated with buckling. There was significant out of plane displacement in the rafter web, and
the center rafter web plunger RPB exhibits a snap through buckling at approximately 15-20 kips
(see Figure C-4).
The rafter flanges indicate compression yielding as well as lateral movement, in the
differential strains between the C and D gages (see Figure C-6). This lateral movement
developed after the web buckling was clearly defined. There appears to be local web crippling at
the reentrant corner, however this could be the result of the buckling web interacting with the
boundary conditions imposed by the end plate and compression flange (see Figure C-1). In an
attempt to verify whether the source of this observed behavior was due to buckling or crippling,

27
the specimen was unloaded and short transverse stiffeners were installed on the web at the
reentrant corner to mitigate crippling. The testing was resumed as test SH-1-4.
2.6.4 Test SH-1-4
The SH-1 specimen was reloaded in negative moment, however short web stiffeners were
installed at the reentrant corner, across the crippled portion of the web. This was done in an
effort to determine whether the observed localized buckling at the reentrant corner was due to
web crippling or overall web buckling. The complete test results are given in Appendix D. The
specimen was loaded in 0.5 kip increments to 10 kips to seat the specimen and check the
instruments, and was then unloaded. The specimen was reloaded in 0.5 kip increments to 23
kips, at which time a load bang was heard and a load loss occurred. This was attributed to a
lateral brace slippage and load release associated with lateral buckling.
Loading was resumed and displacement control was initiated at approximately 19 kips.
The load was finally removed when lateral buckling occurred in the rafter compression flange at
approximately 20.8 kips and a chord deflection of 3.8 in. At zero load there was a permanent set
of 1.0 in. The data points corresponding to the unloading phases of the test were removed from
all plots except Figure D-2 for clarity. The maximum applied load was 23 kips, and the
controlling limit state was column web buckling. The plot of Applied Load vs Column Web
Displacement shows bifurcation buckling behavior in the center of the web at approximately 8
kips (see Figure D-5). This behavior is corroborated by the transverse strain gages on the center
of the column web. Gages CWB/CWX exhibit bending strains which cross each other at this
point (see Figure D-11) which may also indicates a mild snap through buckling.
2.6.5 Test SH-2-1
The complete results for test SH-2-1 are given in Appendix E. The specimen was
incrementally loaded to 9 kips to seat the specimen and check instrumentation, and then
unloaded. At approximately 16 kips the Applied Load vs. Chord Deflection curve indicated non
linear behavior (see Figure E-4). At 23 kips the specimen was unloaded although not entirely to
zero load. The specimen was then reloaded and at approximately 24.5 kips and 2.0 in. chord
deflection, displacement control was initiated. At 24.4 kips and 2.4 in, chord deflection, the
specimen was again unloaded and reloaded in several increments to 24 kips and displacement

28
control was resumed. At 25.6 kips and 2.55 in chord deflection yield lines became apparent in
the compression flanges and in the web near the reentrant corner. After slight load loss, at 25
kips and a 3.1 in chord deflection, lateral buckling occurred in the rafter compression flange, and
the load was removed. At zero load there was a permanent set of 1.00 in.
The data points corresponding to the unloading phases of the test were removed from all
plots except for clarity. The maximum applied load was 26.08 kips, and the failure mode was
column web buckling at the reentrant corner. At approximately 18 kips the web displacement
transducer CPB indicated a snap through buckling (see Figure E-7). This instrument exhibits
another reversal in direction when the entire specimen begins to exhibit yield behavior. The
magnitude of the rafter web displacement is higher than that of the column, but no apparent
buckling is evident. This could be due to initial imperfections producing a “pre-buckled” shape.
2.6.6 Test MH-1-1
The complete results for test MH-1-1 are found in Appendix F. The specimen was
initially loaded to 8 kips to test instrumentation, and then unloaded. Testing was resumed in 1
kip increments and non linear behavior became evident in the Applied Load vs. Chord
Deflection plot at about 62 kips (see Figure F-4). At approximately 75 kips the specimen was
unloaded to 10 kips, and reloaded. At approximately 80 kips compression flange yielding was
observed in the rafter. At 85.5 kips and 2.5 in. chord deflection displacement control was
initiated. At 86 kips and 2.6 in. chord deflection a lateral brace mechanism on the rafter
compression flange at the reentrant corner slipped. The specimen was unloaded to realign the
braces. After the load was incrementally removed there was a permanent chord deflection of
0.59 in.
The data points corresponding to the unloading phases of the test were removed from all
plots except Figure F-4 for clarity. The maximum applied load was 86.47 kips and the
controlling limit state appears to be column web buckling. The plot of Applied Load vs Column
Web Displacement shows the snap through buckling of CPB at approximately 55 kips (see
Figure F-10). This buckling mode is validated by the shift in transverse normal strains, at the
center of the web, to a differential bending stress behavior as indicated in the column web
transverse strain gages CWB/CWY (see Figure F-13). Large strains are also evident in the rafter
compression flange, which indicate lateral movement.
29
2.6.7 Test MH-1-2
The complete results for test MH-1-2 are given in Appendix G. The specimen was
loaded in 5 kip increments until slight non linear behavior was observed in the Applied Load vs.
Chord Deflection plot at approximately 65 kips (see Figure G-2). At approximately 75.5 kips
and 2.1 in. chord deflection displacement control was initiated. At approximately 76 kips, yield
lines became evident in the column compression flange, and the web of the column near the
compression flange about 30 in. form the reentrant corner. These are possibly evidence of a
change in the buckling shape of the web as the depth decreases. The specimen was
incrementally unloaded when at approximately 76 kips and 2.46 in. chord deflection, lateral
buckling occurred in the rafter compression flange.
The data points corresponding to the unloading phase of the test were removed from all
plots except Figure G-2 for clarity. The maximum applied load was 77.48 kips, and the
controlling limit state was column and rafter web buckling at the connection. Both webs exhibit
displacement behavior early in the test in both the web displacement plots (see Figure G-4 and
Figure G-5) and in the transverse web strain plots (see Figure G-10 and Figure G-11). The
column web displacement transducers CPA and CPB indicate initial nonlinear behavior earliest
at approximately 45 kips and the transverse strain gages at the column web center show a
coincident differential strain buckling pattern at the same load (see Figure G-10 and Figure
G-11). The rafter web displacements are not as pronounced as the column, nor are the bending
stresses as non linear, but the rafter is clearly also exhibiting web buckling behavior.
2.6.8 Test LH-1-1
The complete test results for Test LH-1-1 are found in Appendix H. The specimen was
loaded to approximately 25 kips to seat and check instrumentation, and was then unloaded.
Testing began in 2 kip increments up to approximately 54 kips and was unloaded. At zero load
there was no permanent set. The specimen was reloaded and non linear behavior became evident
in the Applied Load vs. Chord Deflection plot at approximately 80 kips (see Figure H-4). There
was a load loss at approximately 162 kips and flange local buckling was observed in the rafter
compression flange. Displacement control was initiated at 155.65 kips and a chord deflection of
2 in. Large web displacements were observed in both column and rafter near the connection, and

30
the rafter compression flange buckling continued to develop with no more increase in load
associated with the increase in displacement. The specimen was finally unloaded at 151 kips and
2.3 in. chord deflection. After the load was incrementally removed, there was a permanent chord
deflection of 0.5 in.
The data points corresponding to the unloading phases of the test were removed from all
plots except Figure H-4 for clarity. The maximum applied load was 162.3 kips and the
controlling limit state was rafter and column web buckling. As seen in the web displacement
plots, yielding occurred first at approximately 140 kips in the bottom of the rafter web at
transducer RPC (see Figure H-9). This yielding coincides with the transition from compression
strain to bending action differential strain in the rafter transverse shear strain gages RWC/RWZ
near the inside flange (see Figure H-12).
Both rafter and column webs exhibit large displacements and obvious buckled shapes
with negligible differences in their development, so the choice of failure location in the rafter is
based only on the coincident behaviors stated above. Both rafter and column compression
flanges have a divergent strain from the bottom to the top of the flanges, which indicates weak
axis bending of the flanges rather than lateral buckling of the specimen. This is consistent with
the large out of plane displacements of the webs as the compression forces caused the web to
buckle and the flanges to rotate into the web.
It is important to note that large initial imperfections (out of plane) were observed in the
webs, and this could contribute to the fact that no clear bifurcation was observed in the web
displacements. In this case the webs contained a pre-buckled shape, and the amount of reserve
strength observed is not easily explained.
2.7 Material Properties
Material coupons were milled either from the same bar or sheet stock with which the
specimens were fabricated or cut from low stress areas of the tested specimens after testing was
complete. The coupons were then tested according to ASTM E8 with a 300 kip capacity
Universal Testing Machine. The results of the coupon tests are given in Table 2-4. The
designations in the first column indicate the element for which the coupon was representative.
W indicates web material and FL indicates flange material in those specimens in which the

31
flanges were equal. Only specimen MH-1 contained unequal flanges and ISFL indicates inside
flange material, and OSFL indicates outside flange material.

32
T
able
2-4
Cou
pon
Res
ults
bar
wid
th (i
n)th
ickn
ess
(in)
Are
a (in
2 )Yi
eld
Load
(k
ips)
Yiel
d St
ress
(k
si)
Ulti
mat
e Lo
ad
(kip
s)U
ltim
ate
Stre
ss (k
si)
% E
long
atio
nav
erag
e yi
eld
stre
ss (k
si)
W 1
1.50
00.
131
0.19
612
.51
63.8
014
.46
73.7
6N
AW
21.
500
0.13
10.
197
12.5
663
.90
14.5
474
.00
NA
FL 1
*1.
499
0.37
80.
567
31.3
355
.30
46.8
482
.67
22.0
7FL
2*
1.49
90.
373
0.55
930
.70
54.9
046
.45
83.0
721
.09
bar
wid
th (i
n)th
ickn
ess
(in)
Are
a (in
2 )Yi
eld
Load
(k
ips)
Yiel
d St
ress
(k
si)
Ulti
mat
e Lo
ad
(kip
s)U
ltim
ate
Stre
ss (k
si)
% E
long
atio
nav
erag
e yi
eld
stre
ss (k
si)
OS
FL 1
*1.
498
0.50
10.
750
43.3
357
.73
62.6
583
.48
23.2
4O
S FL
21.
498
0.49
20.
737
42.4
257
.55
61.8
883
.96
21.6
8W
1*
1.49
80.
247
0.37
020
.04
54.1
523
.81
64.3
425
.78
W 2
1.49
40.
247
0.36
919
.47
52.7
523
.17
62.8
027
.34
IS F
L 1*
1.49
50.
748
1.11
862
.63
56.0
192
.60
82.8
123
.44
IS F
L 2
1.49
60.
743
1.11
259
.92
53.9
190
.86
81.7
422
.46
bar
wid
th (i
n)th
ickn
ess
(in)
Are
a (in
2 )Yi
eld
Load
(k
ips)
Yiel
d St
ress
(k
si)
Ulti
mat
e Lo
ad
(kip
s)U
ltim
ate
Stre
ss (k
si)
% E
long
atio
nav
erag
e yi
eld
stre
ss (k
si)
W 1
1.49
90.
308
0.46
228
.35
61.4
037
.09
80.3
420
.51
W 2
1.49
70.
308
0.46
127
.94
60.6
036
.89
80.0
021
.09
FL 1
1.49
60.
617
0.92
350
.17
54.3
575
.25
81.5
324
.22
FL 2
1.49
60.
614
0.91
948
.73
53.0
574
.90
81.5
423
.05
* cut
from
test
ed s
peci
men
s, o
ther
wis
e fro
m fa
bric
ator
pro
vide
d pl
ate
mat
eria
l
Med
ium
Hau
nch
Spec
imen
Res
ults
Smal
l Hau
nch
Spec
imen
Mille
d di
men
sion
s
63.8
5
55.1
0
Mille
d di
men
sion
s
Mille
d di
men
sion
s
Res
ults
Larg
e H
aunc
h S
peci
men
Res
ults
53.4
5
54.9
6
61.0
0
53.7
0
57.6
4

33
2.8 Initial Imperfections
All four specimens were observed to have initial out-of-plane imperfections in the
column and rafter webs. In the interest of quantifying the variations in initial shape,
measurements were made of each specimen prior to testing. The measurements were made using
a displacement transducer (LVDT) mounted to a carriage that was slid along a straight edge
supported by the flange tips. It was assumed that the flanges were straight and parallel, and that
the straight edge was perfectly straight. The accuracy of the LVDT used was +/- 0.0005 in., but
the actual variation in the flanges and carriage assembly would reduce this accuracy.
A photograph of the assembly used for the small specimens is shown in Figure 2-7. Two
40 in. range wire type potentiometers were mounted at the intersections of the flanges and end-
plate and were used with the law of cosines to define the coordinates of the LVDT.
Figure 2-7 SH-1 and SH-2 Web Plane Measurement
The wire potentiometers had insufficient range for the medium and large specimens so a
3 in. grid pattern was plotted on 34 in. by 44 in. paper and overlaid on the specimen. Depth
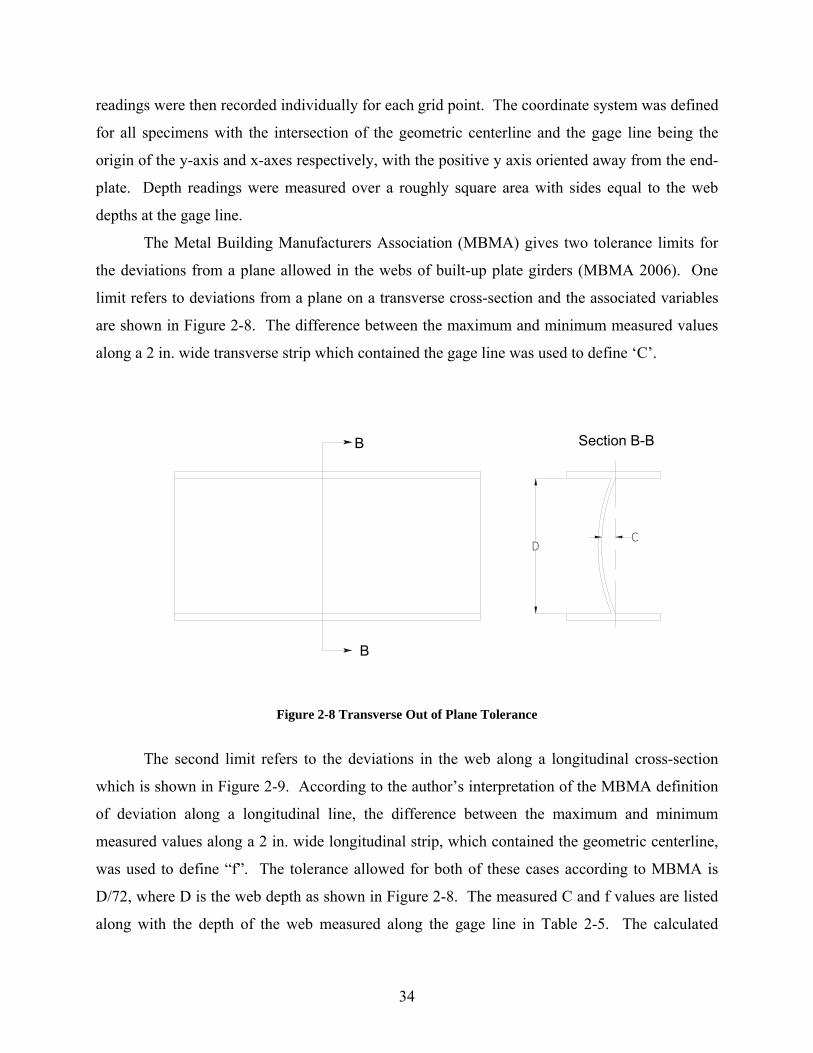
34
readings were then recorded individually for each grid point. The coordinate system was defined
for all specimens with the intersection of the geometric centerline and the gage line being the
origin of the y-axis and x-axes respectively, with the positive y axis oriented away from the end-
plate. Depth readings were measured over a roughly square area with sides equal to the web
depths at the gage line.
The Metal Building Manufacturers Association (MBMA) gives two tolerance limits for
the deviations from a plane allowed in the webs of built-up plate girders (MBMA 2006). One
limit refers to deviations from a plane on a transverse cross-section and the associated variables
are shown in Figure 2-8. The difference between the maximum and minimum measured values
along a 2 in. wide transverse strip which contained the gage line was used to define ‘C’.
B
B
CD
Section B-B
Figure 2-8 Transverse Out of Plane Tolerance
The second limit refers to the deviations in the web along a longitudinal cross-section
which is shown in Figure 2-9. According to the author’s interpretation of the MBMA definition
of deviation along a longitudinal line, the difference between the maximum and minimum
measured values along a 2 in. wide longitudinal strip, which contained the geometric centerline,
was used to define “f”. The tolerance allowed for both of these cases according to MBMA is
D/72, where D is the web depth as shown in Figure 2-8. The measured C and f values are listed
along with the depth of the web measured along the gage line in Table 2-5. The calculated

35
MBMA tolerances are also listed. The depth of the member (D) used to define the tolerance for
longitudinal deviation is not given by MBMA.
A A
Section A-A
f
Figure 2-9 Longitudinal Out of Plane Tolerance
The measured web depth at the gage line was also used to define D in this casae. This
web depth is measured perpendicular to the neutral axis of the members near the reentrant corner
and slightly less than the maximum depth of the members.
Table 2-5 Web Plane Measurements
D = measured web depth at gage line (in.)
c = deviation along gage line
(in.)
f = deviation along
centerline (in.)
MBMA deviation tolerance, D/72
(in)rafter 21.938 0.291 0.326 0.305column 21.563 0.157 0.124 0.299rafter 21.938 0.269 0.192 0.305column 21.563 0.217 0.278 0.299rafter 35.625 0.091 0.258 0.495column 35.625 0.189 0.410 0.495rafter 59.125 0.345 0.744 0.821column 59.000 0.238 0.462 0.819
Note: deviation is the difference of the maximum and minimum measured value
Specimen
LH-1
MH-1
SH-1
SH-2

36
Table 2-6 contains ratios of the two deviation measurements to the MBMA tolerance,
D/72. Only the SH-1 rafter exceeded one of the MBMA tolerances but the LH-1 rafter and the
SH-2 column are within 10 percent of the limit set for deviations from the plane along a
longitudinal line. The rows corresponding to the specimens determined to have failed in a shear
buckling mode are shaded.
Table 2-6 Comparison of Web Deviations to Tolerance
ratio of C to D/72
ratio of f to D/72
rafter 0.955 1.070column 0.524 0.414rafter 0.883 0.630column 0.725 0.928rafter 0.184 0.521column 0.382 0.829rafter 0.420 0.906column 0.290 0.564LH-1
MH-1
SH-1
SH-2
Specimen
Figure 2-10 is a surface plot of the SH-1 rafter web.
Figure 2-10 SH-1 Rafter Web Surface
Figure 2-11 is a surface plot of the SH-2 column web.

37
Figure 2-11 SH-2 Column Web Surface
Figure 2-12 is a surface plot of the LH-1 rafter web. The relative smoothness of the LH-1
rafter is possibly due to the fact that fewer readings were taken over a larger area and also the
carriage assembly was stationary when the recordings were made.
Figure 2-12 LH-1 Rafter Web Surface

38
2.9 Web Shear Strains
The magnitudes of shearing stresses measured in the web during the tests are of interest
in determining the validity of a modified shear approach. The webs were instrumented with
rosette strain gages as described in Section 2.4. This strain data permitted the calculation of the
magnitude and orientation of the principal stresses, and from these values the shear stresses
along the gage line were determined. In an effort to remove the bending stresses associated with
out of plane web displacements, the strain gage grids were averaged across the thickness of the
web. For example, with reference to Figure 2-5 and Figure 2-6, the average of RWA grid 1 and
RWX grid 3 resulted in the average longitudinal normal strain at this location.
Figure 2-13 shows the web shear stresses in the MH-1 specimen rafter. This stress
distribution is most typical of the tested specimens, occurring in four out of the six members.
Among these four there is an increase in shearing stress near the compression flange which was
the bottom flange under test load conditions, and a decrease in the shear stress near the tension
flange relative to the shear stress at the mid depth of the web.
-15.00
-10.00
-5.00
0.00
5.00
10.00
15.00
0.00 1.00 2.00 3.00 4.00 5.00 6.00shear stress (ksi)
dist
ance
from
geo
met
ric c
ente
rline
(in)
0.050.10.150.20.25
Figure 2-13 MH-1-1 Rafter Shear Stresses at 5% to 25% of Failure Load

39
These data were further reduced to define a net shear force acting on the web. First it
was assumed that the values taken at lower loads would produce more reasonable results and
would be less susceptible to the errors induced by high out-of-plane bending strains. 10 percent
of the applied failure load was the chosen datum. The area under the shear stress distribution
multiplied by the web thickness represents the shear force on the cross-section. This distribution
was approximated by assuming the individual values of the measured transverse shear strain to
be constant over the adjacent one third of the web height as is depicted in Figure 2-14.
L/3
L/3
L/3 τ1
τ2
τ3
V
V
M
Figure 2-14 Location of Shear Stress Elements from Strain Data
The calculated stresses at the individual gage locations as well as the measured web
dimensions and the resulting sum of the corresponding forces are listed in Table 2-7. The shear
stresses τ1 were determined at the strain gage locations located near the tension flange. The
shear stresses τ3 were determined at strain gage locations located near the compression flange.
These stresses correspond with the rectangular rosette locations RWA and RWC for the rafters
and CWX and CWZ for the columns, as described in Section 2.4. A comparison of these
measured values with experimental shear forces is made in Chapter 4.

40
Table 2-7 Web Shear Forces from Shear Strain Data
τ1 0.25 7.31 0.131 0.24τ2 0.56 7.31 0.131 0.54τ3 -0.08 7.31 0.131 -0.07τ1 -0.15 7.19 0.131 -0.14τ2 1.02 7.19 0.131 0.96τ3 2.61 7.19 0.131 2.46τ1 0.38 11.88 0.247 1.10τ2 1.16 11.88 0.247 3.40τ3 3.05 11.88 0.247 8.95τ1 0.57 11.88 0.247 1.66τ2 1.20 11.88 0.247 3.51τ3 2.94 11.88 0.247 8.63τ1 0.34 19.71 0.308 2.04τ2 0.25 19.71 0.308 1.55τ3 0.33 19.71 0.308 1.99τ1 0.39 19.67 0.308 2.36τ2 0.25 19.67 0.308 1.53τ3 2.19 19.67 0.308 13.27
5.58
17.15
0.70
3.27
13.45
13.79
Rafter
Column
LH-1
Rafter
Column
MH-1
Rafter
Column
SH-1
Total Web Shear Force
(kips) Specimen Member Shear Stress
LocationsShear Stress
(ksi)L/3 (in)
Web Thickness
(in)
Shear Force (kips)
It can be seen from the shear stress column that, except for the SH-1 rafter and LH-1
rafter, the shear stresses increase toward the compression flange as indicated in Figure 2-13.
The distributions of shear stress in these two members are shown in Figure 2-15 and Figure 2-16,
respectively. These two members also contain high levels of initial web imperfections, with the
SH-1 rafter exceeding the tolerance for deviations from a flat plane set by MBMA as discussed
in the Section 2.8.
Sample calculations for the determination of web shear stress from strain gage data are
given in Appendix I. The reduction of rosette strain gage data to find shear stresses was based
on methods presented by Beer et al. (2002) and Holman (1978).

41
-8.00
-6.00
-4.00
-2.00
0.00
2.00
4.00
6.00
8.00
-0.20 0.00 0.20 0.40 0.60 0.80 1.00 1.20 1.40 1.60
Web Shear Stress (ksi)
dist
ance
from
geo
met
ric c
ente
rline
(in)
0.050.100.150.200.25
Figure 2-15 SH-1-1 Rafter Stresses at 5% to 25% of Failure Load
-25.00
-20.00
-15.00
-10.00
-5.00
0.00
5.00
10.00
15.00
20.00
25.00
0.00 0.10 0.20 0.30 0.40 0.50 0.60 0.70 0.80 0.90
shear stress (ksi)
dist
ance
from
geo
met
ric c
ente
rline
(in)
0.050.10.150.20.25
Figure 2-16 LH-1-1 Rafter Web Stresses at 5% to 25% of Failure Load

42
CHAPTER 3
ANALYTICAL INVESTIGATION
3.1 General
The four experimentally tested knee specimens were analyzed for shear strength
according to the AISC provisions for prismatic girders. The following sections present a
description of the calculation of modified shear forces, and the details of the shear strength
analysis. The calculated shear strengths for tested specimens were compared to both modified
and unmodified shear forces. Five specimens from tests by Sumner et al. (1995) were also
evaluated with modified and unmodified shear forces.
3.2 Geometry
The cross-sections of interest for all of the following analyses are at the sections of
greatest web depth, taken perpendicular to the neutral axis and passing through the reentrant
corner, as sections B-B in Figure 3-1.
The location of the center of gravity for tapered sections with equal flanges is linear and
lies along the geometric centerline. For members with unequal flanges, as was the case with
specimen MH-1, the neutral axis varies quadratically along the length. However, this function is
very closely approximated by a linear interpolation between the locations of the neutral axis at
the ends of the member, corresponding to sections A-A and B-B in Figure 3-1. The deviation in
the slope of this line from the geometric centerline was found to be less than 0.15% of the length
of the specimen in this case. It was therefore considered reasonable to approximate the
orientation of the neutral axis as a straight line parallel to the geometric centerline in the MH
specimen.

43
A
A
B
B
A-A
B-B
B
B
A
A
A-A
B-B
Neu
tral A
xis
Axial Load
Shear
Load
Failu
re L
oad
θc
Shear Load
Axial
Loa
d
Failu
re L
oad
θrα
cα
r
d-col
d-raf
Figu
re 3
-1 T
ypic
al A
naly
sis G
eom
etry
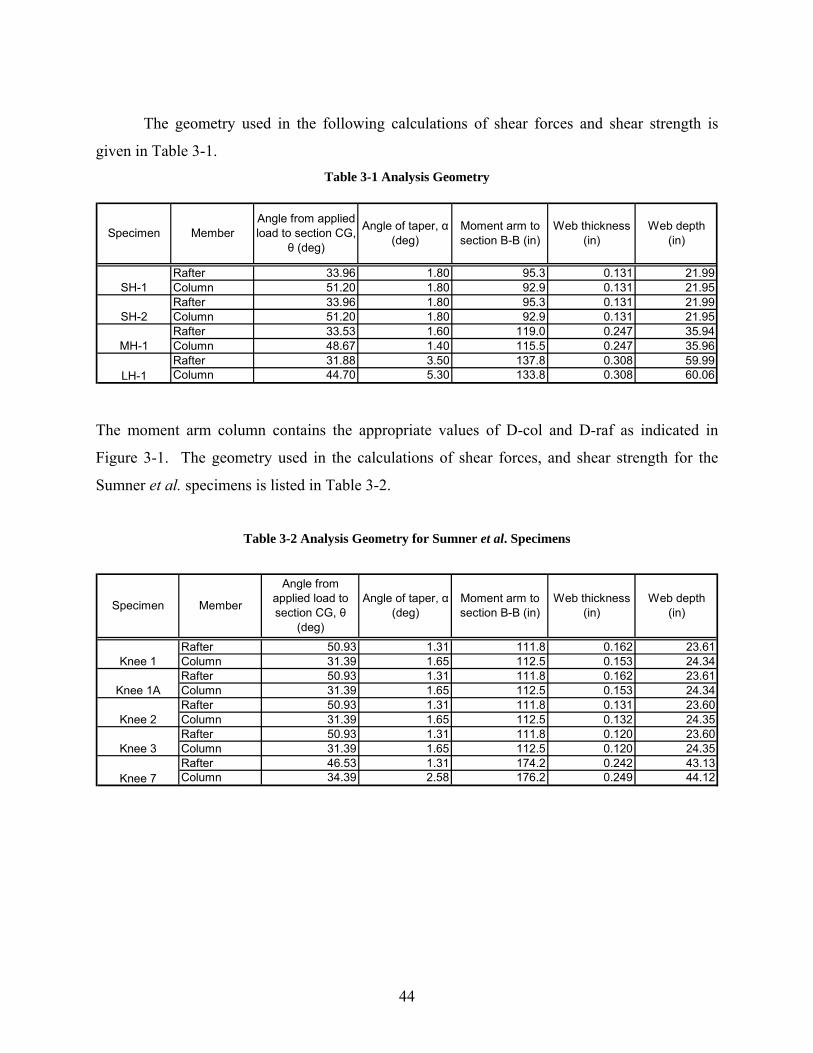
44
The geometry used in the following calculations of shear forces and shear strength is
given in Table 3-1. Table 3-1 Analysis Geometry
Rafter 33.96 1.80 95.3 0.131 21.99Column 51.20 1.80 92.9 0.131 21.95Rafter 33.96 1.80 95.3 0.131 21.99Column 51.20 1.80 92.9 0.131 21.95Rafter 33.53 1.60 119.0 0.247 35.94Column 48.67 1.40 115.5 0.247 35.96Rafter 31.88 3.50 137.8 0.308 59.99Column 44.70 5.30 133.8 0.308 60.06
Web thickness (in)
Web depth (in)
Angle of taper, α (deg)
Moment arm to section B-B (in)
Angle from applied load to section CG,
θ (deg)
LH-1
MH-1
SH-1
SH-2
MemberSpecimen
The moment arm column contains the appropriate values of D-col and D-raf as indicated in
Figure 3-1. The geometry used in the calculations of shear forces, and shear strength for the
Sumner et al. specimens is listed in Table 3-2.
Table 3-2 Analysis Geometry for Sumner et al. Specimens
Rafter 50.93 1.31 111.8 0.162 23.61Column 31.39 1.65 112.5 0.153 24.34Rafter 50.93 1.31 111.8 0.162 23.61Column 31.39 1.65 112.5 0.153 24.34Rafter 50.93 1.31 111.8 0.131 23.60Column 31.39 1.65 112.5 0.132 24.35Rafter 50.93 1.31 111.8 0.120 23.60Column 31.39 1.65 112.5 0.120 24.35Rafter 46.53 1.31 174.2 0.242 43.13Column 34.39 2.58 176.2 0.249 44.12
Moment arm to section B-B (in)
Knee 1A
Web thickness (in)
Web depth (in)
Knee 1
Specimen Member
Angle from applied load to section CG, θ
(deg)
Angle of taper, α (deg)
Knee 2
Knee 3
Knee 7

45
3.3 Analysis Details
3.3.1 Determination of Web Shear Forces
Modified and unmodified shear forces were compared to the predicted shear buckling
strength of the webs in the following analyses. The unmodified shear force is simply the
external applied shear at the cross-section of interest. The modified shear force accounts for the
influence of the inclined flanges to effectively decrease the demand placed on the web. The
transverse components of the flange forces, used to modify the web shear forces, were calculated
in the using an elastic distribution of normal flexural stresses, and assuming the extreme fiber
stresses to be constant through the flanges. It is noted that this slightly overestimates the flange
forces when compared to an exact value found with the stresses at the center of gravity of the
flange.
None of the methods given in Section 1.2.4 accounted for the presence of axial stress in
the flanges when finding modified web shear forces. If the flanges are of equal area, an axial
compressive stress will decrease the tension flange force identically to the increase in the
compression flange force, and there will be no net effect on the modified web shear force.
However, when the flanges are not of equal area, as in specimen MH-1, the axial stress will
produce a higher force in the thicker flange. The force in the compression flange along its own
axis, due to flexural and axial stresses, was defined for this study as follows, with reference to
Figure 3-2:
)cos(αxc
cf
g
cfacf S
MAAAP
P += (3-1)
Where: Acf = area of the compression flange plate, (bf x tcf) Sxc = elastic section modulus referenced to compression flange, I/yfc I = simplified moment of inertia of the cross-section, found with Atf, Acf yfc = distance from section center of gravity to compression flange extreme
fibers α = angle of flange inclination Pa = applied axial force Ag = cross-section area using the flange plate areas

46
α
R
yf
Pcf,n
PcfPcf,t
yf
Pa Pa
α
w
Ptf,n
PtfPtf,t
M
V
Figure 3-2 Flange Contributions to Modified Web Shear
Likewise the tension flange force along its own axis is:
)cos(αxt
tf
g
tfatf S
MAAAP
P +−= (3-2)
The elastic section modulus Sx is calculated with the simplified moment of inertia of the
cross-section by using the nominal flange area Afl rather than the slightly larger actual flange
area at the cross-section. The use of the elastic section modulus slightly overestimates the flange
stresses, by assuming the extreme fiber stresses to be constant through the flange. Finally the
sum of the transverse components can be included in the equilibrium of forces in the vertical
direction, and the modified web shear force is:
( ) )sin(αtfcfw PPVV +−= (3-3)
Where: Atf = area of the tension flange plate, (bf x ttf) Sxt = elastic section modulus referenced to tension flange, I/yft I = simplified moment of inertia of the cross-section, found with Atf, Acf yft = distance from section center of gravity to tension flange extreme fibers

47
3.3.2 AISC Shear Provisions for Prismatic Members
The design of unstiffened tapered steel plate girders for shear resistance has traditionally
been accomplished by applying the codified provisions for prismatic members. A recent draft
version of the AISC Steel Design Guide Series, “Frame Design Using Web Tapered Members”
by Kaehler et al. (2007), continues with this practice for the shear design of unstiffened tapered
members with only slight amendments to the AISC Specification provisions for the shear design
of prismatic members (AISC 2005a). In the Draft Design Guide the limit given by which a
tapered member must be considered unstiffened is a panel length greater than 3ho. Quite
conservatively ho is the least panel height of the tapered section and is represented by the depth
of web at sections A-A in Figure 3-1. The authors recommend that the shear strength be
calculated on a cross-section by cross-section basis, with the plate buckling coefficient taken as
5.0. This essentially assumes a panel of infinite length and will produce shear strength
predictions approximately 7% more conservative than Bleich’s buckling coefficient of 5.34 for
infinitely long panels. The panel slenderness is defined by the geometry at the section of
interest.
The AISC Specification shear provisions for the nominal shear strength of unstiffened
prismatic members are:
vwyn CAFV 6.0= (3-4)
For y
v
w FEk
th 10.1≤ 0.1=vC (3-5)
For y
v
wy
v
FEk
th
FEk
37.110.1 ≤< w
yvv th
FEkC
10.1= (3-6)
For y
v
w FEk
th 37.1> ( ) yw
vv Fth
EkC 2
51.1= (3-7)
5=vk (3-8)

48
The two slenderness limits that define the three ranges of Cv in Equation (3-5), Equation
(3-6), and Equation (3-7) were developed by Basler (1961a) from experimental data resulting
from his work at Lehigh as well as from the results of other tests of unstiffened plate girders with
compact webs. It was discovered that there was not a distinct slenderness limit marking the
separation of Timoshenko’s critical elastic buckling and shear yielding, but that rather a
transitional region of inelastic buckling exists between the two behavioral extremes. A curve
fitting exercise revealed that the elastic buckling formula does not accurately describe behavior
unless the critical shear buckling stress decreases below 80% of the yield stress.
The lower slenderness limit is that which simultaneously satisfies the yield strength
Equation (3-4) with Cv defined by elastic buckling in Equation (3-7) and yielding in Equation
(3-5). The upper limit is then found by dividing the lower by 0.80 based on the recommendations
of Basler. The behavior within these three regions of slenderness is defined by the web shear
coefficient. All of the tested specimen webs in the current study were beyond the upper
slenderness limit at the cross-section of interest, which is perpendicular to the natural axis at the
reentrant corner.
Kaehler et al. (2007) also address the issue of determining the applied shear forces at a
cross-section. They state that the modified shear approach proposed by Blodgett (1966) lacks
research validation, and recommend that the required shear strength at a particular cross-section
is that which is necessary to satisfy equilibrium, neglecting the influence of the flanges. The
critical section, when the modified shear effects are disregarded, is at the cross-section of
greatest web depth if shear is constant. If the shear is not constant, or if the flexural forces in the
inclined flanges are included in the analysis, then it is not evident by inspection where the critical
cross-section is located, because the resistance to shear varies along the length as well as the
shear force to be resisted.
Where: kv = plate buckling coefficient Cv = web shear coefficient E = Young’s Modulus, 29000 ksi
Fy = nominal yield stress h = web height at cross-section of interest tw = web thickness Aw = shear area of web (d x tw)

49
3.4 Analysis Results
3.4.1 Shear Forces at Failure
The modified and unmodified shear forces were calculated at the location of greatest web
slenderness for each of the tested specimens, under the applied failure load of the first test
performed with each specimen, according to the provisions of Section 3.3.1. The specimen
geometries used to determine these shear forces were given previously in Table 3-1 and Table
3-2. The applied failure load and resulting shear and moment on the cross-section, as well as the
unmodified and modified web shear forces for the corresponding current study are given in Table
3-3.
Table 3-3 Unmodified and Modified Shear
Rafter 26.48 14.79 2523.68 14.79 8.81Column 26.48 20.64 2459.86 20.64 14.80Rafter 26.08 14.57 2485.53 14.57 8.68Column 26.08 20.32 2422.70 20.32 14.57Rafter 86.47 47.76 10287.51 47.76 35.18Column 86.47 64.93 9984.09 64.93 54.27Rafter 162.30 85.71 22361.69 85.71 53.22Column 162.30 114.15 21715.90 114.15 66.36
Unmodified Shear Vu,exp
(kips)
Modified Shear Vm,exp
(kips)
SH-2
MH-1
SH-1
MemberSpecimenShear at cross
section B-B (kips)
Moment at section B-B
(in-kips)
Applied Failure Load, P (kips)
LH-1
Five additional specimens which were previously tested at the Virginia Tech Structures
and Materials Lab were also analyzed. These web tapered steel I-shaped specimens, tested by
Sumner et al. (1995), were similar in proportion to those of the current study and included
unstiffened slender webs. The failure load and resulting forces on the cross-section as well as
the unmodified and modified web shear forces are given in Table 3-4.

50
Table 3-4 Sumner et al. Specimens Unmodified and Modified Shear
Rafter 27.00 20.96 3018.33 20.96 16.63Column 27.00 14.06 3037.77 14.06 8.48Rafter 31.10 24.15 3476.67 24.15 19.15Column 31.10 16.20 3499.06 16.20 9.77Rafter 26.00 20.19 2906.54 20.19 15.79Column 26.00 13.54 2925.26 13.54 8.02Rafter 24.80 19.25 2772.39 19.25 14.98Column 24.80 12.92 2790.25 12.92 7.55Rafter 66.00 47.90 11497.20 47.90 39.38Column 66.00 37.28 11630.52 37.28 20.94
Knee 2
Knee 3
Knee 7
Modified Shear Vm,exp (kips)
Moment at section B-B
(in-kips)
Unmodified Shear Vu,exp
(kips)
Knee 1
Knee 1A
Specimen Member
Applied Failure Load, P (kips)
Shear at cross section B-B
(kips)
3.4.2 Predicted Shear Strength
The predicted shear strengths were determined according to the AISC provisions in
Section 3.3.2. It should be noted that the area of web considered in the calculation of the
nominal shear strength of prismatic members is the product of the web thickness and the total
depth of the member. It was considered inconsistent to include the portion of the web between
the flanges in both the web shear area and the flange area when finding the transverse component
of the flange force. For this reason, the actual web height, hw is used in defining the web shear
area, Aw for the shear strength calculations rather than the recommended section depth, d. This
conservatively underestimates the web strength when applied to the unmodified shear case. The
predicted shear strengths are listed in Table 3-5, calculated using measured dimensions and
material properties. The relatively small difference between the strength of each specimen’s
rafter and column member is due to the very small differences in web depth and the same yield
stress was used for all web material of the same nominal thickness.

51
Table 3-5 Predicted Shear Strength
Rafter 63.85 13.43Column 63.85 13.46Rafter 63.85 13.43Column 63.85 13.46Rafter 53.54 55.08Column 53.54 55.05Rafter 61.00 63.99Column 61.00 63.90LH-1
MH-1
SH-1
SH-2
Specimen Member Measured yield stress (ksi)
Predicted Shear Strength, Vpred
(kips)
The shear strengths of Sumner et al. test specimens were also determined based on the
provisions given in Section 3.3.2. The geometry, measured dimensions and material properties
in Table 3-2 were used and the results are listed in Table 3-6.
Table 3-6 Sumner et al. Specimens Predicted Shear Strength
Rafter 48.25 23.66Column 54.30 19.33Rafter 48.25 23.66Column 54.30 19.33Rafter 55.20 12.51Column 52.90 12.41Rafter 56.55 9.62Column 56.80 9.32Rafter 31.60 43.17Column 45.00 45.96
Knee 3
Specimen MemberMeasured yield
stress (ksi)Predicted Shear Strength, Vpred
Knee 1
Knee 1A
Knee 2
Knee 7

52
CHAPTER 4
COMPARISON OF ANALYTICAL AND EXPERIMENTAL RESULTS
4.1 General
The four specimens tested in the current study were each determined, strain and web
displacement data, to have failed in a web shear buckling mode near the reentrant corner. The
modified and unmodified shear forces corresponding to the maximum applied load and the
predicted shear strengths are given in Table 4-1. The shaded rows indicate locations where the
failure mode was determined to be web shear buckling.
Table 4-1 Comparison of Experimental and Predicted Shear Strength
Rafter 14.79 8.81 13.43 1.10 0.66Column 20.64 14.80 13.46 1.53 1.10Rafter 14.57 8.68 13.43 1.08 0.65Column 20.32 14.57 13.46 1.51 1.08Rafter 47.76 35.18 55.08 0.87 0.64Column 64.93 54.27 55.05 1.18 0.99Rafter 85.71 53.22 63.99 1.34 0.83Column 114.15 66.36 63.90 1.79 1.04
SH-2
MH-1
LH-1
Specimen
SH-1
Vm,exp/VpredVu,exp/VpredUnmodified Shear
Vu,exp (kips)Modified Shear
Vm,exp (kips)Predicted Shear Strength, Vpred
Member
In the shaded rows, the ratios in the last two columns which are greater than unity
indicate the degree to which the tested strength was greater than the predicted shear strength.
Values less than unity indicate the degree to which the analysis method is unconservative. In
members which did not fail in shear, the computed ratios are conservative when greater than
unity, but inconclusive when less than unity because the full shear capacity of the webs were not
reached.
Of the Sumner et al. knee specimens, only one failed in a shear buckling mode. Those
that did not fail in shear offer only indirect comparisons of experimental and predicted results.
The results of the five negative moment tests are given in Table 4-2.

53
Table 4-2 Sumner et al. Experimental and Predicted Shear Strength
Rafter 20.96 16.63 23.66 0.89 0.70Column 14.06 8.48 19.33 0.73 0.44Rafter 24.15 19.15 23.66 1.02 0.81Column 16.20 9.77 19.33 0.84 0.51Rafter 20.19 15.79 12.51 1.61 1.26Column 13.54 8.02 12.41 1.09 0.65Rafter 19.25 14.98 9.62 2.00 1.56Column 12.92 7.55 9.32 1.39 0.81Rafter 47.90 39.38 43.17 1.11 0.91Column 37.28 20.94 45.96 0.81 0.46Knee 7
Knee 1A
Knee 2
Knee 3
Specimen Member Vm,exp/VpredVu,exp/VpredUnmodified Shear
Vu,exp (kips)Modified Shear
Vm,exp (kips)Predicted Shear Strength, Vpred
Knee 1
It should be noted that web shear buckling was the observed failure mode only in the
Knee 1 rafter of the Sumner et al. tests. In this case both the modified and unmodified shears
produce unconservative results, achieving only 70 percent and 89 percent of the predicted
strength, respectively. In all other cases ratios less than unity do not necessarily indicate
unconservative analysis because the full capacities of the webs were not realized.
4.2 Measured Web Strain
The web strain measurements provided no evidence in support of a modified shear
theory. The shear forces were calculated from strain data taken at 10 percent of the maximum
applied load, as described in Section 2.9. These values as well as the experimental modified and
unmodified shear forces at the gage line are given in Table 4-3.
Table 4-3 Shear Forces from Strain Data
Rafter 2.6 0.70 1.45 0.82 2.07 1.17Column 2.6 3.27 2.02 1.42 0.62 0.43Rafter 8.6 13.45 4.75 3.54 0.35 0.26Column 8.6 13.79 6.46 5.51 0.47 0.40Rafter 16.1 5.58 8.56 3.96 1.53 0.71Column 16.1 17.15 11.39 6.79 0.66 0.40
MH-1
SH-1
LH-1
Vu,exp/VstrainSpecimen MemberShear from Strain Data Vstrain(kips)
Modified Shear Vm,exp
(kips)
Applied Load at 10% of max
(kips)
Unmodified Shear Vu,exp
(kips)Vm,exp/Vstrain
The last two columns contain ratios of the unmodified experimental shear-to-the shear
from strain data and modified experimental shear-to-the shear from strain data. Values less than

54
unity indicate a web shear force derived from shear strain data to be larger than the experimental
shear. In most cases the shear forces in the web determined from measured strain data are
substantially higher than both of the experimental forces calculated from the applied load and
specimen geometry. Only in the LH-1 rafter and SH-1 rafter have web shear stresses,
determined from strain data, which are lower than the experimental shear forces. These
members were also shown to have high levels of initial web imperfections, which may have led
to instability of the web even at loads as low as 10 percent of the maximum sustained load. It
can be seen that the stresses calculated from the strain data do not show any obvious trend in
support of the modified shear theory, but they do indicate an interaction between the distribution
of shear stresses in the web and the forces in the inclined flanges.
It was shown in Section 2.9 that much larger shear strains were typically present near the
compression flange. The cause of larger measured shear strains in the compression region of the
web is not immediately evident. In some cases in which out-of-plane bending strains were
measured across the thickness of the web, the tension strain and compression strain were
disproportionate. When averaging these values, the net differential bending strain can produce
larger calculated shear strains than were actually present. If much larger differential strains
typically exist in the lower portion of the web, they could be reasonably attributed to several
phenomena other than the shear buckling mode. Two possibilities include localized web
crippling resulting from the adjacent concentrated force applied by the connected specimen (ie
rafter compression flange bearing on the column), or out-of-plane bending due to flexural
compressive stresses. Either of these sources could be responsible for a destabilization of the
web in the lower portion of the knee area rendering it more susceptible to buckling, and high
differential bending strains.
It has been claimed by Basler (1961b) that stiffened slender web elements of prismatic
plate girders can, subsequent to small lateral displacements, transfer their compressive bending
stresses to the adjacent flange and still carry their full portion of shear stresses. This
maintenance of shear strength was attributed to the contribution of a tension field, and it was
with stiffened plate girder test data that Balser’s proposed shear and flexure interaction equations
were validated. It can be reasonably assumed that out of plane web displacement in the
compression region of a tapered member will cause a redistribution of the web bending stress to

55
the compression flange. It is however not clear how the forces in the inclined compression
flange will in influence the web.
Basler also claimed that the bending moment will not inhibit the web’s ability to carry
shear before plastic yielding of the flange takes place. As has already been discussed, the
assumption of a plastic stress distribution is not compatible with tapered member design so the
effects of flange stresses beyond yield need not be considered. However, there is clearly some
interaction between the inclined compression flange and the shear stresses present in the web
even at loads much lower than yielding. The modified shear theories discussed in Chapter 3
make no provision for the observed demand placed on the web by the compression flange. The
assumption that a transverse component of the compressive flange force, acting in the direction
of the web shear force, would diminish the shear force in the web without adverse interaction is
perhaps overly simplistic.
4.3 Discussion
The test results from the current study, in which web shear buckling was observed to
initiate instability, do not show consistent support for a modified shear. The use of an
unmodified shear force produces a conservative design in all of the specimens in the current
study. It can be seen that the prediction equations are overly conservative in some cases. The
LH-1 rafter ultimately sustained a load 80 percent higher than predicted, and the SH-2 Column
was conservative by 57 percent. These two examples are the most extreme cases, however and
the ratio of predicted shear strength to unmodified experimental load is 1.38 on average. The
results obtained from Sumner et al. test data also do not indicate a consistent prediction of web
shear strength using a modified shear force. The use of both modified and unmodified shear
forces produced unconservative results in the Knee 1 rafter of the Sumner et al. study.
The nominal shear strengths of the columns and rafters are negligibly different, as shown
in Table 4-1. Due to the orientation of the tested specimens, the unmodified and modified shear
forces in the rafters are an average of 73 percent and 66 percent of the shear in the columns,
respectively. Thus, column web buckling should occur prior to rafter web buckling. However
web buckling occurred first in the specimen SH-1 rafter, and in the LH-1 specimen, both rafter
and column web buckling occurred.
56
The rafters in specimens LH-1 and SH-1, which exhibited shear buckling failures at
lower than predicted values, also contained higher initial imperfections than the associated
columns. The ratios of deviations to the MBMA tolerance criteria along both a transverse (c)
and longitudinal (f) line were given in Table 2-6, with the shaded rows indicating the failure
location due to web shear buckling. The deviations in the SH-1 rafter exceeded the D/72 limit
along the centerline and the longitudinal deviation of the LH-1 rafter was more than 90 percent
of the D/72 limit.
Failure consistently occurred in the member with a higher imperfection ratio along the
centerline. The LH-1 specimen failed in both the rafter and column. If the observed early
failures in the rafters are in fact a result of these web imperfections, then some interesting
observations can be made. As has already been stated, the column webs were the more likely
location of web shear buckling failure. If the LH-1 and SH-1 rafters are removed from the study
for the sake of argument, it can be seen in Table 4-1 that the modified shear produces highly
favorable results.
57
CHAPTER 5
CONCLUSIONS AND RECOMMENDATIONS
5.1 Summary and Conclusions
This study involved simulated gravity load tests of four slender, unstiffened web tapered
gable frame knee specimens. Initial imperfections in the web plane were measured and
compared to tolerance limits set by The Metal Building Manufacturers Association (MBMA).
Theoretical shear forces in the webs near the column and rafter connection were determined by a
modified shear approach, which accounts for the transverse component of force in the inclined
flanges, and by an unmodified approach which is determined directly from the externally applied
shear. The web plate shear strengths were calculated according to the AISC provisions for
prismatic members. Several observations can be made when comparing the experimental and
analytical results.
The measured initial deviations in the webs from a flat plane may be reasonably
correlated with earlier than predicted failures in the rafters of specimen SH-1 and LH-1. If these
imperfections did influence early buckling, the modified shear forces appear to produce very
accurate results. However it is not certain that these failures were the result of web
imperfections, and the web shear stresses determined from strain data do not support a modified
shear method as presented in Section 3.3.1. The shear strains indicate higher shear stresses near
the compression flange and lower shear stresses near the tension flange. This suggests that there
is some interaction between the flexural forces in the inclined flanges and the shear forces in the
web. The presence of higher shear stresses near the compression flange indicate that the
transverse component of the flange force may have a negative influence on the web shear, rather
than acting to reduce the shear demand on the web.
The presence of a variable shear stress distribution is also not addressed by the AISC
provisions for prismatic members that were used in the strength analysis. It has been shown that
the use of unmodified shear forces and the AISC shear design provisions produce conservative
results but it is acknowledged that these approaches do not accurately address the stresses present
in slender unstiffened tapered steel members.

58
The current study has shown that the shear forces which the unstiffened web plate must
be designed to resist can only be consistently determined using unmodified shear forces. For this
reason, it is recommended that the rafter and column web plates of slender, unstiffened tapered
members similar to those shown in Figure 2-1, be designed using unmodified shear forces.
When unmodified shear forces are used, the calculation of a web plate’s shear capacity appears
to be adequately managed by the provisions for prismatic girders, according to the AISC strength
equations presented in Section 3.3.2.
5.2 Recommendations for Future Research
The current study has raised several questions about the performance of slender webs in
tapered members. Similar tests, with measured imperfections of members with stockier web
elements, would be useful to determine the relative interaction of web plate slenderness and
deviations from a flat plane. Such tests may also present more conclusive evidence for a
modified shear force. While it was shown that the current AISC shear design method for
prismatic members is adequate for design, it does not account for the observed variation in shear
stress distributions across the web depth. The cause of variation in shear stress distribution was
not obvious. Tests of tapered members with stockier webs would be very helpful in establishing
the shear strain distribution across the web in the absence of differential bending strains, which
may be useful in defining the influence of inclined flange forces on shear and flexure interaction.
Another issue that could not be addressed in the current study is the effect of
concentrated forces introduced at the reentrant corner by the adjacent member compression
flange. The code provisions used to determine the adequacy of a web element to resist crippling
and local yielding due to concentrated forces were developed using yield line models and test
data from prismatic members (Roberts 1981). These provisions cannot be reasonably applied to
the geometry and load paths at the reentrant corner of a diagonal knee connection.

59
REFERENCES AISC. (1974). Supplement No. 3 to The Specification for the Design, Fabrication and Erection of
Structural Steel for Buildings (1969), American Institute of Steel Construction, NY.
AISC. (1994). Manual of Steel Construction – Load and Resistance Factor Design, American Institute of Steel Construction, Inc., Chicago, IL.
AISC. (2005a). Specification for Structural Steel Buildings, American Institute of Steel Construction, Inc., Chicago, IL.
AISC. (2005b). Steel Construction Manual, 13th ed., American Institute of Steel Construction, Inc., Chicago, IL.
Amirikian, A. (1951). "Wedge-beam framing." Proceedings - American Society of Civil Engineers, 77(Separate 53).
Basler, K. (1961a). "Strength of Plate Girders in Shear." ASCE Journal of the Structural Division, 87(ST7 Part 1), 151-180.
Basler, K. (1961b). "Strength of Plate Girders Under Combined Bending and Shear." ASCE Journal of The Structural Division, 87(ST7 Part 2), 181-197.
Basler, K., and Thurlimann, B. (1961). "Strength of Plate Girders in Bending." ASCE Journal of the Structural Division, 87(ST6), 153-181.
Beer, F. P., Johnston, Jr., E. R., DeWolf, J.T. (2002). Mechanics of Materials. McGraw Hill, Boston.
Bleich, F. (1952). Buckling Strength of Metal Structures, McGraw-Hill Book Co., NY.
Blodgett, O. W. (1966). Design of Welded Structures, The James F. Lincoln Arc Welding Foundation, Cleveland, OH.
Bresler, B., Lin, T. Y., and Scalzi, J. B. (1968). Design of Steel Structures, John Wiley and Sons, Inc., New York.

60
Computers and Structures, Inc. (2006). SAP2000 v10 - Integrated Structural Analysis & Design Software, Computers and Structures, Inc., Berkeley, California.
Holman, J.P. (1978). Experimental Methods for Engineers. McGraw Hill, New York.
Kaehler, R. C., White, D., and Kim, Y. D. (2007). Frame Design Using Web Tapered Members, Steel Design Guide Series (Draft-Jul. 10, 2007), American Institute of Steel Construction, Chicago, IL.
Lee, G. C., Ketter, R. L., and Hsu, T. L. (1981). Design of Single Story Rigid Frames, Metal Building Manufacturers Association, Cleveland, OH.
Lee, G. C., Morrell, M. L., and Ketter, R. L. (1972). "Design of Tapered Members." Welding Research Council Bulletin, 173, 1-32.
MBMA. (2006). Metal Building Systems Manual, Metal Building Manufacturers Association, Inc., Cleveland, OH.
Mirambell, E., and Zarate, A. V. (2000). "Web Buckling of Tapered Plate Girders." Proceedings of the Institution of Civil Engineers, Structures and Buildings, 140(1), 51-60.
Mirambell, E., and Zarate, A. V. (2004). "Shear Strength of Tapered Steel Plate Girders." Proceedings of the Institution of Civil Engineers, Structures and Buildings, 157(5B5), 343-354.
Murray, T. M., and Shoemaker, W. L. (2003). Flush and Extended Multiple Row Moment End Plate Connections, American Institute of Steel Construction, Chicago, IL.
Roberts, T. M. (1981). "Slender Plate Girders with Edge Loading." Proceedings of the Institution of Civil Engineers, Part 2, 71(Sept.), 805-819.
Shah, P. (2007). "Linear and Nonlinear Stability Analysis of Steel Frames with Web-Tapered Members," MS Thesis, Virginia Polytechnic Institute and State University, Blacksburg, VA.
Sullivan, S., and Charney, F. A. (2006). "Performance of Diagonal Knee Connections With and Without Stiffeners." Research Report No. CEE/VPI-ST06/02, Department of Civil and

61
Environmental Engineering, Virginia Polytechnic Institute and State University, Blacksburg, VA.
Sumner, E. A. (1995). "Experimental and Analytical Investigation of the LRFD Strength of Tapered Members," MS Thesis, Virginia Polytechnic Institute and State University, Blacksburg, VA.
Sumner, E. A., Borgsmiller, J. T., and Murray, T. M. (1995). "Experimental Investigation of Rigid Knee Joints." Research Report No. CE/VPI-ST-95/12, Department of Civil and Environmental Engineering, Virginia Polytechnic Institute and State University, Blacksburg, VA.
Tall, L. (1974). Structural Steel Design, John Wiley and Sons, New York. Williams, C. D., and Harris, E. C. (1957). Structural Design in Metals, The Ronald Press
Company, New York.

62
APPENDIX A. TEST SH-1-1 RESULTS

63
PROJECT: American Buildings Company TEST NAME: ABC-SH-1-1 (knee test 1) TEST DATE: October 25, 2006 PURPOSE: Negative Bending Moment Test for Web Buckling w/o Stiffeners
CONNECTION DESCRIPTION: NOMINAL YIELD STRESS: ………………………………………………… 55 ksi GAGE: ………………………………………………………………………….. 3 in END PLATE WIDTH: …………………………………………………………. 6 in END PLATE THICKNESS: ……………………………………………………. 1/2 in
BOLT DATA: BOLT DIAMETER: …………………………………………………………… 3/4 in BOLT TYPE: …………………………………………………………………... A490 BOLT PRETENSION: ………………………………………………………… 14 kips
COLUMN DATA: (MEASURED) OUTSIDE FLANGE WIDTH: …………………………………………………. 6 in OUTSIDE FLANGE THICKNESS: …………………………………………… 0.375 in INSIDE FLANGE WIDTH: …………………………………………………….. 6 in INSIDE FLANGE THICKNESS: ………………………………………………. 0.377 WEB DEPTH AT BASE(PERP. TO OS FLANGE): ………………………….. 14.81 in WEB DEPTH AT REENTRANT CORNER(PERP. TO OS FLANGE): ……… 22.0 in WEB THICKNESS: ……………………………………………………………. 0.131 in FLANGE YIELD STRESS: …………………………………………………… 55.1 ksi WEB YIELD STRESS: ………………………………………………………… 63.8 ksi
RAFTER DATA: (MEASURED) OUTSIDE FLANGE WIDTH: …………………………………………………. 6 in OUTSIDE FLANGE THICKNESS: ……………………………………………. 0.376 in INSIDE FLANGE WIDTH: …………………………………………………….. 6 in INSIDE FLANGE THICKNESS: ………………………………………………. 0.378 in WEB DEPTH AT BASE(PERP. TO OS FLANGE): …………………………... 11.81 in WEB DEPTH AT REENTRANT CORNER(PERP. TO OS FLANGE): ……… 22.13 in WEB THICKNESS: ……………………………………………………………. 0.131 in
EXPERIMENTAL: MAXIMUM LOAD: …………………………………………………………... 26.5 kips FAILURE LOCATION: Rafter Web at Reentrant Corner FAILURE MODE: Web Buckling
DISCUSSION
• Some opening of the end plates was observed at the tension flanges however no obvious yield lines were apparent.
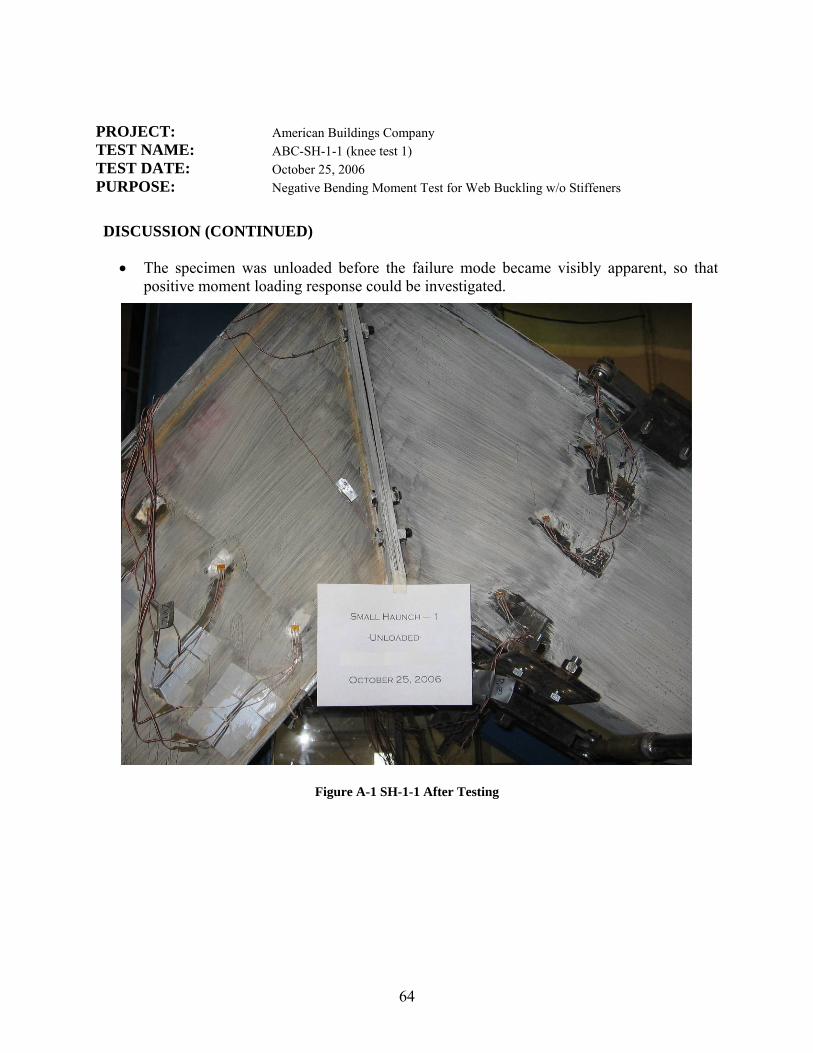
64
PROJECT: American Buildings Company TEST NAME: ABC-SH-1-1 (knee test 1) TEST DATE: October 25, 2006 PURPOSE: Negative Bending Moment Test for Web Buckling w/o Stiffeners
DISCUSSION (CONTINUED)
• The specimen was unloaded before the failure mode became visibly apparent, so that positive moment loading response could be investigated.
Figure A-1 SH-1-1 After Testing

65
Figure A-2 SH-1 Specimen Dimensions
Figure A-3 SH-1 Lateral Brace Locations

66
L/6
L/3
L/3
L/6 CWX
CWY
CWZ
2'-4"
2'-4"
RWX
RWY
RWZCFA1
CFB1
CFA2
CFB2
CFC2
CFD2
CFC1
CFD1
RFB1RFA1
RFB2RFA2
RFD2RFC2
RFD1RFC1
RafterColumn
B
B
Section B-BA
A
Section A-A
12
3
12
3
Figure A-4 Web and Flange Strain Gages As Viewed From the South

67
L/6
L/3
L/3
L/62" typ.
Rafter Column
12
3
12
3
CPA
CPB
CPC
RPA
RPB
RPC
RWA
RWB
RWC
CWC
CWB
CWA
2'-4"
2'-4"
Figure A-5 SH-1 Web Strain Gages and LVDT’s As Viewed from the North.

68
bolt 2
bolt 4
bolt 1
bolt 3
bolt 5
Ø1316"
6"
2'-8"
412"
3"
1'-214"
3"
414"
3"
3"
Figure A-6 SH-1 Gaged Bolt Orientation Viewed From the West
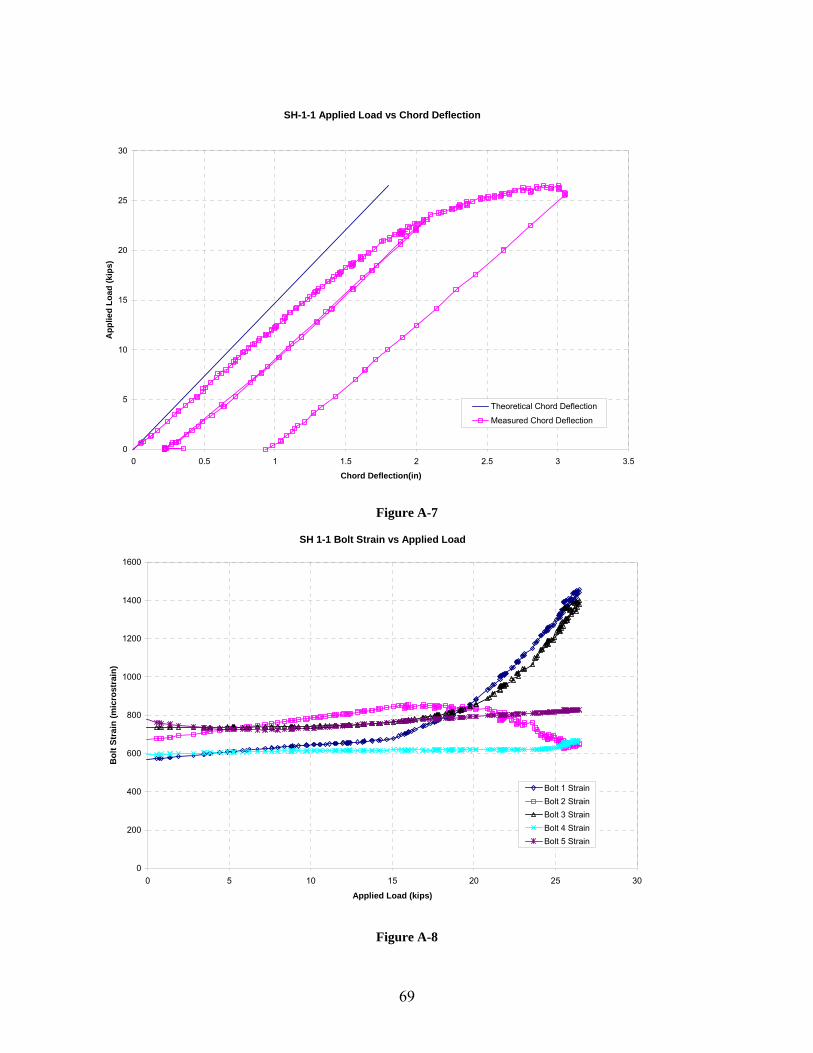
69
SH-1-1 Applied Load vs Chord Deflection
0
5
10
15
20
25
30
0 0.5 1 1.5 2 2.5 3 3.5
Chord Deflection(in)
App
lied
Load
(kip
s)
Theoretical Chord Deflection
Measured Chord Deflection
Figure A-7
SH 1-1 Bolt Strain vs Applied Load
0
200
400
600
800
1000
1200
1400
1600
0 5 10 15 20 25 30
Applied Load (kips)
Bol
t Str
ain
(mic
rost
rain
)
Bolt 1 StrainBolt 2 StrainBolt 3 StrainBolt 4 StrainBolt 5 Strain
Figure A-8

70
SH 1-1 Applied Load vs Rafter Web Displacement
0
5
10
15
20
25
30
-0.25 -0.2 -0.15 -0.1 -0.05 0 0.05 0.1 0.15 0.2 0.25
Web out of plane displacement (in)
App
lied
Load
(kip
s)
RPARPBRPC
Figure A-9
SH 1-1 Applied Load vs Column Web Displacement
0
5
10
15
20
25
30
-0.25 -0.2 -0.15 -0.1 -0.05 0 0.05 0.1 0.15 0.2 0.25
Web out of plane displacement (in)
App
lied
Load
(kip
s)
CPACPBCPC
Figure A-10

71
SH-1-1 Applied Load vs Rafter Inside Flange Strain
0
5
10
15
20
25
30
-4000 -3500 -3000 -2500 -2000 -1500 -1000 -500 0 500
Microstrain
Appl
ied
Load
(kip
s)
RFC1RFC2RFD1RFD2
TensionCompression
Figure A-11
SH-1-1 Applied Load vs Rafter Outside Flange Strain
0
5
10
15
20
25
30
-500 0 500 1000 1500 2000 2500 3000 3500 4000
Microstrain
Appl
ied
Load
(kip
s)
RFA1RFA2RFB1RFB2
TensionCompression
Figure A-12

72
SH-1-1 Applied Load vs Column Inside Flange Strain
0
5
10
15
20
25
30
-4000 -3500 -3000 -2500 -2000 -1500 -1000 -500 0 500
Microstrain
App
lied
Load
(kip
s)
CFC1CFC2CFD1CFD2
TensionCompression
Figure A-13
SH-1-1 Applied Load vs Column Outside Flange Strain
0
5
10
15
20
25
30
-500 0 500 1000 1500 2000 2500 3000 3500 4000
Microstrain
App
lied
Load
(kip
s)
CFA1CFA2CFB1CFB2
TensionCompression
Figure A-14

73
SH 1-1 Applied Load vs Rafter Web Transverse Normal Strain
0
5
10
15
20
25
30
-1500 -1000 -500 0 500 1000 1500
Microstrain
App
lied
Load
(kip
s)
RWARWBRWCRWXRWYRWZ
TensionCompression
Figure A-15
SH 1-1 Applied Load vs Column Web Transverse Normal Strain
0
5
10
15
20
25
30
-1500 -1000 -500 0 500 1000 1500
Microstrain
App
lied
Load
(kip
s)
CWACWBCWCCWXCWYCWZ
TensionCompression
Figure A-16
74
APPENDIX B. TEST SH-1-2 RESULTS (POSITIVE MOMENT)

75
PROJECT: American Buildings Company TEST NAME: ABC-SH-1-2 (knee test 2) TEST DATE: October 27, 2006 PURPOSE: Positive Bending Moment Test for Web Buckling w/o Stiffeners
CONNECTION DESCRIPTION: NOMINAL YIELD STRESS: ………………………………………………… 55 ksi GAGE: ………………………………………………………………………….. 3 in END PLATE WIDTH: …………………………………………………………. 6 in END PLATE THICKNESS: ……………………………………………………. 1/2 in
BOLT DATA: BOLT DIAMETER: …………………………………………………………… 3/4 in BOLT TYPE: …………………………………………………………………... A490 BOLT PRETENSION: ………………………………………………………… 14 kips
COLUMN DATA: (MEASURED) OUTSIDE FLANGE WIDTH: …………………………………………………. 6 in OUTSIDE FLANGE THICKNESS: …………………………………………… 0.375 in INSIDE FLANGE WIDTH: …………………………………………………….. 6 in INSIDE FLANGE THICKNESS: ………………………………………………. 0.377 WEB DEPTH AT BASE(PERP. TO OS FLANGE): ………………………….. 14.81 in WEB DEPTH AT REENTRANT CORNER(PERP. TO OS FLANGE): ……… 22.0 in WEB THICKNESS: ……………………………………………………………. 0.131 in
RAFTER DATA: (MEASURED) OUTSIDE FLANGE WIDTH: …………………………………………………. 6 in OUTSIDE FLANGE THICKNESS: ……………………………………………. 0.376 in INSIDE FLANGE WIDTH: …………………………………………………….. 6 in INSIDE FLANGE THICKNESS: ………………………………………………. 0.378 in WEB DEPTH AT BASE(PERP. TO OS FLANGE): …………………………... 11.81 in WEB DEPTH AT REENTRANT CORNER(PERP. TO OS FLANGE): ……… 22.13 in WEB THICKNESS: …………………………………………………………….. 0.131 in
EXPERIMENTAL: MAXIMUM LOAD: …………………………………………………………... 20.15 kips FAILURE LOCATION: N/A FAILURE MODE: N/A
DISCUSSION
• The test showed a marked difference in stiffness from the negative moment test, and this was attributed to the greater potential for end plate separation at the inside flanges.

76
PROJECT: American Buildings Company TEST NAME: ABC-SH-1-2 (knee test 2) TEST DATE: October 27, 2006 PURPOSE: Positive Bending Moment Test for Web Buckling w/o Stiffeners
DISCUSSION (CONTINUED)
• At 10.25 kips the specimen was unloaded through zero to negative 8.95 kips (negative moment) to verify the change in stiffness due to direction of loading.
• The specimen was then reloaded in positive moment up to 20.15 kips
• Test aborted when Bolt 5 approached design strength.
Figure B-1 SH-1-2 After Testing

77
SH 1-2 Applied Load vs Positive Moment Chord Deflection
-10
-5
0
5
10
15
20
25
-1 -0.5 0 0.5 1 1.5 2 2.5 3 3.5 4
Chord Deflection(in)
App
lied
Load
(kip
s)
Theoretical Chord DeflectionMeasured Chord Deflection
Figure B-2
SH 1-2 Bolt Strain vs Applied Load
0
500
1000
1500
2000
2500
0 5 10 15 20 25
Applied Load (kips)
Bol
t Stra
in (m
icro
stra
in)
Bolt 1 StrainBolt 2 StrainBolt 3 StrainBolt 4 StrainBolt 5 Strain
Figure B-3

78
SH 1-2 Applied Load vs Rafter Web Displacement
0
5
10
15
20
25
-0.3 -0.25 -0.2 -0.15 -0.1 -0.05 0 0.05 0.1 0.15 0.2 0.25 0.3
Web out of plane displacement (in)
Appl
ied
Load
(kip
s)
RPARPBRPC
Figure B-4
SH 1-2 Applied Load vs Column Web Displacement
0
5
10
15
20
25
-0.3 -0.25 -0.2 -0.15 -0.1 -0.05 0 0.05 0.1 0.15 0.2 0.25 0.3
Web out of plane displacement (in)
App
lied
Load
(kip
s)
CPACPBCPC
Figure B-5

79
SH-1-2 Applied Load vs Rafter Inside Flange Strain
0
5
10
15
20
25
-200 0 200 400 600 800 1000 1200 1400 1600
Microstrain
Appl
ied
Load
(kip
s)
RFC1RFC2RFD1RFD2
TensionCompression
Figure B-6
SH-1-2 Applied Load vs Rafter Outside Flange Strain
0
5
10
15
20
25
-1600 -1400 -1200 -1000 -800 -600 -400 -200 0 200
Microstrain
App
lied
Load
(kip
s)
RFA1RFA2RFB1RFB2
TensionCompression
Figure B-7

80
SH-1-2 Applied Load vs Column Inside Flange Strain
0
5
10
15
20
25
-200 0 200 400 600 800 1000 1200 1400 1600
Microstrain
Appl
ied
Load
(kip
s)
CFC1CFC2CFD1CFD2
TensionCompression
Figure B-8
SH-1-2 Applied Load vs Column Outside Flange Strain
0
5
10
15
20
25
-1600 -1400 -1200 -1000 -800 -600 -400 -200 0 200
Microstrain
Appl
ied
Load
(kip
s)
CFA1CFA2CFB1CFB2
TensionCompression
Figure B-9

81
SH 1-2 Applied Load vs Rafter Web Transvers Normal Strain
0
5
10
15
20
25
-1600 -1200 -800 -400 0 400 800 1200 1600
Microstrain
App
lied
Load
(kip
s)
RWARWBRWCRWXRWYRWZ
TensionCompression
Figure B-10
SH 1-2 Applied Load vs Column Web Transvers Normal Strain
0
5
10
15
20
25
-1600 -1200 -800 -400 0 400 800 1200 1600
Microstrain
App
lied
Load
(kip
s)
CWACWBCWCCWXCWYCWZ
TensionCompression
Figure B-11

82
APPENDIX C. TEST SH-1-3 RESULTS

83
PROJECT: American Buildings Company TEST NAME: ABC-SH-1-3 (knee test 3) TEST DATE: November 6, 2006 PURPOSE: Negative Bending Moment Test for Web Buckling w/o Stiffeners
CONNECTION DESCRIPTION: NOMINAL YIELD STRESS: ………………………………………………… 55 ksi GAGE: ………………………………………………………………………….. 3 in END PLATE WIDTH: …………………………………………………………. 6 in END PLATE THICKNESS: ……………………………………………………. 1/2 in
BOLT DATA: BOLT DIAMETER: …………………………………………………………… 3/4 in BOLT TYPE: …………………………………………………………………... A490 BOLT PRETENSION: ………………………………………………………… 14 kips
COLUMN DATA: (MEASURED) OUTSIDE FLANGE WIDTH: …………………………………………………. 6 in OUTSIDE FLANGE THICKNESS: …………………………………………… 0.375 in INSIDE FLANGE WIDTH: …………………………………………………….. 6 in INSIDE FLANGE THICKNESS: ………………………………………………. 0.377 WEB DEPTH AT BASE(PERP. TO OS FLANGE): ………………………….. 14.81 in WEB DEPTH AT REENTRANT CORNER(PERP. TO OS FLANGE): ……… 22.0 in WEB THICKNESS: ……………………………………………………………. 0.131 in
RAFTER DATA: (MEASURED) OUTSIDE FLANGE WIDTH: …………………………………………………. 6 in OUTSIDE FLANGE THICKNESS: ……………………………………………. 0.376 in INSIDE FLANGE WIDTH: …………………………………………………….. 6 in INSIDE FLANGE THICKNESS: ………………………………………………. 0.378 in WEB DEPTH AT BASE(PERP. TO OS FLANGE): …………………………... 11.81 in WEB DEPTH AT REENTRANT CORNER(PERP. TO OS FLANGE): ……… 22.13 in WEB THICKNESS: …………………………………………………………….. 0.131 in
EXPERIMENTAL: MAXIMUM LOAD: …………………………………………………………... 25.0 kips FAILURE LOCATION: Column Web at Reentrant Corner FAILURE MODE: Web Buckling
DISCUSSION
• The structure showed significantly less stiffness up to about 12 kips, which is attributed to the closing of the end plates after yielding induced from Knee Test 2.
• Once linear behavior consistent with the prediction curve was exhibited, the specimen was unloaded and the test resumed.

84
PROJECT: American Buildings Company TEST NAME: ABC-SH-1-3 (knee test 3) TEST DATE: November 6, 2006 PURPOSE: Negative Bending Moment Test for Web Buckling w/o Stiffeners
DISCUSSION (CONTINUED)
• At 23.76 kips column and rafter web buckling or crippling became evident at the intersection of the compression flanges and end plates.
• The load was removed so that short stiffener plates could be installed at these locations, to validate web buckling.
• A positive moment load of approximately 8.25 kips was imposed in an attempt to reverse the web crippling and allow for easier stiffener plate installation.
Figure C-1 SH-1-3 Possible Web Crippling At Reentrant Corner

85
SH-1-3 Applied Load vs Chord Deflection
-15
-10
-5
0
5
10
15
20
25
30
-1 -0.5 0 0.5 1 1.5 2 2.5 3 3.5 4 4.5 5
Chord Deflection (in)
App
lied
Load
(kip
s)
Theoretical Chord DeflectionMeasured Chord Deflection
Figure C-2
SH 1-3 Bolt Strain vs Applied Load
0
200
400
600
800
1000
1200
1400
1600
0 5 10 15 20 25 30
Applied Load (kips)
Bolt
Stra
in (m
icro
stra
in)
Bolt 1 StrainBolt 2 StrainBolt 3 StrainBolt 4 StrainBolt 5 Strain
Figure C-3

86
SH 1-3 Applied Load vs Rafter Web Displacement
0
5
10
15
20
25
30
-0.6 -0.4 -0.2 0 0.2 0.4 0.6
Web out of plane displacement (in)
Appl
ied
Load
(kip
s)
RPARPBRPC
Figure C-4
SH 1-3 Applied Load vs Column Web Displacement
0
5
10
15
20
25
30
-0.6 -0.4 -0.2 0 0.2 0.4 0.6
Web out of plane displacement (in)
App
lied
Load
(kip
s)
CPACPBCPC
Figure C-5

87
SH-1-3 Applied Load vs Rafter Inside Flange Strain
0
5
10
15
20
25
30
-10000 -9000 -8000 -7000 -6000 -5000 -4000 -3000 -2000 -1000 0 1000 2000
Microstrain
Appl
ied
Load
(kip
s)
RFC1RFC2RFD1RFD2
TensionCompression
Figure C-6
SH-1-3 Applied Load vs Rafter Outside Flange Strain
0
5
10
15
20
25
30
-1000 0 1000 2000 3000 4000 5000 6000 7000 8000 9000 10000
Microstrain
App
lied
Load
(kip
s)
RFA1RFA2RFB1RFB2
TensionCompression
Figure C-7
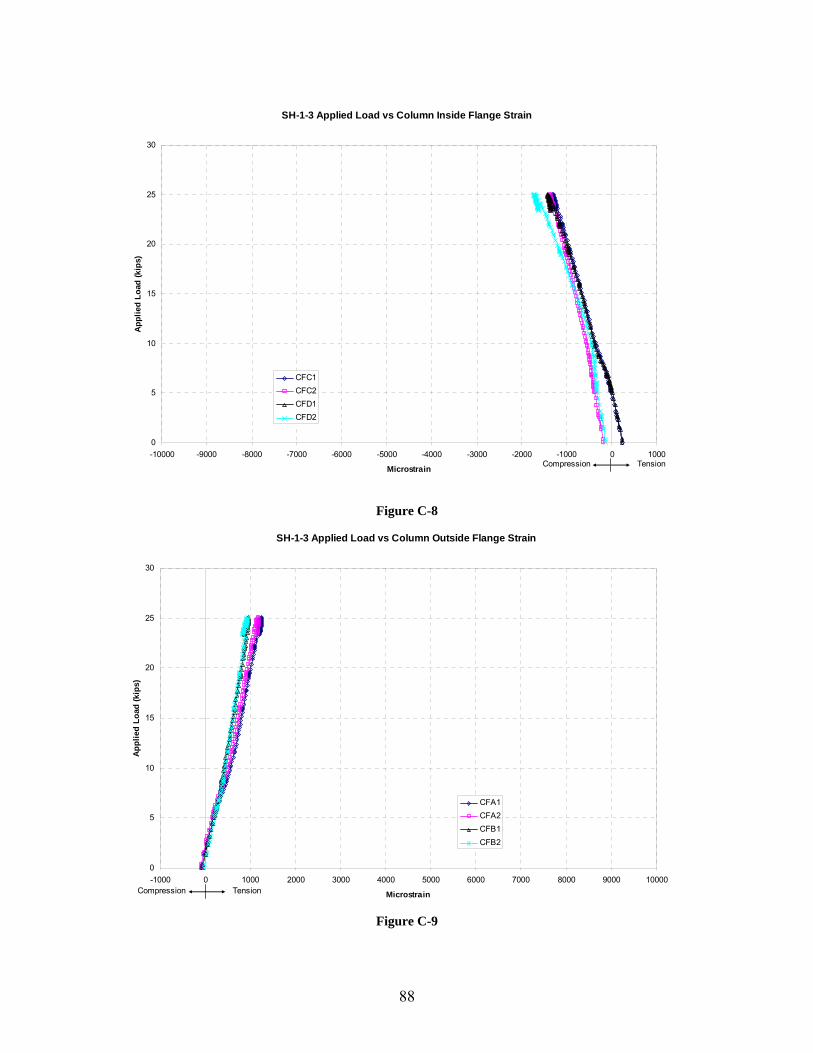
88
SH-1-3 Applied Load vs Column Inside Flange Strain
0
5
10
15
20
25
30
-10000 -9000 -8000 -7000 -6000 -5000 -4000 -3000 -2000 -1000 0 1000
Microstrain
Appl
ied
Load
(kip
s)
CFC1CFC2CFD1CFD2
TensionCompression
Figure C-8
SH-1-3 Applied Load vs Column Outside Flange Strain
0
5
10
15
20
25
30
-1000 0 1000 2000 3000 4000 5000 6000 7000 8000 9000 10000
Microstrain
Appl
ied
Load
(kip
s)
CFA1CFA2CFB1CFB2
TensionCompression
Figure C-9

89
SH-1-3 Applied Load vs Rafter Web Transvers Normal Strain
0
5
10
15
20
25
30
-2500 -2000 -1500 -1000 -500 0 500 1000 1500 2000 2500
Microstrain
App
lied
Load
(kip
s)
RWARWBRWCRWXRWYRWZ
TensionCompression
Figure C-10
SH-1-3 Applied Load vs Column Web Transverse Normal Strain
0
5
10
15
20
25
30
-2500 -2000 -1500 -1000 -500 0 500 1000 1500 2000 2500
Microstrain
App
lied
Load
(kip
s)
CWACWBCWCCWXCWYCWZ
TensionCompression
Figure C-11

90
APPENDIX D. TEST SH-1-4 RESULTS

91
PROJECT: American Buildings Company TEST NAME: ABC-SH-1-4 (knee test 4) TEST DATE: November 10, 2006 PURPOSE: Negative Bending Moment Test for Web Buckling w/o Stiffeners
CONNECTION DESCRIPTION: NOMINAL YIELD STRESS: ………………………………………………… 55 ksi GAGE: ………………………………………………………………………….. 3 in END PLATE WIDTH: …………………………………………………………. 6 in END PLATE THICKNESS: ……………………………………………………. 1/2 in
BOLT DATA: BOLT DIAMETER: …………………………………………………………… 3/4 in BOLT TYPE: …………………………………………………………………... A490 BOLT PRETENSION: ………………………………………………………… 14 kips
COLUMN DATA: (MEASURED) OUTSIDE FLANGE WIDTH: …………………………………………………. 6 in OUTSIDE FLANGE THICKNESS: …………………………………………… 0.375 in INSIDE FLANGE WIDTH: …………………………………………………….. 6 in INSIDE FLANGE THICKNESS: ………………………………………………. 0.377 WEB DEPTH AT BASE(PERP. TO OS FLANGE): ………………………….. 14.81 in WEB DEPTH AT REENTRANT CORNER(PERP. TO OS FLANGE): ……… 22.0 in WEB THICKNESS: ……………………………………………………………. 0.131 in
RAFTER DATA: (MEASURED) OUTSIDE FLANGE WIDTH: …………………………………………………. 6 in OUTSIDE FLANGE THICKNESS: ……………………………………………. 0.376 in INSIDE FLANGE WIDTH: …………………………………………………….. 6 in INSIDE FLANGE THICKNESS: ………………………………………………. 0.378 in WEB DEPTH AT BASE(PERP. TO OS FLANGE): …………………………... 11.81 in WEB DEPTH AT REENTRANT CORNER(PERP. TO OS FLANGE): ……… 22.13 in WEB THICKNESS: …………………………………………………………….. 0.131 in
EXPERIMENTAL: MAXIMUM LOAD: …………………………………………………………... 22.96 kips FAILURE LOCATION: Column Web at Reentrant Corner FAILURE MODE: Web Buckling
DISCUSSION
• Short stiffener plates were welded to the web at the end plate and compression flange intersection, to control web crippling.
• At approximately 22.88 kips a loud noise and load loss occurred. Some slipping of lateral brace supports was apparent at top of rafter outside flange.

92
PROJECT: American Buildings Company TEST NAME: ABC-SH-1-4 (knee test 4) TEST DATE: November 10, 2006 PURPOSE: Negative Bending Moment Test for Web Buckling w/o Stiffeners
DISCUSSION (CONTINUED)
• At 21.12 kips, lateral torsional buckling occurred in the bottom flange of the rafter between brace points.
Figure D-1 SH-1-4 Lateral Torsional Buckling

93
SH-1-4 Applied Load vs Chord Deflection
0
5
10
15
20
25
0 0.5 1 1.5 2 2.5 3 3.5 4 4.5
Chord Deflection (in)
App
lied
Load
(kip
s)
Theoretical Chord DeflectionMeasured Chord Deflection
Figure D-2
SH 1-4 Bolt Strain vs Applied Load
0
200
400
600
800
1000
1200
1400
1600
0 5 10 15 20 25
Applied Load (kips)
Bolt
Stra
in (m
icro
stra
in)
Bolt 1 StrainBolt 2 StrainBolt 3 StrainBolt 4 StrainBolt 5 Strain
Figure D-3
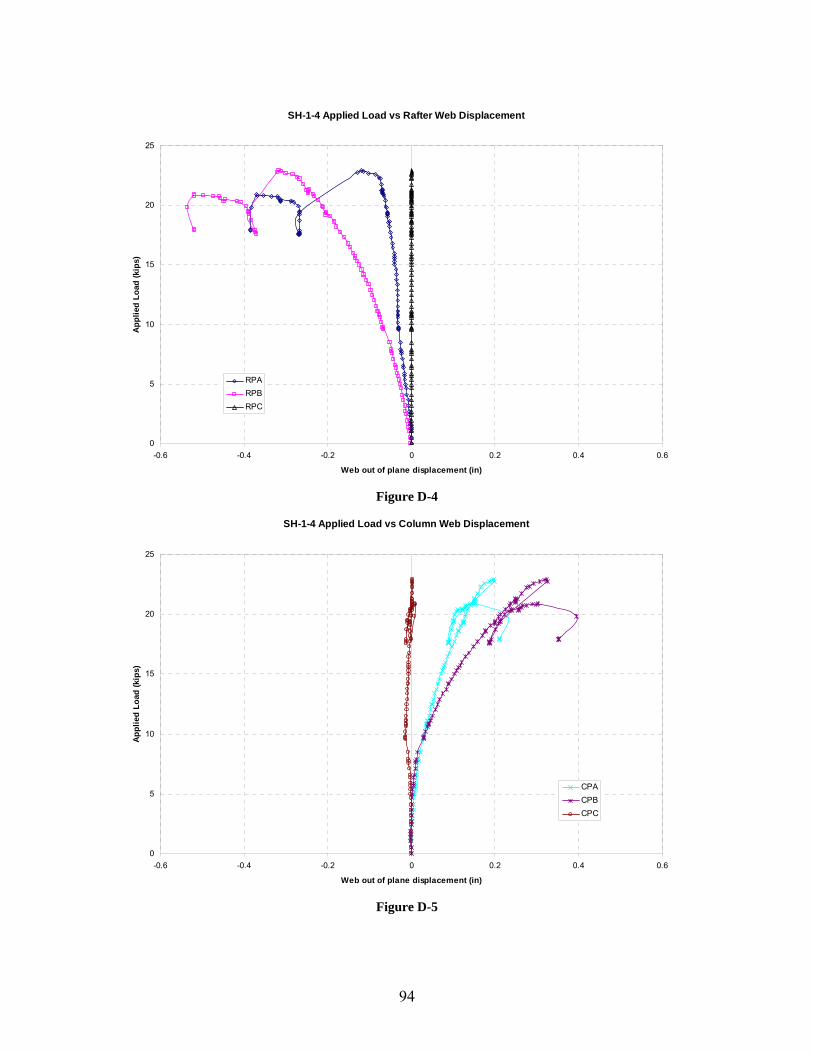
94
SH-1-4 Applied Load vs Rafter Web Displacement
0
5
10
15
20
25
-0.6 -0.4 -0.2 0 0.2 0.4 0.6
Web out of plane displacement (in)
Appl
ied
Load
(kip
s)
RPARPBRPC
Figure D-4
SH-1-4 Applied Load vs Column Web Displacement
0
5
10
15
20
25
-0.6 -0.4 -0.2 0 0.2 0.4 0.6
Web out of plane displacement (in)
Appl
ied
Load
(kip
s)
CPACPBCPC
Figure D-5

95
SH-1-4 Applied Load vs Rafter Inside Flanges Strain
0
5
10
15
20
25
-3500 -3000 -2500 -2000 -1500 -1000 -500 0 500
Microstrain
Appl
ied
Load
(kip
s)
RFC1RFC2RFD1RFD2
TensionCompression
Figure D-6
SH-1-4 Applied Load vs Rafter Outside Flanges Strain
0
5
10
15
20
25
-500 0 500 1000 1500 2000 2500 3000 3500
Microstrain
Appl
ied
Load
(kip
s)
RFA1RFA2RFB1RFB2
TensionCompression
Figure D-7
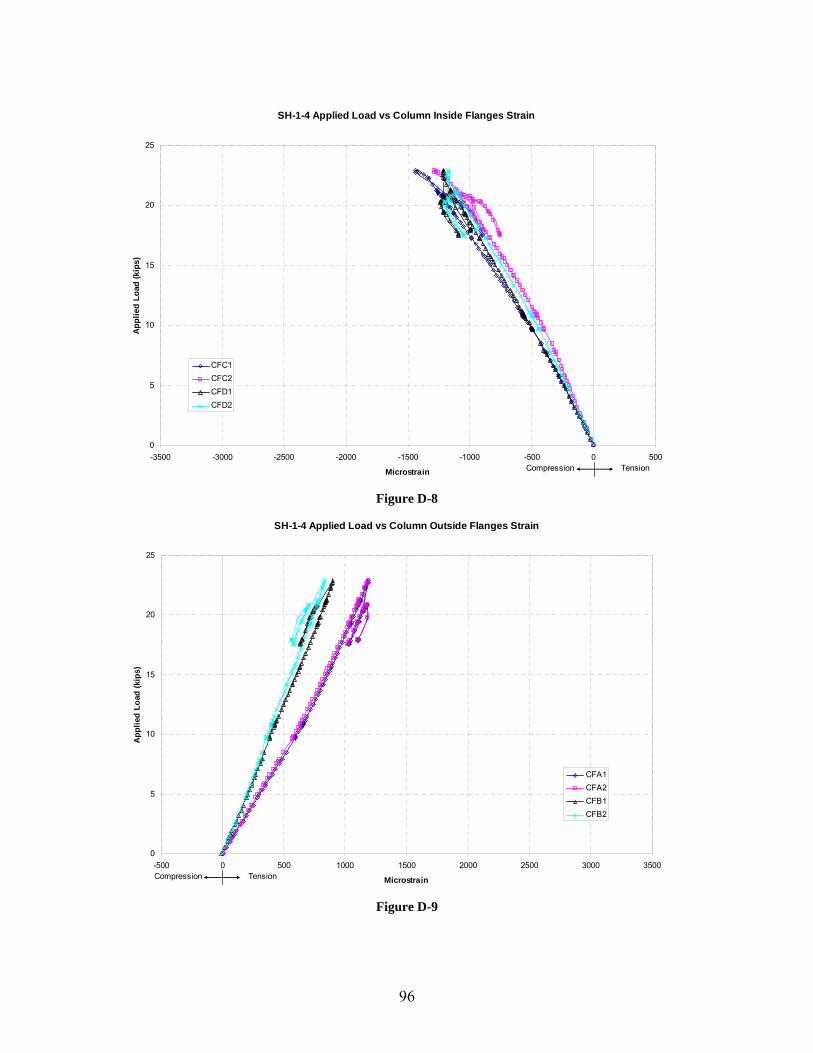
96
SH-1-4 Applied Load vs Column Inside Flanges Strain
0
5
10
15
20
25
-3500 -3000 -2500 -2000 -1500 -1000 -500 0 500
Microstrain
Appl
ied
Load
(kip
s)
CFC1CFC2CFD1CFD2
TensionCompression
Figure D-8
SH-1-4 Applied Load vs Column Outside Flanges Strain
0
5
10
15
20
25
-500 0 500 1000 1500 2000 2500 3000 3500
Microstrain
App
lied
Load
(kip
s)
CFA1CFA2CFB1CFB2
TensionCompression
Figure D-9

97
SH-1-4 Applied Load vs Rafter Web Transverse Normal Strain
0
5
10
15
20
25
-2000 -1600 -1200 -800 -400 0 400 800 1200 1600 2000
Microstrain
App
lied
Load
(kip
s)
RWARWBRWCRWXRWYRWZ
TensionCompression
Figure D-10
SH-1-4 Applied Load vs Column Web Transverse Normal Strain
0
5
10
15
20
25
-2000 -1600 -1200 -800 -400 0 400 800 1200 1600 2000
Microstrain
App
lied
Load
(kip
s)
CWACWBCWCCWXCWYCWZ
TensionCompression
Figure D-11

98
APPENDIX E. TEST SH-2-1 RESULTS

99
PROJECT: American Buildings Company TEST NAME: ABC-SH-2-1 (knee test 5) TEST DATE: November 27, 2006 PURPOSE: Negative Bending Moment Test for Web Buckling w/o Stiffeners
CONNECTION DESCRIPTION: NOMINAL YIELD STRESS: ………………………………………………… 55 ksi GAGE: ………………………………………………………………………….. 3 in END PLATE WIDTH: …………………………………………………………. 6 in END PLATE THICKNESS: ……………………………………………………. 1/2 in
BOLT DATA: BOLT DIAMETER: …………………………………………………………… 3/4 in BOLT TYPE: …………………………………………………………………... A490 BOLT PRETENSION: ………………………………………………………… 14 kips
COLUMN DATA: (MEASURED) OUTSIDE FLANGE WIDTH: …………………………………………………. 6 in OUTSIDE FLANGE THICKNESS: …………………………………………… 0.375 in INSIDE FLANGE WIDTH: …………………………………………………….. 6 in INSIDE FLANGE THICKNESS: ………………………………………………. 0.377 WEB DEPTH AT BASE(PERP. TO OS FLANGE): ………………………….. 14.81 in WEB DEPTH AT REENTRANT CORNER(PERP. TO OS FLANGE): ……… 22.0 in WEB THICKNESS: ……………………………………………………………. 0.131 in
RAFTER DATA: (MEASURED) OUTSIDE FLANGE WIDTH: …………………………………………………. 6 in OUTSIDE FLANGE THICKNESS: ……………………………………………. 0.376 in INSIDE FLANGE WIDTH: …………………………………………………….. 6 in INSIDE FLANGE THICKNESS: ………………………………………………. 0.378 in WEB DEPTH AT BASE(PERP. TO OS FLANGE): …………………………... 11.81 in WEB DEPTH AT REENTRANT CORNER(PERP. TO OS FLANGE): ……… 22.13 in WEB THICKNESS: …………………………………………………………….. 0.131 in
EXPERIMENTAL: MAXIMUM LOAD: …………………………………………………………... 26.08 kips FAILURE LOCATION: Column Web at Reentrant Corner FAILURE MODE: Web Buckling
DISCUSSION:
• At approximately 7 kips large web deflections were observed in the plunger readings, and a loud popping sound was heard. The specimen was unloaded and web displacement transducers were realigned.
• Loading resumed to 8.8 kips and unloaded.

100
PROJECT: American Buildings Company TEST NAME: ABC-SH-2-1 (knee test 5) TEST DATE: November 27, 2006 PURPOSE: Negative Bending Moment Test for Web Buckling w/o Stiffeners
DISCUSSION (CONTINUED)
• After resuming loading, at approximately 18.5 kips, the column web transducers indicate a reversal in direction.
• Specimen unloaded again at 22.2 kips, and reloaded.
• At 23.8 kips yield lines were observed in the web at reentrant corner.
• At 24.6 kips and 2.55 inches chord deflection, yield lines were apparent in the webs at the intersection of tension flanges and end plates. Crippling in the web at the reentrant corner was also visible, as was yielding in the compression flanges.
• At 25 kips and 3.1 inches chord deflection, lateral torsional buckling occurred between braced points on the rafter inside flange.
Figure E-1 SH-2-1 Possible Web Crippling at Reentrant Corner
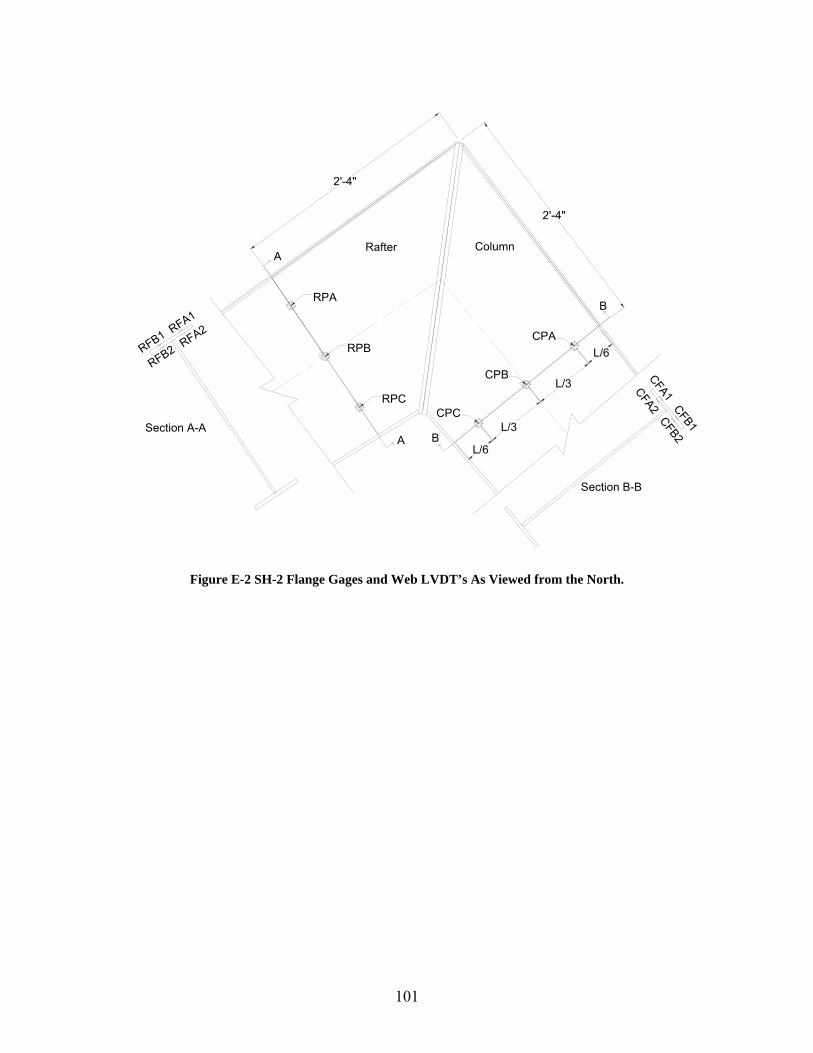
101
L/6
L/3
L/3
L/6
2'-4"
2'-4"
Rafter Column
CPA
CPB
CPC
RPA
RPB
RPC
CFA1CFB1
CFA2CFB2
B
B
RFB1 RFA1
RFB2 RFA2
A
A
Section B-B
Section A-A
Figure E-2 SH-2 Flange Gages and Web LVDT’s As Viewed from the North.

102
Ø1316"
bolt 1
bolt 2
bolt 4
bolt 3
bolt 5
6"
2'-8"
412"
3"
1'-214"
3"
414"
3"
3"
Figure E-3 SH-2 Bolt Gages as Viewed from the West.

103
SH-2-1 Applied Load vs Chord Deflection
0
5
10
15
20
25
30
0 0.5 1 1.5 2 2.5 3 3.5
Chord Deflection (in)
App
lied
Load
(kip
s)
Theoretical Chord DeflectionMeasured Chord Deflection
Figure E-4
SH-2-1 Bolt Strain vs Applied Load
0
200
400
600
800
1000
1200
1400
1600
1800
0 5 10 15 20 25 30
Applied Load (kips)
Mic
rost
rain
Bolt 1 StrainBolt 2 StrainBolt 3 StrainBolt 4 StrainBolt 5 Strain
Figure E-5

104
SH-2-1 Applied Load vs Rafter Web Displacement
0
5
10
15
20
25
30
-0.7 -0.5 -0.3 -0.1 0.1 0.3 0.5 0.7
Web out of plane displacement (in)
Appl
ied
Load
(kip
s)
RPARPBRPC
Figure E-6
SH-2-1 Applied Load vs Column Web Displacement
0
5
10
15
20
25
30
-0.7 -0.5 -0.3 -0.1 0.1 0.3 0.5 0.7
Web out of plane displacement (in)
Appl
ied
Load
(kip
s)
CPACPBCPC
Figure E-7

105
SH-2-1 Applied Load vs Rafter Outside Flange Strain
0
5
10
15
20
25
30
-200 0 200 400 600 800 1000 1200 1400 1600
Microstrain
Appl
ied
Load
(kip
s)
RFA1RFA2RFB1RFB2
TensionCompression
Figure E-8
SH-2-1 Applied Load vs Column Outside Flange Strain
0
5
10
15
20
25
30
-200 0 200 400 600 800 1000 1200 1400 1600
Microstrain
Appl
ied
Load
(kip
s)
CFA1CFA2CFB1CFB2
TensionCompression
Figure E-9

106
APPENDIX F. TEST MH-1-1 RESULTS

107
PROJECT: American Buildings Company TEST NAME: ABC-MH-1-1 (knee test 6) TEST DATE: February 7, 2007 PURPOSE: Negative Bending Moment Test for Web Buckling w/o Stiffeners
CONNECTION DESCRIPTION: NOMINAL YIELD STRESS: ………………………………………………… 55 ksi GAGE: ………………………………………………………………………….. 3 in END PLATE WIDTH: …………………………………………………………. 8 in COLUMN END PLATE THICKNESS: ………………………………………. 0.752 in RAFTER END PLATE THICKNESS: .………………………………………. 0.732 in
BOLT DATA: BOLT DIAMETER: …………………………………………………………… 3/4 in BOLT TYPE: …………………………………………………………………... A490 BOLT PRETENSION: ………………………………………………………… 14 kips
COLUMN DATA: (MEASURED) OUTSIDE FLANGE WIDTH: …………………………………………………. 8 in OUTSIDE FLANGE THICKNESS: …………………………………………… 0.504 in INSIDE FLANGE WIDTH: …………………………………………………….. 8 in INSIDE FLANGE THICKNESS: ………………………………………………. 0.750 in WEB DEPTH AT BASE(PERP. TO OS FLANGE): ………………………….. 29.062 in WEB DEPTH AT REENTRANT CORNER(PERP. TO OS FLANGE): ……… 35.938 in WEB THICKNESS: ……………………………………………………………. 0.247 in
RAFTER DATA: (MEASURED) OUTSIDE FLANGE WIDTH: …………………………………………………. 8 in OUTSIDE FLANGE THICKNESS: ……………………………………………. 0.497 in INSIDE FLANGE WIDTH: …………………………………………………….. 8 in INSIDE FLANGE THICKNESS: ………………………………………………. 0.750 in WEB DEPTH AT BASE(PERP. TO OS FLANGE): …………………………... 24.938 in WEB DEPTH AT REENTRANT CORNER(PERP. TO OS FLANGE): ……… 35.625 in WEB THICKNESS: …………………………………………………………….. 0.247 in
EXPERIMENTAL: MAXIMUM LOAD: …………………………………………………………... 86.47 kips FAILURE LOCATION: Column Web at Reentrant Corner FAILURE MODE: Web Buckling
DISCUSSION:
• Specimen unloaded at76 kips to approximately 10 kips, then reloaded.
• At approximately 83.6 kips, rafter compression flange yielding was evident.
• At 84.5 kips and 2.5 inches chord deflection, displacement control begun.
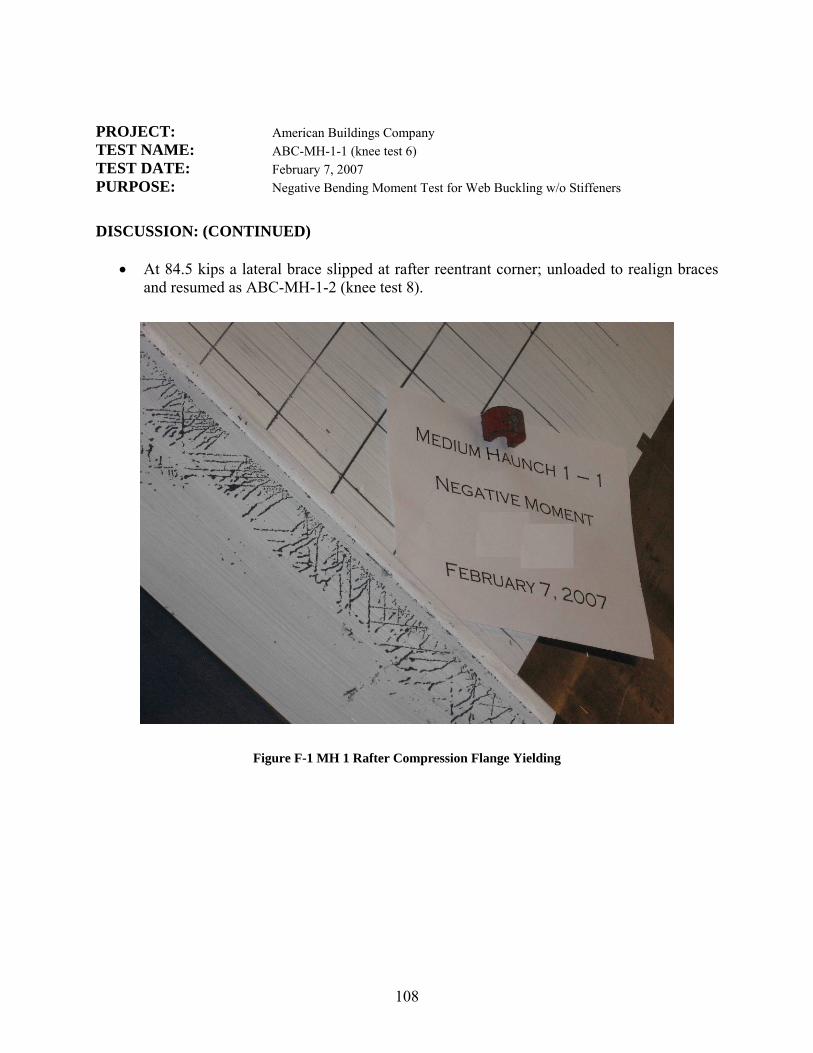
108
PROJECT: American Buildings Company TEST NAME: ABC-MH-1-1 (knee test 6) TEST DATE: February 7, 2007 PURPOSE: Negative Bending Moment Test for Web Buckling w/o Stiffeners
DISCUSSION: (CONTINUED)
• At 84.5 kips a lateral brace slipped at rafter reentrant corner; unloaded to realign braces and resumed as ABC-MH-1-2 (knee test 8).
Figure F-1 MH 1 Rafter Compression Flange Yielding

109
Figure F-2 MH-1 Specimen Dimensions
Figure F-3 MH-1 Lateral Brace Locations

110
L/6
L/3
L/3
L/6 CWX
CWY
CWZ
3'-2 13/16"
3'-2 3/4"
RWX
RWY
RWZCFA1
CFB1
CFA2
CFB2
CFC2
CFD2
CFC1
CFD1
RFB1RFA1
RFB2RFA2
RFD2RFC2
RFD1RFC1
RafterColumn
B
B
Section B-BA
A
Section A-A
12
3
12
3
Figure F-4 MH-1 Web and Flange Strain Gages As Viewed From the South

111
L/6
L/3
L/3
L/62" typ.
Rafter Column
12
3
12
3
CPA
CPB
CPC
RPA
RPB
RPC
RWA
RWB
RWC
CWC
CWB
CWA
3'-2 3/4"
3'-2 13/16"
Figure F-5 MH-1 Web Strain Gages and LVDT’s As Viewed from the North.

112
3"
3"
3"
3"
412"
4'-3"
412"
3"
2'
3"
Figure F-6 MH-1 Gaged Bolt Orientation Viewed From the West

113
MH 1-1 Applied Load vs Chord Deflection
0
10
20
30
40
50
60
70
80
90
100
0 0.5 1 1.5 2 2.5 3
Chord Deflection (in)
App
lied
Load
(kip
s)
Theoretical Chord DeflectionMeasured Chord Deflection
Figure F-7
MH 1-1 Bolt Strain vs Applied Load
0
500
1000
1500
2000
2500
3000
3500
4000
0 10 20 30 40 50 60 70 80 90 100
Applied Load (kips)
Bol
t Stra
in (m
icro
stra
in)
Bolt 1 StrainBolt 2 StrainBolt 3 StrainBolt 4 StrainBolt 5 Strain
Figure F-8

114
MH 1-1 Applied Load vs Rafter Web Displacement
0
10
20
30
40
50
60
70
80
90
100
-0.6 -0.4 -0.2 0 0.2 0.4 0.6
Web out of plane displacement (in)
Appl
ied
Load
(kip
s)
RPARPBRPC
Figure F-9
MH 1-1 Applied Load vs Column Web Displacement
0
10
20
30
40
50
60
70
80
90
100
-0.6 -0.5 -0.4 -0.3 -0.2 -0.1 0 0.1 0.2 0.3 0.4 0.5 0.6
Web out of plane displacement (in)
App
lied
Load
(kip
s)
CPACPBCPC
Figure F-10

115
MH 1-1 Applied Load vs Rafter Inside Flange Strain
0
10
20
30
40
50
60
70
80
90
100
-5400 -5000 -4600 -4200 -3800 -3400 -3000 -2600 -2200 -1800 -1400 -1000 -600 -200 200
Microstrain
App
lied
Load
(kip
s)
RFC1RFC2RFD1RFD2
TensionCompression
Figure F-11
MH 1-1 Applied Load vs Rafter Outside Flange Strain
0
10
20
30
40
50
60
70
80
90
100
-200 0 200 400 600 800 1000 1200 1400 1600 1800 2000 2200
Microstrain
App
lied
Load
(kip
s)
RFA1RFA2RFB1RFB2
TensionCompression
Figure F-12

116
MH 1-1 Applied Load vs Column Inside Flange Strain
0
10
20
30
40
50
60
70
80
90
100
-2200 -2000 -1800 -1600 -1400 -1200 -1000 -800 -600 -400 -200 0 200
Microstrain
App
lied
Load
(kip
s)
CFC1CFC2CFD1CFD2
TensionCompression
Figure F-13
MH 1-1 Applied Load vs Column Outside Flange Strain
0
10
20
30
40
50
60
70
80
90
100
-200 0 200 400 600 800 1000 1200 1400 1600 1800 2000 2200
Microstrain
App
lied
Load
(kip
s)
CFA1CFA2CFB1CFB2
TensionCompression
Figure F-14

117
MH 1-1 Applied Load vs Rafter Web Transverse Normal Strain
0
10
20
30
40
50
60
70
80
90
100
-1400 -1200 -1000 -800 -600 -400 -200 0 200 400 600 800 1000 1200 1400
Microstrain
App
lied
Load
(kip
s)
RWARWBRWCRWXRWYRWZ
TensionCompression
Figure F-15
MH 1-1 Applied Load vs Column Web Transverse Normal Strain
0
10
20
30
40
50
60
70
80
90
100
-1400 -1200 -1000 -800 -600 -400 -200 0 200 400 600 800 1000 1200 1400
Microstrain
App
lied
Load
(kip
s)
CWACWBCWCCWXCWYCWZ
TensionCompression
Figure F-16

118
APPENDIX G. TEST MH-1-2 RESULTS

119
PROJECT: American Buildings Company TEST NAME: ABC-MH-1-2 (knee test 7) TEST DATE: February 12, 2007 PURPOSE: Negative Bending Moment Test for Web Buckling w/o Stiffeners
CONNECTION DESCRIPTION: NOMINAL YIELD STRESS: ………………………………………………… 55 ksi GAGE: ………………………………………………………………………….. 3 in END PLATE WIDTH: …………………………………………………………. 8 in COLUMN END PLATE THICKNESS: ………………………………………. 0.752 in RAFTER END PLATE THICKNESS: .………………………………………. 0.732 in
BOLT DATA: BOLT DIAMETER: …………………………………………………………… 3/4 in BOLT TYPE: …………………………………………………………………... A490 BOLT PRETENSION: ………………………………………………………… 14 kips
COLUMN DATA: (MEASURED) OUTSIDE FLANGE WIDTH: …………………………………………………. 8 in OUTSIDE FLANGE THICKNESS: …………………………………………… 0.504 in INSIDE FLANGE WIDTH: …………………………………………………….. 8 in INSIDE FLANGE THICKNESS: ………………………………………………. 0.750 in WEB DEPTH AT BASE(PERP. TO OS FLANGE): ………………………….. 29.062 in WEB DEPTH AT REENTRANT CORNER(PERP. TO OS FLANGE): ……… 35.938 in WEB THICKNESS: ……………………………………………………………. 0.247 in
RAFTER DATA: (MEASURED) OUTSIDE FLANGE WIDTH: …………………………………………………. 8 in OUTSIDE FLANGE THICKNESS: ……………………………………………. 0.497 in INSIDE FLANGE WIDTH: …………………………………………………….. 8 in INSIDE FLANGE THICKNESS: ………………………………………………. 0.750 in WEB DEPTH AT BASE(PERP. TO OS FLANGE): …………………………... 24.938 in WEB DEPTH AT REENTRANT CORNER(PERP. TO OS FLANGE): ……… 35.625 in WEB THICKNESS: …………………………………………………………….. 0.247 in
EXPERIMENTAL: MAXIMUM LOAD: …………………………………………………………... 77.48 kips FAILURE LOCATION: Column Web at Reentrant Corner FAILURE MODE: Web Buckling
DISCUSSION:
• At approximately 57 kips, the rafter lateral brace at the reentrant corner failed. Specimen unloaded for repair and reloaded.

120
PROJECT: American Buildings Company TEST NAME: ABC-MH-1-2 (knee test 7) TEST DATE: February 12, 2007 PURPOSE: Negative Bending Moment Test for Web Buckling w/o Stiffeners
DISCUSSION: (CONTINUED)
• Displacement control begun at 75.3 kips and 2.29 inches chord deflection.
• At 75.7 kips and 2.31 inches chord deflection, yield lines became apparent in the web at the outside flange and end plate and web buckling was also visibly apparent.
• At 75.1 kips and 2.46 inches chord deflection, lateral torsional buckling occurred in rafter between braced points.
Figure G-1 MH-1-2 Rafter Lateral Torsional Buckling

121
MH 1-2 Applied Load vs Chord Deflection
0
10
20
30
40
50
60
70
80
90
0 0.25 0.5 0.75 1 1.25 1.5 1.75 2 2.25 2.5 2.75
Chord Deflection(in)
App
lied
Load
(kip
s)
Theoretical Chord DeflectionMeasured Chord Deflection
Figure G-2
MH 1-2 Bolt Strain vs Applied Load
0
500
1000
1500
2000
2500
3000
3500
4000
4500
-10 0 10 20 30 40 50 60 70 80 90
Applied Load (kips)
Bol
t Stra
in (m
icro
stra
in)
Bolt 1 Strain
Bolt 2 Strain
Bolt 3 Strain
Bolt 4 Strain
Bolt 5 Strain
Figure G-3

122
MH 1-2 Applied Load vs Rafter Web Displacement
0
10
20
30
40
50
60
70
80
90
-0.5 -0.4 -0.3 -0.2 -0.1 0 0.1 0.2 0.3 0.4 0.5
Web out of plane displacement (in)
Appl
ied
Load
(kip
s)
RPARPBRPC
Figure G-4
MH 1-2 Applied Load vs Column Web Displacement
0
10
20
30
40
50
60
70
80
90
-0.5 -0.4 -0.3 -0.2 -0.1 0 0.1 0.2 0.3 0.4 0.5
Web out of plane displacement (in)
App
lied
Load
(kip
s)
CPACPBCPC
Figure G-5

123
MH 1-2 Applied Load vs Rafter Inside Flange Strain
0
10
20
30
40
50
60
70
80
90
-2200 -2000 -1800 -1600 -1400 -1200 -1000 -800 -600 -400 -200 0 200
Microstrain
App
lied
Load
(kip
s)
RFC1RFC2RFD1RFD2
TensionCompression
Figure G-6
MH 1-2 Applied Load vs Rafter Outside Flange Strain
0
10
20
30
40
50
60
70
80
90
-200 0 200 400 600 800 1000 1200 1400 1600 1800 2000 2200
Microstrain
App
lied
Load
(kip
s)
RFA1RFA2RFB1RFB2
TensionCompression
Figure G-7

124
MH 1-2 Applied Load vs Column Inside Flange Strain
0
10
20
30
40
50
60
70
80
90
-2200 -2000 -1800 -1600 -1400 -1200 -1000 -800 -600 -400 -200 0 200
Microstrain
App
lied
Load
(kip
s)
CFC1CFC2CFD1CFD2
TensionCompression
Figure G-8
MH 1-2 Applied Load vs Column Outside Flange Strain
0
10
20
30
40
50
60
70
80
90
-200 0 200 400 600 800 1000 1200 1400 1600 1800 2000 2200
Microstrain
App
lied
Load
(kip
s)
CFA1CFA2CFB1CFB2
TensionCompression
Figure G-9

125
MH 1-2 Applied Load vs Rafter Web Transverse Normal Strain
0
10
20
30
40
50
60
70
80
90
-1400 -1200 -1000 -800 -600 -400 -200 0 200 400 600 800 1000 1200 1400
Microstrain
App
lied
Load
(kip
s)
RWARWBRWCRWXRWYRWZ
TensionCompression
Figure G-10
MH 1-2 Applied Load vs Column Web Transverse Normal Strain
0
10
20
30
40
50
60
70
80
90
-1400 -1200 -1000 -800 -600 -400 -200 0 200 400 600 800 1000 1200 1400
Microstrain
App
lied
Load
(kip
s)
CWACWBCWCCWXCWYCWZ
TensionCompression
Figure G-11

126
APPENDIX H. TEST LH-1-1 RESULTS

127
PROJECT: American Buildings Company TEST NAME: ABC-LH-1-1 (knee test 8) TEST DATE: March 30, 2006 PURPOSE: Negative Bending Moment Test for Web Buckling w/o Stiffeners
CONNECTION DESCRIPTION: NOMINAL YIELD STRESS: ………………………………………………… 55 ksi GAGE: ………………………………………………………………………….. 3 in END PLATE WIDTH: …………….…………………………………………… 12 in END PLATE THICKNESS (COLUMN): ……...……………………………… 0.767 in END PLATE THICKNESS (RAFTER): ………………………………………. 0.628 in
BOLT DATA: BOLT DIAMETER: …………………………………………………………… 3/4 in BOLT TYPE: …………………………………………………………………... A490 BOLT PRETENSION: ………………………………………………………… 14 kips
COLUMN DATA: (MEASURED) OUTSIDE FLANGE WIDTH: …………………………………………………. 12 in OUTSIDE FLANGE THICKNESS: …………………………………………… 0.637 in INSIDE FLANGE WIDTH: …………………………………………………….. 12 in INSIDE FLANGE THICKNESS: ………………………………………………. 0.618 in WEB DEPTH AT BASE(PERP. TO OS FLANGE): ………………………….. 27.69 in WEB DEPTH AT REENTRANT CORNER(PERP. TO OS FLANGE): ……… 59.5 in WEB THICKNESS: ……………………………………………………………. 0.308 in
RAFTER DATA: (MEASURED) OUTSIDE FLANGE WIDTH: …………………………………………………. 12 in OUTSIDE FLANGE THICKNESS: ……………………………………………. 0.627 in INSIDE FLANGE WIDTH: …………………………………………………….. 12 in INSIDE FLANGE THICKNESS: ………………………………………………. 0.622 in WEB DEPTH AT BASE(PERP. TO OS FLANGE): …………………………... 31.19 in WEB DEPTH AT REENTRANT CORNER(PERP. TO OS FLANGE): ……… 59.75 in WEB THICKNESS: …………………………………………………………….. 0.308 in
EXPERIMENTAL: MAXIMUM LOAD: …………………………………………………………... 162.3 kips FAILURE LOCATION: Rafter Web and Column Web at Reentrant Corner FAILURE MODE: Web Buckling
DISCUSSION:
• Unloaded at 56.14 kips, reloaded.
• At 148.9 kips, yielding was observed in rafter compression flange.
• Sudden load loss occurred at approximately 160 kips, and compression flange yielding and slight buckling observed in the rafter, adjacent to the end plate.

128
PROJECT: American Buildings Company TEST NAME: ABC-LH-1-1 (knee test 8) TEST DATE: March 30, 2006 PURPOSE: Negative Bending Moment Test for Web Buckling w/o Stiffeners
DISCUSSION: (CONTINUED)
• Displacement control begun at 156.3 kips and 1.98 inches chord deflection.
• Continued loss of load attributed to significant observed web buckling in the knee area, as well as continued rafter compression flange yielding and buckling.
Figure H-1 LH-1 Rafter Web Buckling

129
Figure H-2 LH-1 Specimen Dimensions
Figure H-3 LH-1 Lateral Brace Locations

130
L/6
L/3
L/3
L/6 CWX
CWY
CWZ
4'-8 13/16"
5'-3"
RWX
RWY
RWZCFA1
CFB1
CFA2
CFB2
CFC2
CFD2
CFC1
CFD1
RFB1RFA1
RFB2RFA2
RFD2RFC2
RFD1RFC1
RafterColumn
B
B
Section B-BA
A
Section A-A
12
3
12
3
Figure H-4 LH-1 Web and Flange Strain Gages As Viewed From the South

131
L/6
L/3
L/3
L/62" typ.
Rafter Column
12
3
12
3
CPA
CPB
CPC
RPA
RPB
RPC
RWA
RWB
RWC
CWC
CWB
CWA
5'-3"
4'-8 13/16"
Figure H-5 LH-1 Web Strain Gages and LVDT’s As Viewed from the North.
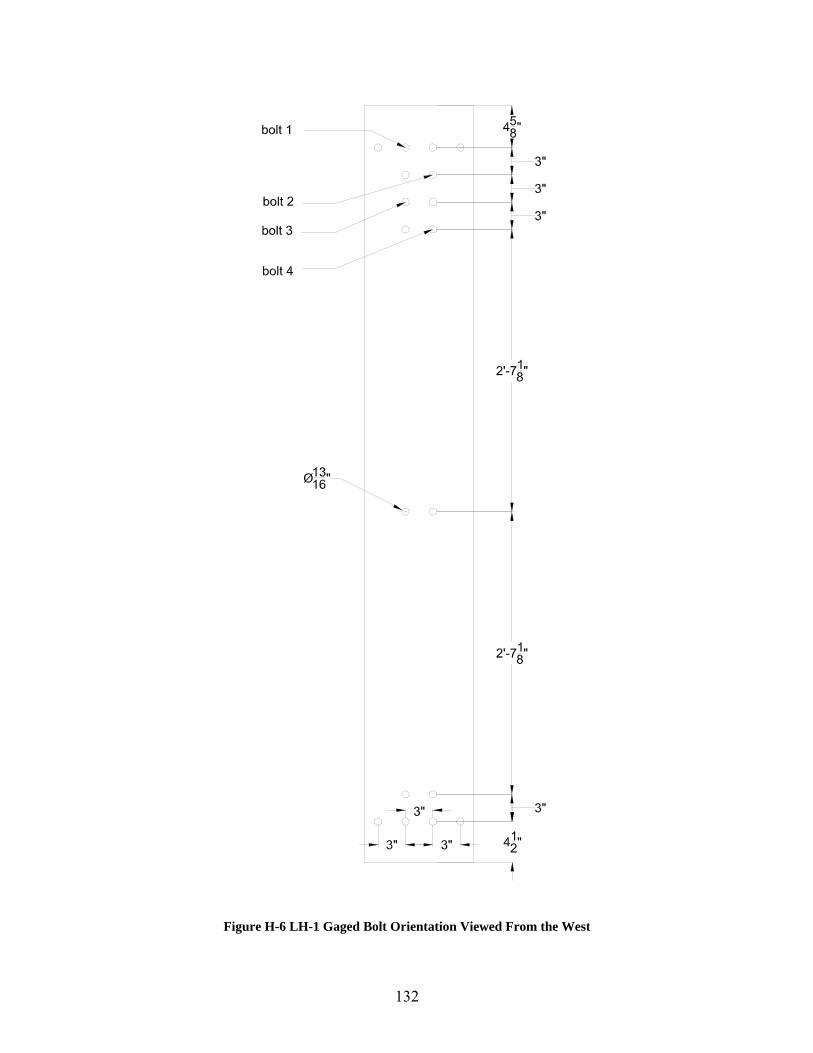
132
Figure H-6 LH-1 Gaged Bolt Orientation Viewed From the West

133
LH 1-1 Applied Load vs Chord Deflection
0
20
40
60
80
100
120
140
160
180
0 0.25 0.5 0.75 1 1.25 1.5 1.75 2 2.25 2.5
Chord Deflection(in)
App
lied
Load
(kip
s)
Theoretical Chord DeflectionMeasured Chord Deflection
Figure H-7
LH 1-1 Bolt Strain vs Applied Load
0
500
1000
1500
2000
2500
3000
3500
0 20 40 60 80 100 120 140 160 180
Applied Load (kips)
Bolt
Stra
in (m
icro
stra
in)
Bolt 1 StrainBolt 2 StrainBolt 3 StrainBolt 4 Strain
Figure H-8

134
LH 1-1 Applied Load vs Rafter Web Displacement
0
20
40
60
80
100
120
140
160
180
-1.2 -1 -0.8 -0.6 -0.4 -0.2 0 0.2 0.4 0.6 0.8 1 1.2
Web out of plane displacement (in)
Appl
ied
Load
(kip
s)
RPARPBRPC
Figure H-9
LH 1-1 Applied Load vs Column Web Displacement
0
20
40
60
80
100
120
140
160
180
-1.2 -1 -0.8 -0.6 -0.4 -0.2 0 0.2 0.4 0.6 0.8 1 1.2
Web out of plane displacement (in)
App
lied
Load
(kip
s)
CPACPBCPC
Figure H-10

135
LH 1-1 Applied Load vs Rafter Inside Flange Strain
0
20
40
60
80
100
120
140
160
180
-2200 -2000 -1800 -1600 -1400 -1200 -1000 -800 -600 -400 -200 0 200
Microstrain
App
lied
Load
(kip
s)
RFC1RFC2RFD1RFD2
TensionCompression
Figure H-11
LH 1-1 Applied Load vs Rafter Outside Flange Strain
0
20
40
60
80
100
120
140
160
180
-200 0 200 400 600 800 1000 1200 1400 1600 1800 2000 2200
Microstrain
App
lied
Load
(kip
s)
RFA1RFA2RFB1RFB2
TensionCompression
Figure H-12
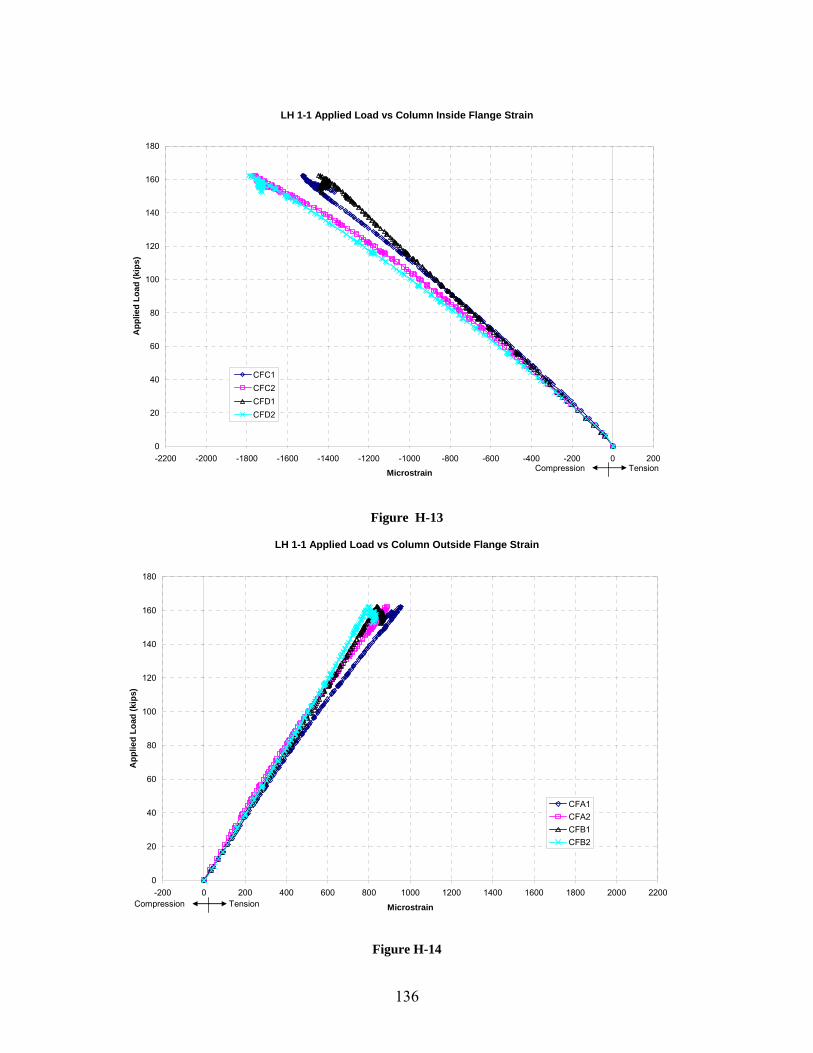
136
LH 1-1 Applied Load vs Column Inside Flange Strain
0
20
40
60
80
100
120
140
160
180
-2200 -2000 -1800 -1600 -1400 -1200 -1000 -800 -600 -400 -200 0 200
Microstrain
App
lied
Load
(kip
s)
CFC1CFC2CFD1CFD2
TensionCompression
Figure H-13
LH 1-1 Applied Load vs Column Outside Flange Strain
0
20
40
60
80
100
120
140
160
180
-200 0 200 400 600 800 1000 1200 1400 1600 1800 2000 2200
Microstrain
App
lied
Load
(kip
s)
CFA1CFA2CFB1CFB2
TensionCompression
Figure H-14

137
LH 1-1 Applied Load vs Rafter Web Transverse Normal Strain
0
20
40
60
80
100
120
140
160
180
-800 -600 -400 -200 0 200 400 600 800
Microstrain
App
lied
Load
(kip
s)
RWARWBRWCRWXRWYRWZ
TensionCompression
Figure H-15
LH 1-1 Applied Load vs Column Web Transverse Normal Strain
0
20
40
60
80
100
120
140
160
180
-800 -600 -400 -200 0 200 400 600 800
Microstrain
App
lied
Load
(kip
s)
CWACWBCWCCWXCWYCWZ
TensionCompression
Figure H-16

138
APPENDIX I. SAMPLE CALCULATIONS
I.1 Shear Forces and Strength Calculations
I.1.1 Introduction
Sample calculations for the determination of modified and unmodified shear forces, and
predicted shear strength are presented in this section. The provisions in Section 3.3.1 were used
to determine the shear forces, and the AISC provisions for shear (AISC 2005a), which are in
Section 3.3.2, were used determine shear strength. Only the column member of the LH-1
specimen is presented. The analysis cross-section measured dimensions are shown in Figure I-1
and the specimen geometry is shown in Figure I-2.
0.637
0.308
60.060
0.608
Figure I-1 Cross-Section B-B Measured Dimensions

139
A
A
B
B
A-A
B-B
B
B
A
A
A-A
B-B
Neu
tral A
xis
Axial Load
Shear
Load
Failu
re L
oad
θc
Shear Load
Axial
Loa
d
Failu
re L
oad
θrα
cα
r
d-col
d-raf
Figu
re I
-2 L
H-1
Spe
cim
en G
eom
etry

140
I.1.2 LH-1 Column Properties
h = 60.06 in. Fyw = 61 ksi tw = 0.308 in. Pfailure = 162.3 kips bf = 12.0 in. Ag = 33.89 in2
ttf = 0.637 in. Ix = 19429 in4
tcf = 0.618 in. Sxt = 637.84 in3
Dcol = 133.8 in. Sxc = 629.62 in3
θ = 44.69° Atf = 7.42 in2
α = 5.3° Acf = 7.64 in2
I.1.3 Determination of Shear Forces
The experimental loads at failure are determined at section B-B by statics and the
calculations reference the geometry given in Figure I-2.
Shear At Failure Axial Load at Failure Moment at Failure
)sin(θfailurePV = )cos(θfailurea PP = colfailure DPM =
)69.44sin(3.162 ⋅= kipsV )69.44cos(3.162 kipsPa = inkipsM 8.1333.162 ⋅=
kipsV 14.114= kipsPa 38.115= kipsinM ⋅= 74.715,21
The unmodified experimental shear force, Vexp,u is equal to the applied shear at failure.
kipsVV u 14.114exp, ==

141
The experimental modified shear force, Vexp,m is determined according to Equation (3-1),
Equation (3-2) and Equation (3-3), with reference to Figure I-3.
Ptf,n
PtfPtf,t
M
V
α
R
yf
Pcf,n
PcfPcf,t
yf
Pa Pa
α
Figure I-3 Flange Contributions to Modified Web Shear at Section B-B
Compression flange axial force, Pcf:
)cos(αxc
cf
g
cfacf S
MAAAP
P +=
)3.5cos(62.629
)64.7(74.715,2189.33
64.738.1153
2
2
2
ininkipsin
ininkipsPcf
⋅+
⋅=
kipskipsPcf 64.26401.26 +=
kipsPcf 65.290=
Tension Flange axial force, Ptf:
)cos(αxt
f
g
tfatf S
MAAAP
P +−=
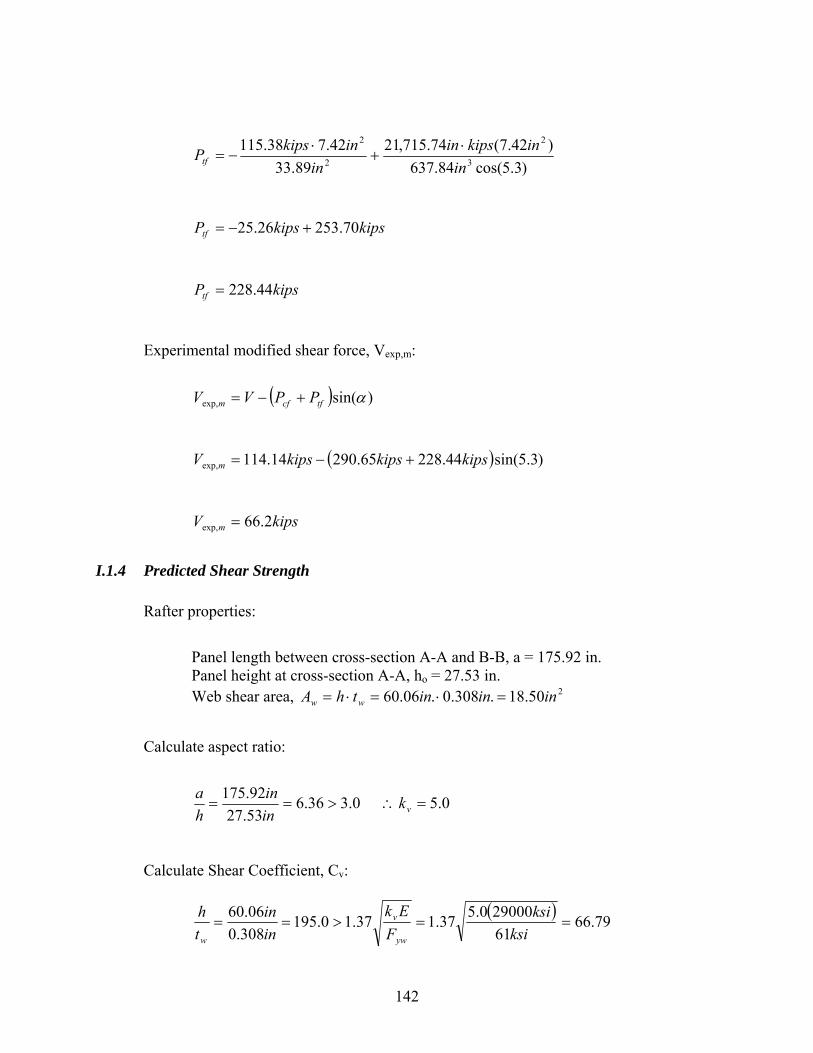
142
)3.5cos(84.637
)42.7(74.715,2189.33
42.738.1153
2
2
2
ininkipsin
ininkipsPtf
⋅+
⋅−=
kipskipsPtf 70.25326.25 +−= kipsPtf 44.228=
Experimental modified shear force, Vexp,m:
( ) )sin(exp, αtfcfm PPVV +−=
( ) )3.5sin(44.22865.29014.114exp, kipskipskipsV m +−=
kipsV m 2.66exp, =
I.1.4 Predicted Shear Strength
Rafter properties:
Panel length between cross-section A-A and B-B, a = 175.92 in. Panel height at cross-section A-A, ho = 27.53 in. Web shear area, 250.18.308.0.06.60 inininthA ww =⋅=⋅=
Calculate aspect ratio:
0.336.653.2792.175
>==inin
ha 0.5=∴ vk
Calculate Shear Coefficient, Cv:
( ) 79.6661290000.537.137.10.195
308.006.60
==>==ksi
ksiF
Ekinin
th
yw
v
w

143
( ) yw
vv Fth
EkC 2
51.1=
( )( ) ksi
ksiCv 610.1950.52900051.1
2=
094.0=vC
Calculate Shear Strength:
vwypred CAFV 6.0=
( )( ) 094.050.180.616.0 2inksiVpred = kipsVpred 91.63=

144
I.2 Shear Stress from Strain Data
I.2.1 Introduction
Sample calculations for the shear stresses determined from strain gage data are presented
in this section. The calculation of stress in the web at the gage location nearest the compression
flange of the column member from specimen SH-1 is presented. The strains were recorded at an
applied load of approximately 2.6 kips, which is 10% of the failure load of 26.48 kips. The
strain gages at this location are CWC and CWZ and their orientation is shown in Figure A-4 and
Figure A-5 of Appendix A. It can be seen in Figure A-4 that CWZ grid 1 is parallel to the
neutral axis, CWZ grid 3 is perpendicular to this axis, and CWZ grid 2 is oriented at a 45° angle
to grids 1 and 3. CWZ grid 1 will be used to represent the x-axis and CWZ grid 3 will be used to
represent the y-axis. This is orientation is shown in Figure I-4. The strain gage rosette CWC
was oriented on the opposite face of the web such that CWC grid 1 was collinear with CWZ grid
3, CWC grid 3 was collinear with CWZ grid 1 and CWC grid 2 was collinear with CWZ grid 2.
1
23
x
y
45°
Figure I-4 Strain gage rosette CWZ
These collinear grids were averaged and the orientation of gage CWZ was used as the
reference orientation for the following calculations. According to Beer et al. (2002), the shear
strain γxy which is the shear strain on the element of material under the gage, in a direction
perpendicular to the neutral axis is given by:
)(2 312 εεεγ +−=xy (I-1)

145
According to Hooke’s law the shear stress τxy is related to the shear strain by:
xyxy Gγτ = (I-2)
And the shear modulus, or modulus of rigidity is defined as:
)1(2 ν+=
EG (I-3)
I.2.2 Calculation of Shear Stress
The measured shear strains at locations CWZ and CWC were as follows, and the
averages are given as CWZ′, as described in Section I.2.1:
The shear strain on the strain gaged element of web is:
)(2 312 εεεγ +−=xy
)973.065.113()70.60(2 +−−=xyγ
Where: ε1 = Grid 1 strain ε2 = Grid 2 strain
ε3 = Grid 3 strain
Where: τxy = Shear stress G = Shear Modulus
γxy = Shear strain
Where: E = Young’s Modulus ν = Poisson’s ratio
CWZ (microstrain) CWC (microstrain) CWZ′ (microstrain)
ε1= -51.23 ε1= -1.93 ε1= -113.65
ε2= 145.88 ε2= -24.49 ε2= 60.70
ε3= 3.87 ε3= -176.06 ε3= 0.973

146
08.234=xyγ microstrain
The modulus of rigidity is:
)1(2 ν+
=EG
)3.01(2
29000+
=ksiG
ksiG 8.11153=
The shear stress on the cross-section at the location of the gages CWC and CWZ is:
xyxy Gγτ =
⎟⎟⎠
⎞⎜⎜⎝
⎛=
−
μεεμετ
610)08.234(8.11153 ksixy
ksixy 61.2=τ
It is assumed that this stress is constant over an area of web adjacent to these gages and
the shear force is the product of calculated stress and a third of the web area. The total shear
force in the web at the cross-section is the sum of this computed force and the forces similarly
obtained at the other two strain gage rosette locations. So, for shear stress location τ3:
33,htA ww =
357.21131.03,
ininAw =
23, 942.0 inAw =
3,3, wxyw AV τ=
)942.0(61.2 23, inksiVw =
kipsVw 46.23, =

147
Vita
Nicholas A. Redmond was born in Panama City, Florida in 1978 to Rockland and Sheryl.
He lived for several years in Chattanooga, Tennessee and Ekalaka, Montana, before settling in
Chapin, South Carolina. Upon graduating from Chapin High School in 1996 Nick moved to
Columbia, SC and worked for several years in construction related fields before starting his own
carpentry business in 2001. In 2003 he pursued a Bachelor of Science Degree in Civil
Engineering at the University of South Carolina, and graduated with honors in 2006. Nick
continued his studies at Virginia Tech that same year as a research assistant, in pursuit of a
Master of Science Degree in Civil Engineering. Upon graduation he plans to relocate to Seattle,
Washington and work as a structural design engineer with Magnusson Klemencic Associates.
Nick married Leah R. McComb in March of 2000, and they have a daughter, Lillian, age
4 and a son, Samuel, age 15 months.