Experiment Report: Spectrophotometric Analysis of Caffeine and Benzoic Acid in Soft Drink
12
UNIVERSITI TUNKU ABDUL RAHMAN FACULTY OF SCIENCE BACHELOR OF SCIENCE (HONS) CHEMISTRY UDEC1224 CHEMISTRY LABORATORY II Name: Nitthia A/P Meyappan ID no.: 1106171 Group members: Christine Choong Jing Wei, Ching Li Sin Experiment no.:11 Title of the Experiment: Spectrophotometric Analysis of Caffeine and Ben zoic Acid in Soft Drink Date of the experiment: 30 th July 2012 Lecturer: Dr. Neo Kian Eang
-
Upload
nitty-meya -
Category
Documents
-
view
1.179 -
download
45
Transcript of Experiment Report: Spectrophotometric Analysis of Caffeine and Benzoic Acid in Soft Drink

8/10/2019 Experiment Report: Spectrophotometric Analysis of Caffeine and Benzoic Acid in Soft Drink
http://slidepdf.com/reader/full/experiment-report-spectrophotometric-analysis-of-caffeine-and-benzoic-acid 1/12
UNIVERSITI TUNKU ABDUL RAHMAN
FACULTY OF SCIENCE
BACHELOR OF SCIENCE (HONS) CHEMISTRY
UDEC1224 CHEMISTRY LABORATORY II
Name: Nitthia A/P Meyappan
ID no.: 1106171
Group members: Christine Choong Jing Wei, Ching Li Sin
Experiment no.:11
Title of the Experiment: Spectrophotometric Analysis of Caffeine and Benzoic Acid in Soft
Drink
Date of the experiment: 30th
July 2012
Lecturer: Dr. Neo Kian Eang

8/10/2019 Experiment Report: Spectrophotometric Analysis of Caffeine and Benzoic Acid in Soft Drink
http://slidepdf.com/reader/full/experiment-report-spectrophotometric-analysis-of-caffeine-and-benzoic-acid 2/12

8/10/2019 Experiment Report: Spectrophotometric Analysis of Caffeine and Benzoic Acid in Soft Drink
http://slidepdf.com/reader/full/experiment-report-spectrophotometric-analysis-of-caffeine-and-benzoic-acid 3/12
Table 4: Concentration of Standard Benzoic acid and Absorbance under λ’= 229nm
Calculation 1:
From the Least-Squares Regression,
a = y-intercept of the graph
a =()
= -0.00524
b = slope of the graph
b = = 0.0912 mL/mg
y’ = bx + a
Equation of the graph: y’ = 0.0912 x - 0.00524
r =linear correlation coefficient
Solution Concentration, x (mg/mL) Absorbance under λ’=
229nm
Corrected absorbance, y
blank 0.0 0.051 0.00
A 2.00 0.217 0.166
B 4.00 0.408 0.357
C 6.00 0.606 0.555
D 8.00 0.776 0.725
E 10.00 0.953 0.902
Unknown 1 3.70 0.389 0.338
Unknown 2 6.75 0.664 0.613
Ʃx (mg/mL)
Ʃx (mg/mL) Ʃy
Ʃy Ʃxy (mg/mL) n
220 30.0 1.802259 2.705 19.91 6
8/10/2019 Experiment Report: Spectrophotometric Analysis of Caffeine and Benzoic Acid in Soft Drink
http://slidepdf.com/reader/full/experiment-report-spectrophotometric-analysis-of-caffeine-and-benzoic-acid 4/12
r =
√
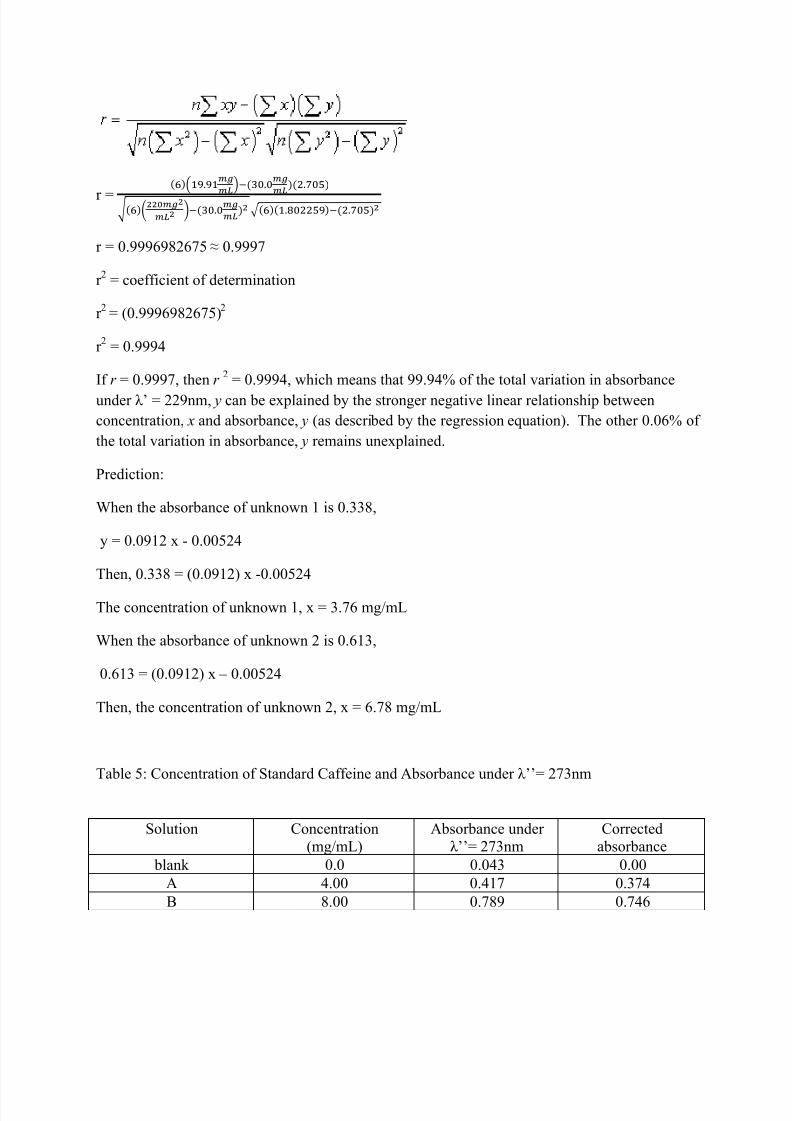
r = 0.9996982675 ≈ 0.9997
r 2 = coefficient of determination
r 2
= (0.9996982675)2
r 2 = 0.9994
If r = 0.9997, then r2 = 0.9994, which means that 99.94% of the total variation in absorbance
under λ’ = 229nm, y can be explained by the stronger negative linear relationship between
concentration, x and absorbance, y (as described by the regression equation). The other 0.06% of
the total variation in absorbance, y remains unexplained.
Prediction:
When the absorbance of unknown 1 is 0.338,
y = 0.0912 x - 0.00524
Then, 0.338 = (0.0912) x -0.00524
The concentration of unknown 1, x = 3.76 mg/mL
When the absorbance of unknown 2 is 0.613,
0.613 = (0.0912) x – 0.00524
Then, the concentration of unknown 2, x = 6.78 mg/mL
Table 5: Concentration of Standard Caffeine and Absorbance under λ’’= 273nm
Solution Concentration(mg/mL)
Absorbance underλ’’= 273nm
Correctedabsorbance
blank 0.0 0.043 0.00
A 4.00 0.417 0.374
B 8.00 0.789 0.746

8/10/2019 Experiment Report: Spectrophotometric Analysis of Caffeine and Benzoic Acid in Soft Drink
http://slidepdf.com/reader/full/experiment-report-spectrophotometric-analysis-of-caffeine-and-benzoic-acid 5/12
Calculation 2:
From the Least-Squares Regression,
a = y-intercept of the graph
a =()
= 0.0118
b = slope of the graph
b =
= 0.0821 mL/mg
y’ = bx + a
Equation of the graph: y’ = 0.0821 x + 0.0118
r =linear correlation coefficient
r =
√
r = 0.9798556039 ≈ 0.9798
r 2 = coefficient of determination
C 12.00 0.989 0.946
D 16.00 1.160 1.117
E 20.00 1.855 1.812
Unknown 1 2.60 0.254 0.211
Unknown 2 5.00 0.457 0.414
Ʃx (mg/mL)
Ʃx (mg/mL) Ʃy
Ʃy Ʃxy (mg/mL) n
880 60.0 6.122341 4.995 72.928 6

8/10/2019 Experiment Report: Spectrophotometric Analysis of Caffeine and Benzoic Acid in Soft Drink
http://slidepdf.com/reader/full/experiment-report-spectrophotometric-analysis-of-caffeine-and-benzoic-acid 6/12
r 2
= (0.9798556039)2
r 2 = 0.9601170044 ≈ 0.9601
If r = 0.9798, then r2 = 0.9601, which means that 96.01% of the total variation in absorbance
under λ’’= 2.73nm, y can be explained by the strong positive linear relationship betweenconcentration, x and absorbance, y. The other 3.99% of the total variation in absorbance, y
remains unexplained.
Prediction:
When the absorbance of unknown 1 is 0.211,
y = 0.0821x + 0.0118
Then, 0.211 = 0.0821 (concentration, mg/mL) + 0.0118
The concentration of unknown 1, x = 2.43 mg/mL
When the absorbance of unknown 2 is 0.414,
0.414 = 0.0821 (concentration, mg/mL) + 0.0118
Then, the concentration of unknown 2, x = 4.90 mg/mL
Discussion:
This experiment was conducted to obtain the absorbance of the caffeine and benzoic acidin soft drinks through spectrophotometric analysis. Spectrophotometry is one of the mostcommonly used instrumental methods in all of science. While the term is used to refer to any
technique that uses light to measure the concentration of a chemical, most spectrophotometric
measurements rely on the absorption of light. The basic components of an absorptionspectrophotometer are shown in Fig. 1. Light passes into a monochromator where one small
band of wavelengths is selected. This monochromatic light then passes through the sample
compartment and on to a detector where it is converted into an electrical current, i, proportionalto the intensity of the light. Intensity is more correctly referred to as irradiance, P .

8/10/2019 Experiment Report: Spectrophotometric Analysis of Caffeine and Benzoic Acid in Soft Drink
http://slidepdf.com/reader/full/experiment-report-spectrophotometric-analysis-of-caffeine-and-benzoic-acid 7/12
Some of the light passing through the sample may be absorbed by the molecules in the
sample. When a molecule absorbs a photon of light, the energy of the molecule increases. If the
light is from the ultraviolet (UV) or visible portions of the electromagnetic spectrum, thisabsorption results in electrons being promoted to the higher energy levels. We say the electron
has gone from the lowest energy state (the ground state) to a higher energy state (an excited
state). This process is illustrated in Fig. 2 below. A photon of light can be absorbed when it hasenergy (hν) exactly equal to the energy difference between the ground state ( E 1) and the excitedstate ( E 2).
Figure 2: The absorption process
To begin an absorbance measurement we must first measure the initial irradiance by
placing solvent in the sample holder. This is called the blank measurement. The solvent is then
replaced with the real sample, and the irradiance is measured. Finally, we see the relationship
between absorbance and concentration, c, by the familiar Beer’s law equation:
Where c is the concentration of the analyte in the sample, ε is the molar absorptivity of the
analyte, and b is the sample cell path length shown in Fig. 1. You should recognize that Beer’s
law predicts a linear relationship between absorbance and concentration. Experimentally, this is
shown by generating a Beer’s law plot of A (y-axis) vs. c (x-axis).
Figure 3: Beer's Law plot
In this experiment, the amount of caffeine and benzoic acid in a soft drink sample were
determined. Caffeine is a stimulant, and benzoic acid is commonly used as a food preservative
since it inhibits the growth of mold, yeast, and bacteria. The UV spectra of caffeine and benzoic
acid overlap, although there are wavelength regions where one component dominates. It’s
important that we don’t use a diet drink since aspartame absorbs in the same region of the
UV. Also, Mountain Dew generally doesn’t work well since a colorant absorbance band extends
too far into the UV. Each compound exhibits absorbance at two different wavelengths: 229 nm
and 273 nm.

8/10/2019 Experiment Report: Spectrophotometric Analysis of Caffeine and Benzoic Acid in Soft Drink
http://slidepdf.com/reader/full/experiment-report-spectrophotometric-analysis-of-caffeine-and-benzoic-acid 8/12
From the calculation 1, b = 0.0912 indicates that every addition of concentration of
standard benzoic acid in mg/mL leads to an additional 0.0912 of absorbance under 229nm of
wavelength. If the slope were positive, we would expect absorbance to increase as the
concentration of the sample increases. Thus, for every additional concentration, absorbance will
increase by an average of 0.0912 units. Besides that, a = -0.00524which means that at zero
concentration, the absorbance is estimated to be -0.00524. In most applications, the intercept has
no useful practical interpretation. It just serves to fix the line. The dependent variable (in this
case Absorbance under λ’=229nm) is plotted on the vertical axis and the explanatory (or
independent or regressor) variable (in this case concentration in mg/mL) is plotted on the
horizontal axis.
From the graph 1, it is seen that there is a clear positive relationship between the
variables, since as concentration of the standard benzoic acid increases, absorbance increases.
The relationship can also be seen to be linear since the plotted points scatter around a straight
line. The equation of the regression line for predicting absorbance can be found to be y’ = 0.0912
x - 0.00524 or absorbance = 0.0912(concentration, mg/mL) - 0.00524. Here R 2 = 99.94%. This
indicates that 99.94% of the variation in the dependent variable, absorbance at λ’=229nm, is
explained by the explanatory variable, concentration of the sample in mg/mL. In other words,
99.94% of the variation in the absorbance at λ’=229nm on these 6 samples can be attributed to
the fact that different concentrations of the samples were made. This leaves only 0.06% to be
explained by other factors (including pure chance effects). This suggests that the model gives a
good fit to the data. From the line of best fit, the predicted the concentration of unknown 1is 3.70
mg/mL when the absorbance of the unknown 1 at the wavelength is 0.338. When the absorbance
of the unknown 2 is 0.613, then the concentration of the unknown 2 is 6.75mg/mL .The
predictions are examples of interpolation and so should be acceptable since R
2
is high. However,when substitute the absorbance of the unknown 1 and unknown 2 in the regression equation,
absorbance = 0.0912(concentration, mg/mL) - 0.00524, we got the concentration of the unknown
1 and unknown 2 are 3.76 mg/mL and 6.78 mg/mL respectively.
From the calculation 2, b = 0.0821 indicates that every addition of concentration of
standard benzoic acid in mg/mL leads to an additional 0.0821 of absorbance under 273 nm of
wavelength. If the slope were positive, we would expect absorbance to increase as the
concentration of sample increases. Thus, for every additional concentration of the standard
benzoic acid, absorbance will rise by an average of 0.0821 units. Besides that, a = 0.0118 which
means that at zero concentration, the absorbance is estimated to be 0.0118. Again, this is not particularly useful. The dependent variable, Absorbance under λ’=273 nm is plotted on the
vertical axis and the independent variable, concentration in mg/mL is plotted on the horizontal
axis.
It is clear from the diagram that there is a positive relationship between the variables. As
the concentration of the sample increases so does the absorbance. It is also reasonably clear that
there is a linear trend in the data. The equation of the regression line for predicting absorbance

8/10/2019 Experiment Report: Spectrophotometric Analysis of Caffeine and Benzoic Acid in Soft Drink
http://slidepdf.com/reader/full/experiment-report-spectrophotometric-analysis-of-caffeine-and-benzoic-acid 9/12
can be found to be y’ = 0.0821 x + 0.0118 or y’ = 0.0821 (concentration, mg/mL) + 0.0118.
From the further calculation, r 2 is determined again. The r
2 shows that 96.01% of the variation in
the absorbance at λ’=273nm is explained by the concentration of the sample in mg/mL. The
other 3.99% of the total variation in absorbance, y remains unexplained. This advocates that the
model gives a good fit to the data. From the line of best fit, the predicted the concentration of
unknown 1is 2.60 mg/mL when the absorbance of the unknown 1 at the 273 nm of wavelength is
0.211. When the absorbance of the unknown 2 is 0.414, then the concentration of the unknown 2
is 5.00 mg/mL. Since R 2 is high, the predictions are acceptable. The concentrations of the
unknown 1 and 2 are 2.43 mg/mL and 4.90 mg/mL by calculating with the regression equation,
absorbance = 0.0821 (concentration, mg/mL) + 0.0118.
There can be many sources of error with a spectroscopic method. Electronic noise in the
detector is the most common. Mistakes with the cuvette can also be important- improper
positioning, touching with fingers or allowing dust on the cell all could introduce errors.
Safety precautions:
1. Some that must be treated with care in order to avoid damage to yourself or your
surroundings.
2. None of these chemicals should be ingested. Safety goggles, lab coat and gloves are
required at all times.
3. There are also no toxic chemicals present, so disposal directly down the drain is
allowable and safe.
4.
Use the hydrochloric acid solutions in the FUME HOOD. If any acid or base solutionsplashes on your skin, wash it off immediately with copious amounts of running water.
Conclusion:
The spectrophotometry is used to obtain the absorbance of the caffeine and benzoic acid in soft
drink, Mountain Dew. From the graph (i), the concentration of the benzoic acid in the unknown 1
and 2 are 3.70mg/mL and 6.75mg/mL correspondingly at the 229nm of wavelength. The
concentrations of the caffeine in the unknown 1 and 2 are 2.60mg/mL and 5.00mg/mL
respectively at the 273nm of wavelength from the graph (ii).
___________________ 23rd
July 2012.
(NITTHIA A/P MEYAPPAN)

8/10/2019 Experiment Report: Spectrophotometric Analysis of Caffeine and Benzoic Acid in Soft Drink
http://slidepdf.com/reader/full/experiment-report-spectrophotometric-analysis-of-caffeine-and-benzoic-acid 10/12
Reference:
1. Amit Choudhury (2010). Correlation and Regression. Retrieved 12 Aug. 2012 from
Experiment Resources: http://www.experiment-resources.com/correlation-and-regression.html
2. Harris, D.C. Quantitative Chemical Analysis, 7th ed.; W.H. Freeman & Co.; New York:
2007; pp 228-237 and 303-318.
3. “Laboratory Experiments for Chemistry; A Basic Introduction’, 4th edition, by Wynn
and Joppich, Wadsworth Inc., 1987.
4. McDevitt, V. L.; Rodriguez, A.; Williams, K. R. Analysis of Soft Drinks: UV
Spectrophotometry, Liquid Chromatography, and Capillary Electrophoresis. J. Chem. Ed.
1998, 75, 625-629. pdf

8/10/2019 Experiment Report: Spectrophotometric Analysis of Caffeine and Benzoic Acid in Soft Drink
http://slidepdf.com/reader/full/experiment-report-spectrophotometric-analysis-of-caffeine-and-benzoic-acid 11/12
Graph 1: Absorbance under λ’= 229nm
y' = 0.0912x - 0.00524
R² = 0.9994
-0.2
0
0.2
0.4
0.6
0.8
1
0 2 4 6 8 10 12
A b s o r b a n c e u n d e r λ ' = 2 2 9 n m
Concentration (mg/mL)
A graph of Absorbance against Concentration

8/10/2019 Experiment Report: Spectrophotometric Analysis of Caffeine and Benzoic Acid in Soft Drink
http://slidepdf.com/reader/full/experiment-report-spectrophotometric-analysis-of-caffeine-and-benzoic-acid 12/12
Graph 2: Absorbance under λ’’= 273nm
y = 0.0821x + 0.0118
R² = 0.9601
0
0.2
0.4
0.6
0.8
1
1.2
1.4
1.6
1.8
2
0 5 10 15 20 25
A b s o r b a n c e u n d e r λ ' ' = 2 7 3 n m
Concentration (mg/mL)
A graph of Absorbance against Concentration