Experiences on software quality analysis Elisabetta Ronchieri INFN CNAF.
49
Experiences on software quality analysis Elisabetta Ronchieri INFN CNAF
-
Upload
raymond-george -
Category
Documents
-
view
219 -
download
2
Transcript of Experiences on software quality analysis Elisabetta Ronchieri INFN CNAF.

Experiences on software quality analysis
Elisabetta RonchieriINFN CNAF

E. Ronchieri, CERN 2
Outlines
• Introduction• Key Terms• Metrics Classification• Software Metrics Tools• Experiences• Future works
12/8/2014

INTRODUCTION

E. Ronchieri, CERN 4
Background• INFN CNAF has contributed to the development of software
solutions for distributed computing. • It has been participating in several European projects, such as
DataGrid , EGEE, EMI and EGI.• These projects have produced software:
– for achieving the challenges of high energy physics communities in first place
– and later for supplying other communities' needs. • Up to now INFN CNAF has developed experiences in three main
Grid areas with a set of software products: – storage with StoRM;– authorization with VOMS;– computing with WMS and WNoDeS.
12/8/2014

E. Ronchieri, CERN 5
What observed
• Aware of the experience acquired at INFN CNAF• Software researchers tend to neglect the quality
of their products for different reasons: – developers feel pressed for addressing the requests
of their users within scheduled budget and short time;
– developers distrust data from existing quality tools since they provide partial analysis of their software;
– developers perceive quality as an exceedingly time-consuming task that affects their productivity.
12/8/2014

E. Ronchieri, CERN 6
As a consequence
• This has led to:– spend effort maintaining software once released;– develop software without exploiting solutions for
managing defects effectively.• This is unfortunate!
12/8/2014

E. Ronchieri, CERN 7
What is achievable with quality
• Enhancing quality allows:– reducing defects– saving costs– decreasing delivery delays.
• Furthermore, the software quality models and metrics represent the mainstream to reach high reliability by balancing effort and results.
12/8/2014

Why should we measure the quality of software used by researchers?
As direct advantages• To identify and predict the main code
portions that tend to be error-prone, hard to understand and difficult to maintain
• To get an idea about the complexity of the code that penalize software maintainability
• To reduce the time spent and cost estimation in the fixing and debugging phases
As indirect consequences• To allow researchers to make more analysis
and possibly new scientific discovers• To simplify the reproducibility phase of
analysis
Determine and Improve Quality
Reduce Effort to Maintain Code
Make More Analysis and Research
Simplify Reproducibility of Outcome Over Time
12/8/2014 E. Ronchieri, CERN 8

KEY TERMS

E. Ronchieri, CERN 10
Quality
• There are many views of software quality.• The IEEE defines quality as the degree to which a system,
component, or process meets specified requirements or customer or user needs or expectations [1].
• The International Organization for Standardization (ISO) [2] defines quality as the degree to which a set of inherent characteristics fulfils requirements .
• Other experts define quality based on:– conformance to requirements;– fitness for use.
• However, a good definition must let us measure quality meaningfully.
12/8/2014
E. Ronchieri, CERN 11
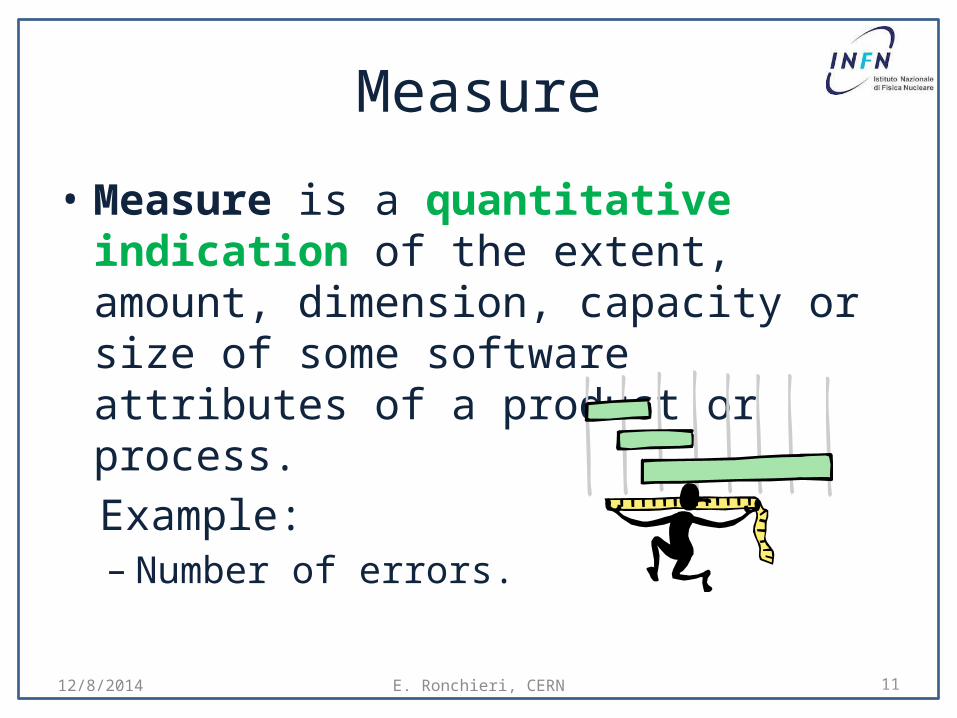
Measure
• Measure is a quantitative indication of the extent, amount, dimension, capacity or size of some software attributes of a product or process.Example:– Number of errors.
12/8/2014

E. Ronchieri, CERN 12
Measure
• Measure allows us to:– know if our techniques really improve quality of
our software;– know how process quality affects product;– determine the quality of the current product or
process;– predict qualities of a product or process.
12/8/2014

E. Ronchieri, CERN 13
Metric
• Metric is a quantitative measure of the degree to which a system, component or process possesses a given software attribute related to quality factors (also told characteristics) [1].Examples:– Reduce maintenance needs;– Number of errors found per
person hours.
12/8/2014

E. Ronchieri, CERN 14
Metric
• Metric allows us to:– estimate the cost and schedule of future projects;– evaluate the productivity impacts of new tools
and techniques;– establish productivity trends over time;– improve software quality;– anticipate and reduce future maintenance needs.
12/8/2014

E. Ronchieri, CERN 15
Metric
• Examples:– Defect rates– Error rates
• These can be measured:– by an individual;– in a module;– during development;
• Errors should be categorized by origin, type and cost.
12/8/2014

E. Ronchieri, CERN 16
Quality Standards
• Software quality standards describe software quality models categorizing software quality into a set of characteristics.
• About software attributes, ISO/IEC 9126 (replaced by ISO/IEC 25010:2011) standard defines 6 software factors, each subdivided in sub-characteristics (or criteria) [3].
• About software guidelines, CMMI (Capability Maturity Model Integration) [4] specification provides, amongst the others, the best practices definition.
12/8/2014

E. Ronchieri, CERN 17
ISO/IEC 9126
12/8/2014
• The quality factors include:– Functionality, Reliability, Usability, Efficiency, Maintainability,
Portability
Maintainability is considered!

E. Ronchieri, CERN 18
Maintainability details
Sub-characteristics Description
Analyzability Characterizes the ability to identify the root cause of a failure within the software.
Changeability Characterizes the amount of effort to change a system.
StabilityCharacterizes the sensitivity to change of a given system that is the negative impact that may be caused by system changes.
Testability Characterizes the effort needed to verify (test) a system change.
12/8/2014
• Maintainability is impacted by code readability or complexity as well as modularization.
• Anything that helps with identifying the cause of a fault and then fixing the fault is the concern of maintainability.

E. Ronchieri, CERN 19
CMMI
• The best practices include:– Software structure involves the initial stages of an
applications development. • It can be of various types such as control flow, data flow, file and
code conventions.
– Configuration management involves knowing and managing the state of all artifacts, but also releasing distinct version of the system.
– Code construction represents the only accurate description of the software.
– Testing is an integral part of the software development.– Deployment is the final stage of an application release.
12/8/2014

METRIC AND MEASURE

E. Ronchieri, CERN 21
Metric Classification
1. Product metrics (are considered)– Explicit results of software development activities.– Deliverables, documentation, by products.– Include size, complexity and performance.
2. Process metrics– Activities related to production of software.– Used to improve development and maintenance.
3. Project metrics– Inputs into the software development activities.– Hardware, knowledge, people.– Include cost, schedule and productivity.
12/8/2014

E. Ronchieri, CERN 22
Product Metrics Details
• Assesses the state of the project• Track potential risks• Uncover problem areas• Adjust workflow or tasks• Evaluate teams ability to control quality
12/8/2014

What have we mainly measured?A subset of Product
Metrics
Program Size (PS)
Code Distribution
(CD)
Control Flow Complexity
(CFC)
Object-Orientation
(OO)
Lines of Code (LOC);
Blank Lines of Code (BLOC);
Lines of Code with Comments (CLOC).
Number of Files (#Files);
Number of Classes (#Classes).
Modified McCabe Cyclomatic Complexity (MMCC):
add 1 for each occurrences of for,if,while,switch, &&, ||, ?.
Coupling Between Object (CBO);
Depth of Inheritance Tree (DIT);
Number of Children (NOC);
Weighted Methods per Class (WMC).
12/8/2014 E. Ronchieri, CERN 23

More Details about OO Metrics• CBO determines the number of other classes to
which a class is coupled.– A value of 0 indicates that a class has no relationship
to any other class in the system, and therefore should not be part of the system.
• DIT determines the position of a class in the inheritance hierarchy.– A class situated too deeply in the inheritance tree
will be relatively complex to develop, test and maintain.
From Chidamber and Kemerer.12/8/2014 E. Ronchieri, CERN 24

More Details about OO Metrics• NOC determines the number of direct children a
class has.– The number of children gives an idea of the potential
influence a class has on the design. – If a class has a large number of children, it may
require more testing of the methods in that class.• WMC measures the static complexity of all the
methods defined in the class.– It is a predictor of how much time and effort is
required to develop and maintain the class
From Chidamber and Kemerer.12/8/2014 E. Ronchieri, CERN 25

More Details about McCabe• MCC determines the number of linearly
independent paths that comprises the program.– It indicates the minimum number of paths that one
should test.– Complexity ranges are defined:
• Low 1 – 5 (easy to maintain);• Low 6 – 10 (well structured)• Moderate 11 – 20 (slightly complex block)• More than moderate 21 – 30 (more complex block)• High 31 – 40 (alarming)• Very high > 41 (error-prone)
• From McCabe12/8/2014 E. Ronchieri, CERN 26

E. Ronchieri, CERN 27
SOFTWARE METRICS TOOLS
12/8/2014

RPSD 2014, Knoxville, Tennessee, Sep 14-18, 2014
Something About Software Metrics ToolsTool Version Metrics
PS CD CFC OO
CCCC (C and C++ Code Counter)
3.1.4 LOCCLOC
#Classes Modified MCC CBODITNOCWMC
CLOC (Count Lines of Code)
1.60 LOCBLOCCLOC
#Files
Metrics 0.2.6 LOCCLOC
#Files, Modified MCC
Pmccabe 2.6 TLOC #Files#Classes
Traditional MCCModified MCC
SLOCCount (Source Lines of Code Count)
2.26 LOC #Files
Understand 3.1.728 LOCBLOCCLOC
#Files #Classes
Traditional MCCModified MCC
CBODITNOCWMC

Encountered Difficulties
• There exist different interpretations of the same metric definition– Therefore different implementations of the same metric.
• Typically, these tools provide a subset of metrics with respect to the software factor or criteria they address.
• They use different names to refer to the same metric.
12/8/2014 E. Ronchieri, CERN 29
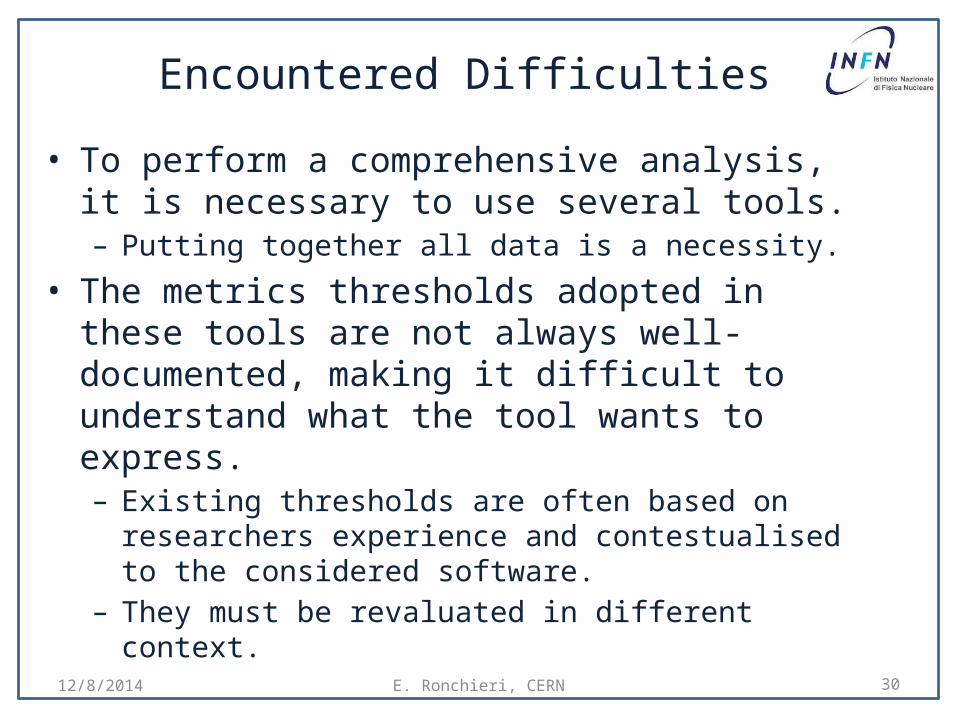
Encountered Difficulties
• To perform a comprehensive analysis, it is necessary to use several tools.– Putting together all data is a necessity.
• The metrics thresholds adopted in these tools are not always well-documented, making it difficult to understand what the tool wants to express.– Existing thresholds are often based on researchers experience
and contestualised to the considered software. – They must be revaluated in different context.
12/8/2014 E. Ronchieri, CERN 30

EXPERIENCES

E. Ronchieri, CERN 32
Topic 1
• To detect fault-prone and non fault-prone software components by using a new quality model [5]:– that connects software best practices with a set of
metrics (both static and dynamic metrics)– that uses predictive techniques, such as discriminant
analysis and regression, to determine to what extent which metrics can influence a software component.
The model was validated by using EMI products, such as CREAM, StoRM, VOMS, WNoDeS and WMS.12/8/2014

E. Ronchieri, CERN 33
Related Works 1
• Significant work done in the field of quality prediction.
• As there are several papers, we introduce a categorization to better summarize the main contributions.
12/8/2014
• Two approches followed so far:1. Standard statistical techniques used
in earlier studies;2. Machine learning techniques used in
later ones.

E. Ronchieri, CERN 34
Related Works 2
• First approach.
12/8/2014
OO Metrics
Logistic regression
Is one software component fault-prone?
Discriminant Analysis

E. Ronchieri, CERN 35
Related Works 3
• Second approach
12/8/2014
OO Metrics
Is the software component fault-prone?
Artificial Neural Network
Decision Trees
Support Vector Machine

E. Ronchieri, CERN 36
Related Work 4• In both the two approaches the validation phase was unsatisfactory:
difficult to find a techique valid for every software project.
• With respect to the past:– Our model takes as input not only metrics but also the mathematical
modelization of best practices as described in the Capability Maturity Model Integration (CMMI) specification
– Our model takes as input all the metrics not just the OO ones.
12/8/2014

E. Ronchieri, CERN 37
Metrics Measured
12/8/2014
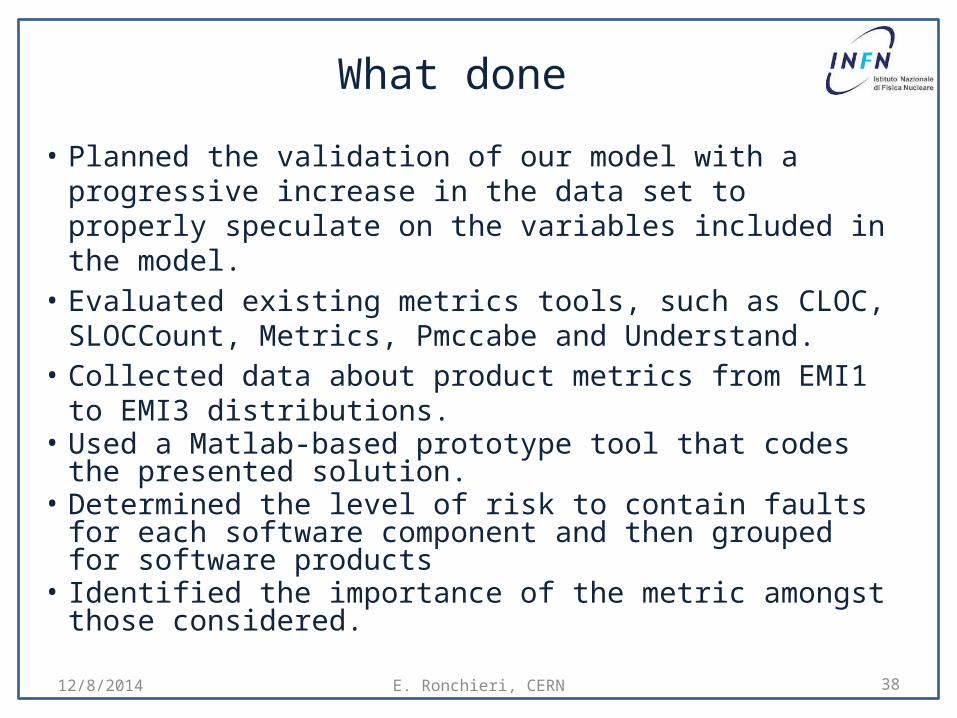
What done
• Planned the validation of our model with a progressive increase in the data set to properly speculate on the variables included in the model.
• Evaluated existing metrics tools, such as CLOC, SLOCCount, Metrics, Pmccabe and Understand.
• Collected data about product metrics from EMI1 to EMI3 distributions.
• Used a Matlab-based prototype tool that codes the presented solution.
• Determined the level of risk to contain faults for each software component and then grouped for software products
• Identified the importance of the metric amongst those considered.
12/8/2014 E. Ronchieri, CERN 38

39
Metrics with their risk level value
• p shows the position in the hierarchy.
• The higher the value of MNRL for a metric, the higher is its importance.
12/8/2014 E. Ronchieri, CERN

E. Ronchieri, CERN 40
Software products with their risk level value
• p shows the position in the hierarchy.• The higher the value of CNRL, the most is the
risk of faults in the product.
12/8/2014

E. Ronchieri, CERN 41
Topic II
• To guarantee the maintainability of software used in scientific researches where critical use cases are addressed, as in the context of shielding and radiation protection [6]:– By using existing standards that identifies the software
characteristics;– By exploiting a set of product metrics that allows to
understand the code state.
12/8/2014
E. Ronchieri, CERN 42
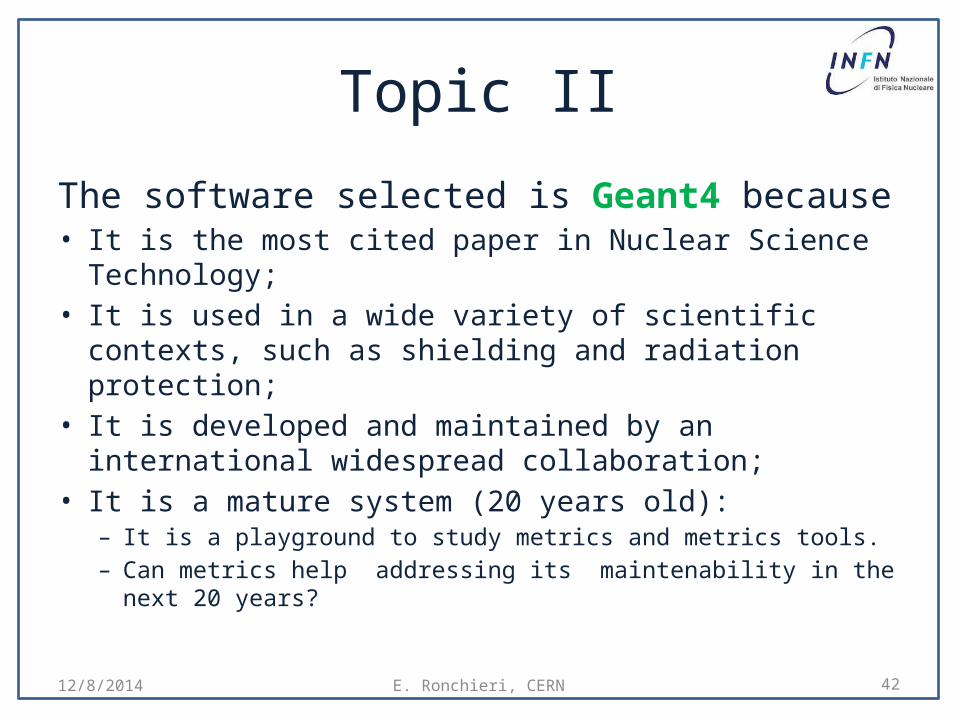
Topic II
The software selected is Geant4 because• It is the most cited paper in Nuclear Science Technology;• It is used in a wide variety of scientific contexts, such as
shielding and radiation protection;• It is developed and maintained by an international
widespread collaboration;• It is a mature system (20 years old):
– It is a playground to study metrics and metrics tools.– Can metrics help addressing its maintenability in the next 20
years?
12/8/2014

Preliminary scope of the analysis
• Initial appraisals concern a subset of Geant4 packages with a key role in scientific applications.
• ‘geometry’ makes it possible to describe a geometrical structure and propagate particles through it.
• ‘processes’ handles physics interactions.• Also methodology is under study.
12/8/2014 E. Ronchieri, CERN 43

What done
• Evaluated existing metrics tools, such as CLOC, SLOCCount, Metrics, Pmccabe and Understand.
• Collected data about product metrics from 0.0 to 10.0 releases.
• Started analysing data from 6.1 to 10 releases for geometry and processes sub-packages.
• Developed tools to extract data from the files produced by the software metrics tools.
• As initial assessment, the quantitative data about the selected metrics provide information about software characteristics and trends:– By automated data acquisition;– Through objective estimates.
12/8/2014 E. Ronchieri, CERN 44

FUTURE PLANS
E. Ronchieri, CERN 46
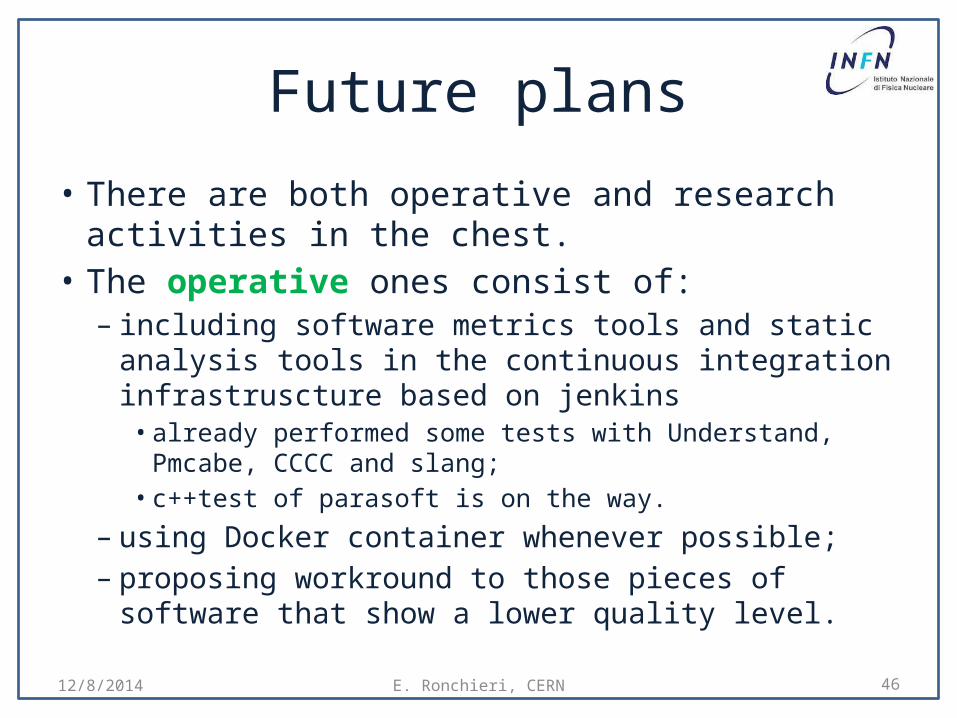
Future plans
• There are both operative and research activities in the chest.
• The operative ones consist of:– including software metrics tools and static analysis tools in
the continuous integration infrastruscture based on jenkins• already performed some tests with Understand, Pmcabe, CCCC
and slang;• c++test of parasoft is on the way.
– using Docker container whenever possible;– proposing workround to those pieces of software that
show a lower quality level.
12/8/2014

E. Ronchieri, CERN 47
Future plans
• There are both operative and research activities in the chest.
• The research ones consist of:– doing statistical analysis for inference;– evaluating the applicability of existing quality thresholds;– adding further OO metrics that contribute to evaluate
maintenability software factor;– determining which metrics are most effective at identifying risks;– correlating interactions between software quality and functional
quality;– analysing and employing further statistical techniques in
addition to discriminant analysis and regression.
12/8/2014

E. Ronchieri, CERN 48
References[1] IEEE 610.12 IEEE Standard Glossary of Software Engineering Terminology.[2] ISO 9000, www.iso.org/iso/iso\_9000.[3] ISO/IEC 25010:2011, http://www.iso.org/iso/catalogue_detail.htm?csnumber=35733[4] S. R. Chidamber, C. F. Kremerer, Towards a Metrics suite for object oriented design, In Proceedings of OOPSLA ‘91, July, 1991, pp. 197-221.[5] Elisabetta Ronchieri, Marco Canaparo, Davide Salomoni, A software quality model by using discriminant analysis predictive technique, under review at Transaction of the SDPS: Journal of Integrated Design and Process Science.[6] Elisabetta Ronchieri, Maria Grazia Pia, Francesco Giacomini, Software Quality Metrics for Geant4: An initial assessment, In the Proceedings of ANS RPSD 2014, Knoxville, TN, September 14 – 18, 2014.
12/8/2014
E. Ronchieri, CERN 49
Questions and suggestions are welcome
12/8/2014